epidemiological study design chakrarat pittayawonganon, md, mph fetp, bureau of epidemiology...
TRANSCRIPT

Epidemiological study Epidemiological study
designdesign
Chakrarat Pittayawonganon, MD, MPH
FETP, Bureau of Epidemiology
Department of Disease Control
Ministry of Public Health

ทบทวนจากบทเรียนก�อนทบทวนจากบทเรียนก�อน• Counts (จ�านวนน�บ), Rate (อ�ตรีา), Ratio (อ�ตรีาส่�วน),
Proportion (ส่�ดส่�วน)– ตั�วตั��งกั�บตั�วหาร กัารเป็�น subset กั�น?– Rates: Instantaneous rate (km/hr), Average rate (30
deaths/year)
• Prevalence (ความชุ�ก), Incidence (อ�บ�ต�การีณ์�)– มี�ระยะเวลาเป็�นตั�วกั�าหนด เป็�นจุ�ดเวลา / ช่�วงเวลา– เป็�นผู้��ป็�วยที่� มี�อย��เด"มี กั�บเพิ่" มีขึ้%�นใหมี�– IncidenceIncidence: new cases of a disease that develop over a period
of time– PrevalencePrevalence: existing cases of a disease at a particular point in
time or over a period of time
• Cumulative incidence = Individual Risk (Incidence/Ndisease-free at start of F/U) – Problems: dynamic cohort and die from diseases other than
disease of interest (competing risk)
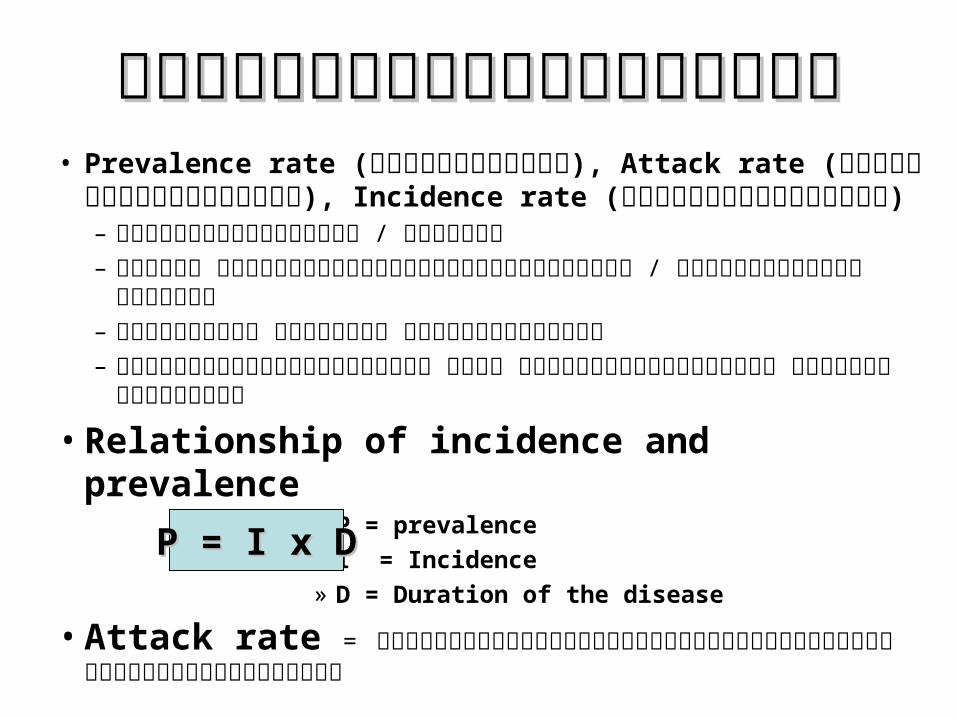
ทบทวนจากบทเรียนก�อนทบทวนจากบทเรียนก�อน• Prevalence rate (อ�ตรีาความชุ�ก), Attack rate
(อ�ตรีาป่�วยเฉียบพลั�น), Incidence rate (อ�ตรีาอ�บ�ต�การีณ์� )– กั�าหนดตัามีช่�วงเวลา / จุ�ดเวลา– ตั�วหาร จุ�านวนป็ระช่ากัรเสี่� ยงที่� เกั"ดโรค / จุ�านวนป็ระช่ากัรที่��งหมีด– ความีสี่�าค�ญ กัารแป็ลผู้ล และกัารน�าไป็ใช่�– ว"ธี�กัารให�ได�มีาตั�างกั�น เช่�น จุากักัารเฝ้/าระว�งโรค หร0อจุากักัารสี่�ารวจุ
•Relationship of incidence and prevalence
» P = prevalence» I = Incidence» D = Duration of the disease
•Attack rate = ร�อยละอ�ตัราป็�วยขึ้องป็ระช่ากัรที่� มี�ภู�มี"ไวร�บเกั"ดป็�วยเป็�นโรค
P = I x DP = I x D

QuizQuiz
Which ones of these “rates” are Which ones of these “rates” are true rates?true rates?
____ Attack rate____ Incidence rate____ Five-year survival rate____ Infant mortality rate____ Prevalence rate____ Age-specific incidence rate____ Case-fatality rate____ Cause-specific mortality rate
Confusing Confusing
Risk and rateRisk and rate

QuizQuizWhich ones of these “rates” are true rates?Which ones of these “rates” are true rates?__F__ Attack rate Proportion: Case/Total N__T__ Incidence rate (IR; 0 – infinity)__F__ Five-year survival rate Proportion: Survives/Total
Cases__F__ Infant mortality rate Proportion: Fatal
infants/Total infants__F__ Prevalence rate Proportion: Fatal infants/Total
infants__T__ Age-specific incidence rate __F__ Case-fatality rate Proportion: Fatal
cases/Total Cases__T__ Cause-specific mortality rate (Deaths caused by a specific disease per 1,000 population
per year)
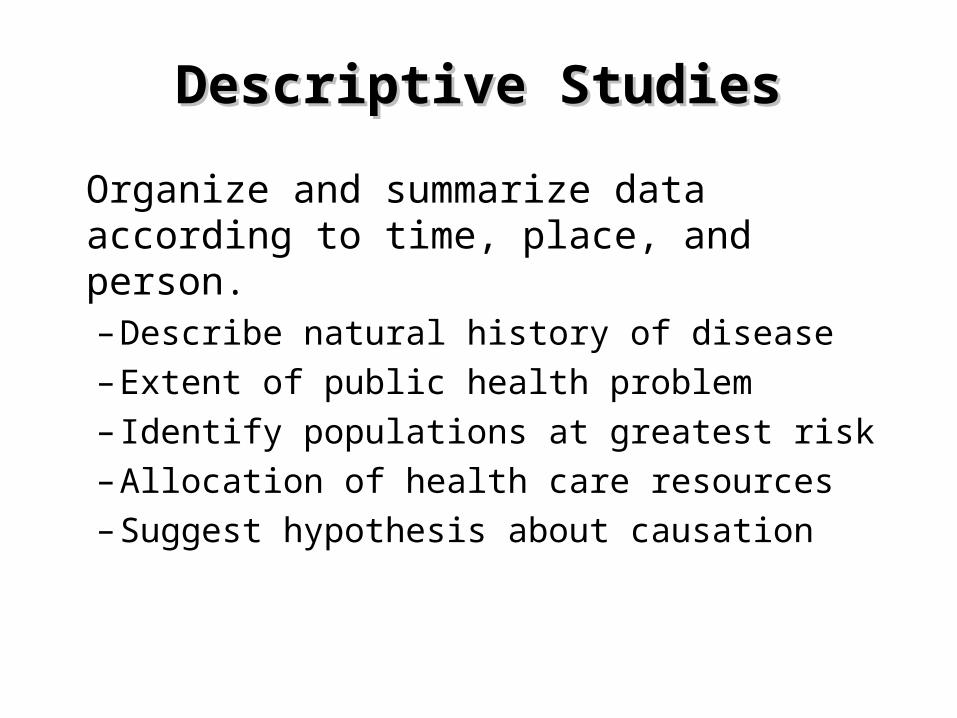
Descriptive StudiesDescriptive Studies
Organize and summarize data according to time, place, and person. – Describe natural history of disease– Extent of public health problem– Identify populations at greatest risk– Allocation of health care resources– Suggest hypothesis about causation

Study Question
Study Design
Results
Answer
TRUTH ERROR• Random • Systematic
• Selection bias• Information bias
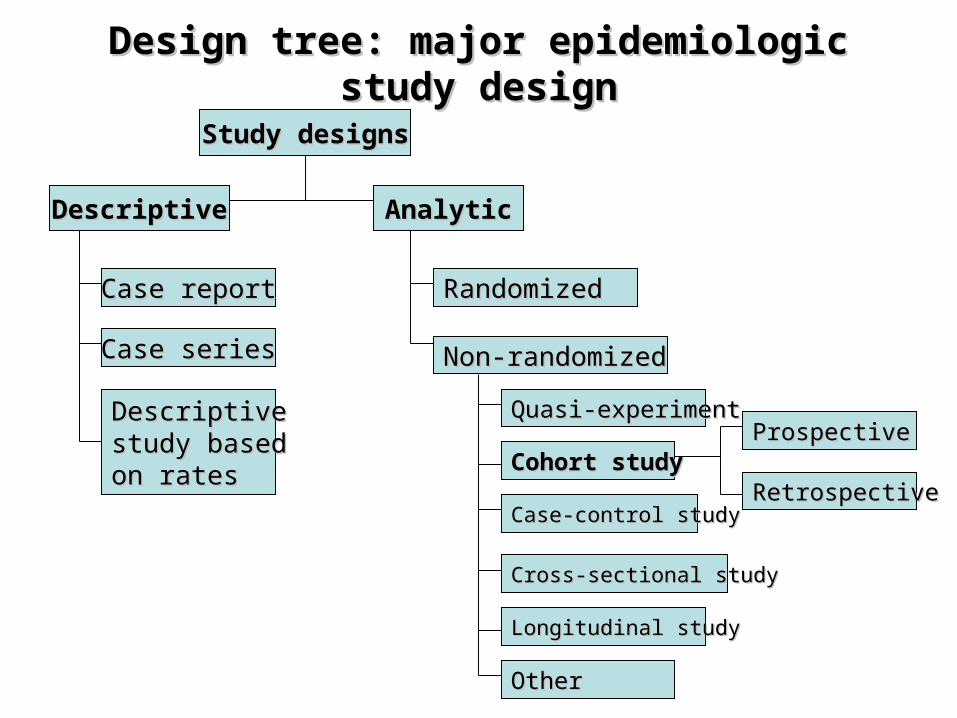
Design tree: major epidemiologic study designDesign tree: major epidemiologic study design
Study designsStudy designs
Case reportCase report
AnalyticAnalyticDescriptiveDescriptive
Longitudinal studyLongitudinal study
Cross-sectional studyCross-sectional study
Case-control studyCase-control study
Cohort studyCohort study
Quasi-experimentQuasi-experiment
Non-randomizedNon-randomized
RandomizedRandomized
Descriptive Descriptive study based study based on rateson rates
Case seriesCase series
RetrospectiveRetrospective
ProspectiveProspective
OtherOther

What is a cohort?What is a cohort?
• Cohort: Latin word for one of the 10 divisions
of a Roman legion
• A group of individuals
– Sharing same experience
– Followed-up for a specified period of time
• Examples
– Birth cohort
– Occupational cohort chemical plant workers
– A Rapid Response Team
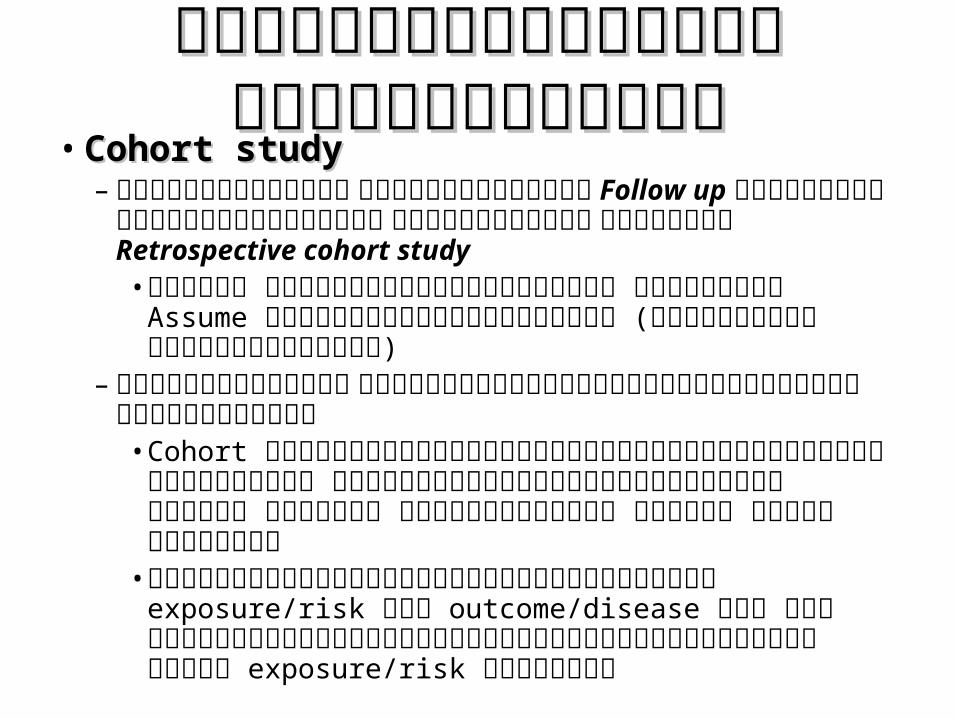
การีป่รีะย�กต�ใชุ"ในส่ถานการีณ์�การีป่รีะย�กต�ใชุ"ในส่ถานการีณ์�จรี�งจรี�ง
• Cohort studyCohort study– จ�าเป่%นหรี'อไม� ต"องเป่%นลั�กษณ์ะ Follow up มส่�*งท*
บอกว�าย�งไม�ป่�วย แลัะต�อมาป่�วย โดยเฉีพาะ Retrospective cohort study •ยกัเว�น กัรณี�สี่อบสี่วนโรคตั"ดเช่0�อ ที่� สี่ามีารถ Assume
ว�ามี�สี่ถานะกั�อนป็�วยได� (แตักัตั�างตัามีโรงเร�ยนที่� สี่อน)– จ�าเป่%นหรี'อไม� ท*ต"องศึ.กษาในป่รีะชุากรีท�/งหมดในพ'/นท*
น�/นๆ •Cohort ที่� ใช่�ในกัารศึ%กัษาสี่ามีารถศึ%กัษาจุากัป็ระช่ากัร
บางสี่�วนได� ที่��งน��ควรมี�ขึ้อบเขึ้ตัที่� ช่�ดเจุน ได�แกั� กัล��มีคน ห�องช่��นเร�ยน ตั%กัพิ่�กั เฉพิ่าะช่�วงเวลา
•สี่ามีารถว"เคราะห7ความีสี่�มีพิ่�นธี7ระหว�าง exposure/risk กั�บ outcome/disease ได� โดยแบ�งกัล��มีขึ้องผู้��ที่� ย�งไมี�ป็�วยตัามีกัารมี�หร0อไมี�มี� exposure/risk ที่� ศึ%กัษา
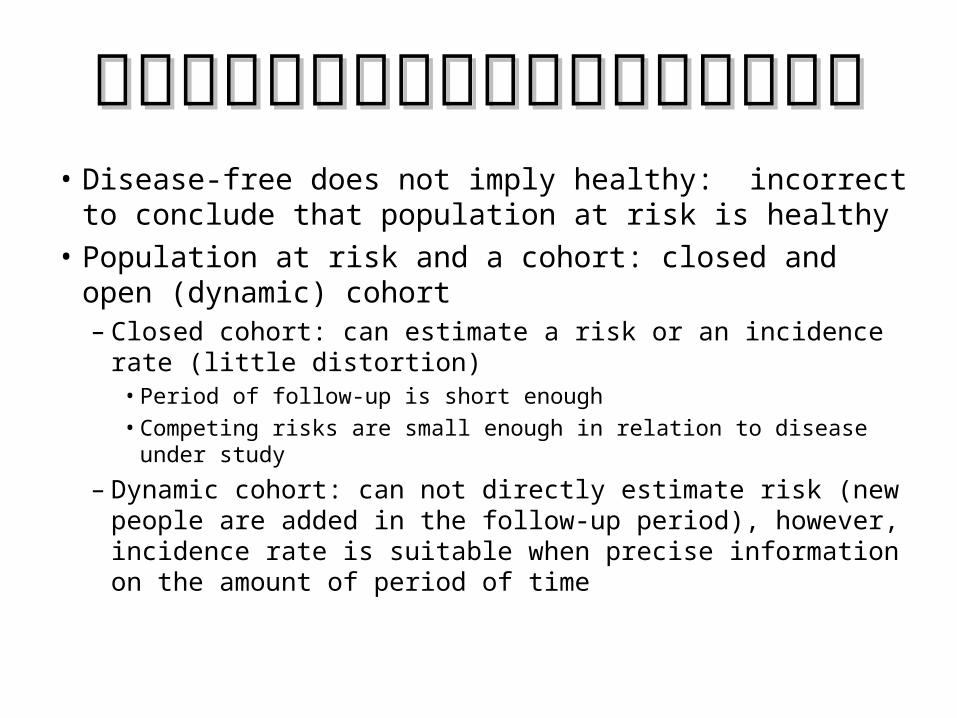
เกรี1ดเลั1กเกรี1ดน"อยเกรี1ดเลั1กเกรี1ดน"อย• Disease-free does not imply healthy: incorrect to
conclude that population at risk is healthy• Population at risk and a cohort: closed and open
(dynamic) cohort– Closed cohort: can estimate a risk or an incidence rate
(little distortion)• Period of follow-up is short enough• Competing risks are small enough in relation to disease
under study
– Dynamic cohort: can not directly estimate risk (new people are added in the follow-up period), however, incidence rate is suitable when precise information on the amount of period of time

Cohort studies
Intuitive approach to studying disease incidence and risk factors:
1. Start with a population at risk2. Measure characteristics at baseline3. Follow-up the population over time with
a) surveillance or b) re-examination
4. Compare event rates in people with and without characteristics of interest

Cohort studies
Can be large or smallCan be long or shortCan be simple or elaborateCan be local or multinationalFor rare outcomes need many people
and/or lengthy follow-upMay have to decide what characteristics
to measure long in advance

Exposureoccurrence
Study starts Diseaseoccurrence
Growth-nutrition studies, Folic acid and NT defects
Prospective Cohort Study
Time
+
-
+ -ill
exp+
-exp
Prospective assessment of exposure and disease
Selection of population

Prospective cohort study
Chernobyl, Industrial accidents, Flood victims
+
-
+ -ill
exp+
-exp
Diseaseoccurrence
Study startsExposureoccurrence
Prospective assessment of disease
Selection based on exposure

Food borne outbreaks, closed environment outbreaks (school, prisons, etc)
Retrospective cohort study Transversal studies
Study takes place
Diseaseoccurrence
Exposureoccurrence
Retrospective assessment of exposure and disease
Selection based on population
+
-
+ -ill
exp
Real TimeReal TimeNow
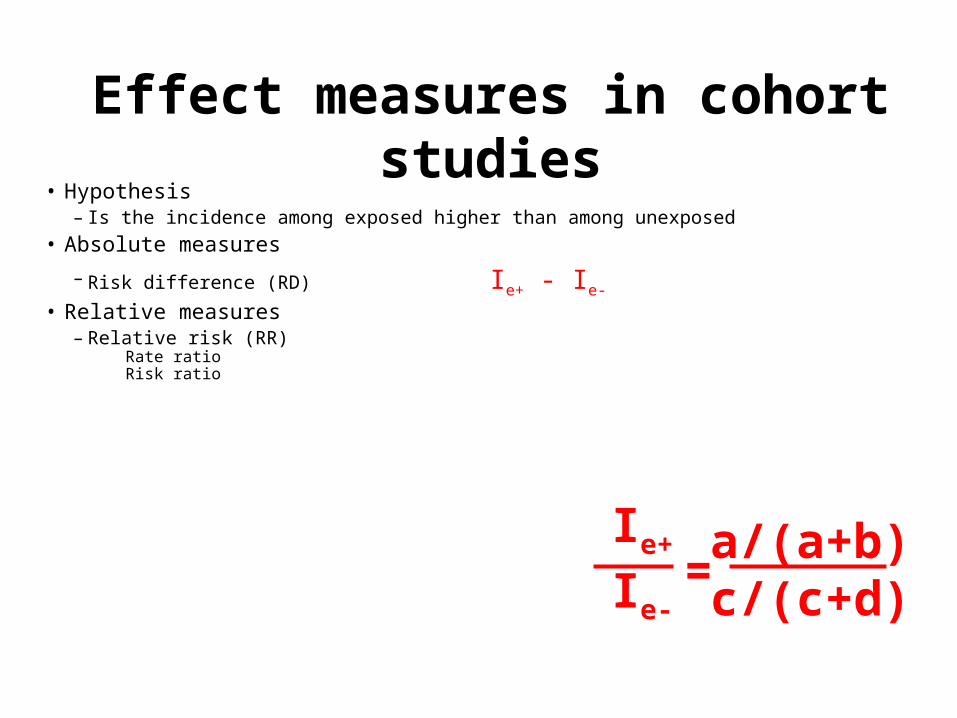
• Hypothesis– Is the incidence among exposed higher than among unexposed
• Absolute measures
– Risk difference (RD) Ie+ - Ie-
• Relative measures– Relative risk (RR)
Rate ratio Risk ratio
Effect measures in cohort studies
Ie+
Ie-
a/(a+b)c/(c+d)
=

Does HIV infection increase the risk of developing TB among a population of drug users?
Source: Selwyn et al., New York, 1989
Presentation of cohort data Presentation of cohort data Population at riskPopulation at risk
Drug users (f/u 2 years)
8
HIV -
TB Cases
HIV + 215
289 1
Incidence(%)

Does HIV infection increase the risk of developing TB among a population of drug users?
Source: Selwyn et al., New York, 1989
Presentation of cohort data Presentation of cohort data Population at riskPopulation at risk
Drug users (f/u 2 years)
8
HIV -
TB Cases
HIV + 215
289 1
Incidence(%)
3.7 (8/215)
0.3 (1/289)
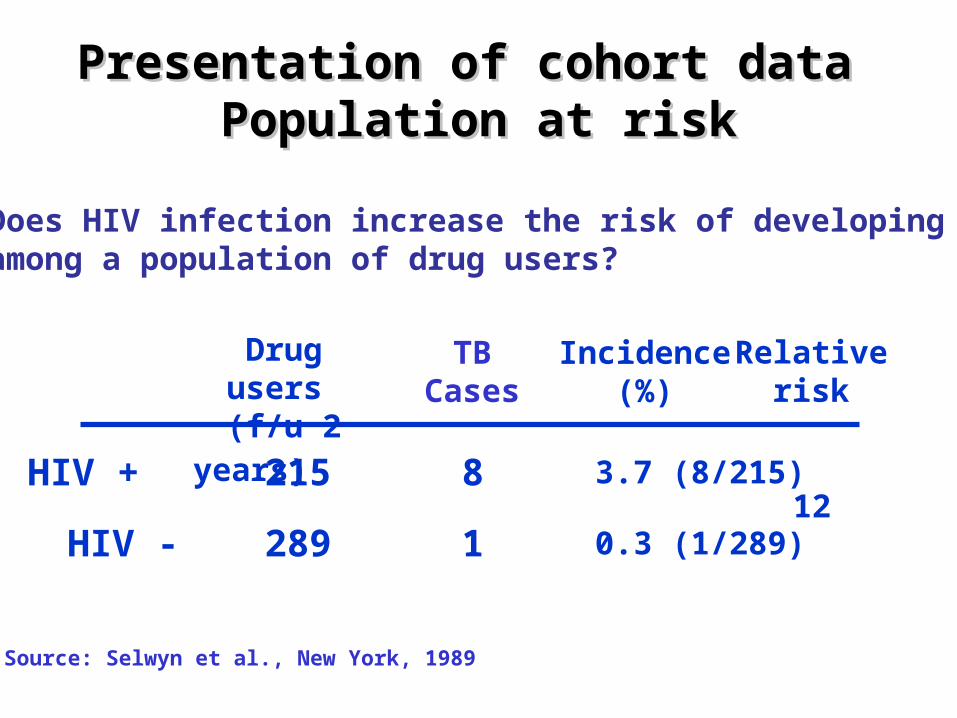
Does HIV infection increase the risk of developing TB among a population of drug users?
Source: Selwyn et al., New York, 1989
Presentation of cohort data Presentation of cohort data Population at riskPopulation at risk
Drug users (f/u 2 years)
8
HIV -
TB Cases
HIV + 215
289 1
Incidence(%)
Relativerisk
3.7 (8/215)12
0.3 (1/289)

Advantages and disadvantages of Advantages and disadvantages of cohortcohort studiesstudies
• Advantages
– Can measure incidence
and risks
– Good for rare exposures
– Clear temporal
relationship between
exposure and outcome
– Less subject to selection
bias
• Disadvantages
– Requires a large sample size
– Latency period
– Lost to follow-up
– Ethical considerations
– Resource intensive
• High cost
• Timely
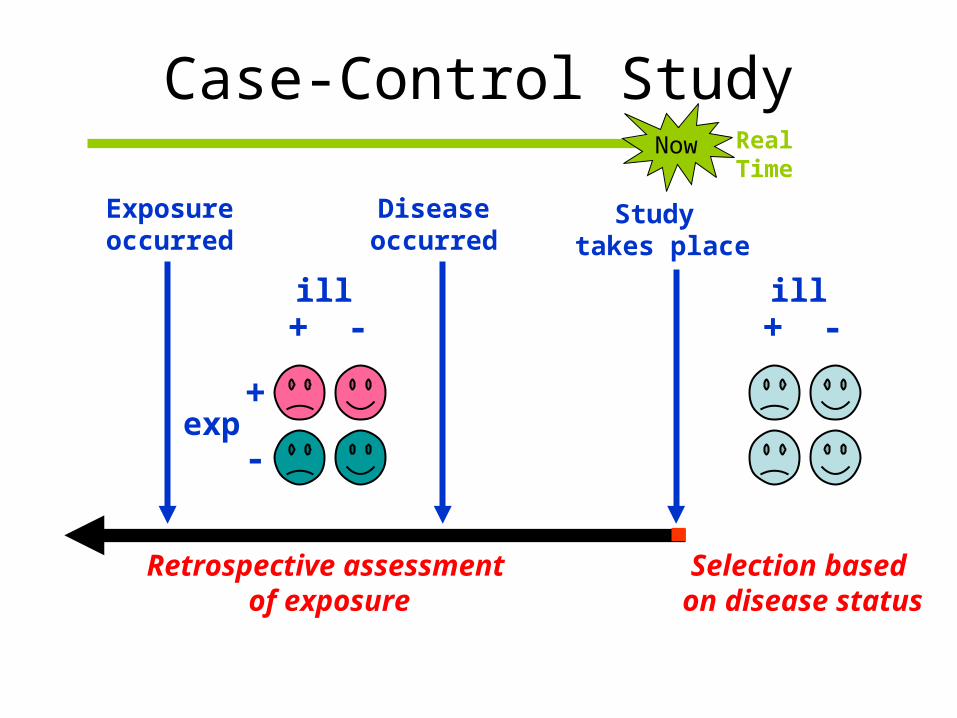
Retrospective assessment of exposure
+ -ill
Diseaseoccurred
Exposureoccurred
Study takes place
+
-
+ -ill
exp
Case-Control Study
Selection based on disease status
Real TimeNow
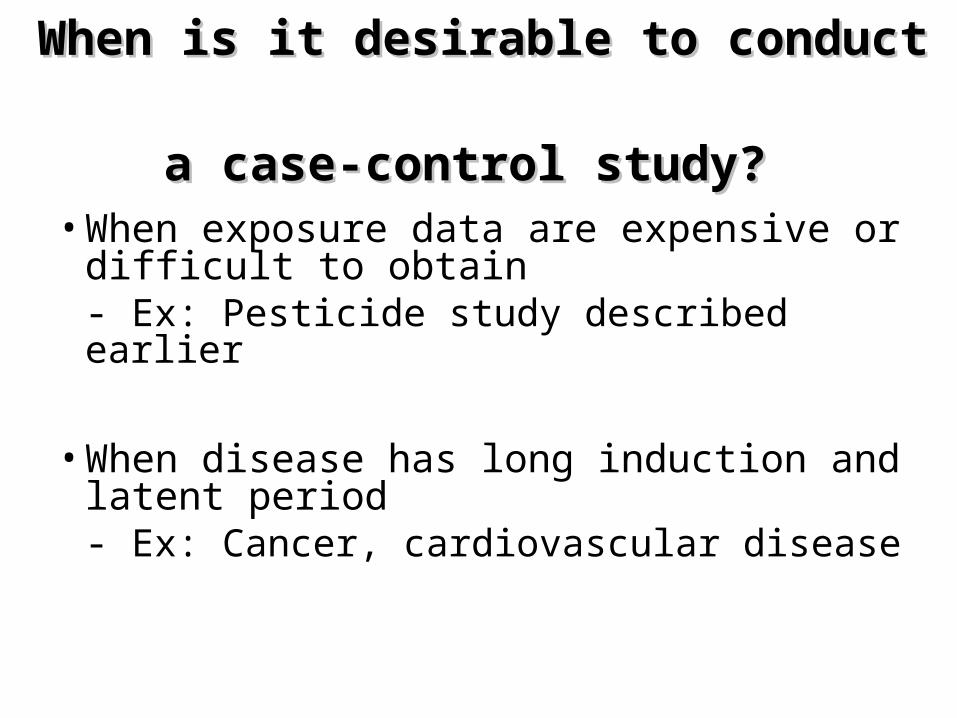
When is it desirable to conduct When is it desirable to conduct
a case-control study?a case-control study?
•When exposure data are expensive or difficult to obtain- Ex: Pesticide study described earlier
•When disease has long induction and latent period- Ex: Cancer, cardiovascular disease

When is it desirable to conduct When is it desirable to conduct
a case-control study?a case-control study?
• When the disease is rare– Ex: Studying risk factors for birth defects
• When little is known about the disease– Ex. Early studies of AIDS, H5
• When underlying population is dynamic– Ex: Studying breast cancer on Cape Cod

Advantages and disadvantages of Advantages and disadvantages of
case-control studiescase-control studies
• Advantages– Suitable for rare
diseases– Can explore several
exposures– Low cost– Rapid – Can cope with long
latency– Small sample size– No ethical problems
• Disadvantages– Cannot calculate the
risk– Not suitable for rare
exposures– Temporal relationship
difficult to establish– Subject to bias
• Selection of controls• Recall bias• …
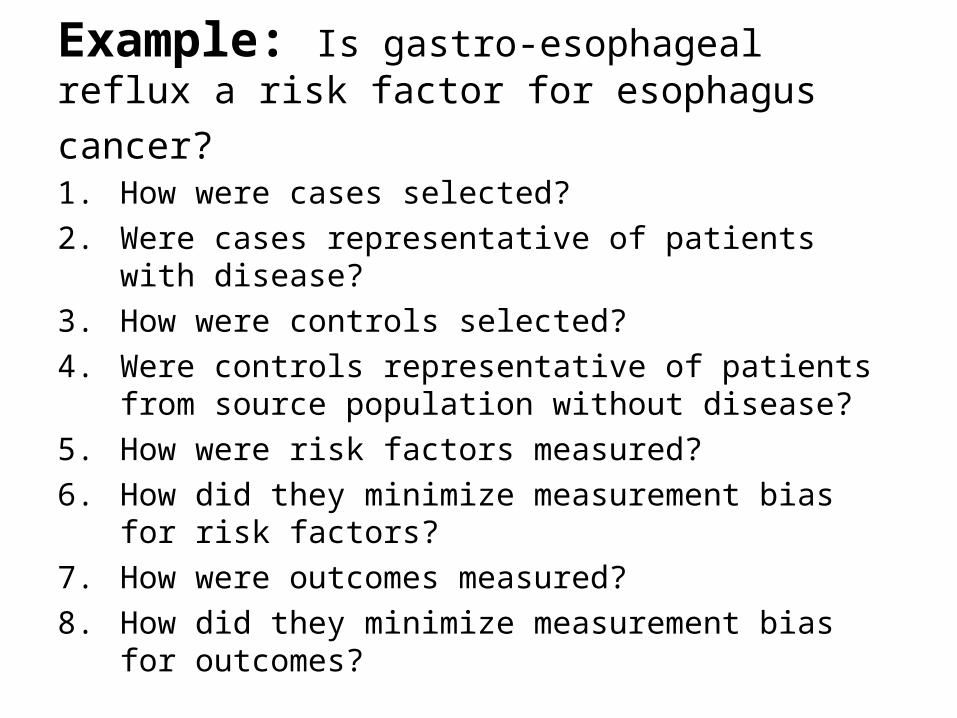
Example: Is gastro-esophageal reflux a risk
factor for esophagus cancer?
1. How were cases selected?2. Were cases representative of patients
with disease? 3. How were controls selected?4. Were controls representative of patients
from source population without disease?5. How were risk factors measured?6. How did they minimize measurement bias
for risk factors?7. How were outcomes measured?8. How did they minimize measurement bias
for outcomes?
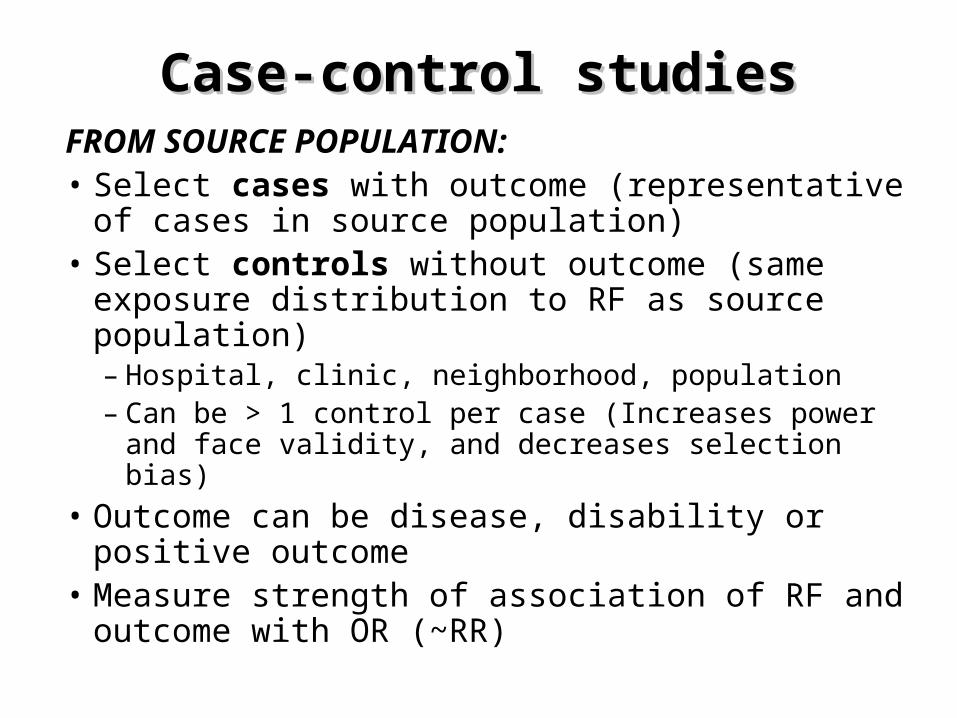
Case-control studiesCase-control studiesFROM SOURCE POPULATION:• Select cases with outcome (representative
of cases in source population)• Select controls without outcome (same
exposure distribution to RF as source population)– Hospital, clinic, neighborhood, population– Can be > 1 control per case (Increases power
and face validity, and decreases selection bias)• Outcome can be disease, disability or
positive outcome• Measure strength of association of RF and
outcome with OR (~RR)

Two Characteristics of CasesTwo Characteristics of Cases 1.Representativeness:
– Ideally, cases are a random sample of all cases of interest in the source population (e.g. from vital data, registry data).
– More commonly they are a selection of available cases from a medical care facility. (e.g. from hospitals, clinics)
2.Methods of selection: Selection may be from incident or prevalent cases
– Incident cases are those derived from ongoing ascertainment of cases over time
– Prevalent cases are derived from a cross-sectional survey

Selection of CasesSelection of Cases
• Population-based cases: Include all subjects or a random
sample of all subjects with the disease at a single point or during a given period of time in the defined population.
• Hospital-based cases:All patients in a hospital department at a given time

ControlsControls
• Definition: A sample of the source population that gave rise to the cases.
• Purpose: To estimate the exposure distribution in the source population that produced the cases.

Characteristics of ControlsCharacteristics of Controls
• Who is the best control?
• Where should controls come from?
• If cases are a random sample of all cases in the population, then controls should be a random sample of all non-cases in the population sampled at the same time (i.e. from the same study base)
• But if study cases are not a random sample of the university of all cases, it is not likely that a random sample of the population of non-cases will constitute a good control population.
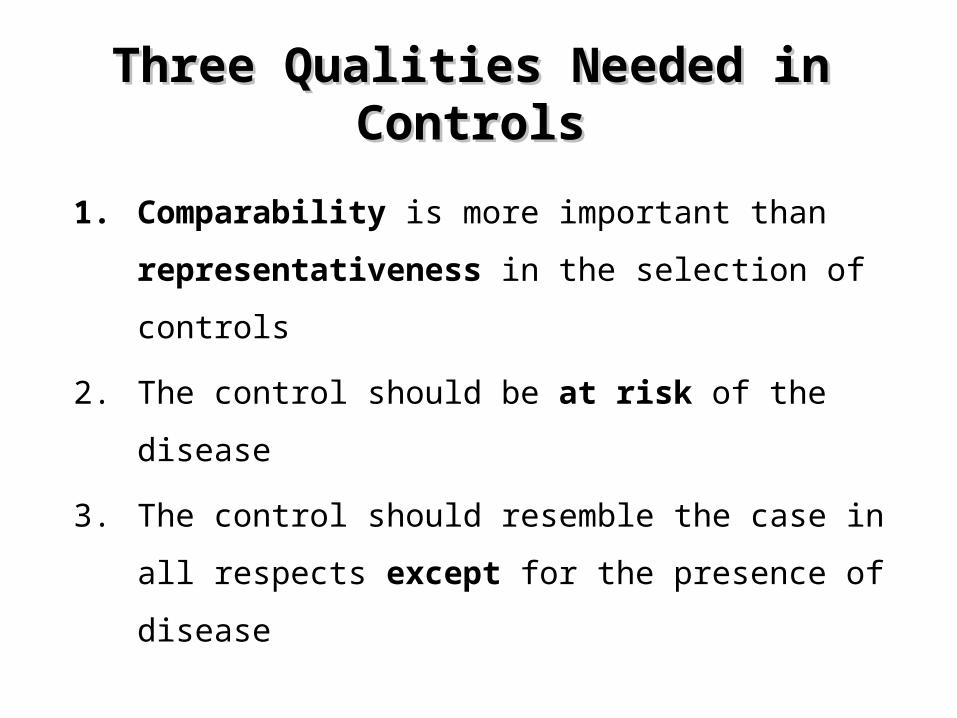
Three Qualities Needed in ControlsThree Qualities Needed in Controls
1. Comparability is more important than
representativeness in the selection of
controls
2. The control should be at risk of the
disease
3. The control should resemble the case in
all respects except for the presence of
disease
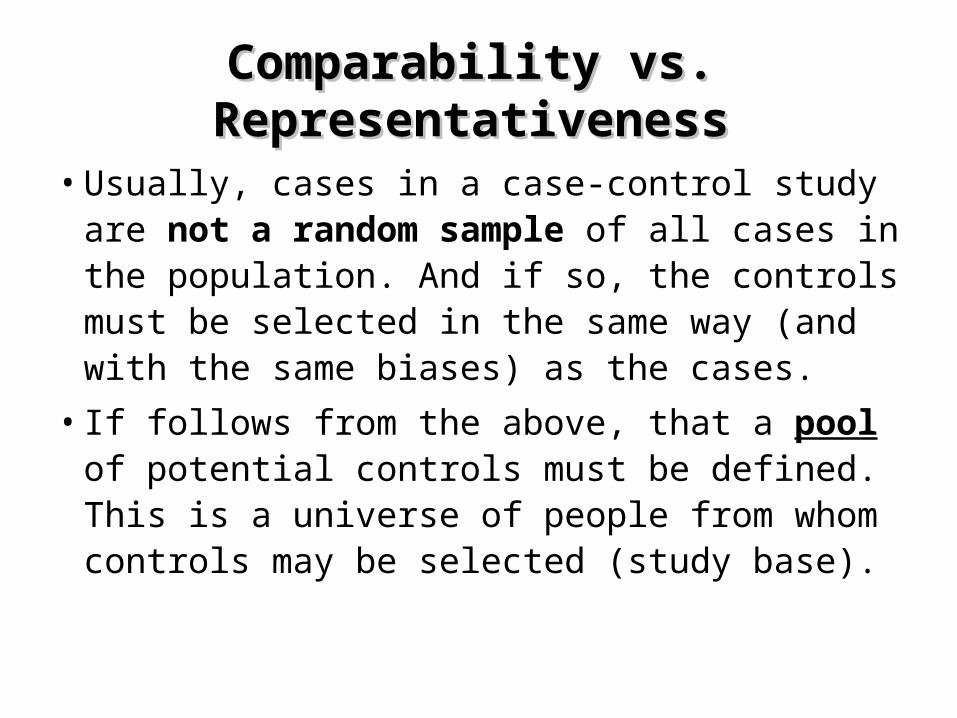
Comparability vs. RepresentativenessComparability vs. Representativeness
• Usually, cases in a case-control study are not a random sample of all cases in the population. And if so, the controls must be selected in the same way (and with the same biases) as the cases.
• If follows from the above, that a pool of potential controls must be defined. This is a universe of people from whom controls may be selected (study base).

• Cases emerge within a study base. Controls should emerge from the same study base, except that they are not cases.
For example, if cases are selected exclusively from hospitalized patients, controls must also be selected from hospitalized patients.
Three Qualities Needed in ControlsThree Qualities Needed in Controls
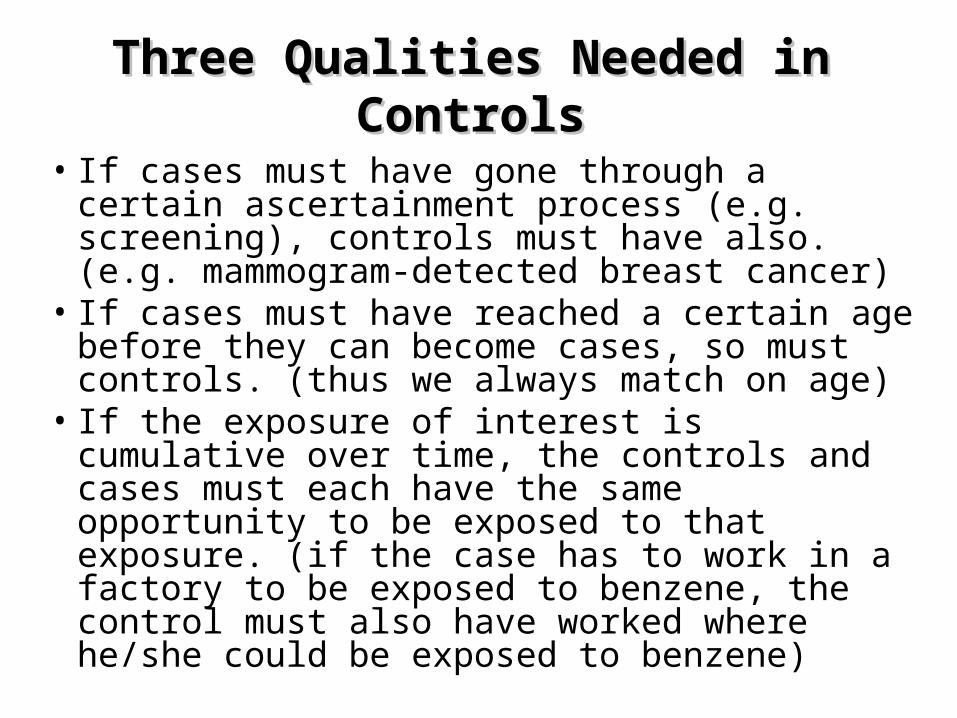
• If cases must have gone through a certain ascertainment process (e.g. screening), controls must have also. (e.g. mammogram-detected breast cancer)
• If cases must have reached a certain age before they can become cases, so must controls. (thus we always match on age)
• If the exposure of interest is cumulative over time, the controls and cases must each have the same opportunity to be exposed to that exposure. (if the case has to work in a factory to be exposed to benzene, the control must also have worked where he/she could be exposed to benzene)
Three Qualities Needed in ControlsThree Qualities Needed in Controls

Sources of controlsSources of controls
a) Population of defined area
b) Hospital patients
c) Probability sample of total population
d) Neighbors
(i) walk (door to door)
(ii) phone (random digit dialing)
(iii) letter carrier routes
e) Friends or associates of cases
f) Siblings, spouses or other relatives
g) Other

Selection of ControlsSelection of Controls
General population controls: General population controls: Most often used when cases are selected from a defined geographic population
– registries, households, telephone sampling, drivers’ license
– costly and time consuming– recall bias– eventually high non-response rate
Advantages: Advantages: assured that they come from the same base population as the casesDisadvantages: Time consuming, expensive, hard to contact and get cooperation; may remember exposures differently than cases

Selecting ControlsSelecting ControlsHospital controls Hospital controls • Used most often when cases are selected from
a hospital population• Easy to identify; less recall bias; higher
response rate
Example: Study of cigarette smoking and myocardial infarction among women.Cases identified from admissions to hospital coronary care units.Controls drawn from surgical, orthopedic, and medical unit of same hospital. Controls included patients with musculoskeletal and abdominal disease, trauma, and other non-coronary conditions.

Advantages:– Same selection factors that led cases to hospital led
controls to hospital– Easily identifiable and accessible
(so less expensive than population-based controls)
– Accuracy of exposure recall comparable to that of cases since controls are also sick
Disadvantages:– More willing to participate than population-based
controls– Since hospital based controls are ill, they may not
accurately represent the exposure history in the population that produced the cases
– Hospital catchment areas may be different for different diseases
Hospital controlsHospital controls

Those illnesses that have no relation to the risk factor(s) under study
Example: • Should respiratory diseases be used as
controls for a study of smoking and myocardial infarction?
• Do they represent the distribution of smoking in the entire population that gave rise to the cases of MI?
What illnesses make good hospital controls?What illnesses make good hospital controls?
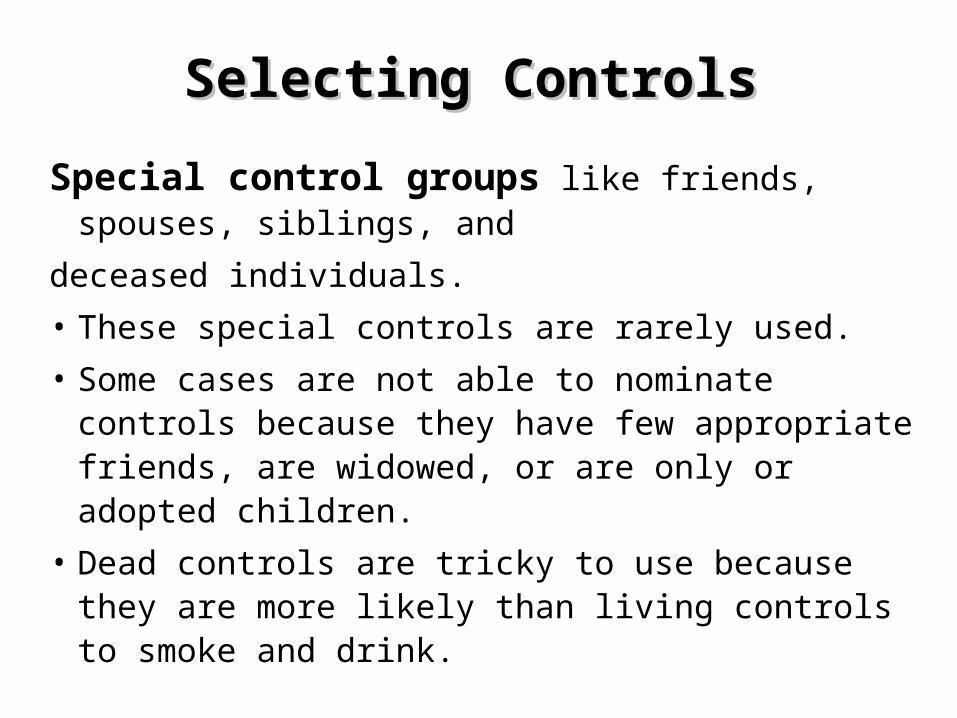
Selecting ControlsSelecting Controls
Special control groups like friends, spouses, siblings, and
deceased individuals.
• These special controls are rarely used.
• Some cases are not able to nominate controls because they have few appropriate friends, are widowed, or are only or adopted children.
• Dead controls are tricky to use because they are more likely than living controls to smoke and drink.

Misconception about Control Selection
•Representativeness – Wrong
•Of all person with diseases•Of the entire non-diseased population
– Correct• the source population for the cases is
the one that the controls should represent
•Exposure opportunity– Not needed, as in a real follow-up
study
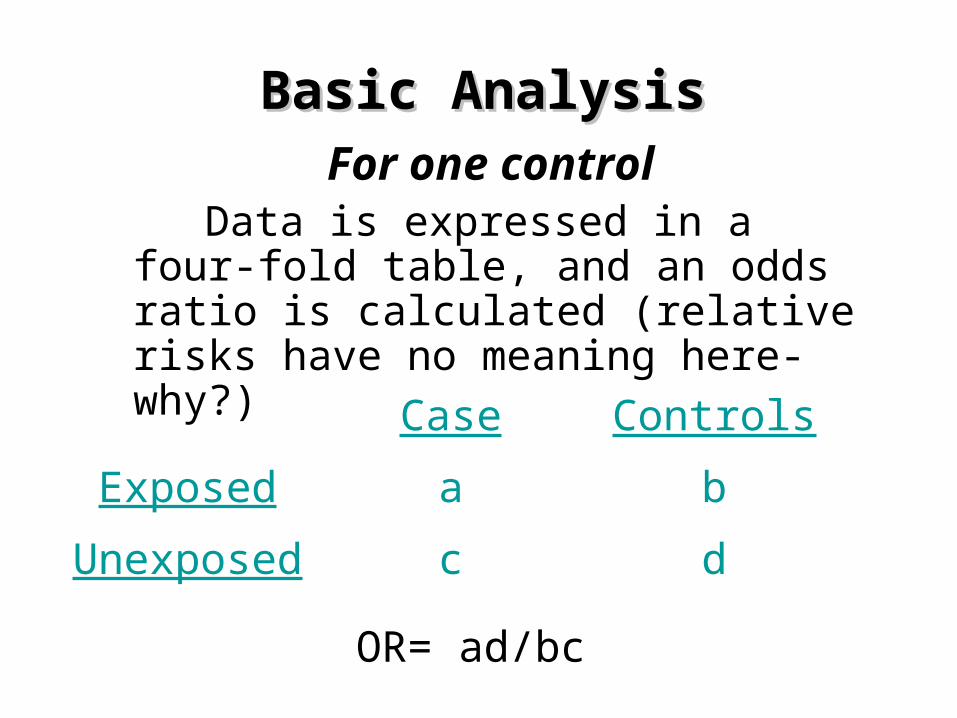
Basic AnalysisBasic Analysis
For one control Data is expressed in a four-
fold table, and an odds ratio is calculated (relative risks have no meaning here-why?)Case Controls
Exposed a b
Unexposed c d
OR= ad/bc
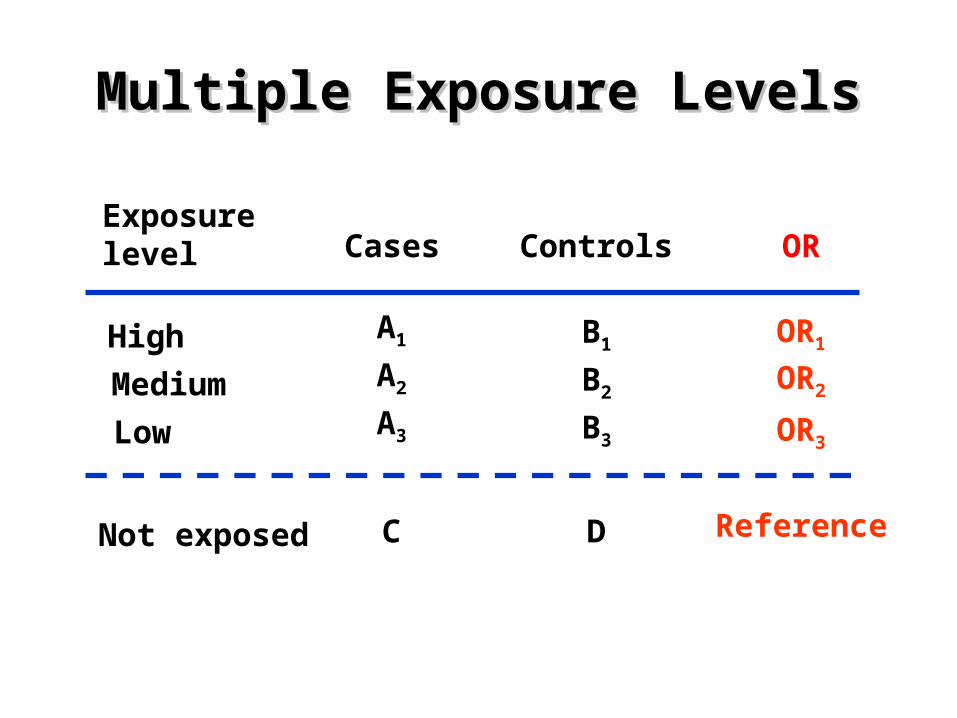
Multiple Exposure LevelsMultiple Exposure Levels
B1High A1
DNot exposed C
CasesExposurelevel
B2Medium A2
B3Low A3
OR1
OR2
OR3
Reference
Controls OR

Relation of Hepato cellular Adenoma to duration of oralcontraceptive use in 79 cases and 220 controls
Months of
OC use Cases Controls Odds ratio
0-12 7 121
13-36 11 49
37-60 20 23
61-84 21 20
>= 85 20 7
Total 79 220
Source: Rooks & col. 1979
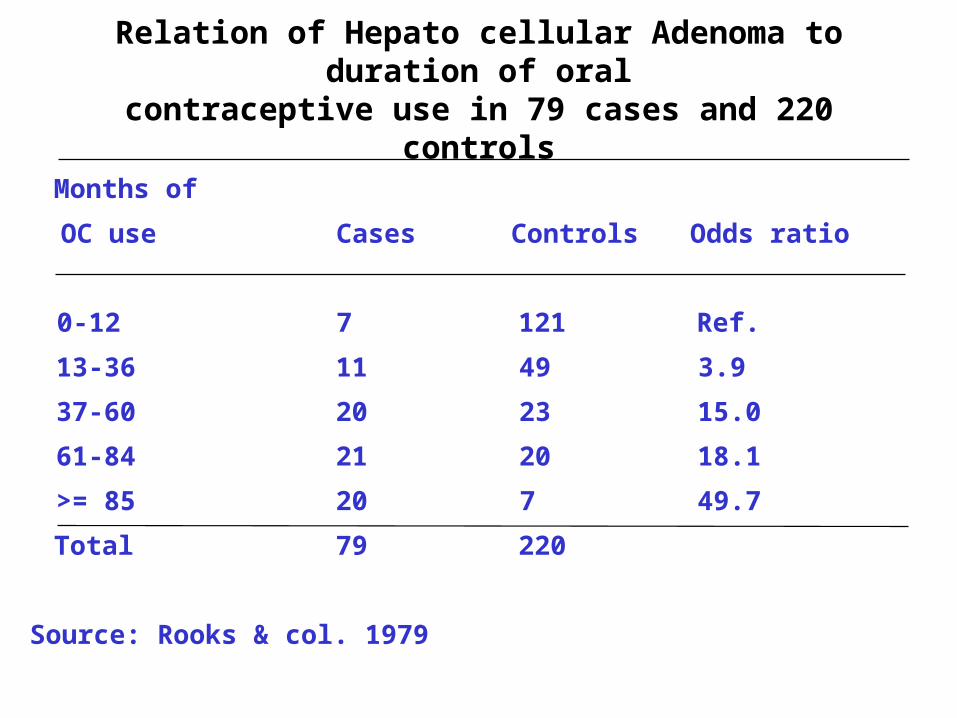
Relation of Hepato cellular Adenoma to duration of oralcontraceptive use in 79 cases and 220 controls
Months of
OC use Cases Controls Odds ratio
0-12 7 121 Ref.
13-36 11 49 3.9
37-60 20 23 15.0
61-84 21 20 18.1
>= 85 20 7 49.7
Total 79 220
Source: Rooks & col. 1979
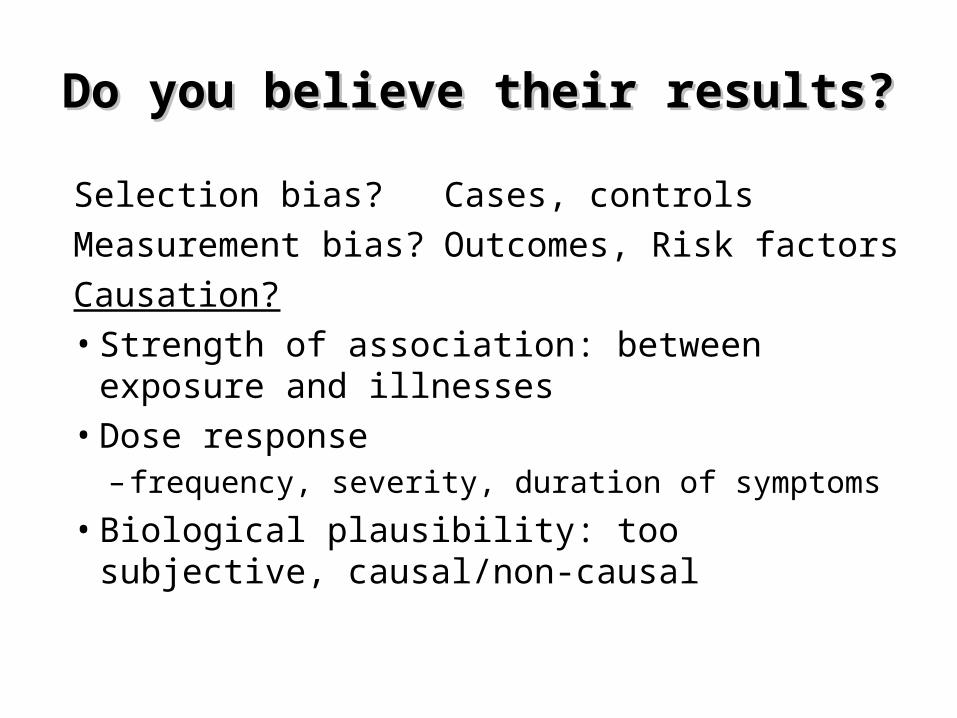
Do you believe their results?Do you believe their results?
Selection bias? Cases, controlsMeasurement bias? Outcomes, Risk
factorsCausation?• Strength of association: between exposure
and illnesses• Dose response
– frequency, severity, duration of symptoms
• Biological plausibility: too subjective, causal/non-causal

Case-Control Studies: BiasesCase-Control Studies: Biases
Bias in measurement of risk factors because:– Retrospective measurement – Differential recall bias
Decrease measurement bias for outcomes and RF by: – Standardize definitions, instrument and
process– Train assessors– Use data recorded before outcome is known– Blinding of subject and observer– Re-analyze data with more conservative
definitions

Case-Control Studies: decrease biasesCase-Control Studies: decrease biases
Decrease selection bias by:• Population based sample
– Cases - registry– Controls - from same population (random digit
dialing)• Sample cases and controls in same way (same
clinic) so risk factors/exposure is the same• Minimize non-participants• >1 control groups (increases power and
generalizability)• Matching
– Case and control comparable on RF that is not interesting, or not modifiable e.g. age, gender
– Advantages: Increased precision, decreased confounding
– Disadvantages: Loss of data, increased time, cost, complexity, irreversible.

SIX ISSUES IN MATCHING CONTROLS, CASE-CONTROL STUDY
1. Identify the pool from which controls may come.
This pool is likely to reflect the way controls were
ascertained (hospital, screening test, telephone
survey).
2. Control selection is usually through matching.
Matching variables (e.g. age), and matching criteria
(e.g. control must be within the same 5 year age
group) must be set up in advance.
3. Controls can be individually matched or frequency
matched

• INDIVIDUAL MATCHING: search for one (or more)
controls who have the required MATCHING
CRITERIA. PAIRED or TRIPLET MATCHING is when
there is one or two controls individually
matched to each case.
• FREQUENCY MATCHING: select a population of
controls such that the overall characteristics
of the group match the overall characteristics
of the cases.
e.g. if 15% of cases are under age 20, 15% of
the controls are also.
SIX ISSUES IN MATCHING CONTROLS, CASE-CONTROL STUDY

4. AVOID OVER-MATCHING. match only on
factors known to be causes of the disease.
5. Obtain POWER by matching MORE THAN ONE CONTROL PER CASE. In general, N of controls should be < 4, because there is no further gain of power above four controls per case.
6. Obtain GENERALIZABILITY by matching more than ONE TYPE OF CONTROL
SIX ISSUES IN MATCHING CONTROLS, CASE-CONTROL STUDY

Paired AnalysisPaired Analysis
Case
Exposed Unexposed
Exposed Both Mixed
Controls
Unexposed Mixed Neither
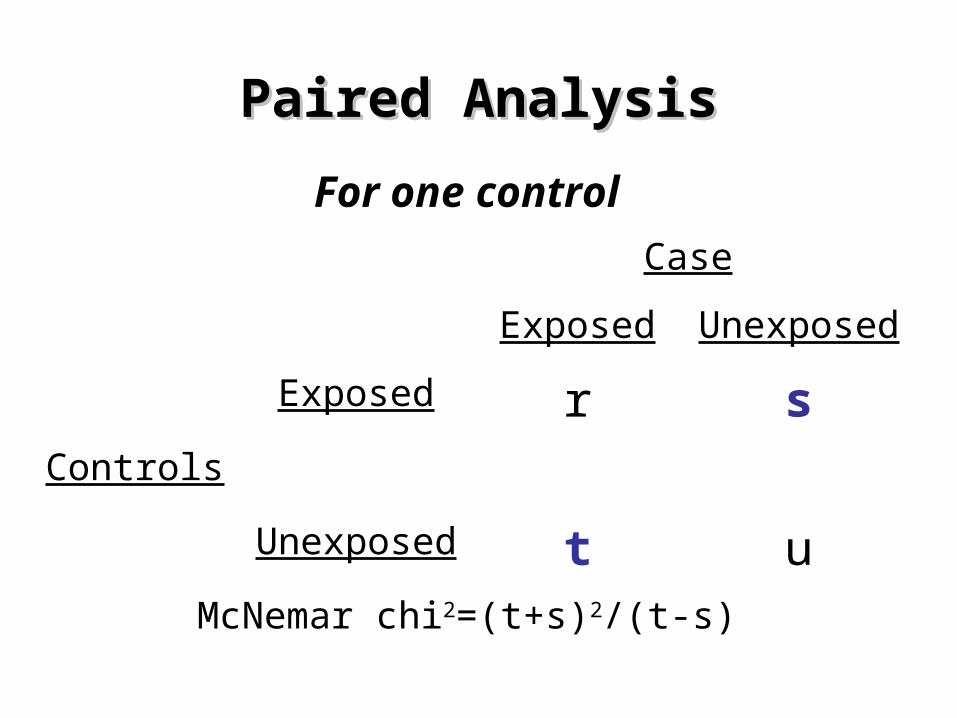
Paired AnalysisPaired Analysis
For one control
Case
Exposed Unexposed
Exposed r sControls
Unexposed t uMcNemar chi2=(t+s)2/(t-s)
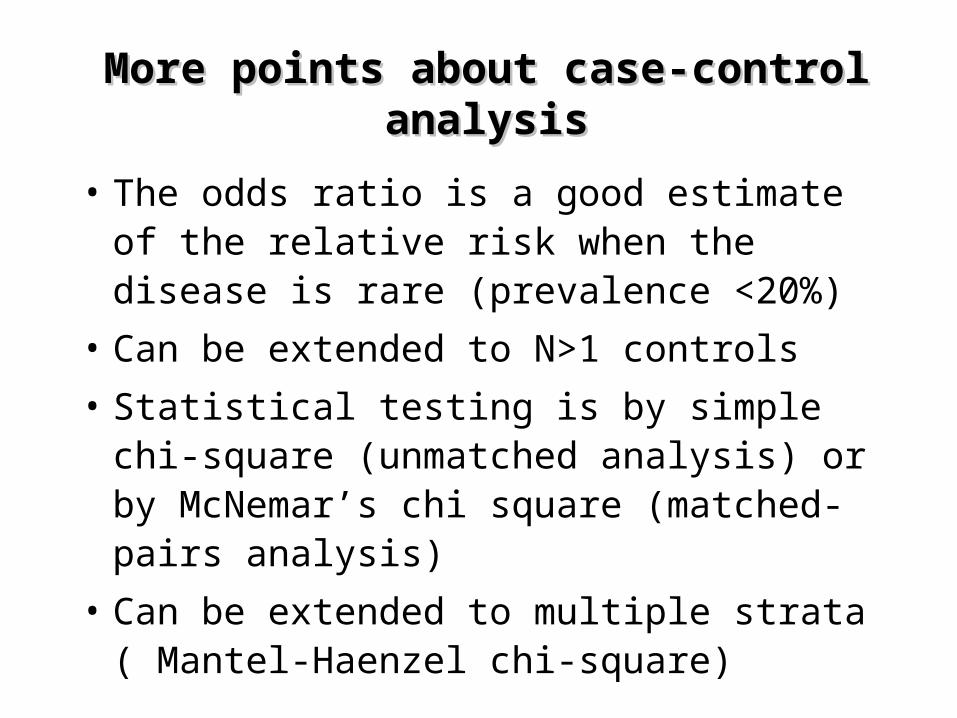
More points about case-control analysisMore points about case-control analysis
• The odds ratio is a good estimate of the relative risk when the disease is rare (prevalence <20%)
• Can be extended to N>1 controls
• Statistical testing is by simple chi-square (unmatched analysis) or by McNemar’s chi square (matched-pairs analysis)
• Can be extended to multiple strata ( Mantel-Haenzel chi-square)

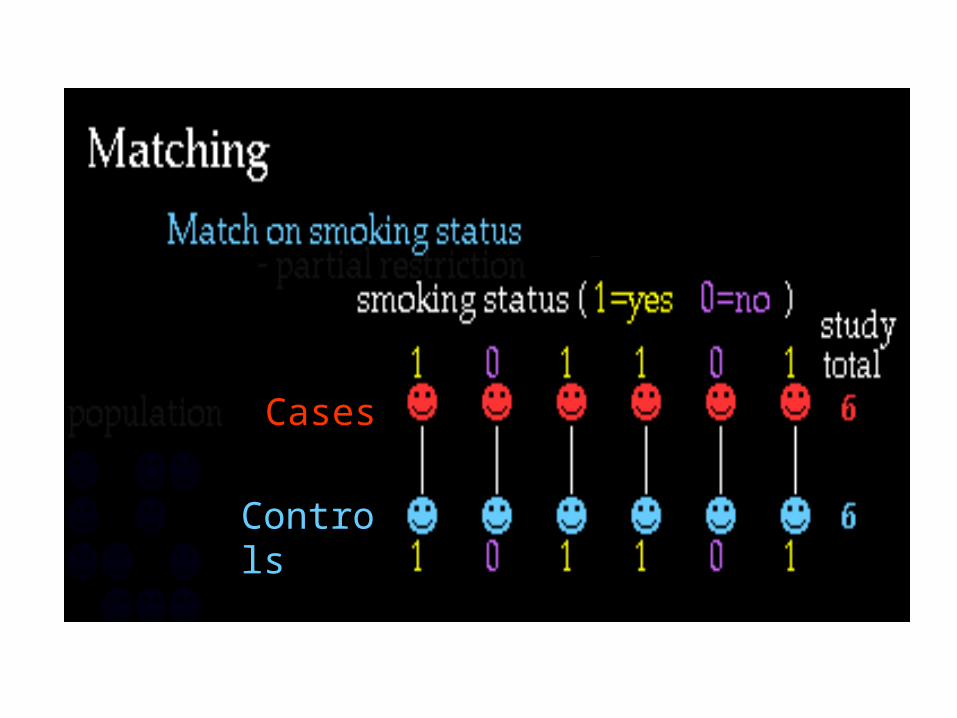
MatchingMatching
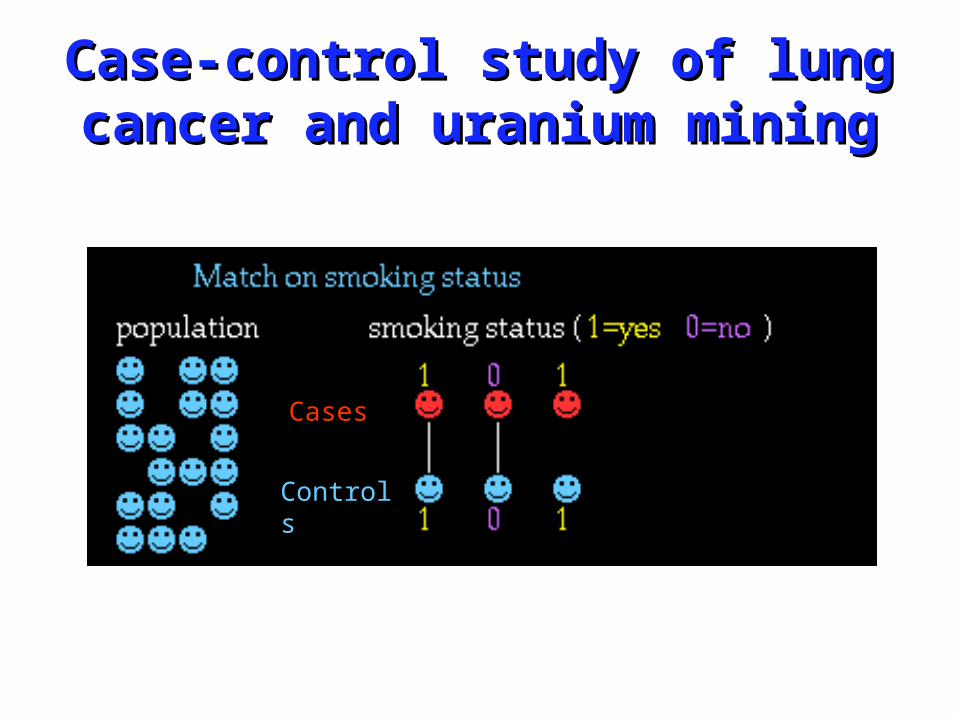
Cases
Controls
Case-control study of lung Case-control study of lung cancer and uranium miningcancer and uranium mining
Cases
Controls

Cases Controls
Diseasestatus
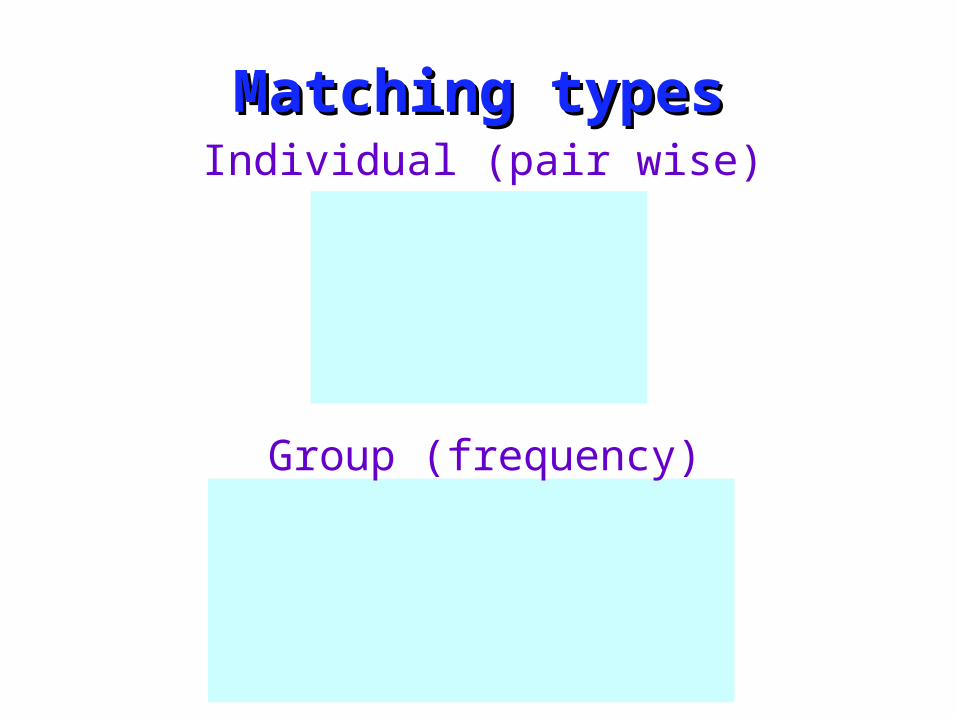
Matching typesMatching typesIndividual (pair wise)
Group (frequency)
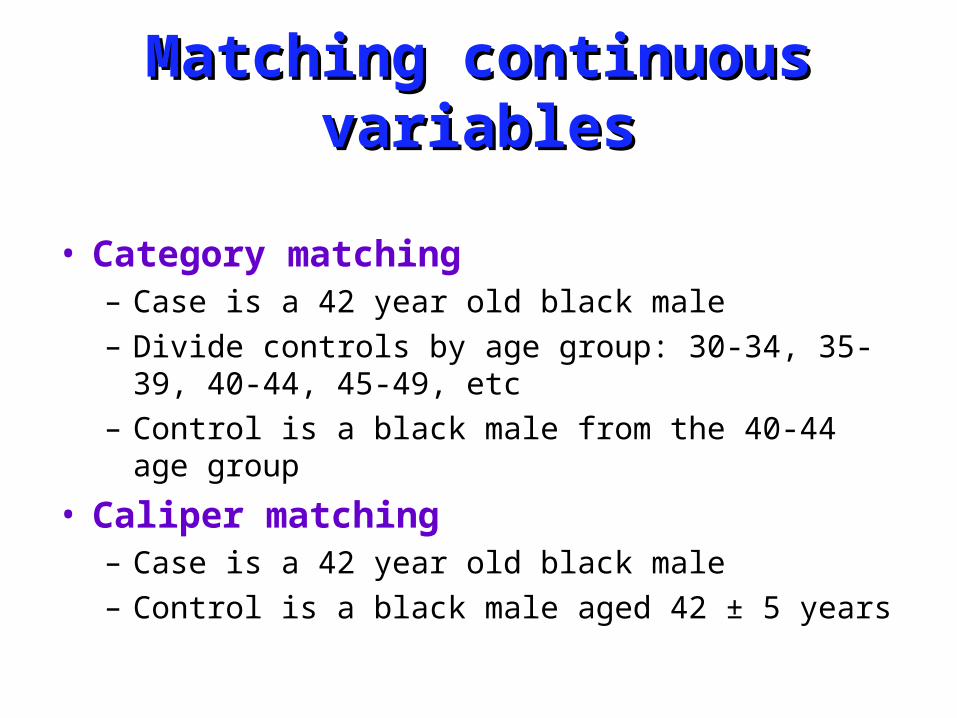
Matching continuous Matching continuous variablesvariables
• Category matching– Case is a 42 year old black male– Divide controls by age group: 30-34, 35-39, 40-44,
45-49, etc– Control is a black male from the 40-44 age group
• Caliper matching– Case is a 42 year old black male– Control is a black male aged 42 ± 5 years

Individual matchingIndividual matchingPossible combinations
Data layout

Individual matchingIndividual matching
Note: these are pairs not individuals

X
Y Note: in calculating matched odds ratio (mOR) only
discordant pairs are taken into account

ExampleExample
• Matched case-control study of work at a uranium mine and reduced sperm
• Cases: 400 men with low sperm count diagnosed in a Utah clinic
• Controls: 400 healthy men matched on race, age, area of residence, smoking and drinking habits
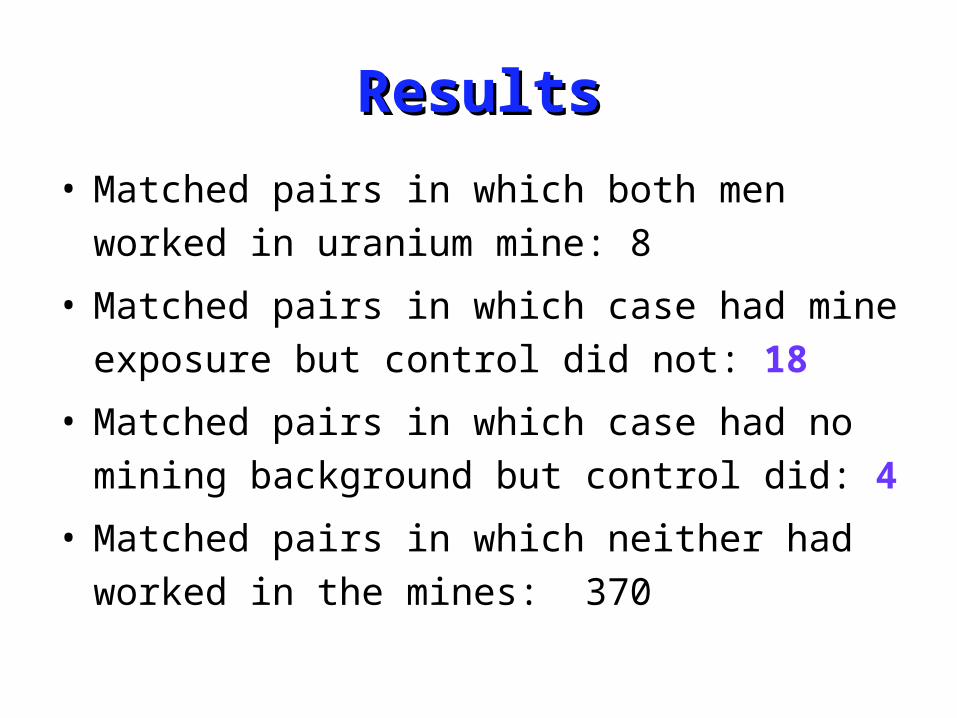
ResultsResults
• Matched pairs in which both men worked in
uranium mine: 8
• Matched pairs in which case had mine exposure
but control did not: 18
• Matched pairs in which case had no mining
background but control did: 4
• Matched pairs in which neither had worked in
the mines: 370

What if we performed unmatched analyses?
5.4 Y
X OR
25.2bc
ad OR A wrong result

การีป่รีะย�กต�ใชุ"ในส่ถานการีณ์�การีป่รีะย�กต�ใชุ"ในส่ถานการีณ์�จรี�งจรี�ง
•Case-control study– Use a case-control design to study uncommon
diseases
– Cases and control should originate from the same population
– With individual matching controls are individually linked to cases. With frequency matching, controls are chosen as a group to have a similar distribution as the cases on the matched variable
– Perform matched studies with very small sample sizes or when you have multiple category nominal variables
– Can not be used for determining the prevalence or incidence of a disease

Cross-sectional studiesCross-sectional studies
• Snap shot• Measure exposure and outcome variables at
one point in time. • Main outcome measure is prevalence
P = Number of people with disease x at time tNumber of people at risk for disease x at time t
Prevalence=k x Incidence x Duration

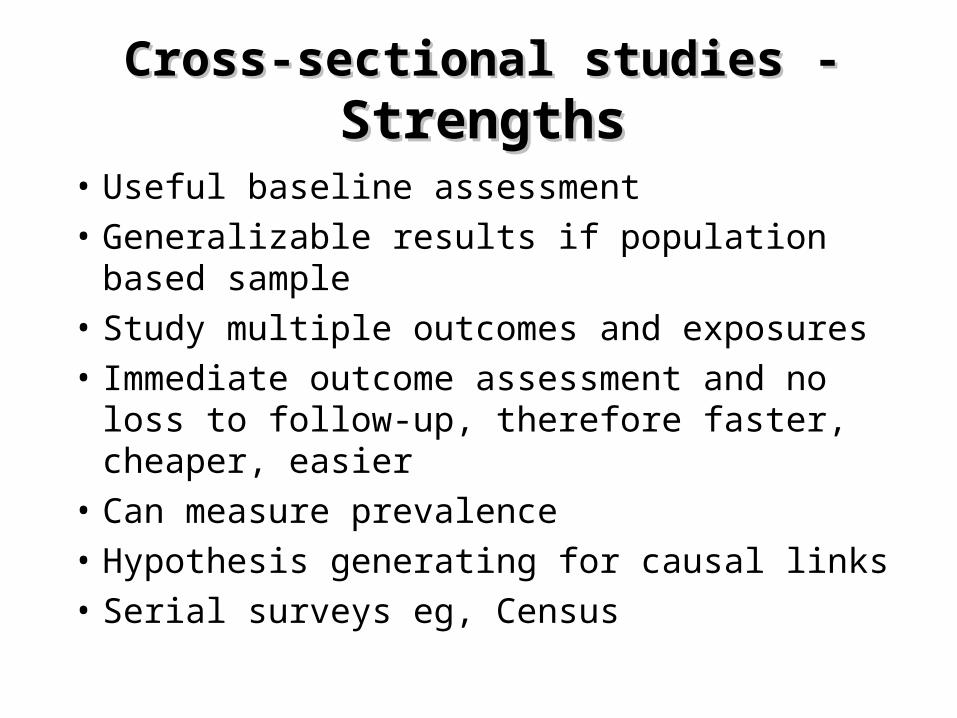
Cross-sectional studies - Cross-sectional studies - StrengthsStrengths
• Useful baseline assessment• Generalizable results if population based
sample• Study multiple outcomes and exposures• Immediate outcome assessment and no
loss to follow-up, therefore faster, cheaper, easier
• Can measure prevalence• Hypothesis generating for causal links• Serial surveys eg, Census
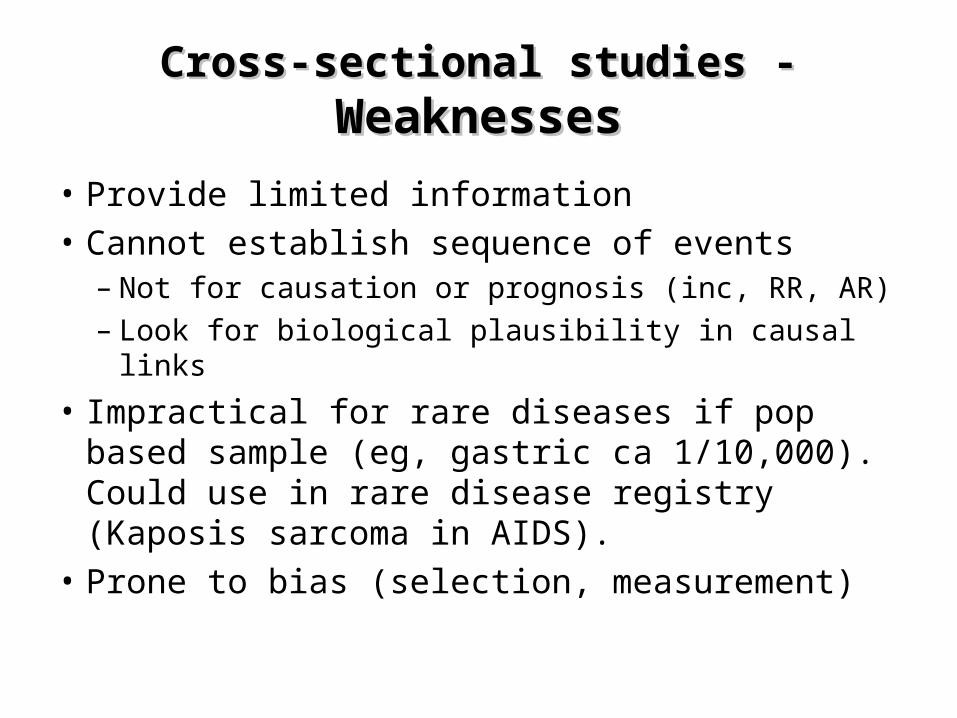
Cross-sectional studies - Cross-sectional studies - WeaknessesWeaknesses
• Provide limited information • Cannot establish sequence of events
– Not for causation or prognosis (inc, RR, AR)– Look for biological plausibility in causal links
• Impractical for rare diseases if pop based sample (eg, gastric ca 1/10,000). Could use in rare disease registry (Kaposis sarcoma in AIDS).
• Prone to bias (selection, measurement)

Bias in cross-sectional studiesBias in cross-sectional studies
Selection Bias (eg, NSSP study)Is study population representative of target
population? Is there systematic increase or decrease of RF?
Measurement BiasOutcome• Misclassified (dead, misdiagnosed, undiagnosed)• Length-biased sampling
– Cases overrepresented if illness has long duration and are underrepresented if short duration.(Prev = k x I x duration)
Risk Factor• Recall bias• Prevalence-incidence bias
– RF affects disease duration not incidence eg, HLA-A2

Cross-sectional studies - UsesCross-sectional studies - Uses
• Prevalence used in planning– Individual Pre-treament probability for Rx
and Dx – Population Health care services
• Describe distribution of variables (Census, NHANES, Table 1)
• Examine associations among variables• Hypothesis generating for causal links• Prediction rule eg, Ottawa ankle rule –
XR if 3 factors present

Observational studies
• Cohort Exposure to outcome• Case control Outcome to exposure• Cross-sectional Exposure and outcome
ALL ARE PRONE TO BIAS
– Selection Bias Population based sample,
large sample, selection criteria,
matching
– Measurement Bias Standardization, training,
prospective data
collection, blinding