disaster epidemiologyernaehrungsdenkwerkstatt.de/fileadmin/user_upload/...disaster epidemiology 4-1...
TRANSCRIPT
Disaster Epidemiology 4-1
DISASTER EPIDEMIOLOGY Description This chapter provides an overview of the key epidemiological principles and the epidemiological tools needed in managing emergency public health programs. The goal is to reduce morbidity and mortality among displaced populations. Objectives • To provide a basic understanding of key epidemiological principles and terminology. • To develop skills for defining and calculating indicators. • To describe standard methods for conducting needs assessment. • To define the steps for setting up a surveillance system for emergency situations. • To describe the main principles and practical methods for conducting a population survey. • To identify key steps in investigating disease epidemics. • To develop skills in analysing and presenting epidemiological information. Key Competencies • To recognise the main constraints in applying epidemiological methods to emergency situations. • To calculate key indicators of the health status of a population. • To plan a rapid needs assessment. • To set up a surveillance system for emergency situations. • To conduct a population survey using the appropriate sampling and analysis methods. • To investigate an epidemic and apply findings to an epidemic control program. • To analyse and present epidemiological data in a logical manner for use in program management.
Chapter 4

4-2 The Johns Hopkins and IFRC Public Health Guide for Emergencies
TABLE OF CONTENTS
Introduction.............................................................................................................................4-3 Basic Principles of Epidemiology in Emergencies ...........................................................4-4
Role of Epidemiology in Emergencies ..............................................................4-5 Key Epidemiological Indicators ...........................................................................4-6 Calculating Rates, Ratios, and Proportions .....................................................4-7 Selecting Indicators ..............................................................................................4-9
Rapid Needs Assessment................................................................................................. 4-10 Objectives of Rapid Needs Assessment........................................................ 4-10 Preparing for the Needs Assessment............................................................. 4-10 Defining the Information Needed..................................................................... 4-12 Sources and Methods for Collecting Data...................................................... 4-13 Conducting the Rapid Needs Assessment..................................................... 4-13
Estimating Population Size and Family Size ................................................................. 4-14 Objectives of Estimating Population Size....................................................... 4-14 Different Methods for Estimation...................................................................... 4-15
Surveillance......................................................................................................................... 4-17 Setting Up a Surveillance System ................................................................... 4-17 Indicators and Sources of Information............................................................ 4-18
Alternatives to Surveillance.............................................................................. 4-19 Analysing and Reporting Surveillance Data................................................... 4-21 Evaluating a Surveillance System ................................................................... 4-21
Population Surveys ............................................................................................................ 4-22 Basic Principles .................................................................................................. 4-22 Survey Design..................................................................................................... 4-23 Planning the Analysis and Reporting.............................................................. 4-24 Estimating Sample Size .................................................................................... 4-24 Sampling Methods.............................................................................................. 4-25 Designing a Questionnaire................................................................................ 4-27 Training and Supervising Interviewers............................................................ 4-28 Analysing and Reporting Survey Findings ..................................................... 4-29
Outbreak Investigation....................................................................................................... 4-29
Objectives of Investigating an Outbreak......................................................... 4-30 Key Steps ............................................................................................................ 4-30 Carrying Out the Investigation.......................................................................... 4-31
Data Analysis and Presentation....................................................................................... 4-32 Objectives of Data Analysis .............................................................................. 4-32 Basic Data Analysis and Interpretation........................................................... 4-32 Advanced Data Analysis ................................................................................... 4-39 Presenting Data ................................................................................................ 4-39 Communicating and Using Information........................................................... 4-42
References and Suggested Readings ........................................................................... 4-43

Disaster Epidemiology 4-3
INTRODUCTION Epidemiology is the study of the causes and distribution of disease in human populations. An epidemiological approach helps planners to focus on the main problems of a community rather than of individual patients, |and to identify measures for improving the health of the community as a whole. Commonly used terms in epidemiology are defined in the following table: Table 4-1: Terms and Definitions
Access The proportion of the population that can use the service or facility.
Age-Specific Rate A rate in which the information in the numerator and denominator is limited to persons within a particular age range.
Attack Rate The percentage of a well-defined population that develops an infectious disease over an outbreak period. Calculated by dividing the total number of people with the disease by the total population at risk at the start of the outbreak period.
Bias Any effect while collecting or interpreting data that leads to a systematic error in one direction, e.g., recall bias.
Case An individual who is identified as having a particular characteristic, e.g., disease, behaviour, or condition.
Catchment Area The geographical area from which all the people attending a particular health facility come.
Census The counting of all individuals in a particular population. Usually includes other details such as age, sex, occupation, ethnic group, marital status, housing and relationship to head of household.
Cluster Sampling A sampling method in which each selected unit is composed of a group of persons rather than an individual, e.g., villages, households.
Convenience Sampling
Selection of a sample that is nearby, easily reached, e.g., selecting people attending a clinic or those with shelters next to the road, etc. It is very biased.
Coverage A measure of the people who have received a service compared to all who need it.
Demography The study of populations, with reference to size, age, structure, density, fertility, mortality, growth and social and economic variables.
Denominator The lower portion of a fraction. In calculating rate, this number is the total population at risk.
Determinant An attribute, variable, or exposure that increases (risk factor) or decreases (protective factor) the occurrence of a specific event.
Epidemic The occurrence of cases of an illness clearly in excess of what is normally expected. This depends on the specific illness, the season, the location. Requires knowledge of previous incidence of the event in the same area.
Epidemiology The study of the distribution and causes of disease in populations, and its application to the prevention and control of health problems and diseases.
Household All members eating from the same pot, or sleeping under one shelter.
Hypothesis A reasonable statement that is set up to be verified or proved.
Incidence The number of new cases, events (illness, death, malnutrition, injury) or attendance that are diagnosed or reported, divided by the total number of persons in a population during a defined period of time (usually one year but shorter for outbreaks). Commonly used for acute, communicable diseases.
Indicator A measure that reflects, or indicates, the state of a defined population, e.g., infant mortality rate.
Index Case A person who acquires disease through exposure and brings it into a population
Mean Commonly called the average. Calculated by adding the individual values in a group of measurements and dividing the total by the number of values.
Median The central value in a range of measurements that divides the data set into two equal parts.
Mode The most frequently occurring value in a set of observations.
Morbidity An incidence rate used to include all persons in the population under consideration (e.g. specific gender or age-group) who become clinically ill during the stated time period.
Mortality
(death rate)
The number of deaths occurring in a population in a stated period of time (usually a year) divided by the number of persons at risk of dying during that period.
• Crude mortality rate – covers deaths from all causes
• Death-specific mortality rate – covers death due to only one disease

4-4 The Johns Hopkins and IFRC Public Health Guide for Emergencies
Numerator The upper portion of a fraction. In calculating rate, all people included in the numerator should be included in the denominator. This is not true for the numerator in a ratio.
Population The total number of inhabitants or particular groups in a defined area or country. In sampling, population refers to the units from which a sample is drawn.
Population Pyramid
A graphical presentation of the age and sex composition of a population. A typical pyramid for developing countries has a broad base, sloping sides, and a narrow apex is due to high fertility rate and high mortality at younger ages.
Prevalence The total number of persons sick or portraying a certain condition in a stated population at a particular time or period, regardless when it began, divided by the population at risk.
• Point prevalence measures the proportion at a particular point in time.
• Period prevalence measures the proportion within a defined period of time.
Probability Sampling
Uses the probability theory to select a specified number of persons for study such that every member in the target population has the same known and non-zero chance of being included. Provides a demonstrable degree of reliability.
Proportion A ratio where the numerator (x) is part of the denominator (y). Expressed as x/y.
Random Sample A selected subset of the population derived by random selection of sample units. Each individual unit (village, household or person) should have an equal chance of being included in the sample.
Rate The likelihood that a particular event will occur in a specified period of time. Expressed as x/y x factor ( e.g., 1000).
Ratio The relationship between two quantities, represented by x and y. Expressed as x/ y or x:y (x need not be part of y).
Representative Sample
A selected subset of a population that resembles the original or reference population in every way.
Sampling Selection of a specified number of persons in a population for study with the hope that they are representative of the entire population.
Sensitivity The proportion of true positives correctly identified by a screening test.
Specificity The proportion of true negatives correctly identified by a screening test.
Standard Deviation
A measure of the dispersion or variation of a set of quantitative measurements on either side of the mean.
Surveillance Ongoing, systematic collection, analysis and interpretation of health data for managers of public health programs, combined with feedback to all.
Survey Periodic, focused assessments that collect health data from a population.
Systematic Sampling
A sampling method that uses a list to select, after randomly picking the first unit, additional units at regular intervals.
Trend A long-term change in frequency, either upward or downward. A downward trend in a disease implies it is becoming less frequent.
Validity The degree to which a measurement actually measures what it is supposed to.
Variable Any characteristic that can be measured (e.g., age, weight) or categorised (e.g., sex, marital status).
BASIC PRINCIPLES OF EPIDEMIOLOGY IN EMERGENCIES Epidemiology can increase understanding about a disease and how it is transmitted even when the cause is unknown. In epidemiology, one believes that diseases do not occur at random, but follow predictable patterns that can be studied and expressed in terms of WHAT, WHO, WHERE, WHEN, HOW, WHY, and WHAT NEXT. The goal of epidemiology is to identify subgroups of the population who are at higher risk of disease and who will benefit the most from disease-specific interventions. Epidemiological information can be used to develop prevention strategies according to time (peaks at a particular season), place (limited to specific geographic areas) or person (groups at risk). In emergencies, epidemiology has three elements:

Disaster Epidemiology 4-5
1. Descriptive Epidemiology — determines the distribution of a disease among displaced populations. It describes the health problem, its frequency, those who are affected, where, and when. The events of interest are defined in terms of the period of time, the place, and the population at risk.
Examples: Monitoring the health status of a population in order to detect cholera cases, such as, by age, sex, location, water source, and duration of stay in a camp.
Conducting a nutritional survey to determine the prevalence of acute malnutrition among children under five years.
2. Analytical Epidemiology — examines those who are ill and those who are not to identify the risk of
disease or protective factors (determinant of a disease). It examines how the event (illness, death, malnutrition, injury) is caused (e.g., environmental and behavioural factors) and why it is continuing. Standard mathematical and statistical procedures are used.
Example: Investigating an outbreak of an unknown disease in a displaced population settlement. 3. Evaluation Epidemiology — examines the relevance, effectiveness, and impact of different program
activities in relation to the health of the affected populations.
Example: Evaluating a malaria control program for displaced populations.
Role of Epidemiology in Emergencies Epidemiology in emergencies goes beyond simply understanding how diseases are contracted and spread. Humanitarian relief programs can be managed better if all decisions are based on epidemiological findings. Relief workers need training to help them collect more reliable information and use it to improve the health of the displaced population. Objectives of epidemiology in emergencies include: • To identify the priority health problems in the affected community. • To determine the extent of disease existing within a community. • To identify the causes of disease and the risk factors. • To determine the priority health interventions. • To determine the extent of damage and the capacity of the local infrastructure. • To monitor health trends of the community. • To evaluate the impact of health programs. Epidemiology has many uses in emergency situations, including: • Rapid needs assessment. • Demographic studies – determining the population size, structure, etc. • Population surveys for determining health status (death rates, incidence/prevalence of disease, nutrition
and immunisation status), investigating an outbreak and assessing program coverage. • Public health surveillance and management information system. • Program monitoring and evaluation. Constraints of Epidemiology in Emergencies Constraints in using epidemiology in emergencies include: • Poor understanding of basic epidemiological principles and measurement techniques. • Rapid turnover of skilled staff. • Lack of access to a significant fraction of the affected population due to chaos or insecurity. • Limited resources for processing information. • Difficulty in estimating the population size. • Survey samples may not represent the total affected population.

4-6 The Johns Hopkins and IFRC Public Health Guide for Emergencies
Key Epidemiological Indicators Indicators are measures that reflect the state of a population in terms of health, socio-economic status, etc. They may also reflect the process and outcome of existing services. In humanitarian emergencies, indicators are useful for measuring and describing the effects of a disaster on a population and for providing baseline measurements. Later, these measurements will help determine the outcome of the relief response. Indicators may be defined from surveys or an existing health information system. They may be quantitative or qualitative in nature. Quantitative indicators are easily calculated from numeric information such as total number of people, the number of people according to age and sex, etc. Examples of quantitative indicators include: • Incidence — the number of cases or events that occur within a defined population, divided by the
total population in which the cases or events occurred in a specific period, e.g., incidence of measles among children.
• Prevalence — the proportion of the population with a particular condition, divided by the total number of persons at risk of dying during that period, e.g., prevalence of HIV/AIDS in a population.
• Morbidity rate – all persons in the population under consideration (e.g. belonging to a specific gender or age-group) who become clinically ill during the stated time period.
• Mortality rate — the number of deaths occurring in a population in a stated period of time (usually a year) divided by the number of persons at risk of dying during that period, e.g., mortality rate of infants during their first year of life.
Qualitative indicators, which measure people’s attitudes and knowledge, are more difficult to measure. These indicators may be critical in explaining unexpected values of quantitative indicators. Examples of qualitative indicators include: • Awareness of the value of immunisation — low awareness may explain the high incidence of measles
in a population living within 5km from a health facility. • Compliance to universal precautions against HIV/AIDS — poor compliance to the universal
precautions may explain the increasing prevalence of HIV/AIDS in a population. • Equity in distribution of resources — inequitable distribution may explain the increased mortality
detected in a subgroup of a population. It is important to define the most commonly used qualitative indicators, which include:
• access: the proportion of the target population that can use the service or facility
• coverage: the proportion of the target population that has received service
• quality of services: the actual services received compared with the standards and guidelines
• availability: amount of services compared with total target population (should be based on minimum standard requirements)
The following table summarises quantitative and qualitative indicators that may be used to evaluate the process and outcome of an emergency health program.

Disaster Epidemiology 4-7
Table 4-2: Quantitative and Qualitative Indicators for Emergency Health Programs
INDICATOR EXAMPLES
Health Policy
(may be difficult to measure)
• Degree of political commitment • Compliance to national protocols • Level of community participation • Degree of inter-sectoral collaboration • Equity in distribution of resources • Inter-agency co-ordination • Compliance to universal precautions against HIV/AIDS
• Compliance to minimum standards of the Sphere Project
Demographic Profile Estimated size and structure of displaced population: • age and sex composition • migration patterns (proportion moving in and out) • proportion of high-risk groups • ratio to local resident population
Health Status • Rate and causes of death (crude, infant, under fives, maternal) • Incidence and prevalence of common disease
• Rate of under-five malnutrition
Program Inputs Availability of the following resources: • Facilities and equipment (health centre, beds) • Staff (beneficiary population, local, expatriate) • Basic supplies (food, shelter material, domestic equipment) • Energy sources (fuel, charcoal) • Transport
Program Process Access, coverage, and quality of the following services: • General food distribution and supplementary feeding • Potable water supply • Latrine construction • Immunisation • Ante-natal/pre-natal care • Health services
Calculating Rates, Ratios, and Proportions The most readily available data is usually in the form of absolute numbers (e.g., the total number of measles cases, the total number of diarrhoea cases). Absolute numbers can be used to report on the health of a specific population in a confined area over a short time period. However, they cannot be used to compare events within the same population between population groups of different sizes or at different locations because they can lead to invalid conclusions. For example, no conclusion can be drawn from reports of 21 deaths in Refugee Camp A and 15 deaths in Refugee Camp B. To understand the significance of these reports and compare the death toll in the two camps, the frequency of deaths must be expressed as fractions such as rates, ratios, or proportions (percentages). These fractions contain a numerator and a denominator. When calculating rates, ratios, and proportions, it is important to estimate, as accurately as possible, the numerator (the number of people with the problem or condition) and the denominator (the total population at risk for developing the health problem). A good estimate of the total population is essential for calculating indicators that are reliable and useful for planning emergency programs. The following are general formulas for calculating rates, ratios, and proportions (with examples):

4-8 The Johns Hopkins and IFRC Public Health Guide for Emergencies
a) Rate = x/y x factor This formula expresses the likelihood that a particular event, case, or episode (x) will occur in a specified period of time among a population at risk (y).
Example: The significance of 21 deaths in Camp A and 18 deaths in Camp B depends on the time period they occurred and the size of the population at risk. Assuming they all occurred over a 7-day period, the crude death rate can be calculated for each camp based on the estimated total population — A (50,000 people) and B (5,000 people) as follows:
Crude Mortality Rate = Number of deaths x factor (CMR) Total mid-interval population x time period
CMR = 21 x 10,000 = 0.6 deaths/10,000/day (indicates a stable situation) for Population A 50,000 x 7
CMR = 15 x 10,000 = 4.3 deaths per 10,000 per day (indicates a critical situation)
for Population B 5,000 x 7
Note: A factor of 100, 1000, or 10,000 may be used to convert calculated rates into whole numbers.
During the initial phase of the emergency, a factor of 10,000 is used for calculating daily death rates in order to detect sudden changes. A crude death rate ≥ 1 death/10,000/day indicates an acute emergency phase. The post emergency phase begins once the CMR drops below 1 death/10,000/day. Thereafter, death rates may be analysed once a month using a factor of 1,000 to calculate monthly death rates.
To convert CMR expressed as deaths/10,000/day into deaths/1000/month , divide the daily CMR by 10 and then by the total days in a month. From the above example:
4.3 deaths/10,000/day = 4.3 = 0.014 deaths/1000/month 10 x 30
b) Ratio = x/y
This formula expresses a relationship between a numerator (x) and a denominator (y), where x need not be part of y.
Example: If the estimated size of the displaced population is 20,000 with 8,000 males and 12,000 females: Then, the ratio of males to females = Total number of males = 8,000 = 2:3
Total number of females 12,000
This ratio is better interpreted by dividing each side of the equation by the value on the left side i.e.: Male:Female = 2/2:3/2 = 1:1.5
c) Proportion = x/y
This formula expresses the relationship between a numerator (x) and a denominator (y), where x is part of y.
Example 1 : If the 21 deaths in camp A were of patients diagnosed with malaria during the same month:
Proportional mortality (%) = Number of deaths due to a certain disease x 100 = 21 x 100 = 21% from malaria in hospitals Total deaths during that period 100
Example 2: Coverage is also calculated as a proportion as follows: = No. of beneficiaries of a service x 100 Total target population
Immunisation (%) = (No. of children aged 12-23 months who got immunised) Coverage (Total number of children aged 12-23 months)
Disaster Epidemiology 4-9
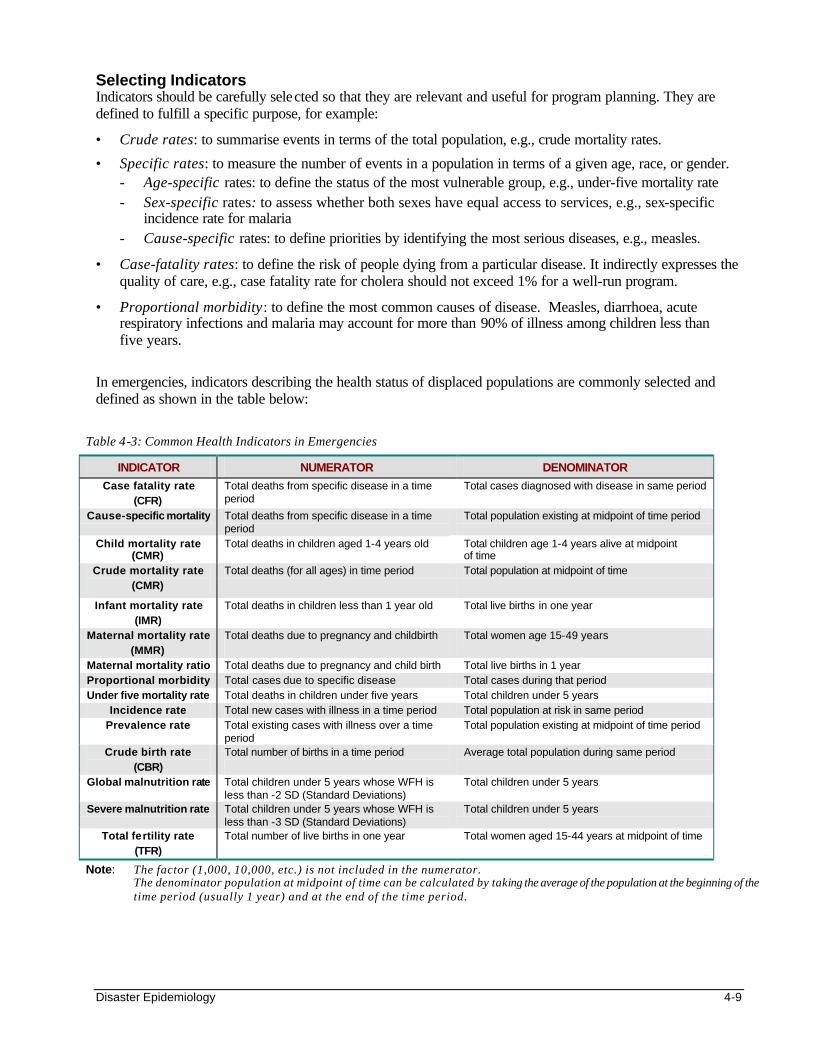
Table 4-3: Common Health Indicators in Emergencies
INDICATOR NUMERATOR DENOMINATOR
Case fatality rate (CFR)
Total deaths from specific disease in a time period
Total cases diagnosed with disease in same period
Cause-specific mortality Total deaths from specific disease in a time period
Total population existing at midpoint of time period
Child mortality rate (CMR)
Total deaths in children aged 1-4 years old Total children age 1-4 years alive at midpoint of time
Crude mortality rate (CMR)
Total deaths (for all ages) in time period Total population at midpoint of time
Infant mortality rate (IMR)
Total deaths in children less than 1 year old
Total live births in one year
Maternal mortality rate (MMR)
Total deaths due to pregnancy and childbirth
Total women age 15-49 years
Maternal mortality ratio Total deaths due to pregnancy and child birth Total live births in 1 year Proportional morbidity Total cases due to specific disease Total cases during that period Under five mortality rate Total deaths in children under five years Total children under 5 years
Incidence rate Total new cases with illness in a time period Total population at risk in same period Prevalence rate Total existing cases with illness over a time
period Total population existing at midpoint of time period
Crude birth rate (CBR)
Total number of births in a time period
Average total population during same period
Global malnutrition rate Total children under 5 years whose WFH is less than -2 SD (Standard Deviations)
Total children under 5 years
Severe malnutrition rate Total children under 5 years whose WFH is less than -3 SD (Standard Deviations)
Total children under 5 years
Total fertility rate (TFR)
Total number of live births in one year Total women aged 15-44 years at midpoint of time
Note: The factor (1,000, 10,000, etc.) is not included in the numerator. The denominator population at midpoint of time can be calculated by taking the average of the population at the beginning of the time period (usually 1 year) and at the end of the time period.
Selecting Indicators Indicators should be carefully selected so that they are relevant and useful for program planning. They are defined to fulfill a specific purpose, for example:
• Crude rates: to summarise events in terms of the total population, e.g., crude mortality rates.
• Specific rates: to measure the number of events in a population in terms of a given age, race, or gender. - Age-specific rates: to define the status of the most vulnerable group, e.g., under-five mortality rate - Sex-specific rates: to assess whether both sexes have equal access to services, e.g., sex-specific
incidence rate for malaria - Cause-specific rates: to define priorities by identifying the most serious diseases, e.g., measles.
• Case-fatality rates: to define the risk of people dying from a particular disease. It indirectly expresses the quality of care, e.g., case fatality rate for cholera should not exceed 1% for a well-run program.
• Proportional morbidity: to define the most common causes of disease. Measles, diarrhoea, acute respiratory infections and malaria may account for more than 90% of illness among children less than five years.
In emergencies, indicators describing the health status of displaced populations are commonly selected and defined as shown in the table below:
4-10 The Johns Hopkins and IFRC Public Health Guide for Emergencies
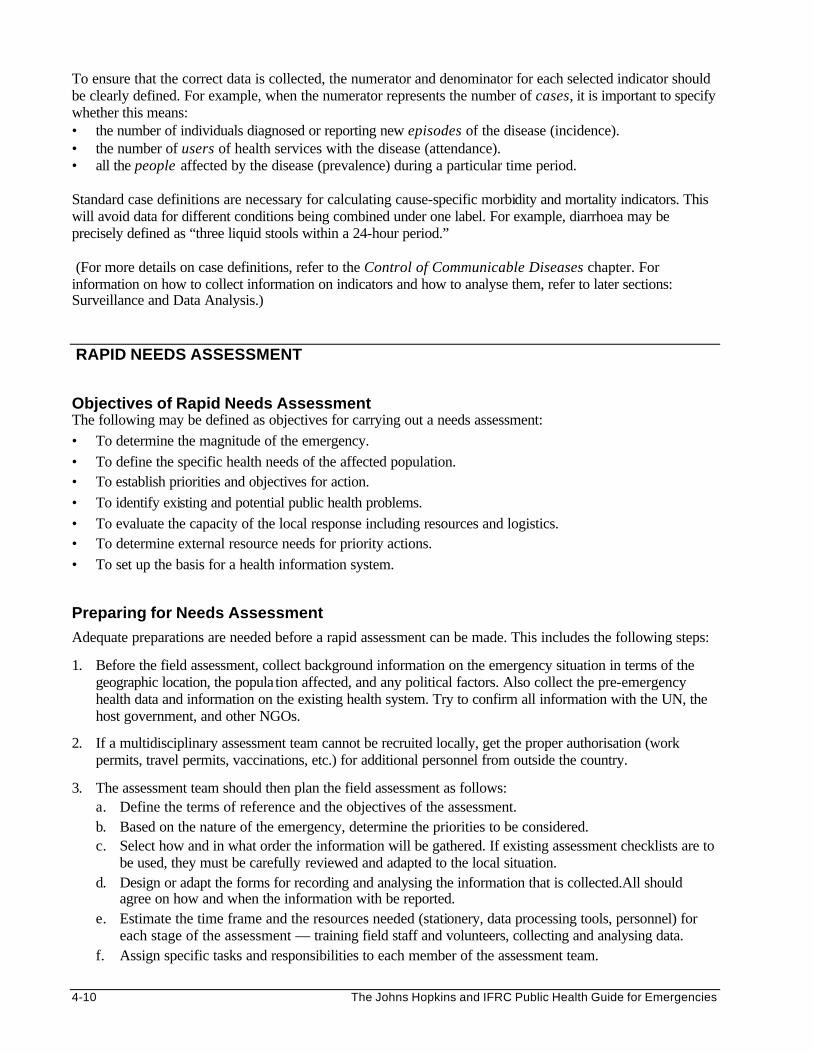
To ensure that the correct data is collected, the numerator and denominator for each selected indicator should be clearly defined. For example, when the numerator represents the number of cases, it is important to specify whether this means: • the number of individuals diagnosed or reporting new episodes of the disease (incidence). • the number of users of health services with the disease (attendance). • all the people affected by the disease (prevalence) during a particular time period. Standard case definitions are necessary for calculating cause-specific morbidity and mortality indicators. This will avoid data for different conditions being combined under one label. For example, diarrhoea may be precisely defined as “three liquid stools within a 24-hour period.” (For more details on case definitions, refer to the Control of Communicable Diseases chapter. For information on how to collect information on indicators and how to analyse them, refer to later sections: Surveillance and Data Analysis.) RAPID NEEDS ASSESSMENT Objectives of Rapid Needs Assessment The following may be defined as objectives for carrying out a needs assessment: • To determine the magnitude of the emergency. • To define the specific health needs of the affected population. • To establish priorities and objectives for action. • To identify existing and potential public health problems. • To evaluate the capacity of the local response including resources and logistics. • To determine external resource needs for priority actions. • To set up the basis for a health information system. Preparing for Needs Assessment
Adequate preparations are needed before a rapid assessment can be made. This includes the following steps:
1. Before the field assessment, collect background information on the emergency situation in terms of the geographic location, the popula tion affected, and any political factors. Also collect the pre-emergency health data and information on the existing health system. Try to confirm all information with the UN, the host government, and other NGOs.
2. If a multidisciplinary assessment team cannot be recruited locally, get the proper authorisation (work permits, travel permits, vaccinations, etc.) for additional personnel from outside the country.
3. The assessment team should then plan the field assessment as follows: a. Define the terms of reference and the objectives of the assessment. b. Based on the nature of the emergency, determine the priorities to be considered. c. Select how and in what order the information will be gathered. If existing assessment checklists are to
be used, they must be carefully reviewed and adapted to the local situation. d. Design or adapt the forms for recording and analysing the information that is collected.All should
agree on how and when the information with be reported. e. Estimate the time frame and the resources needed (stationery, data processing tools, personnel) for
each stage of the assessment — training field staff and volunteers, collecting and analysing data. f. Assign specific tasks and responsibilities to each member of the assessment team.
Disaster Epidemiology 4-11
4. Inform all departments within the organisation that need to be directly involved with the assessment — logistics, finance, human resources, etc. and identify the person at headquarters who can be contacted from the field during the assessment.
5. Collect essential equipment — maps, first aid kits, etc.
6. Check the security situation in the field and make contact with local authorities and other organisations.
7. Ensure there is someone based locally to arrange the assessment team’s transportation, communication, accommodations, and meals.
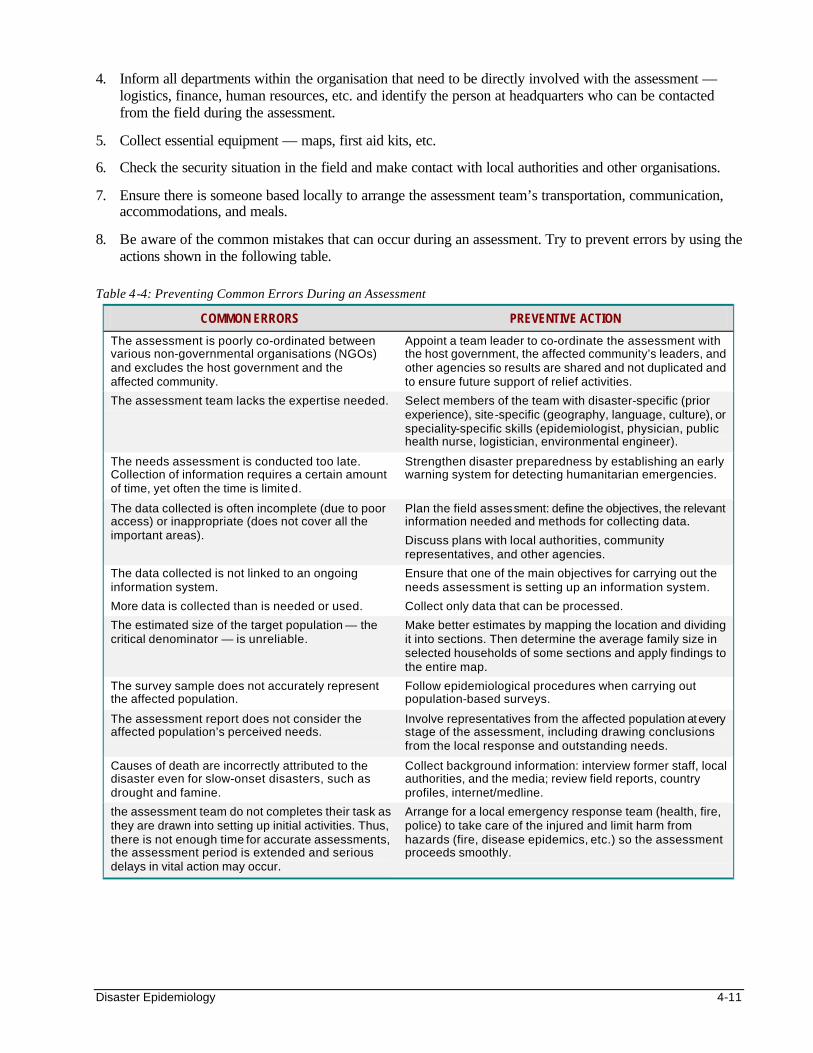
8. Be aware of the common mistakes that can occur during an assessment. Try to prevent errors by using the actions shown in the following table.
Table 4-4: Preventing Common Errors During an Assessment
COMMON ERRORS PREVENTIVE ACTION
The assessment is poorly co-ordinated between various non-governmental organisations (NGOs) and excludes the host government and the affected community.
Appoint a team leader to co-ordinate the assessment with the host government, the affected community’s leaders, and other agencies so results are shared and not duplicated and to ensure future support of relief activities.
The assessment team lacks the expertise needed. Select members of the team with disaster-specific (prior experience), site-specific (geography, language, culture), or speciality-specific skills (epidemiologist, physician, public health nurse, logistician, environmental engineer).
The needs assessment is conducted too late. Collection of information requires a certain amount of time, yet often the time is limited.
Strengthen disaster preparedness by establishing an early warning system for detecting humanitarian emergencies.
The data collected is often incomplete (due to poor access) or inappropriate (does not cover all the important areas).
Plan the field assessment: define the objectives, the relevant information needed and methods for collecting data.
Discuss plans with local authorities, community representatives, and other agencies.
The data collected is not linked to an ongoing information system.
More data is collected than is needed or used.
Ensure that one of the main objectives for carrying out the needs assessment is setting up an information system.
Collect only data that can be processed.
The estimated size of the target population — the critical denominator — is unreliable.
Make better estimates by mapping the location and dividing it into sections. Then determine the average family size in selected households of some sections and apply findings to the entire map.
The survey sample does not accurately represent the affected population.
Follow epidemiological procedures when carrying out population-based surveys.
The assessment report does not consider the affected population’s perceived needs.
Involve representatives from the affected population at every stage of the assessment, including drawing conclusions from the local response and outstanding needs.
Causes of death are incorrectly attributed to the disaster even for slow-onset disasters, such as drought and famine.
Collect background information: interview former staff, local authorities, and the media; review field reports, country profiles, internet/medline.
the assessment team do not completes their task as they are drawn into setting up initial activities. Thus, there is not enough time for accurate assessments, the assessment period is extended and serious delays in vital action may occur.
Arrange for a local emergency response team (health, fire, police) to take care of the injured and limit harm from hazards (fire, disease epidemics, etc.) so the assessment proceeds smoothly.
4-12 The Johns Hopkins and IFRC Public Health Guide for Emergencies
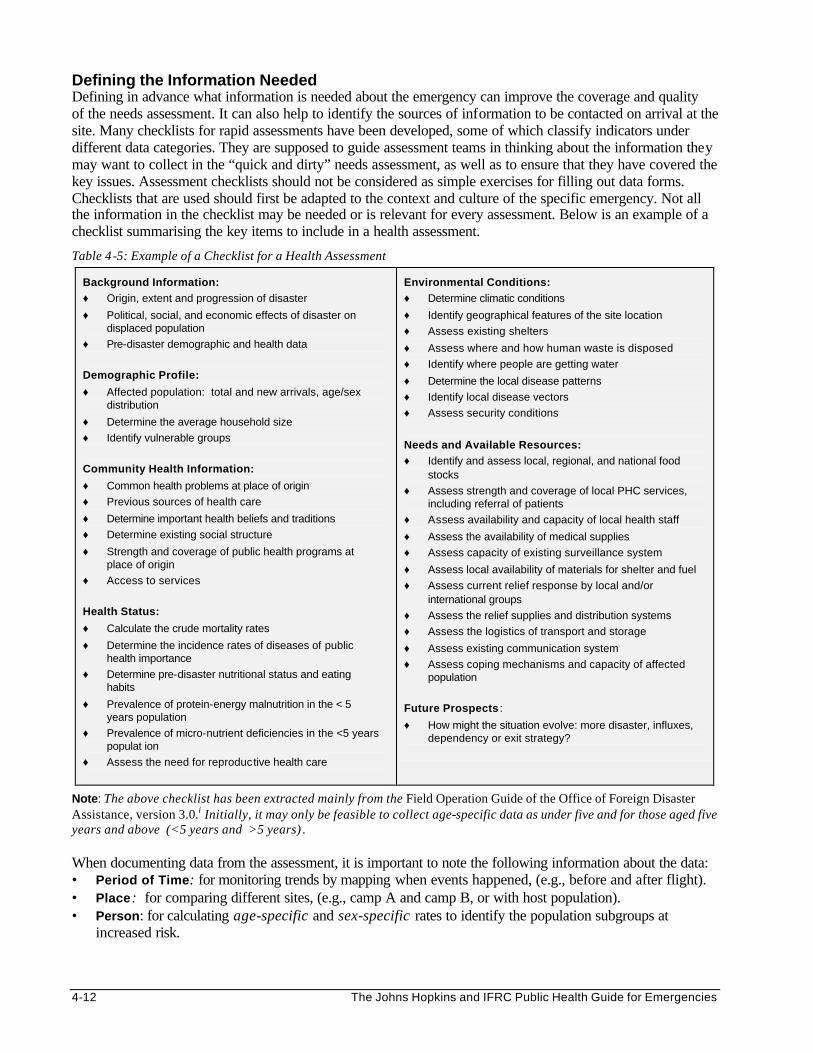
Defining the Information Needed Defining in advance what information is needed about the emergency can improve the coverage and quality of the needs assessment. It can also help to identify the sources of information to be contacted on arrival at the site. Many checklists for rapid assessments have been developed, some of which classify indicators under different data categories. They are supposed to guide assessment teams in thinking about the information they may want to collect in the “quick and dirty” needs assessment, as well as to ensure that they have covered the key issues. Assessment checklists should not be considered as simple exercises for filling out data forms. Checklists that are used should first be adapted to the context and culture of the specific emergency. Not all the information in the checklist may be needed or is relevant for every assessment. Below is an example of a checklist summarising the key items to include in a health assessment.
Table 4-5: Example of a Checklist for a Health Assessment
Background Information: ♦ Origin, extent and progression of disaster
♦ Political, social, and economic effects of disaster on displaced population
♦ Pre-disaster demographic and health data
Demographic Profile:
♦ Affected population: total and new arrivals, age/sex distribution
♦ Determine the average household size
♦ Identify vulnerable groups
Community Health Information:
♦ Common health problems at place of origin
♦ Previous sources of health care
♦ Determine important health beliefs and traditions
♦ Determine existing social structure
♦ Strength and coverage of public health programs at place of origin
♦ Access to services
Health Status:
♦ Calculate the crude mortality rates
♦ Determine the incidence rates of diseases of public health importance
♦ Determine pre-disaster nutritional status and eating habits
♦ Prevalence of protein-energy malnutrition in the < 5 years population
♦ Prevalence of micro-nutrient deficiencies in the <5 years populat ion
♦ Assess the need for reproductive health care
Environmental Conditions: ♦ Determine climatic conditions
♦ Identify geographical features of the site location
♦ Assess existing shelters
♦ Assess where and how human waste is disposed
♦ Identify where people are getting water
♦ Determine the local disease patterns
♦ Identify local disease vectors
♦ Assess security conditions
Needs and Available Resources: ♦ Identify and assess local, regional, and national food
stocks
♦ Assess strength and coverage of local PHC services, including referral of patients
♦ Assess availability and capacity of local health staff
♦ Assess the availability of medical supplies
♦ Assess capacity of existing surveillance system
♦ Assess local availability of materials for shelter and fuel
♦ Assess current relief response by local and/or international groups
♦ Assess the relief supplies and distribution systems
♦ Assess the logistics of transport and storage
♦ Assess existing communication system
♦ Assess coping mechanisms and capacity of affected population
Future Prospects :
♦ How might the situation evolve: more disaster, influxes, dependency or exit strategy?
Note: The above checklist has been extracted mainly from the Field Operation Guide of the Office of Foreign Disaster Assistance, version 3.0.i Initially, it may only be feasible to collect age-specific data as under five and for those aged five years and above (<5 years and >5 years) . When documenting data from the assessment, it is important to note the following information about the data: • Period of Time: for monitoring trends by mapping when events happened, (e.g., before and after flight). • Place: for comparing different sites, (e.g., camp A and camp B, or with host population). • Person: for calculating age-specific and sex-specific rates to identify the population subgroups at
increased risk.

Disaster Epidemiology 4-13
Sources and Methods for Collecting Data Good sources of information for the initial assessment may be identified according to the background information and the type of information needed. The camp administrator and the health workers are usually the most important sources of information. How the data will be collected during field assessment will depend on the nature of the emergency and the time and resources available for the assessment, including the skills of the assessment team. Data may be collected through quantitative as well as qualitative methods such as observation, reviewing existing records, key informant interviews, focus group discussions, and surveys. Possible sources and methods of collecting data in emergencies are summarised in the table below. (For more details on qualitative research methods, consult texts listed under References and Suggested Readings.)
Table 4-6: Sources of Information and Methods of Data Collection for a Rapid Needs Assessment
SOURCE * INFORMATION TO BE COLLECTED METHOD OF DATA
COLLECTION
Affected population Background information, pre-/post-disaster community health information, environmental conditions, needs and available resources, future prospects
Surveys, observation, mapping, interviews, focus groups
Host government authorities Background information, demographic profile of local and displaced population, needs and available resources, future prospects
Mapping, interviews, review census and survey reports (e.g., Demographic Health Survey)
Health authorities (local/central MOH)
Health status, environmental conditions, health policies, needs and available resources
Interviews, review registers, surveys, reports
Health facilities (MOH, private, NGO)
Health status of local (and perhaps displaced) populations, needs and available resources
Observation, interviews, review registers, surveys, reports
Humanitarian agencies (international & local), multi -lateral agencies (e.g., UN), media, internet web sites
Background information, pre-/post-disaster demographic and health status data, needs and available resources, future prospects
Interviews, review registers, surveys (e.g., Demographic Health Survey), situation reports
* Refer to the previous checklist for full details.
Conducting the Rapid Needs Assessment A needs assessment can be carried out by following the same logical sequence as individual patient assessments, which includes: briefly observing the patient on arrival, taking history (interview and review existing records), doing a physical examination, making an interim diagnosis, then planning a follow-up assessment if necessary. Similarly, after collecting the background information, the following steps may provide a logical approach to a field assessment:
1. Preliminary observation: Where possible, on approaching the site by vehicle or aircraft, try to assess the environment and extent of damage by the disaster and population displacement.
2. Interview officials from the local government, the public health sector, local organisations, volunteers, health workers and the affected community (leaders of different ethnic groups, women), etc. in order to: • confirm or update background information on the health needs and local response. • identify individuals or groups of people in life-threatening situations. • suggest during the interview, if possible, new approaches to disaster response.
3. Review existing records at the local or national level (host country, agencies, media, health facilities), including maps, aerial photos, census health data, etc. This will help establish baseline information on demography, the health status of the displaced and host populations, function and capacity of existing services (e.g., relevance of the health information system).
4-14 The Johns Hopkins and IFRC Public Health Guide for Emergencies
4. Detailed visual inspection while walking around the displaced community and surrounding areas to investigate rumours and gather valid impressions about the following: • The layout of the camp or settlement (from the highest level, e.g., on top of a hill, tree, or building),
the estimated number of people involved, the local infrastructure and the resources. • The living conditions: access to sanitation, water supply, food supply, and health services, and the
level of insecurity. • How much normal life and the social structure has been disrupted, the coping mechanisms of the
affected population, and any other issues of secondary priority (such as reproductive health needs and mental health).
5. Rapid surveys: Conduct “quick and dirty” surveys using convenience or cluster sampling of households to estimate the demographic profile, health status (includes immunisation status) and priority health problems.
6. Prepare a basis for ongoing health information: The assessment findings should be used to set up a health information system. Ongoing collection and analysis of information over time will refine the findings of the initial assessment. Population surveys may be organised soon after the assessment to: • provide valid base-line information, if this is missing • determine the priorities for the program (e.g., cholera prevention and control, selective feeding,
measles immunisation, etc.)
7. Preliminary analysis: A timely and careful analysis of the assessment findings is necessary to provide a basis for program planning. However, the skills or the resources to carry out a detailed analysis may not exist. Simple analysis procedures may be performed in the field, including summarising statistics, frequency tables, calculating percentages, rates, and plotting graphs. The results may be compared to normal reference values or standards and the conclusions can improve understanding of the disaster situation more accurately and help determine the appropriate response. For more details, please refer to the section on Data Analysis.
8. Report findings: After the analysis, an assessment report should be written as soon as possible and distributed to all who need to know. It is important to give feedback to everyone who participated in the assessment. The report should include information about the following: • The assessment • The disaster • The affected population • The local response and capacity • The external resources needed • The recommended actions
ESTIMATING POPULATION SIZE AND FAMILY SIZE Objectives of Estimating Population Size A reliable estimate of the total population size (including age and sex distribution), is important for the following reasons: • To be aware of the true population that is at risk of death and disease • To have a census for planning and political reasons (required by host authorities, donors, media, etc.) • To estimate the amount of basic needs required (food, water, shelter material) • To draw budgets for relief programs • To calculate the value of indicators for program monitoring and evaluation • To plan long-term solutions
Disaster Epidemiology 4-15
Different Methods for Estimation Estimates of the total population, the population of children aged less than five years or women of child-bearing age, etc., represent critical denominators that are required for calculating rates. The most critical denominator is the estimate of the total population. This estimate must be valid since it provides the basis for all planning in PHC programs. These estimates may exist from a prior registration exercise or census. However, they may be grossly unreliable (e.g., over-stated or under-stated). One may either accept the best available data or apply current epidemiological knowledge about the effects of similar disaster situations on the population structure. The ideal method for estimating the population size is by a census or a registration system, which can only be carried out several weeks or months after the relief operation has been established. Acute Emergency Situations Epidemiological procedures can be used to get better estimates of the population size and structure. For better estimation of the population size during the acute emergency phase, the following surveys or sampling methods can be used for the rapid assessment:
1. Water Usage: Determine the total amount of water the whole population in the camp consumes in one day. Then, interview a sample of people at their household or water collecting point to estimate the average amount of water used by each individual:
If 200,000 litres of water are consumed in one day and individual water usage is estimated as 20 L/person/day, the total population in the camp should be 200,000/20 = 10,000 people.
Note: The total food distributed and individual food baskets may be used to estimate the total population in the same way as water usage. However, these estimates should be interpreted carefully since food rations may be collected for sale or families may collect more than one ration.
2. Nutrition Screening: Screen and count a specified fraction of children under five years. In emergencies, the number of women, children and elderly is very high. Assuming that the under-five children make up about 20% of the total population, multiply the estimated fraction of under-five by 5 to estimate the fraction of the total population, and therefore, get the total population estimate.
Note: Mass immunisation campaigns can be used to estimate the population size in a similar manner, assuming that the immunisation coverage is 90% or more.
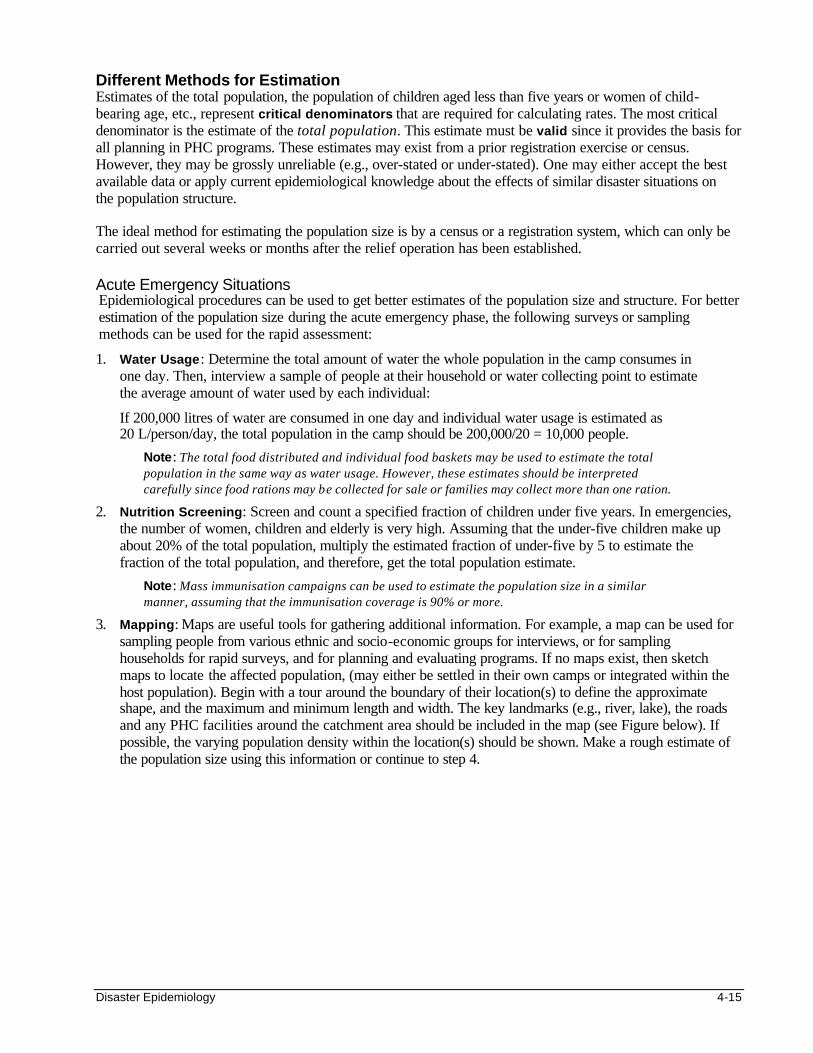
3. Mapping: Maps are useful tools for gathering additional information. For example, a map can be used for sampling people from various ethnic and socio-economic groups for interviews, or for sampling households for rapid surveys, and for planning and evaluating programs. If no maps exist, then sketch maps to locate the affected population, (may either be settled in their own camps or integrated within the host population). Begin with a tour around the boundary of their location(s) to define the approximate shape, and the maximum and minimum length and width. The key landmarks (e.g., river, lake), the roads and any PHC facilities around the catchment area should be included in the map (see Figure below). If possible, the varying population density within the location(s) should be shown. Make a rough estimate of the population size using this information or continue to step 4.

4-16 The Johns Hopkins and IFRC Public Health Guide for Emergencies
Note: The legends (symbols and colours representing structures and boundaries) should be consistent and recognisable for all maps. Maps of sub-catchment areas may also be drawn, to show varying target groups for different PHC services.
4. Determining the Population’s Size and Composition: Divide the entire map into sections containing
approximately equal numbers of households. To estimate the number of households in the entire location, count the number of households (shelters or cooking fires) in a typical section and multiply this by the total number of sections. Then, carry out convenience sampling and select a reasonable number of households (e.g., 50) that can be easily reached. Record the number of persons living in each household, including their age and sex breakdown. Calculate the average number of persons per household and multiply this by the total number of households. The age-sex pyramid can be plotted to show the estimated population structure (see Data Analysis section for an example an of age-sex pyramid).
Note: The above-mentioned convenience (or non-probability) sampling is useful for making crude estimates of the population size/composition and possibly for identifying the immediate health needs during the rapid assessment. Results from convenience sampling are biased and not representative of the entire population. They cannot be used for comparison with results of other surveys. Where possible, probability sampling surveys should be organised as soon as possible to obtain more reliable results. See section on Population Surveys for details on probability sampling methods.
Chronic Emergency Situations To estimate population size during chronic emergency situations, other techniques may be used if the information from census or registration exercises is unreliable:
1. Participatory Mapping of the catchment area may be done by inviting a group of the affected population to sketch a map of the entire community on the ground or on a large paper. They should first be asked to define the physical boundaries of the location of the affected community (see Figure 4-1 above) and the location of all key landmarks (e.g., rivers or lakes, roads, health facilities/services, water pumps, cemeteries, etc). Distances should be shown as accurately as possible. They should be asked to identify where different ethnic communities and the most vulnerable group(s) (e.g., the poorest or most malnourished) are located in the map of the catchment area.
Figure 4-1: Map of Catchment Area
Host Population
Food warehouse
Health centre
Health post
District Hospital
Water tank
Well
Lake
boundary
Road
Disaster Epidemiology 4-17
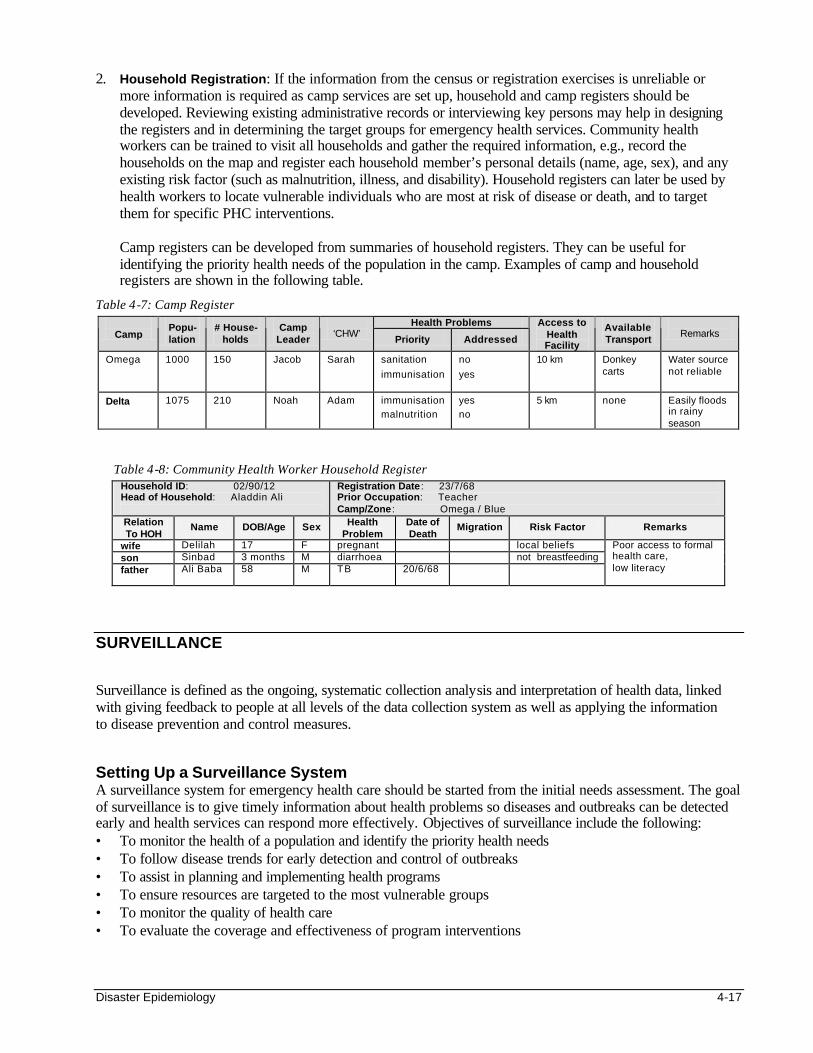
2. Household Registration: If the information from the census or registration exercises is unreliable or more information is required as camp services are set up, household and camp registers should be developed. Reviewing existing administrative records or interviewing key persons may help in designing the registers and in determining the target groups for emergency health services. Community health workers can be trained to visit all households and gather the required information, e.g., record the households on the map and register each household member’s personal details (name, age, sex), and any existing risk factor (such as malnutrition, illness, and disability). Household registers can later be used by health workers to locate vulnerable individuals who are most at risk of disease or death, and to target them for specific PHC interventions.
Camp registers can be developed from summaries of household registers. They can be useful for identifying the priority health needs of the population in the camp. Examples of camp and household registers are shown in the following table.
Table 4-7: Camp Register Health Problems
Camp Popu-lation
# House- holds
Camp Leader
‘CHW’
Priority Addressed
Access to Health Facility
Available Transport
Remarks
Omega 1000 150 Jacob Sarah sanitation
immunisation
no
yes
10 km Donkey carts
Water source not reliable
Delta 1075 210 Noah Adam immunisation malnutrition
yes no
5 km none Easily floods in rainy season
Table 4-8: Community Health Worker Household Register Household ID: 02/90/12 Head of Household: Aladdin Ali
Registration Date : 23/7/68 Prior Occupation: Teacher Camp/Zone : Omega / Blue
Relation To HOH
Name DOB/Age Sex Health Problem
Date of Death
Migration Risk Factor Remarks
wife Delilah 17 F pregnant local beliefs son Sinbad 3 months M diarrhoea not breastfeeding father Ali Baba 58 M TB 20/6/68
Poor access to formal health care, low literacy
SURVEILLANCE Surveillance is defined as the ongoing, systematic collection analysis and interpretation of health data, linked with giving feedback to people at all levels of the data collection system as well as applying the information to disease prevention and control measures. Setting Up a Surveillance System A surveillance system for emergency health care should be started from the initial needs assessment. The goal of surveillance is to give timely information about health problems so diseases and outbreaks can be detected early and health services can respond more effectively. Objectives of surveillance include the following: • To monitor the health of a population and identify the priority health needs • To follow disease trends for early detection and control of outbreaks • To assist in planning and implementing health programs • To ensure resources are targeted to the most vulnerable groups • To monitor the quality of health care • To evaluate the coverage and effectiveness of program interventions
4-18 The Johns Hopkins and IFRC Public Health Guide for Emergencies
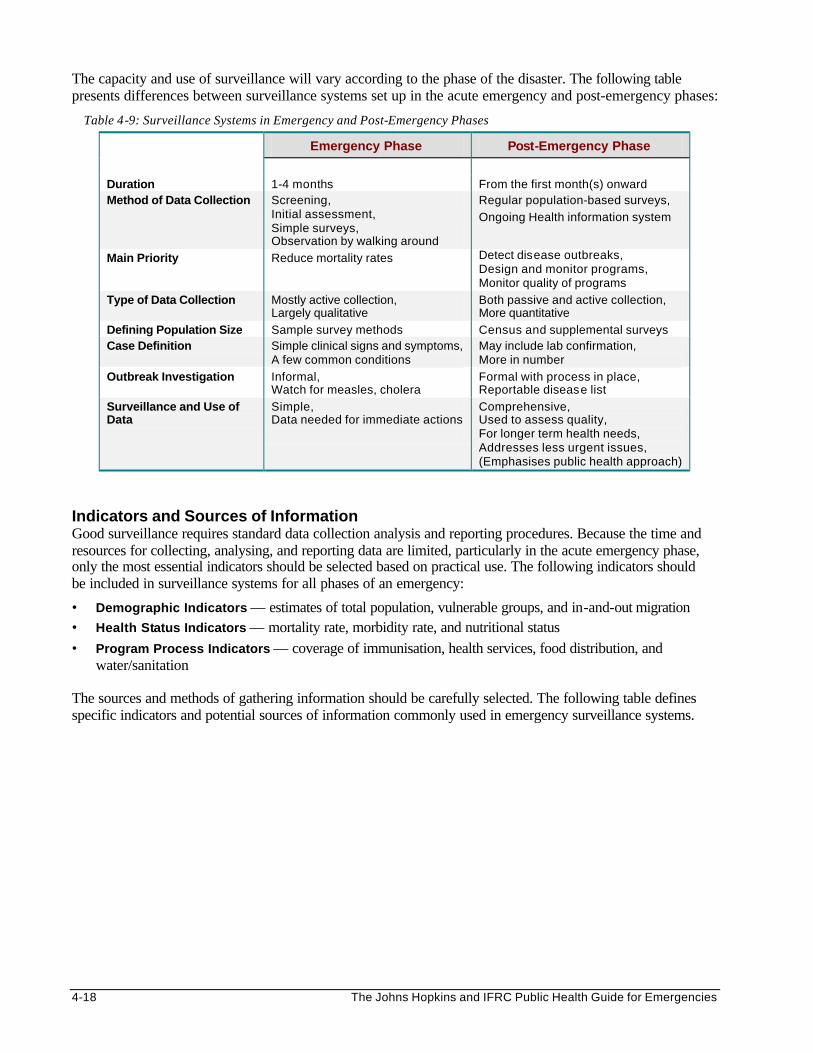
The capacity and use of surveillance will vary according to the phase of the disaster. The following table presents differences between surveillance systems set up in the acute emergency and post-emergency phases:
Table 4-9: Surveillance Systems in Emergency and Post-Emergency Phases
Emergency Phase Post-Emergency Phase
Duration 1-4 months From the first month(s) onward Method of Data Collection Screening,
Initial assessment, Simple surveys, Observation by walking around
Regular population-based surveys,
Ongoing Health information system
Main Priority Reduce mortality rates Detect disease outbreaks, Design and monitor programs, Monitor quality of programs
Type of Data Collection Mostly active collection, Largely qualitative
Both passive and active collection, More quantitative
Defining Population Size Sample survey methods Census and supplemental surveys Case Definition Simple clinical signs and symptoms,
A few common conditions May include lab confirmation, More in number
Outbreak Investigation Informal, Watch for measles, cholera
Formal with process in place, Reportable disease list
Surveillance and Use of Data
Simple, Data needed for immediate actions
Comprehensive, Used to assess quality, For longer term health needs, Addresses less urgent issues, (Emphasises public health approach)
Indicators and Sources of Information Good surveillance requires standard data collection analysis and reporting procedures. Because the time and resources for collecting, analysing, and reporting data are limited, particularly in the acute emergency phase, only the most essential indicators should be selected based on practical use. The following indicators should be included in surveillance systems for all phases of an emergency:
• Demographic Indicators — estimates of total population, vulnerable groups, and in-and-out migration • Health Status Indicators — mortality rate, morbidity rate, and nutritional status • Program Process Indicators — coverage of immunisation, health services, food distribution, and
water/sanitation The sources and methods of gathering information should be carefully selected. The following table defines specific indicators and potential sources of information commonly used in emergency surveillance systems.

Disaster Epidemiology 4-19
Table 4-10: Surveillance Indicators and Sources of Information
Surveillance Indicators Sources of Information
Demographic • Total population • Population structure (age, sex) • Rate of migration (new arrivals, departures) • Identification of vulnerable groups • Births
Registration records, Population census, CHW reports
Mortality* • Crude mortality rate (CMR) • Age-specific Mortality Rate (<5, >5) • Cause-specific mortality • Case fatality rate (CFR)
Hospital death registers, Religious leaders, Community reporters (including CHWs), Burial shroud distribution, Burial contractors, Graveyards, Camp administration
Morbidity 1. Routine 2. Outbreaks (daily)
• Incidence rate (new cases) • Prevalence rate (total existing cases) • Age-/sex-specific morbidity rate • Proportional morbidity rate
Outpatient and admission records, Laboratories Feeding centre(s) records, Community health worker records
Nutrition (Frequent surveys while malnutrition rate is high)
• Global malnutrition rate • Severe malnutrition rate • Rate of weight gain/loss in MCH clinics • Incidence of micro-nutrient deficiency
disorders • Incidence of low birth weight • Average daily ration • Delayed age of menarche
Nutrition surveys MCH clinic records Feeding centre records Birth registers Camp administration
Program Process
• Feeding centre enrollment and attendance • Water and sanitation (quantity, quality,
access) • Immunisation coverage • Maternal health coverage (ANC, assisted
deliveries, PNC) • Outpatient and inpatient attendance • ORS distribution
Facility records, Immunisation surveys (annual), Traditional birth attendant records
*Note: The mortality or death rate is the most important indicator of serious stress affecting a displaced population. Death rates in acute emergency situations have been known to exceed 5-60 times that of normal situations. However, measuring this critical indicator during emergency situations may be difficult because data from death registers of health facilities may be incomplete and other methods of data collection must be considered (e.g., hiring graveyard monitors, interviewing grave-diggers and shroud distributors, and doing community surveys). Each method or sources of gathering information should be evaluated for quality and reliability.
Alternatives to Surveillance Surveillance systems are often biased because they collect information passively, i.e., mainly focus on people who use existing services. Other methods of gathering information are necessary for detecting health problems and cases occurring outside the existing facilities. Following are other methods of collecting information:

4-20 The Johns Hopkins and IFRC Public Health Guide for Emergencies
1. Community Surveillance In community surveillance, a limited amount of health information is gathered directly from the community (e.g., new cases with a common disease). This may require training of health workers to recognise and manage cases according to their diagnostic skills. Broad case definitions can help community outreach workers to recognise and refer all possible cases to health facilities. Qualified health workers in higher levels of the emergency health system can be trained to use more specific (but less sensitive) case definitions, which may require laboratory confirmation. This will ensure the surveillance system does not miss any person that is a probable or definite case with a communicable disease. The table below gives examples of case definitions that may be appropriate for workers at different levels of a primary health care program.
Table 4-11: Case Definitions from Home to Hospital
Diagnosis
LEVEL OF CARE
Possible Case
HOME
Probable Case
FIRST LEVEL FACILITY
Definite Case
HOSPITAL
MALARIA Fever only Fever + periodic shaking + chills Positive slide for malaria parasites
MEASLES Fever only Fever + rash Fever + rash + cough or Koplik’s spots
Disease surveillance can be improved by encouraging the use of standard case definitions for diagnosing and managing patients and recording data in health facility registers. All patient and hospital records may be monitored regularly to ensure that the recorded diagnosis accurately represents the patient’s condition.
Note: Cases diagnosed at different levels of care should be analysed separately. 2. Surveys
Sometimes it is necessary to organise focused assessments to gather information that is not immediately available through the existing surveillance system. For details on surveys, refer to the next section on Population Surveys. Key differences between surveys and surveillance are described in the following table:
Table 4-12: Differences Between Surveys and Surveillance
SURVEYS SURVEILLANCE
Intermittent, focused assessments that collect population-based health data (active).
Ongoing, systematic collection, analysis, and interpretation of facility-based data (mainly passive).
Collect information on demography, morbidity, mortality, nutritional status (acute malnutrition) and program indicators (e.g., EPI, ANC, SFP, use of health services).
Collect information on demography, morbidity, mortality, births, nutritional (micro-nutrient deficiencies), health services and environmental health indicators.
May be limited to concerned agency/facility. Should involve all health agencies and facilities.
With appropriate sampling, allows for filling of information gaps in community-level data.
Captures those who attend facility-based services, therefore not representative of all needy groups.
Requires more time and resources to organise, but is a one-time cost only.
Less costly since integrated within routine services and the existing system.
3. Outbreak Investigation
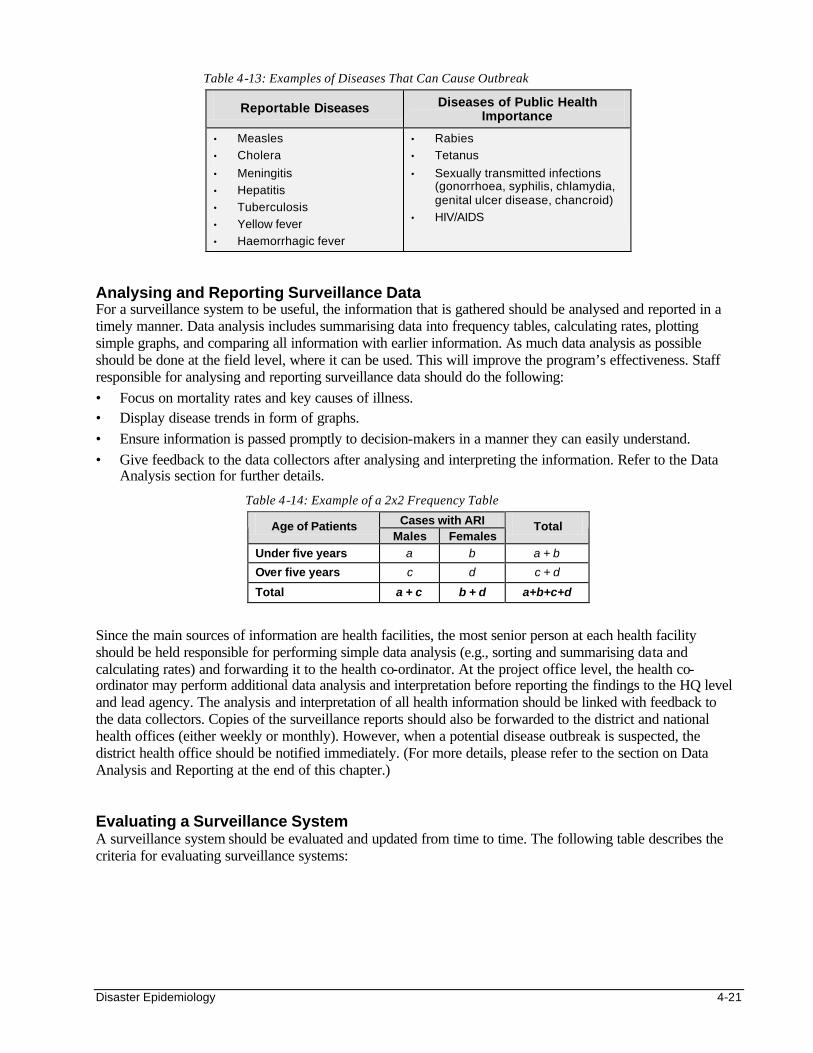
A surveillance system should be sensitive enough to pick up the first few cases with diseases that have epidemic potential (see table below). This can be achieved by training all data collectors to recognise cases with reportable diseases. In addition, they should be given guidelines for immediate reporting of a suspected disease outbreak. All reports should prompt immediate action by concerned health authorities, beginning with a preliminary investigation to confirm whether there really is an outbreak. (Refer to the section on Outbreak Investigation for further details).
Disaster Epidemiology 4-21
Table 4-13: Examples of Diseases That Can Cause Outbreak
Reportable Diseases Diseases of Public Health Importance
• Measles
• Cholera
• Meningitis
• Hepatitis
• Tuberculosis
• Yellow fever
• Haemorrhagic fever
• Rabies
• Tetanus
• Sexually transmitted infections (gonorrhoea, syphilis, chlamydia, genital ulcer disease, chancroid)
• HIV/AIDS
Analysing and Reporting Surveillance Data For a surveillance system to be useful, the information that is gathered should be analysed and reported in a timely manner. Data analysis includes summarising data into frequency tables, calculating rates, plotting simple graphs, and comparing all information with earlier information. As much data analysis as possible should be done at the field level, where it can be used. This will improve the program’s effectiveness. Staff responsible for analysing and reporting surveillance data should do the following: • Focus on mortality rates and key causes of illness. • Display disease trends in form of graphs. • Ensure information is passed promptly to decision-makers in a manner they can easily understand. • Give feedback to the data collectors after analysing and interpreting the information. Refer to the Data
Analysis section for further details.
Table 4-14: Example of a 2x2 Frequency Table
Cases with ARI Age of Patients Males Females
Total
Under five years a b a + b
Over five years c d c + d
Total a + c b + d a+b+c+d
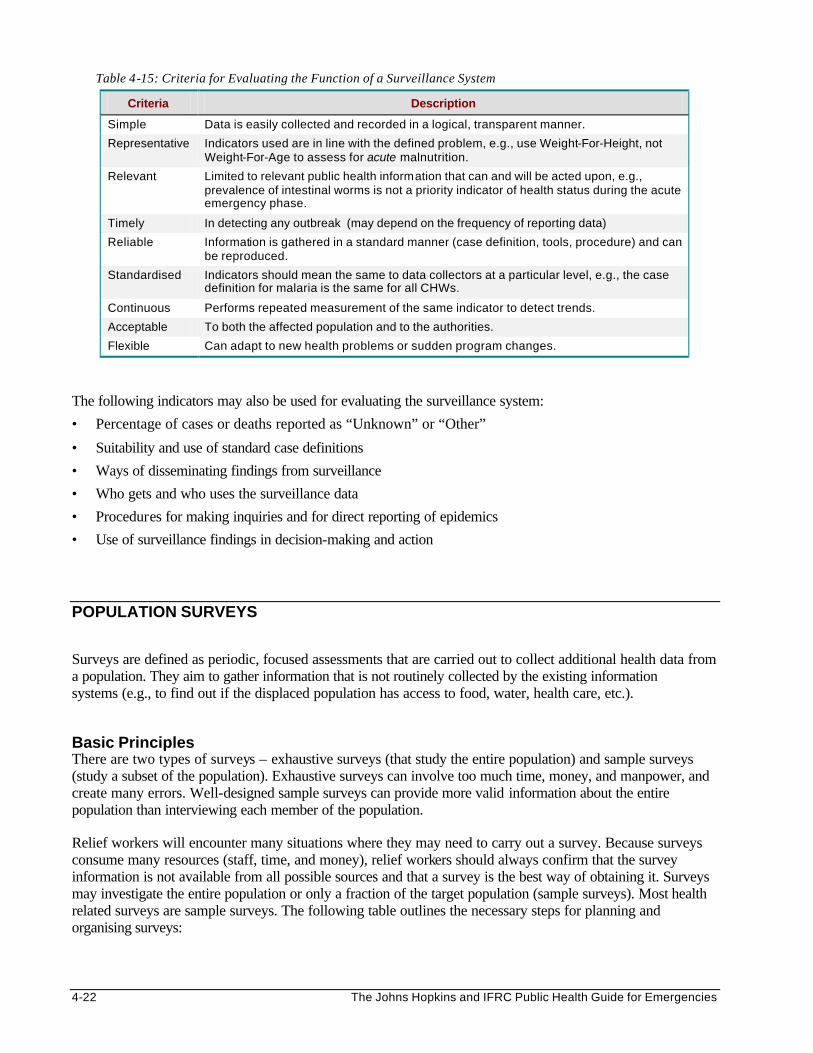
Since the main sources of information are health facilities, the most senior person at each health facility should be held responsible for performing simple data analysis (e.g., sorting and summarising data and calculating rates) and forwarding it to the health co-ordinator. At the project office level, the health co-ordinator may perform additional data analysis and interpretation before reporting the findings to the HQ level and lead agency. The analysis and interpretation of all health information should be linked with feedback to the data collectors. Copies of the surveillance reports should also be forwarded to the district and national health offices (either weekly or monthly). However, when a potential disease outbreak is suspected, the district health office should be notified immediately. (For more details, please refer to the section on Data Analysis and Reporting at the end of this chapter.) Evaluating a Surveillance System A surveillance system should be evaluated and updated from time to time. The following table describes the criteria for evaluating surveillance systems:
4-22 The Johns Hopkins and IFRC Public Health Guide for Emergencies
Table 4-15: Criteria for Evaluating the Function of a Surveillance System
Criteria Description
Simple Data is easily collected and recorded in a logical, transparent manner.
Representative Indicators used are in line with the defined problem, e.g., use Weight-For-Height, not Weight-For-Age to assess for acute malnutrition.
Relevant Limited to relevant public health information that can and will be acted upon, e.g., prevalence of intestinal worms is not a priority indicator of health status during the acute emergency phase.
Timely In detecting any outbreak (may depend on the frequency of reporting data)
Reliable Information is gathered in a standard manner (case definition, tools, procedure) and can be reproduced.
Standardised Indicators should mean the same to data collectors at a particular level, e.g., the case definition for malaria is the same for all CHWs.
Continuous Performs repeated measurement of the same indicator to detect trends.
Acceptable To both the affected population and to the authorities.
Flexible Can adapt to new health problems or sudden program changes.
The following indicators may also be used for evaluating the surveillance system:
• Percentage of cases or deaths reported as “Unknown” or “Other”
• Suitability and use of standard case definitions
• Ways of disseminating findings from surveillance
• Who gets and who uses the surveillance data
• Procedures for making inquiries and for direct reporting of epidemics
• Use of surveillance findings in decision-making and action
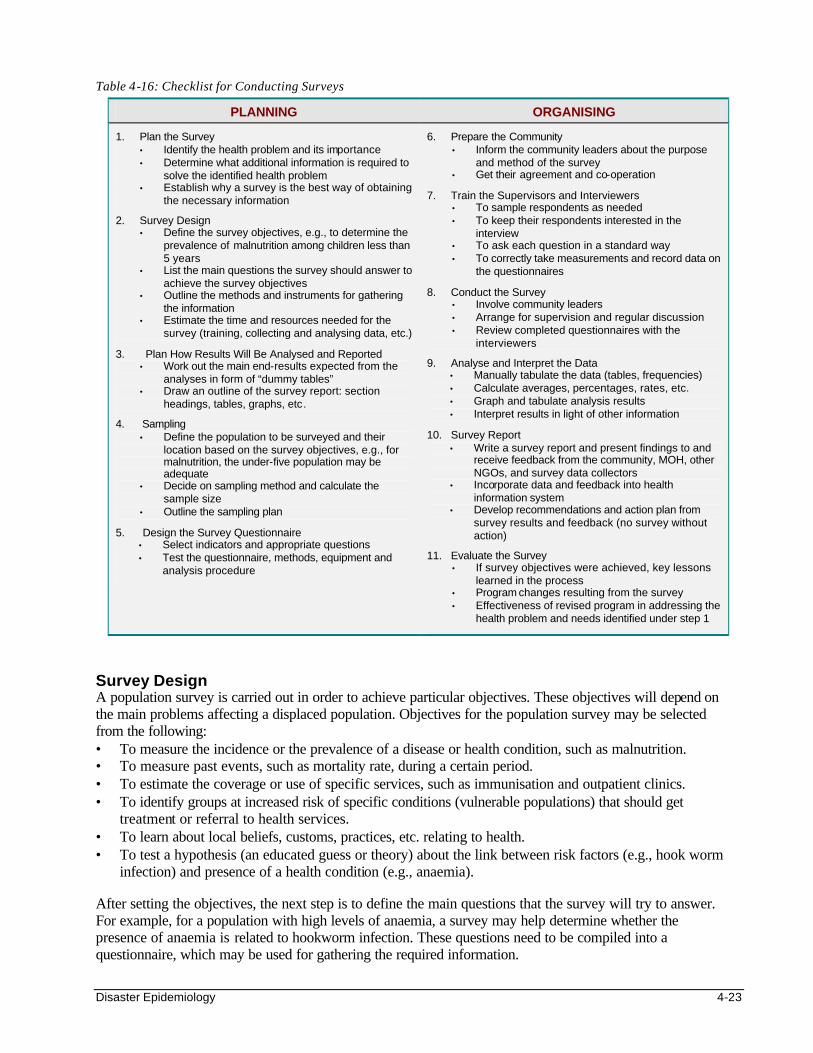
POPULATION SURVEYS Surveys are defined as periodic, focused assessments that are carried out to collect additional health data from a population. They aim to gather information that is not routinely collected by the existing information systems (e.g., to find out if the displaced population has access to food, water, health care, etc.). Basic Principles There are two types of surveys – exhaustive surveys (that study the entire population) and sample surveys (study a subset of the population). Exhaustive surveys can involve too much time, money, and manpower, and create many errors. Well-designed sample surveys can provide more valid information about the entire population than interviewing each member of the population. Relief workers will encounter many situations where they may need to carry out a survey. Because surveys consume many resources (staff, time, and money), relief workers should always confirm that the survey information is not available from all possible sources and that a survey is the best way of obtaining it. Surveys may investigate the entire population or only a fraction of the target population (sample surveys). Most health related surveys are sample surveys. The following table outlines the necessary steps for planning and organising surveys:
Disaster Epidemiology 4-23
Table 4-16: Checklist for Conducting Surveys
PLANNING ORGANISING
1. Plan the Survey • Identify the health problem and its importance • Determine what additional information is required to
solve the identified health problem • Establish why a survey is the best way of obtaining
the necessary information
2. Survey Design • Define the survey objectives, e.g., to determine the
prevalence of malnutrition among children less than 5 years
• List the main questions the survey should answer to achieve the survey objectives
• Outline the methods and instruments for gathering the information
• Estimate the time and resources needed for the survey (training, collecting and analysing data, etc.)
3. Plan How Results Will Be Analysed and Reported • Work out the main end-results expected from the
analyses in form of “dummy tables” • Draw an outline of the survey report: section
headings, tables, graphs, etc.
4. Sampling • Define the population to be surveyed and their
location based on the survey objectives, e.g., for malnutrition, the under-five population may be adequate
• Decide on sampling method and calculate the sample size
• Outline the sampling plan
5. Design the Survey Questionnaire • Select indicators and appropriate questions • Test the questionnaire, methods, equipment and
analysis procedure
6. Prepare the Community • Inform the community leaders about the purpose
and method of the survey • Get their agreement and co-operation
7. Train the Supervisors and Interviewers • To sample respondents as needed • To keep their respondents interested in the
interview • To ask each question in a standard way • To correctly take measurements and record data on
the questionnaires
8. Conduct the Survey • Involve community leaders • Arrange for supervision and regular discussion • Review completed questionnaires with the
interviewers
9. Analyse and Interpret the Data • Manually tabulate the data (tables, frequencies) • Calculate averages, percentages, rates, etc. • Graph and tabulate analysis results • Interpret results in light of other information
10. Survey Report • Write a survey report and present findings to and
receive feedback from the community, MOH, other NGOs, and survey data collectors
• Incorporate data and feedback into health information system
• Develop recommendations and action plan from survey results and feedback (no survey without action)
11. Evaluate the Survey • If survey objectives were achieved, key lessons
learned in the process • Program changes resulting from the survey • Effectiveness of revised program in addressing the
health problem and needs identified under step 1
Survey Design A population survey is carried out in order to achieve particular objectives. These objectives will depend on the main problems affecting a displaced population. Objectives for the population survey may be selected from the following: • To measure the incidence or the prevalence of a disease or health condition, such as malnutrition. • To measure past events, such as mortality rate, during a certain period. • To estimate the coverage or use of specific services, such as immunisation and outpatient clinics. • To identify groups at increased risk of specific conditions (vulnerable populations) that should get
treatment or referral to health services. • To learn about local beliefs, customs, practices, etc. relating to health. • To test a hypothesis (an educated guess or theory) about the link between risk factors (e.g., hook worm
infection) and presence of a health condition (e.g., anaemia). After setting the objectives, the next step is to define the main questions that the survey will try to answer. For example, for a population with high levels of anaemia, a survey may help determine whether the presence of anaemia is related to hookworm infection. These questions need to be compiled into a questionnaire, which may be used for gathering the required information.

4-24 The Johns Hopkins and IFRC Public Health Guide for Emergencies
Planning the Analysis and Reporting How information from a population survey will be analysed and reported should be determined early in the planning stage. “Dummy tables” are useful for summarising survey findings, as shown below. Figure 4-2: Examples of Dummy Tables for Hookworm Survey
Distribution of Hookworm Infected People by Age and Sex
Cases with Hookworm Infection Age of Patients Males Females
Total
Under five years
Over five years
Total
Distribution of Hookworm-Infected Cases by Levels of Haemoglobin
Hookworm Infection
Haemoglobin Level Present Absent
Total
% with Hookworm
Less than 10 g%
10g % or more
Total
% with anaemia
Estimating Sample Size Table 4-17: Estimating Sample Size
Estimating Sample Size for Simple Random or Systematic Sampling
Estimating Sample Size for Cluster Sampling
N = Z2pq
d2 • N = size of sample • Z = level of statistical certainty chosen, or
confidence interval: 95% => Z = 1.96; 90% => Z = 1.68 value of z usually rounded to 2 • d = degree of accuracy desired = half the
confidence interval • p = estimated level/prevalence/coverage rate
being investigated. (When in doubt, use 50% for maximum sample size.)
• q = 1 – p Example: To calculate the largest sample within a 10% margin of error and confidence limits of 95% (z = 1.96): N = (1.96)2 (0.5) 2 = 3.84 x 0.25 = 96 (0.1) 2 0.01 Note: Confidence interval is the range of values obtained from the sample survey between which we are 95% confident that the true value in the overall population lies. EPI-INFOii: the above calculations can easily be performed using the STATCALC function.
N = 2 (Z2pq)
d2 Because this type of sampling has some degree of selection bias, one should approximately double the sample size. Doubling would maintain the same degree of precision as simple random sampling:
• N = 2 X 96 = 192
• The WHO immunisation coverage survey uses a minimum of 7 subjects per cluster (7 x 30 clusters = 210, which is greater than 192).
• The rapid KPC 30-cluster survey (of Child Survival Projects) uses a sample s ize of 300 (10 per cluster) to ensure that sub-samples are large enough to obtain management type information within statistical margins adequate for making management and program decisions.
Note: A cluster sample is recommended for collecting information on a condition that is common. It does not give sufficiently accurate estimates for rare conditions.
Disaster Epidemiology 4-25
The above table shows formulas for calculating the appropriate sample sizes for different sampling methods. In general, the larger the sample, the more reliable will be the estimated results of the entire population. Therefore, the size of a selected sample should be large enough to give reliable estimates, but not so large that it wastes limited resources. A sample size of 100-200 randomly selected individuals from a population of up to 20,000 is usually adequate to assess for a common condition. However, a larger sample size is needed when greater accuracy is required or to investigate conditions that have a low prevalence (e.g., maternal deaths).
Note: Sample size tables in standard statistics textbooks may be used to determine the actual sample size needed. Sampling Methods Sampling is defined as the selection of a specified number of persons in a population for study with the hope that they are representative, i.e. the characteristics of the sampled population (study population) are similar to the population from which it is drawn (reference population). In probability sampling, every person in the target population has the same known (and non-zero) chance of being included in the survey. It allows investigators to form conclusions about a reference population based on information collected only from a subset of the population. Probability sampling therefore enables the collection of reliable information at a minimal cost. Results from these surveys can also be compared with results of similar surveys performed in another time, place or population. The following are probability sampling methods: 1. Simple Random Sampling:
• Begin by constructing the sampling frame. List every sampling unit (persons, household, village, etc.) from which the sample is to be drawn.
• Randomly select the required number of units from the sampling frame by drawing lots or using a table of random numbers.
Note: This method is more likely to produce a representative sample, but it can be expensive and difficult to make a sampling frame where a population is scattered.
2. Systematic Sampling:
• Begin by randomly selecting the starting unit, in order to fulfil statistical requirements in systematic selection.
• The next sampling units are systematically selected by adding a certain number “n” (e.g., 10, 20, 50 depending on the sample size relative to the total population) to the starting unit.
Note: A systematic sample can be drawn without an initial listing (e.g., choose from a line of people or according to the time patients enter a clinic.
3. Cluster Sampling: The following is a description of two-stage sampling, which may be extended to more
stages of sampling if needed. Cluster sampling begins with a list of clusters (community or administrative subdivisions, e.g., sub-location, village, zone, plot, etc.). For the first stage, a certain number of clusters (usually 30) are randomly selected, based on the cumulative frequency distribution of a population. For the second stage, a specific number of sub-units (a minimum of 7) are randomly selected within each selected cluster.
• Determine the direction line by spinning a bottle on the ground.
• The starting sub-unit (e.g. household) is randomly selected by picking a random number between 1 and the total number of households along the direction line between the geographical centre (e.g. market, mosque, church) and the cluster boundary.
• Subsequent households may either be the nearest household from the entrance of the one just sampled or every nth household (where the sampling frequency may be the total number of households along the direction line, divided by the required number of subjects per cluster, (e.g., 7).
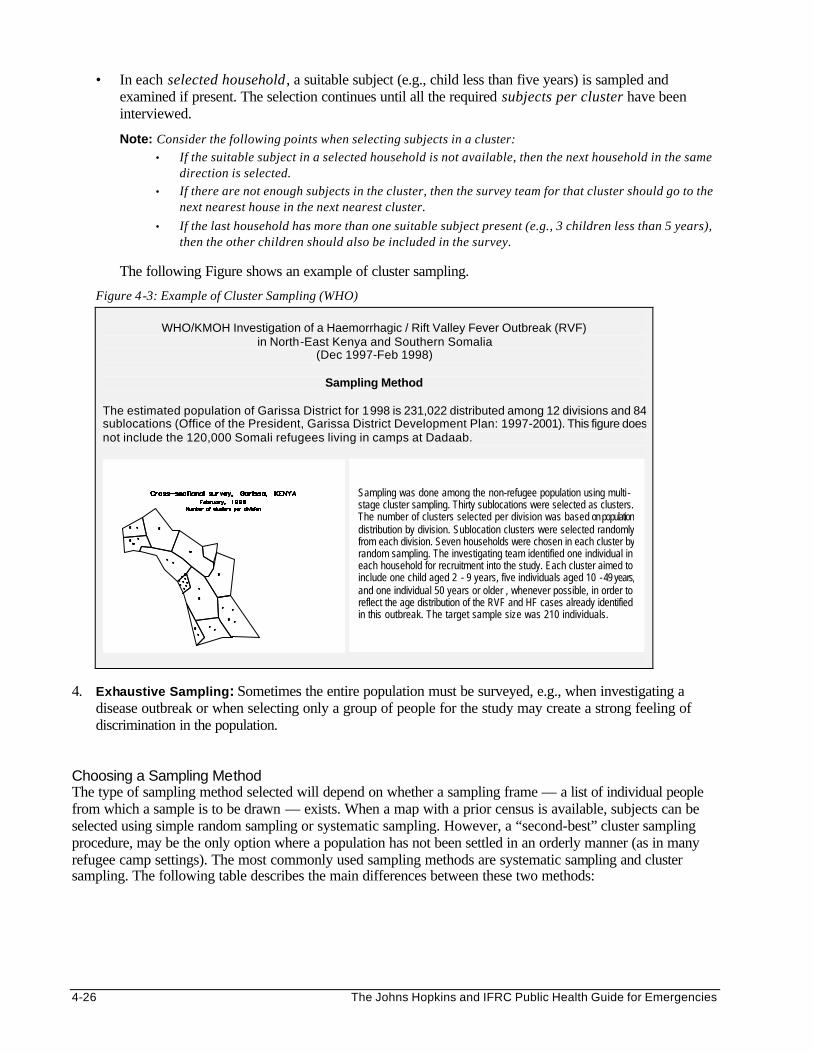
4-26 The Johns Hopkins and IFRC Public Health Guide for Emergencies
• In each selected household , a suitable subject (e.g., child less than five years) is sampled and examined if present. The selection continues until all the required subjects per cluster have been interviewed.
Note: Consider the following points when selecting subjects in a cluster: • If the suitable subject in a selected household is not available, then the next household in the same
direction is selected. • If there are not enough subjects in the cluster, then the survey team for that cluster should go to the
next nearest house in the next nearest cluster.
• If the last household has more than one suitable subject present (e.g., 3 children less than 5 years), then the other children should also be included in the survey.
The following Figure shows an example of cluster sampling.
Figure 4-3: Example of Cluster Sampling (WHO)
WHO/KMOH Investigation of a Haemorrhagic / Rift Valley Fever Outbreak (RVF) in North-East Kenya and Southern Somalia
(Dec 1997-Feb 1998)
Sampling Method
The estimated population of Garissa District for 1998 is 231,022 distributed among 12 divisions and 84 sublocations (Office of the President, Garissa District Development Plan: 1997-2001). This figure does not include the 120,000 Somali refugees living in camps at Dadaab.
4. Exhaustive Sampling: Sometimes the entire population must be surveyed, e.g., when investigating a
disease outbreak or when selecting only a group of people for the study may create a strong feeling of discrimination in the population.
Choosing a Sampling Method The type of sampling method selected will depend on whether a sampling frame — a list of individual people from which a sample is to be drawn — exists. When a map with a prior census is available, subjects can be selected using simple random sampling or systematic sampling. However, a “second-best” cluster sampling procedure, may be the only option where a population has not been settled in an orderly manner (as in many refugee camp settings). The most commonly used sampling methods are systematic sampling and cluster sampling. The following table describes the main differences between these two methods:
Sampling was done among the non-refugee population using multi -stage cluster sampling. Thirty sublocations were selected as clusters. The number of clusters selected per division was based on population distribution by division. Sublocation clusters were selected randomly from each division. Seven households were chosen in each cluster by random sampling. The investigating team identified one individual in each household for recruitment into the study. Each cluster aimed to include one child aged 2 - 9 years, five individuals aged 10 - 49 years, and one individual 50 years or older , whenever possible, in order to reflect the age distribution of the RVF and HF cases already identified in this outbreak. The target sample size was 210 individuals.
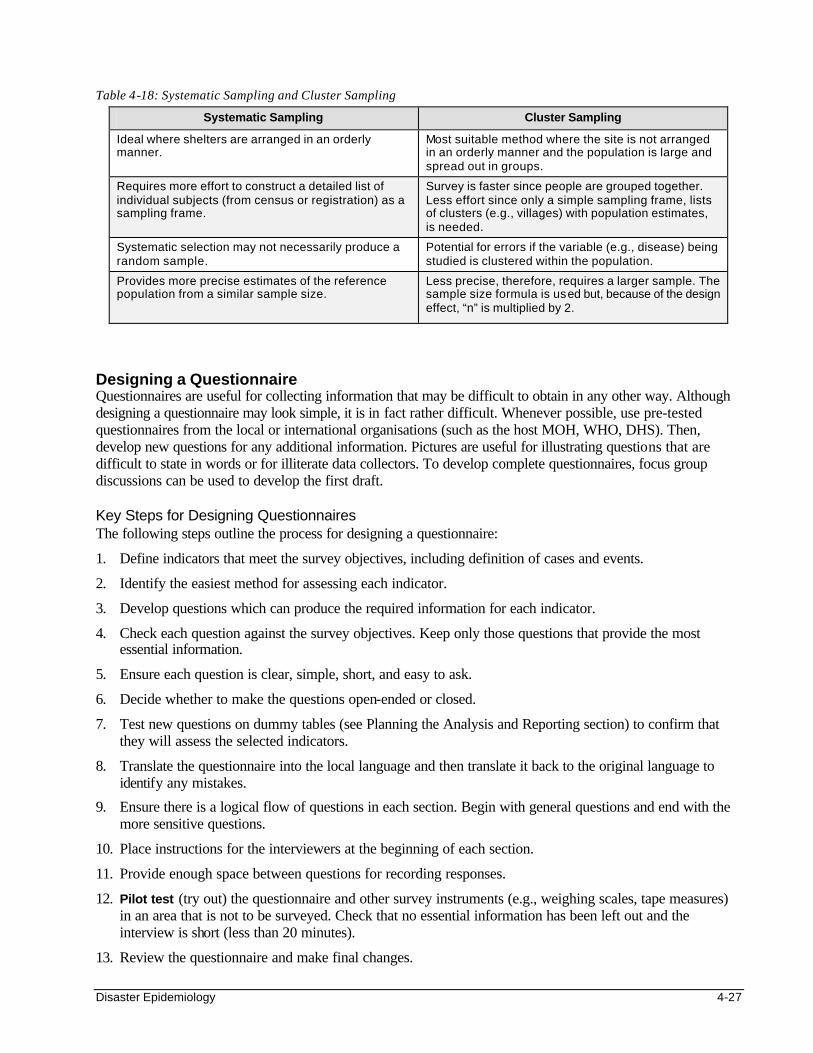
Disaster Epidemiology 4-27
Table 4-18: Systematic Sampling and Cluster Sampling
Systematic Sampling Cluster Sampling
Ideal where shelters are arranged in an orderly manner.
Most suitable method where the site is not arranged in an orderly manner and the population is large and spread out in groups.
Requires more effort to construct a detailed list of individual subjects (from census or registration) as a sampling frame.
Survey is faster since people are grouped together. Less effort since only a simple sampling frame, lists of clusters (e.g., villages) with population estimates, is needed.
Systematic selection may not necessarily produce a random sample.
Potential for errors if the variable (e.g., disease) being studied is clustered within the population.
Provides more precise estimates of the reference population from a similar sample size.
Less precise, therefore, requires a larger sample. The sample size formula is used but, because of the design effect, “n” is multiplied by 2.
Designing a Questionnaire Questionnaires are useful for collecting information that may be difficult to obtain in any other way. Although designing a questionnaire may look simple, it is in fact rather difficult. Whenever possible, use pre-tested questionnaires from the local or international organisations (such as the host MOH, WHO, DHS). Then, develop new questions for any additional information. Pictures are useful for illustrating questions that are difficult to state in words or for illiterate data collectors. To develop complete questionnaires, focus group discussions can be used to develop the first draft. Key Steps for Designing Questionnaires The following steps outline the process for designing a questionnaire:
1. Define indicators that meet the survey objectives, including definition of cases and events.
2. Identify the easiest method for assessing each indicator.
3. Develop questions which can produce the required information for each indicator.
4. Check each question against the survey objectives. Keep only those questions that provide the most essential information.
5. Ensure each question is clear, simple, short, and easy to ask.
6. Decide whether to make the questions open-ended or closed.
7. Test new questions on dummy tables (see Planning the Analysis and Reporting section) to confirm that they will assess the selected indicators.
8. Translate the questionnaire into the local language and then translate it back to the original language to identify any mistakes.
9. Ensure there is a logical flow of questions in each section. Begin with general questions and end with the more sensitive questions.
10. Place instructions for the interviewers at the beginning of each section.
11. Provide enough space between questions for recording responses.
12. Pilot test (try out) the questionnaire and other survey instruments (e.g., weighing scales, tape measures) in an area that is not to be surveyed. Check that no essential information has been left out and the interview is short (less than 20 minutes).
13. Review the questionnaire and make final changes.

4-28 The Johns Hopkins and IFRC Public Health Guide for Emergencies
Figure 4-4: Sample Questionnaire for a Childhood Mortality Survey
Questionnaire for Childhood Mortality Survey
1. Are there any children less than 5 years of age currently living in this household? (Yes/No) ________ If yes, how many? ________ 2. Have any children less than 5 years of age in this household died during the past year? (Yes/No) ________ If yes, how many? ________ 3. How old was each child at the time of death? _____________________ 4. Did the child have any of the following during the week before death:
q Fever with cough? q Fever without cough? q Diarrhoea? q Fever with rash? q Accident?
5. Which other symptoms did the child have? ______________________ 6. Which of the health problems do you think was the cause of death in your child? ______________________ 7. Did the child visit the health post during the week before he/she died? (Yes/No) _________
Common Problems with Questionnaires The following are common problems with questionnaires:
• Too many questions — after questions on personal details (name, age, sex, etc.), add another 10-15 questions to limit the interview to a total of 10-20 questions.
• Leading questions — ensure questions are neutral. Do not suggest that a particular answer is correct.
• People are asked about events that they cannot recall. In general, the maximum recall period that can be relied upon is 2 weeks (except for major events such as admission to hospital or death).
• Interviewers are left free to interpret the answers. Use pre-coded answers or record exactly what the subject says.
• The questionnaire is constructed in one language but administered in another.
• Interviewees may be concerned about the nature of the questions and who will be informed of their responses. A full explanation about the survey should be given prior to the interview, with strong reassurances about the confidentiality of their participation and use of the information.
Training and Supervising Interviewers It is important to train all interviewers to administer the revised questionnaire in a standard way. They should be made aware about how they may influence responses to the questions. They should be trained to ask questions in a neutral way and refrain from giving advice. Even if samples were carefully selected, surveys can still give misleading results. Interviewers should be closely supervised in order to prevent the following from occurring:
• Non-response bias — This can occur if a high proportion of the sample population or individuals are missing or did not answer the questions. For example, a survey done during the day may miss young men and women who have gone to work. People may not be willing to answer sensitive questions. Non-response bias can be minimised by the following: - Ensuring that at least 80% of the original sample population responds during the survey. - Following up all non-responders at least once. - In many cultures it is important that women interview women and men interview men, particularly
for sensitive subjects like family planning, STDs, and HIV/AIDS.

Disaster Epidemiology 4-29
• Observer error — Inaccuracies commonly occur because of the interviewers taking or recording faulty measurements, not because of faulty instruments or unreliable subjects. Observer errors can be reduced by the following: - Making all interviewers sign their names on each questionnaire they administer. - Checking that interviewers follow standard guidelines when taking and recording measurements. - Checking instruments daily and adjusting the zero reading on weighing scales.
Analysing and Reporting Survey Findings After carrying out the survey, the information in the comple ted questionnaires needs to be processed and analysed in order to be meaningful. It may be transferred into dummy tables and simple calculations performed in the field by hand or with the help of a pocket calculator. Further analysis may only be possible at the project office and the MOH levels. Thereafter, it is important to share findings and recommendations with all concerned. The following table shows a general outline of a report which may be used to present the data to program decision-makers in a way that they can understand. A shorter report, which focuses on the survey results and recommendations from the survey, should be sent to the affected community.
Table 4-19: General Outline for a Survey Report
Outline for a Full Survey Report
Introduction
Purpose of survey
Survey area
Dates of survey
Methodology Indicators
Sampling frame
Questionnaire used
Survey Results Highlights
Graphs with charts and tables
Conclusions and Recommendations Significant findings
Problem areas
Potential actions
Further investigations
OUTBREAK INVESTIGATION Disease outbreaks (or epidemics) occur when many people in a community or region develop a similar illness — in excess of normal expectations — through a common source or carrier. An outbreak may be declared following the detection of a single case in a non-endemic area (such as cholera or measles). Or after the number of reported cases reach the threshold incidence rate of a particular disease (e.g., threshold for meningitis is 15 cases per 100,000 people in a two-week period). (Please refer to the Control of Communicable Diseases chapter for more details about epidemic thresholds.)
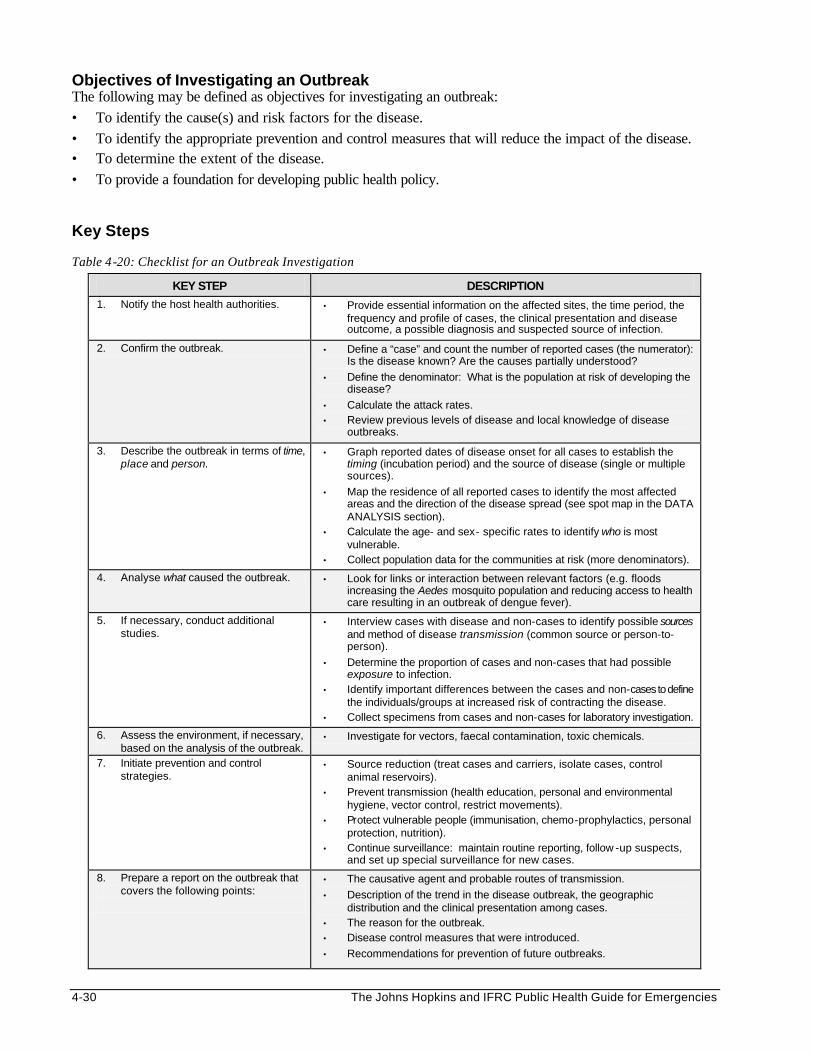
4-30 The Johns Hopkins and IFRC Public Health Guide for Emergencies
Objectives of Investigating an Outbreak The following may be defined as objectives for investigating an outbreak: • To identify the cause(s) and risk factors for the disease. • To identify the appropriate prevention and control measures that will reduce the impact of the disease. • To determine the extent of the disease. • To provide a foundation for developing public health policy. Key Steps Table 4-20: Checklist for an Outbreak Investigation
KEY STEP DESCRIPTION
1. Notify the host health authorities. • Provide essential information on the affected sites, the time period, the frequency and profile of cases, the clinical presentation and disease outcome, a possible diagnosis and suspected source of infection.
2. Confirm the outbreak. • Define a “case” and count the number of reported cases (the numerator): Is the disease known? Are the causes partially understood?
• Define the denominator: What is the population at risk of developing the disease?
• Calculate the attack rates. • Review previous levels of disease and local knowledge of disease
outbreaks.
3. Describe the outbreak in terms of time, place and person.
• Graph reported dates of disease onset for all cases to establish the timing (incubation period) and the source of disease (single or multiple sources).
• Map the residence of all reported cases to identify the most affected areas and the direction of the disease spread (see spot map in the DATA ANALYSIS section).
• Calculate the age- and sex- specific rates to identify who is most vulnerable.
• Collect population data for the communities at risk (more denominators).
4. Analyse what caused the outbreak. • Look for links or interaction between relevant factors (e.g. floods increasing the Aedes mosquito population and reducing access to health care resulting in an outbreak of dengue fever).
5. If necessary, conduct additional studies.
• Interview cases with disease and non-cases to identify possible sources and method of disease transmission (common source or person-to-person).
• Determine the proportion of cases and non-cases that had possible exposure to infection.
• Identify important differences between the cases and non-cases to define the individuals/groups at increased risk of contracting the disease.
• Collect specimens from cases and non-cases for laboratory investigation.
6. Assess the environment, if necessary, based on the analysis of the outbreak.
• Investigate for vectors, faecal contamination, toxic chemicals.
7. Initiate prevention and control strategies.
• Source reduction (treat cases and carriers, isolate cases, control animal reservoirs).
• Prevent transmission (health education, personal and environmental hygiene, vector control, restrict movements).
• Protect vulnerable people (immunisation, chemo-prophylactics, personal protection, nutrition).
• Continue surveillance: maintain routine reporting, follow -up suspects, and set up special surveillance for new cases.
8. Prepare a report on the outbreak that covers the following points:
• The causative agent and probable routes of transmission.
• Description of the trend in the disease outbreak, the geographic distribution and the clinical presentation among cases.
• The reason for the outbreak. • Disease control measures that were introduced.
• Recommendations for prevention of future outbreaks.

Disaster Epidemiology 4-31
Even though different disease outbreaks may occur, there are key steps that are carried out in most outbreak investigations. These steps are summarised in the table above. The order of the steps may depend on the nature of the outbreak and the existing knowledge about the disease. For example, in suspected cholera outbreaks, appropriate disease control measures need to be initiated at the beginning, before identifying the cause or risk factors for disease. When investigating an outbreak, the first step is usually to confirm that there really is an outbreak. A local public health team may be capable of doing this, and sometimes even identifying the possible causes and risk factors. The most effective ways of controlling the spread of disease should be initiated as soon as possible. Sometimes, there is not enough information for identifying the cause of the outbreak or appropriate control measures. If the outbreak seems to be spreading and causing many deaths, rather than phasing out naturally, a special team of investigators (e.g., epidemiologists, entomologists, microbiologists, etc.) may be invited to support the local team. The epidemiologists may help organise a case-control study that compares risk factors among people with the disease and those who do not have the disease. At the end of the investigation, a report should be written and shared with all concerned. Carrying Out the Investigation Because investigating a disease outbreak involves many people, it needs careful planning, organisation, and supervision. Key procedures must be followed. If the disease is spreading rapidly, speed in carrying out the investigation may be critical. 1. Planning the Investigation
• Consider access to the site and the willingness of the community to help with the investigation. • Consider the local climate, the daily family activities, and the migration patterns when scheduling the
time for data collection. • Design appropriate questionnaires based on how the information will be analysed. • Train interviewers to ask questions in a standard way and to practice using the survey instruments
(the questionnaires and equipment) before the investigation. • Arrange for translators and chaperones to be present during interviews if needed. • Standardise the sequence of data collection procedures. Most investigations involve epidemiological,
clinical, and laboratory procedures. Data should be collected as follows: - First, collect information directly from the affected person or family member where necessary. - Then, perform a physical examination after the interview. - Lastly, collect any required laboratory specimens (blood, stool, etc.). Preserve all laboratory
specimens appropriately. 2. Organising the Investigation
• Involve local authorities for security clearance, publicity, and introducing the investigation team to the affected community.
• Sketch an organisational chart, which shows the lines of authority, the roles of different teams, and the link between functions.
• Remember, “no survey without services.” Prepare incentives to maintain community participation during the investigation. This may include providing some medical services or essential drugs.
3. Supervising the Investigation
• Supervise field workers by checking how they conduct interviews during the survey, and their accuracy in recording data.
• Evaluate the collection and processing of laboratory specimen for quality control. • Carry out and check data entry daily and perform simple calculations. • Conduct frequent staff meetings to identify and address any problems.

4-32 The Johns Hopkins and IFRC Public Health Guide for Emergencies
At the end of the investigation, organise a final meeting with all supporters and participants to thank them and give them feedback about the investigation, and to recommend any long-term measures to prevent and control future outbreaks. DATA ANALYSIS AND PRESENTATION
Objectives of Data Analysis The following are objectives of analysing data: • To identify the possible root causes of problems. • To investigate further to verify the actual causes of a problem. • To define needs that have not been met. • To develop an action plan for dealing with problems. • To improve the quality of programs. All data that is collected, by whichever means — routine information system, surveillance systems, an outbreak investigation or a survey – has to be processed, analysed, and presented in a form that decision-makers can easily understand. The methods, time and resources needed to analyse data should be planned in advance. Projects can save time and effort by analysing only the priority problems being tackled by the project. Analysing data can be simple and straightforward, and most of it can be done by hand with a pocket calculator. Basic data analysis includes the following steps:
1. Sorting the data records.
2. Performing summary statistics (for numerical data).
3. Summarising data into frequency tables.
4. Calculating percentages and rates. Where staff members lack the knowledge and skills for analysing data, on-the-job training should be organised with follow-up supervision. Where computers and staff with computer skills are available, EPI INFO, a public domain software, may be used to set up questionnaires, store databases, perform basic and advanced data analysis, and to print results. Results of data analysis should be carefully interpreted and then presented as tables and graphs, which are easier to understand. Basic Data Analysis and Interpretation Data should be analysed and interpreted in a logical sequence. The following steps may be used to analyse data in the field:
1. Define the Major End-Results Expected from the Analysis (e.g., mortality and morbidity rates, coverage and access to food ration, water supply, and sanitation).
Note: This step may have been done when planning for the data collection.
2. Process All Data. Data on people attending health facilities or feeding centres is usually recorded
directly from individual patient cards into facility registers on a daily basis. Data in these registers will usually be summarised as shown in the following table:

Disaster Epidemiology 4-33
Table 4-21: Summary Sheet for ARI Survey Data on 200 Displaced People in Camp A
RECORD No. DATE ZONE AGE SEX WEIGHT ARI INFECTION
1 1/1 R 4 F 20 + 2 1/1 Q 6 F 25 - 3 1/1 S 8 F 30 + 4 1/1 Q 3 F 15 - 5 2/1 Q 4 M 15 + 6 2/1 P 4 M 20 - 7 2/1 P 11 F 40 - 8 2/1 Q 2 M 12 - 9 2/1 R 2 M 8 + 10 3/1 R 1 F 7 + . . . . . . . . . . . . . .
200 7/1 S 3 F 10 +
TOTAL
Data from surveys is usually received in individual questionnaire forms. These questionnaires first need to be sorted by record number and date, from the earliest to the most recent. The information then needs to be recorded onto a summary sheet similar to the one shown above. Note: All data received should be inspected for inconsistencies or for missing data and appropriate actions should be taken (e.g. verify, omit, etc.).
3. Analyse Categorical Data. Categorical data such as age, sex, occupation, location, etc. must first be tabulated follows:
a) Hand-tally data from the above registers or summary sheets of observations into the corresponding box as shown below. Ensure that no observation is recorded more than once and that all the observations are contained in the table.
Table 4-22: Examples of Two-Way Tally Sheets
c) Classify data into frequency tables: Transfer total counts from tally sheets into corresponding cells
(intersection of a row and a column) of empty but labelled dummy tables (should be prepared during the planning stage). These may be one-way or two-way frequency tables. One-way tables may be appropriate for classifying data by PLACE. Two-way tables may be used to classify data by PERSON (age and gender or other characteristic).
Table 4-23: Examples of One-Way and Two-Way Frequency Tables
A two-way table: Distribution of ARI cases by age & sex No. of ARI Cases
Male Female Total
< 5 years 50 50 100 > 5 years 10 40 50
Total 60 90 150
Example of a two-way tally sheet showing age and gender Male Female Total < 5
\\\\ \\\\ \\\\
\\\\ \\\\ \
26
> 5
\\\\ \\\\ \\\\ \\\\ \\\\ 24
Total 25 25 50
Example of a two-way tally sheet showing ARI cases by age ARI + ARI - Total < 5
\\\\ \\\\
\\\\ \\\\ \\\\ \\\\
30
> 5
\\\\ \\\\ \\\\ \\\\ 20
Total 15 35 50
A one-way frequency table: Distribution of ARI cases by location CAMP P Q R S Total
No. of ARI cases
10 30 70 40 150

4-34 The Johns Hopkins and IFRC Public Health Guide for Emergencies
c) Calculate percentage of observations: Divide the count in each cell by the grand total and multiply the result by 100. Percentages may be expressed to one decimal point or rounded to a whole number.
Table 4-24: Example of Calculating Percentage of Observations
Tables of categorical data can later be used for comparison with other data, for presentation of graphs or to carry out statistical tests.
d) Compare frequencies and percentages as follows:
• By PERSON: compare frequency tables for gender/age (e.g., male with female , under-five with total population, etc.)
• By PLACE: compare frequency tables for different camps or population settlements • By TIME: compare frequency tables with baseline or previous month’s frequencies to follow trends For all comparisons, ensure the population size and structures in the frequency table are similar. For example, the above results of ARI distribution in one camp may be compared to results of another camp whose population size and structure is similar. Otherwise the conclusions drawn may not be valid. (For details about how to compare populations with a different structure or size, please refer to standard statistical texts.) These comparisons can also be illustrated by graphs. Information in the one-way frequency table is better understood on a spot map that shows where the disease distribution is greatest. A spot map is easily created by pushing pins on a map of the study areas. (See Presenting Data for an example of a spot map.)
4. Analyse Numerical Data: e.g., age, weight, height, haemoglobin levels, etc.
a) Descriptive Analysis: Summarise data by defining the following: • Range —- scan the data set in each category. The range is the difference in values between the
lowest and the highest observed values. • Median —- sort the data in each category from the lowest to the highest value and note the middle
value that divides the data set into two equal halves. Note: The median is preferred to the mean when the data is biased or tends to lie in one direction.
• Mode — scan the data set to identify the most common observation. • Mean —- calculate the mean (also known as the “average”) by summing all the data in a category
(e.g. birth weight) and dividing the total sum by the number of observations. • Percentage —-define the proportion of subjects above or below particular data categories.
Table 4-25: Examples of Summary Statistics
Data Set for Ages of 15 People with ARI Infection
Original data set {2,21,3,1,4,2, 8,1,6,11,10} — can begin with a disorganised data set Sort data set: {1, 1, 2, 2, 2, 2, 3, 3, 4, 4, 6, 8, 10, 11, 21} Age range: 1 – 21 years Median age: 3 years Mode: 2 years Mean age: (1+ 2 + 3 + 3…. + 10 + 11) / 11 = 80/15 = 5.3 years Percentage: 10/15 = 66.7% of people with ARI are below the mean age of 5.3 years
ARI Male No. %
ARI Female No. %
ARI Total No. %
< 5 yr 50 33.3 50 33.3 100 66.6 > 5yr 10 6.7 40 26.7 50 33.4 Total 60 40.0 90 60.0 150 100
The distribution of ARI cases by age and gender

Disaster Epidemiology 4-35
• Standard deviation (SD) —- The standard deviation describes the scatter of observations around their mean. A large SD implies a wide scatter in the observed data, while a small SD implies a narrow scatter with little difference between the observations. In emergencies, the SD is commonly used to estimate the prevalence of malnutrition or to show the normal range of laboratory tests. (For details on calculating standard deviation, please refer to standard statistical texts).
Figure 4-5: Applying Standard Deviation
-3 -2 -1 0 +1 +2 +3
b) Classify numerical data into frequency tables. Frequency tables can be used to classify numerical data under suitable class intervals. The class intervals in dummy tables may need to be revised after data collection, according to the observed range of data. For example, dummy tables for a survey may have been drawn for two class intervals for age (< 5 years and > 5 years), but after the survey, the analysts may feel they can draw better conclusions by classifying age as < 5, 5-14, 15-49, 50+ years.
Table 4-26: Population Distribution by Age and Gender Age No. of Males No. of Females Total
< 5 years 20 20 40 5-14 years 45 35 80 15 - 49 years 15 45 60 50+ years 10 10 20 Total 90 110 200
5. Analyse Indicators
a) Calculate rates, ratios and proportions: data for numerators and denominators for selected indicators can be obtained from frequency tables developed according to the previous steps. Then, calculate the values of each indicator (disease incidence, mortality, etc.) as demonstrated earlier in this chapter.
b) Compare selected indicators: Ensure the indicators being compared represent a similar population
size and time period. • By TIME: to follow trends, compare indicators (incidence, mortality, etc.) with baseline values or
those from the previous week or month • By PLACE: compare indicators for several locations or settlements. • By PERSON: compare indicators for a sub-group of the population (e.g., under-five mortality)
with those of the total population, or if data is available, compare indicators for two sub-groups (e.g., morbidity of male and female or of two different ethnic groups in the camp).
WFH curve for displaced children. Standard deviation is large.
WFH curve for a standard child population. Standard deviation is small.
Mean standard WFH
After a nutritional survey of displaced children, the weight-for-height (WFH) data for all children surveyed may be plotted on a graph and compared with WFH data for a standard population of children. The fraction of displaced children with WFH more than –2 SD below the mean standard WFH are judged as wasted (shaded area under the curve for displaced children).
-3 -2 -1 0 +1 +2 +3

4-36 The Johns Hopkins and IFRC Public Health Guide for Emergencies
6. Interpret Data Consider normal reference values or targets when interpreting health indicators. Follow trends to determine if the situation is improving.
a) Demographic Indicators The following table lists the population structure (in percentages and ratios) of a typical developing country. These percentages can be applied to a total population estimate to define the estimates of population sub-groups when data on the displaced population is lacking or unreliable. Depending on the information in the demographic table available, the vulnerable population may also be estimated (e.g., all pregnant women, children less than 5 years, etc.). The population pyramid may also be drawn to display the age and sex composition of a population (see the table and figure below).
Table 4-27: Population Structure of a Developing Country
Population Composition Average Population
Total Population 100%
Infants (0-1 year) 4%
Children 0-5 years 18%
Sex ratio 1:1
Women of child-bearing age 24%
Pregnant women 5%
Expected births 4.4%
Figure 4-6: Example of a Population Pyramid
b) Health Status Indicators
Mortality: The table below shows how crude mortality rates (CMRs) can be used to assess the status of an emergency situation. A CMR >1 death/10,000/day implies an acute emergency situation. The crude mortality rate of displaced populations is expected to fall below 1.0 deaths/10,000/day within 4-6 weeks of starting a basic support program (following the provision of sufficient food and water, sanitation and health care). For well-run relief programs, CMR should not exceed 1.5 times those of the host population. The baseline CMR from the initial assessment may later be compared with other CMRs to determine the effectiveness of the relief efforts. Note: Cut-off values for the under-fives CMR are almost double the CMR for the whole population. Table 4-28: Classifying Emergency Situations by CMRs
BENCHMARKS FOR CRUDE MORTALITY RATE Total Population Age under Five Years INDICATION
CMR 0.3-0.5 /10,000/ day CMR 0.7-1.0 /10,000 / day Normal for stable situations in developing countries.
CMR > 1.0 / 10,000/ day CMR > 2.0 /10,000 / day Very serious situation. Should investigate.
CMR > 2.0 / 10,000/ day CMR > 4.0/10,000 / day Emergency out of control. Demands immediate actions.
Demographic profile of
44+ 25-4415-24
10-14
5-9 0-4
Age
Proportion of total population (%)
Males Females

Disaster Epidemiology 4-37
Morbidity: Determine the importance of identified diseases in the following terms: • How common each disease is, and what are the risk factors. • Whether the condition is potentially life-threatening or disabling (severity). • Whether the control measures being implemented locally are effective in reducing the disease
incidence, prevalence, severity or death from the disease. • Whether the existing disease surveillance system is capable of detecting and monitoring the
disease or if new indicators for the disease should be added.
Nutritional Status: The nutritional status of a displaced population may be projected from the nutritional status of children less than five years. Two types of indicators may be used:
• Clinical indicators of malnutrition include detection of oedema (excess fluid in tissues of lower extremities), skin changes (scaling, baggy skin), hair changes or signs of micronutrient deficiency disorders. Clinical indicators must be interpreted against anthropometic indicators.
Note: The presence of oedema indicates severe malnutrition, regardless of the WFH indicator. • Anthropometic indicators are based on measurements of age, sex, weight, and height. There are
several anthropometric indicators, but the ones most commonly used for measuring malnutrition in children are Weight-for-Height (WFH) and Mid-Upper-Arm-Circumference (MUAC). The following table shows MUAC and WFH cut off values for global and severe acute malnutrition:
Table 4-29: Cut-off Values for MUAC and WFH for Acute Malnutrition
MUAC WFH
Percentile Z-score
Severe malnutrition 11.5 <70 < -3 SD
Global malnutrition 12.5 <80 < -2 SD
Care should be taken when interpreting findings from anthropometric surveys. WFH may be interpreted as a percentile, median, or Z-score. For developing countries with lower “normal” nutritional intake levels, up to 5% of children may have a Z-score below -2 SD when compared to the reference population. Thus, relief organisations should consider that a nutritional emergency exists if more than 8% of children sampled have a Z-score below -2 SD. Finding even as few as 1% of the children with a Z-score below -3 SD indicates the need for immediate nutrition interventions.
Note: See the Nutrition chapter for details on calculating WFH.
After determining the global and severe malnutrition rates for a displaced population, it is essential to interpret these rates against the following factors: • morbidity and mortality rates for children under 5 years • time of year (e.g. harvest or planting season) • food availability and consumption • trends in food security
c) Program Process Indicators
Identify any gaps in coverage and quality of services being provided (food supply, water supply, sanitation, immunisation, health services, etc.) by comparing the actual values of the process indicators to pre-defined targets or standards. The table below identifies where the practices and/or coverage of immunisation fall short of what is desired or expected.
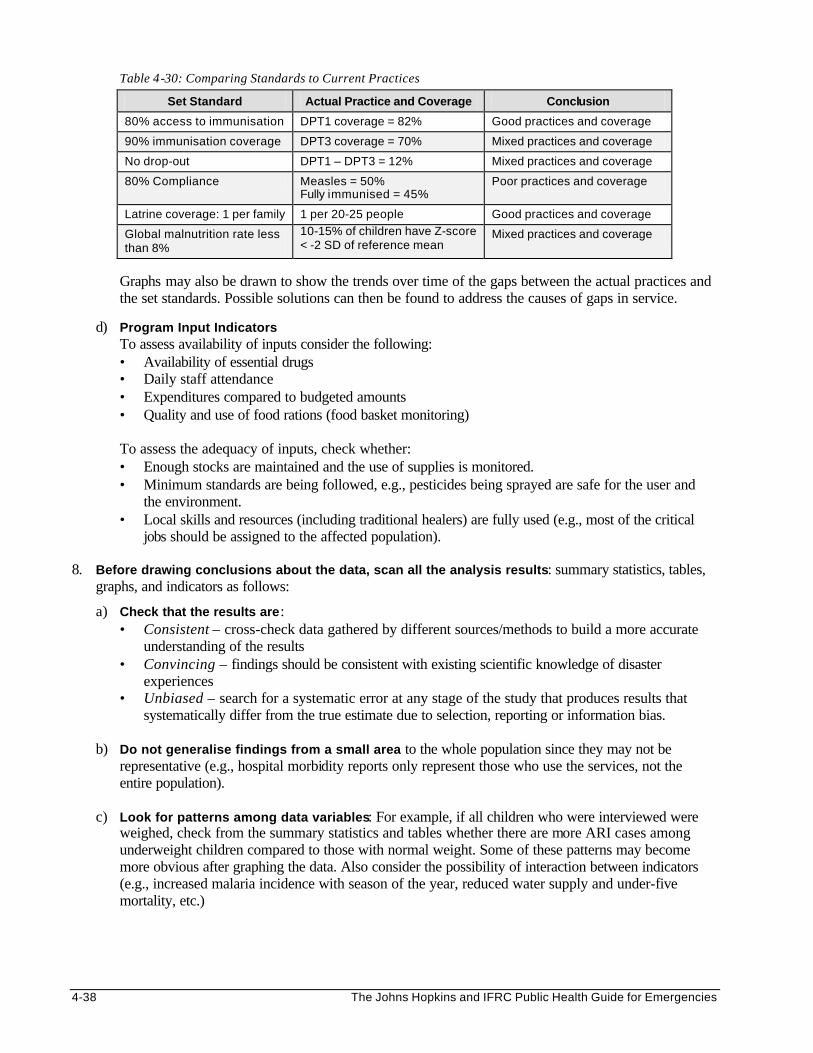
4-38 The Johns Hopkins and IFRC Public Health Guide for Emergencies
Table 4-30: Comparing Standards to Current Practices
Set Standard Actual Practice and Coverage Conclusion
80% access to immunisation DPT1 coverage = 82% Good practices and coverage
90% immunisation coverage DPT3 coverage = 70% Mixed practices and coverage
No drop-out DPT1 – DPT3 = 12% Mixed practices and coverage
80% Compliance Measles = 50% Fully immunised = 45%
Poor practices and coverage
Latrine coverage: 1 per family 1 per 20-25 people Good practices and coverage
Global malnutrition rate less than 8%
10-15% of children have Z-score < -2 SD of reference mean
Mixed practices and coverage
Graphs may also be drawn to show the trends over time of the gaps between the actual practices and the set standards. Possible solutions can then be found to address the causes of gaps in service.
d) Program Input Indicators
To assess availability of inputs consider the following: • Availability of essential drugs • Daily staff attendance • Expenditures compared to budgeted amounts • Quality and use of food rations (food basket monitoring)
To assess the adequacy of inputs, check whether: • Enough stocks are maintained and the use of supplies is monitored. • Minimum standards are being followed, e.g., pesticides being sprayed are safe for the user and
the environment. • Local skills and resources (including traditional healers) are fully used (e.g., most of the critical
jobs should be assigned to the affected population). 8. Before drawing conclusions about the data, scan all the analysis results: summary statistics, tables,
graphs, and indicators as follows:
a) Check that the results are: • Consistent – cross-check data gathered by different sources/methods to build a more accurate
understanding of the results • Convincing – findings should be consistent with existing scientific knowledge of disaster
experiences • Unbiased – search for a systematic error at any stage of the study that produces results that
systematically differ from the true estimate due to selection, reporting or information bias. b) Do not generalise findings from a small area to the whole population since they may not be
representative (e.g., hospital morbidity reports only represent those who use the services, not the entire population).
c) Look for patterns among data variables: For example, if all children who were interviewed were
weighed, check from the summary statistics and tables whether there are more ARI cases among underweight children compared to those with normal weight. Some of these patterns may become more obvious after graphing the data. Also consider the possibility of interaction between indicators (e.g., increased malaria incidence with season of the year, reduced water supply and under-five mortality, etc.)

Disaster Epidemiology 4-39
Advanced Data Analysis Sometimes, after carrying out special investigations or surveys, more advanced data analysis may be needed to determine the following:
• Relative risk — to compare the probability of disease in two different study populations, one with a risk factor and one without. Relative risk is usually applied to longitudinal (cohort) studies.
• Odds ratio — to compare the probability of having a risk factor in two different study populations: one with the disease and one without the disease. Odds ratio is usually calculated for case-control studies in a representative sample, with results applied to the entire population.
• Sensitivity, specificity, and predictive values — to assess whether a screening test or procedure can sufficiently detect a condition or if further tests are needed (e.g., clinical diagnosis of anaemia, pneumonia, etc.)
• Confidence limits, which indicate the probability (usually 95%) that the estimate obtained from the sample will not differ from the true population rate by more than the range defined by the confidence limit. For example, in a sample of 100 individuals in which a prevalence rate of 20% is observed, there is a 95% probability that the prevalence for the whole population will lie between (20–5) = 15 and (20 + 5) = 25%.
• Significance tests (e.g., Chi2 test) are performed to establish whether two quite different factors, e.g., the diagnosis of anaemia and hookworm infection could be statistically associated, or whether the apparent relationship may have only occurred by chance. Results will be expressed as a statistical probability, where a P-value less than 0.05 implies association.
Significance tests can also be used to establish whether the observed differences between different study populations are real or due to chance alone. For example, following a malaria survey, a resulting P-value of less than 0.05 would indicate that there is a real difference between the spleen rates of males and females that is not due to chance factors from sampling. However, this finding should be interpreted against existing scientific knowledge about malaria transmission before drawing the final conclusion of confirming the finding or repeating the survey in another population.
Note: Carrying out the above-described statistical analysis procedures is beyond the scope of this book. If EPI-INFO is available, it may be used to perform these tests. Otherwise, please refer to standard statistical texts for full details.
Presenting Data
Data may be presented in the form of tables or graphs because they create a clearer impression than numbers alone. However, basic rules should be followed when drawing and presenting graphs and tables, such as: • Neatly draw and label all presentations and include a description of the data. • Present only the most essential features of graphs. Otherwise, the simplicity and clarity of the
information is destroyed. • Limit the number of graphs, tables, etc. because too many may be confusing. • Each presentation should be of reasonable size – not too big or too small. • Use different colours/shadings/lines to increase contrast between data categories. This makes it easier
to understand. A few tables were shown in the previous section on analysing and interpreting data. Graphs are very useful because they help define patterns in the data. The Figures below show examples of graphs:

4-40 The Johns Hopkins and IFRC Public Health Guide for Emergencies
a. Histogram — to show the frequency distribution of large samples of quantitative data.
Incidence of ARI in Alpha camp by age and sex
0%10%20%30%40%50%
< 5 > 5
Males
Females
b. Pie chart — to show proportions of different segments of a whole, e.g., specific causes of death.
c. Time chart — to show trends and changes in health of the population and disease occurrence over time. The time variable is usually placed on the x-axis and the frequency or rate on the y-axis.

Disaster Epidemiology 4-41
d. Scatter diagram — to show relationship between a limited number of observations.
e. Spot map — to show distribution of cases within an area.iii
Average weight gain/day among under 5s enrolled in SFC at Alpha Camp
81012141618
0 2 4 6Time (months)
Females
Total
Males

4-42 The Johns Hopkins and IFRC Public Health Guide for Emergencies
Communicating and Using Information
Figure 4-7: Flow of Information in Emergencies
INTERNATIONAL LEVEL
NATIONAL LEVEL
PROJECT LEVEL
HEALTH FACILITY
COMMUNITY LEADERS, CHWs
DISPLACED
POPULATION
Information in emergencies must flow two ways. The objective of surveillance, surveys, outbreak investigations and health information is not simply to collect and report data. The objective is to improve how the relief program is managed as well as provide feedback to data collectors so that they can feel motivated. After analysing data, the results should be communicated in a form that everyone who needs to know can understand. The table below gives a summary of the reports and recipients of the information. Table 4-31: Description of Different Reports and Recipients
Type of Report Recipient
Full detailed report for those in a position to improve situation and provide additional resources
• Decision makers at the national and international level so that appropriate control measures can be organised
• Agencies and service providers of similar programs
• Senior health workers responsible for data collection to improve diagnosis and management of disease cases
Summary of report for those who gave support or helped to collect data
Community health workers so they will be motivated to continue collecting data
Very brief summary of most important findings and conclusions
General population to be aware of health risks and to improve how they manage their illnesses at home

Disaster Epidemiology 4-43
REFERENCES AND SUGGESTED READINGS 1. Centres for Disease Control and Prevention. Famine-affected, refugee, and displaced populations:
Recommendations for Public Health Issues. MMWR 41(RR-13); 1-76. 2. Gregg MB et al. Field Epidemiology. Oxford University Press, New York, 1996. 3. Lemeshow S, Hosmer DW, Klar J, Lwanga SK. 1990. Adequacy of Sample Size in Health Studies.
Geneva: World Health Organisation. 4. Lutz W et al. Health and Community Surveys. A practical manual for health and community workers,
Volume I and II. International Epidemiological Association and World Health Organisation, 1992. 5. Medecins Sans Frontieres. Refugee Health: An Approach to Emergency Situations. Macmillan Education
Ltd., Hong Kong, 1997. 6. Morrow RH, Vaughan JP. 1989. Manual of Epidemiology for District Health Management. Geneva:
World Health Organisation. 7. Office of Foreign Disaster Assistance. Field Operations Guide for Disaster Assessment and Response. US
Agency for International Development. 8. Office of Foreign Disaster Assistance. Health in Complex Humanitarian Emergencies Course Notes. 9. Perrin P. Handbook on War and Public Health. International Committee of the Red Cross, Geneva. 10. Sandler RH and Jones TC. Medical Care of Refugees. Oxford University Press, New York, 1987. 11. Scrimshaw, Nevin S, Gleason GR. 1992. Rapid Assessment Procedures: Qualitative Methodologies for
Planning and Evaluation of Health Related Programs. Boston: International Foundation for Developing Countries (INFDC).
12. Spiegel PB. Rapid Assessment and Surveillance Lecture, Health Emergencies in Large Populations
(HELP) course notes. Baltimore, July 1998. 13. Toole MJ. Mass Population Displacement. A Global Public Health Challenge. Infectious Dis Clin North
Am (1995:9(2):353-66. 14. World Health Organisation. Rapid Health Assessment in Sudden Impact Natural Disasters. Emergency
Preparedness and Response Unit: Emergency Relief Operation. 1990. i The Field Operation Guide version 3.0 can be downloaded from the US Office of Foreign Disaster Assistance web-site (www.info.usaid.gov/ofda/fog/). ii Epi-Info is a public domain software package that can be used to process questionnaires, manage epidemiological databases and perform statistical calculations, including sample size calculations and data analysis. The software can be downloaded from the Internet website and is also available in CD-ROM. (www.cdc.gov/epo/epi/epiinfo.htm). iii WHO/KMOH Investigation of a Haemorrhagic/Rift Valley Fever Outbreak in North-East Kenya and Southern Somalia. Dec 1997 – Feb 1998.