epidemiologia - backoffice.neonatologia.itbackoffice.neonatologia.it/upload/749_la gavidanza...
TRANSCRIPT


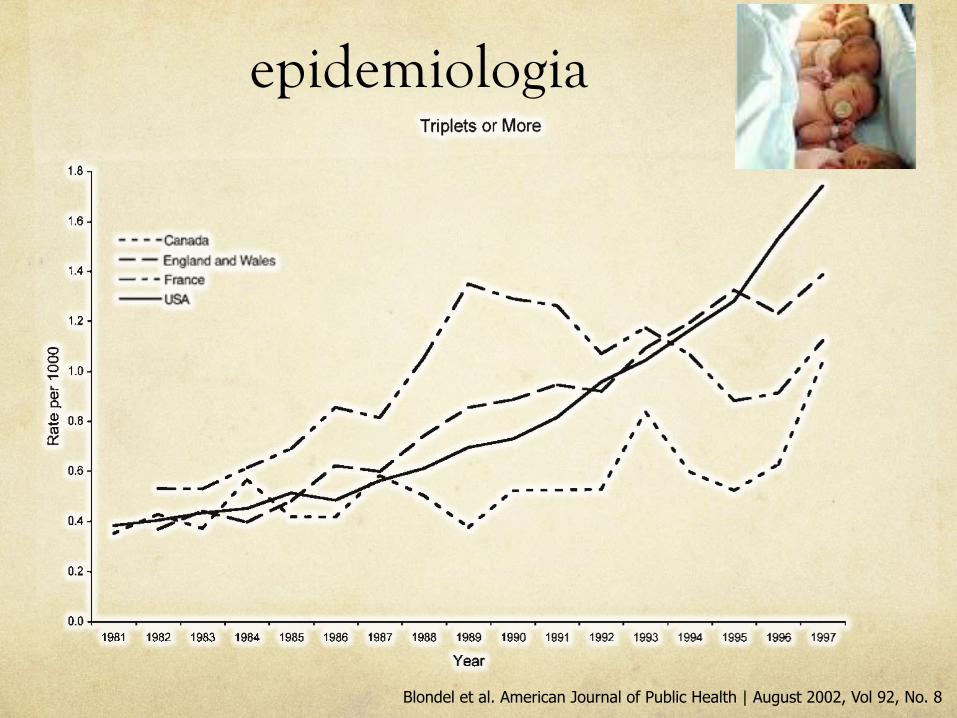
Epidemiologia
Blondel et al. American Journal of Public Health | August 2002, Vol 92, No. 8
epidemiologia
Blondel et al. American Journal of Public Health | August 2002, Vol 92, No. 8

0
10
20
30
40
50
60
< 28 28-32 33-36 < 37 < 28 28-32 33-36 < 37 < 28 28-32 33-36 < 37
canada francia USA
singoli gemelli
Blondel et al. American Journal of Public Health | August 2002, Vol 92, No. 8
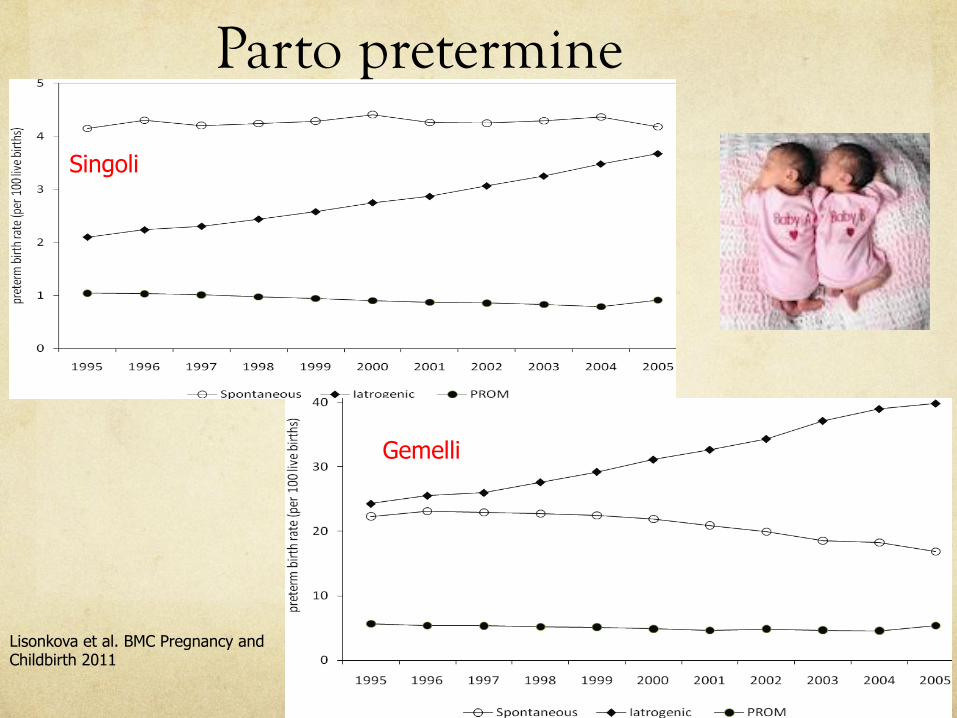
Parto pretermine
Rischio relativo 10,7 (95% CI 10.0 -11,4) Papiernik et al. 2010
Parto pretermine
Lisonkova et al. BMC Pregnancy and Childbirth 2011
Gemelli
Singoli

the temporal changes in the 2 other subtypes of pretermbirth (P value < 0.001 for both contrasts, Table 3). Thereductions in neonatal mortality/serious neonatal mor-bidity in the iatrogenic and spontaneous preterm birthgroups were observed at early preterm gestation as wellas at late preterm gestation; among live births followingpreterm PROM, the temporal increase in neonatal mor-tality/morbidity was observed in the 34-36 week group(Table 3).Among twins, neonatal mortality/serious neonatal mor-
bidity rates declined significantly following iatrogenic
preterm birth and spontaneous preterm birth, while neo-natal mortality/serious neonatal morbidity rates amongpreterm births following PROM did not change signifi-cantly (Table 3). The neonatal mortality/serious neonatalmorbidity decrease among iatrogenic preterm births waslarger in magnitude than that among spontaneous pretermbirths (odds ratios = 0.84, 95%CI:0.81-0.88 vs. 0.92, 95%CI:0.87-0.97; P value for difference in odds ratios = 0.01).Significant reductions in neonatal mortality/morbidityamong twin live births following iatrogenic preterm birthwere observed at 24-27, 28-31 and 34-36 weeks but not
Table 3 Temporal Changes in Neonatal Mortality or Serious Neonatal Morbidity† by Plurality, Gestational Age andSubtype of Preterm Birth, United States, 1995-96 and 2004-05
1995-96 2004-05
Plurality and gestational age andpreterm birth subtype
Livebirths
Neonatal outcomes†/100 live births
Livebirths
Neonatal outcomes†/100 live births
Odds ratio (2004-05vs 1995-96)
95%confidenceintervals
Singletons
24-27 wks: Iatrogenic 6,418 49.0 7,532 42.9 0.78* 0.73-0.83
Spontaneous 8,569 52.1 6,683 45.5 0.77* 0.72-0.82
PROM 4,728 51.0 3,338 49.9 0.95 0.87-1.04
28-31 wks: Iatrogenic 14,329 28.4 16,008 23.7 0.78* 0.74-0.82
Spontaneous 16,486 23.1 12,501 20.5 0.86* 0.82-0.91
PROM 8,083 26.9 5,402 26.3 0.97 0.89-1.04
32-33 wks: Iatrogenic 14,973 15.8 18,051 13.3 0.82* 0.77-0.87
Spontaneous 21,469 10.7 17,124 9.50 0.88* 0.82-0.94
PROM 9,955 12.3 6,662 12.9 1.06 0.97-1.16
34-36 wks: Iatrogenic 86,586 5.69 119,807 4.49 0.78* 0.75-0.81
Spontaneous 173,286 2.73 152,483 2.43 0.89* 0.85-0.93
PROM 35,844 4.83 22,801 5.64 1.18* 1.09-1.27
24-36 wks: Iatrogenic 122,306 11.9 161,398 9.17 0.75* 0.73-0.77
Spontaneous 219,810 6.95 188,791 5.80 0.82* 0.80-0.84
PROM 58,610 12.9 38,203 13.7 1.07* 1.03-1.12
Twins
24-27 wks: Iatrogenic 1,640 49.1 2,477 42.0 0.83* 0.73-0.94
Spontaneous 1,671 64.1 1,303 51.7 0.69* 0.60-0.80
PROM 933 59.3 844 55.2 0.85 0.70-1.02
28-31 wks: Iatrogenic 3,875 25.2 5,967 21.6 0.86* 0.78-0.94
Spontaneous 3,312 26.7 3,205 23.7 0.85* 0.76-0.95
PROM 1,889 30.9 1,679 28.5 0.89 0.77-1.03
32-33 wks: Iatrogenic 5,252 12.0 8,930 11.4 0.95 0.85-1.06
Spontaneous 4,981 10.8 4,540 10.9 1.02 0.90-1.16
PROM 1,986 14.7 1,839 13.7 0.92 0.77-1.10
34-36 wks: Iatrogenic 24,983 4.25 42,236 3.65 0.84* 0.78-0.91
Spontaneous 21,432 3.52 18,322 3.47 1.03 0.93-1.14
PROM 3,372 5.60 2,975 6.62 1.19 0.97-1.47
24-36 wks: Iatrogenic 35,750 9.72 59,610 8.20 0.84* 0.81-0.88
Spontaneous 31,396 10.3 27,370 9.36 0.92* 0.87-0.97
PROM 8,180 19.8 7,337 19.0 0.95 0.88-1.03
†Neonatal mortality or serious neonatal morbidity included (neonatal death, 5-minute Apgar score !3, neonatal seizures or assisted ventilation for "30 minutes).*p-value < 0.05Births with missing information about serious neonatal morbidity were excluded. Births recorded on new birth certificates in 2004-05 were excluded due to adifferent definition of assisted ventilation.
Lisonkova et al. BMC Pregnancy and Childbirth 2011, 11:39http://www.biomedcentral.com/1471-2393/11/39
Page 6 of 9
Lisonkova et al. BMC Pregnancy and Childbirth 2011

Statistical analysisStatistical analyses were performed using SPSS version 11.5.0.Data are presented as number (%) with odds ratio (OR) and 95%CI or mean (SD) with means difference and 95% CI. Singletonswere set as a referent for the odds ratio and 95% CI calculation.
The extended Mantel–Haenszel x2 test for trends was used toanalyse the trends in assisted conception. Multivariate logisticregression analysis was performed adjusting for birth weightpercentile, gestational age and other significant baseline populationcharacteristics. The level of statistical significance for all analyseswas set at p,0.05 using two-tailed comparisons. The significancelevel was not changed when multiple comparisons were performed.9
RESULTSNICU admissions of preterm infants under 32 weeksDuring the study period 10 080 infants were born at 22–31 weeks’ gestation and admitted to the tertiary NICU in theregion. Among these, 7304 (72.5%) were premature singletons,2444 (24.2%) twins (1298 sets), 320 (3.2%) triplets (114 sets)and 12 (0.1%) quadruplets (three sets). Infants of multiplebirths increased from 24.6% in 1994 to 30.6% of 2005 NICUadmissions (p = 0.006). The contribution from spontaneousmultiple birth remained stable, whereas the percentage ofmultiple pregnancies from assisted conception increased gradu-ally from 4.6% in 1994 to 10.3% in 2005 (p,0.001; fig 1).
Perinatal characteristicsThe results are shown in table 1. Overall, 1235 (12.3%) ofpreterm infants were born as a result of assisted conception (367(5.0%) singletons, 659 (27.0%) twins and 209 (65.3%) triplets).
When compared with premature singletons, mothers oftriplets were twice as likely to be over 35 years (OR 2.1, 95%CI 1.7 to 2.7) and much more likely to have received assistedconception (OR 6.9, 95% CI 6.1 to 8.0 for twins; OR 35.6, 95%CI 27.6 to 45.8 for triplets). Antenatal steroid usage wassignificantly higher in the twins and triplets groups (OR 1.6,95% CI 1.4 to 1.9 for twins; OR 3.5 95% CI 2.1 to 5.9 fortriplets). Twins and triplets groups were less likely to beoutborn (OR 0.7, 95% CI 0.6 to 0.9 for twins; OR 0.44, 95% CI0.26 to 0.74 for triplets).
Mean gestational age and birth weight were similar in all thegroups, but there were fewer small for gestational age (SGA)preterm twins when compared with premature singletons andtriplets (table 1).
Maternal age and conceptions in NICU twins and tripletsAssisted conceptions were overrepresented in the NICU twinsand significantly more so in the higher maternal age group sothat 42% (194/465) of the 35 years and over maternal age groupwere products of assisted conceptions compared with 23% (465/1979) of mothers less than 35 years old (OR 2.35, 95% CI 1.90to 2.90). Two-thirds of triplets were products of assistedconceptions irrespective of the age group; 66% (75/114) and65% (134/206) in both groups, respectively.
However, in natural conception, maternal age grouping wasnot associated with a difference in the respective proportions ofNICU twins and triplets. A total of 1678 NICU infants was bornto mothers aged 35 years and older and 271 (16%) were twins and39 (2%) were triplets. It compared similarly to the 7155 naturallyconceived NICU infants born to mothers less than 35 years inthat 1512 (21%) were twins and 72 (1%) were triplets.
Neonatal morbidityThe results are shown in table 2. When compared withpremature singletons, twins were more likely to have hyalinemembrane disease (HMD; OR 1.2, 95% CI 1.1 to 1.3). Othermajor morbidities such as intraventricular haemorrhage grade 3or 4, abnormal ultrasound (parenchymal cyst or hydrocephalus)at 6 weeks, retinopathy of prematurity grade 3 or 4 and air leakrequiring drainage were similar between the groups. However,chronic lung disease (respiratory support at 36 weeks) waslower among twins and patent ductus arteriosus requiringtreatment was higher among triplets.
Neonatal mortalityA total of 152 twins and 22 triplets died before NICU admission(including stillborns). The NICU mortality was 12.9% for twinsand 7.8% for triplets (table 2).
A multivariate logistic regression model showed decreasinggestational age, male gender, birth weight percentile, absence ofantenatal steroids in the last 7 days before birth and twins inthe 22–27 weeks’ gestation group as predictors of NICUmortality, whereas assisted conception was protective againstmortality (table 3).
Figure 2 illustrates the gestational age-specific mortality fortwins, singletons and triplets. There is a noticeable improve-ment in all the singletons, twins and triplets mortality, withapparent convergence of outcomes at a gestation of 25 weeks.
Figure 1 Multiple (twins and triplets)births 22–31 weeks’ gestation byartificial reproductive technology—assisted conception. NICU, neonatalintensive care unit.
Original article
Arch Dis Child Fetal Neonatal Ed 2010;95:F20–F24. doi:10.1136/adc.2009.157701 F21
P<.001
Garg et al. 2010
Gemelli: ricoveri in TIN

Garg et al. 2010 Garite et al. 2004
Mortalità
twin. During this time period, selected fields from 10%of all records were reviewed routinely to provide qualityassurance of the database.
For statistical analyses we evaluated birth weight andoutcomes using Student t tests and analysis of variancefor means and c
2 and Fisher exact tests for categoricvariables in the univariate analyses. We also performedmultivariate analysis to assess the influence of confound-
ers such as multiple number, antenatal corticosteroidadministration, and birth order on birth weight and out-comes. We chose a probability value of !.01 for statis-tical significance in both the univariate and multivariateanalyses.
Results
There were 121,774 perinatal records in the data set, ofwhich 51,389 records met the inclusion criteria. We ex-cluded 6751 babies who were not born in the study fa-cilities, 62,464 babies who were !23 or O35 weeks ofgestation, 206 higher order multiple births, and 935 ba-bies with congenital anomalies or chromosomal defects.Those babies who were included in the study consistedof 36,931 singletons, 12,302 twins, and 2155 triplets.The gestational age distributions for these babies areshown in Figure 1. Baseline demographics are shownin the Table. The groups were similar except that themean gestational age was lower in triplets; the meanbirth weight was lower in twins and triplets, and twinsand triplets are more likely to be delivered by cesareandelivery, to receive antenatal steroids, and to be white.
The first outcome that we evaluated was whether plu-rality affected mortality rates at each gestational agestudied (Figure 2). No statistically significant differenceswere seen among singletons, twins, and triplets at any ofthe included gestational ages. Because multiple births
Figure 1 The number of neonates in the study is given ateach week of gestational age for singleton births (diamondline), twin births (closed square line), and triplet births (triangleline). EGA, Estimated gestational age.
Figure 2 The neonatal mortality rate for all babies who diedduring the original hospitalization at each week of gestationalage is given. The bars on the left represent singletons; themiddle bars represent twins, and the bars on the right representtriplets. There are no differences seen among singleton births,twin births, or triplet births. EGA, Estimated gestational age.Table Demographic comparison of groups
Singleton Twins Triplets
Number ofneonates
36,931 12,302 2155
Gestational age,mean C SD
32 G 3 32 G 3 31 G 3*
Birth weight,mean G SD
1.83 G 0.7 1.76 G 0.5* 1.59 G 0.5*
APGAR1,mean G SD
7 G 2 7 G 2 7 G 2
APGAR5,mean G SD
8 G 1 8 G 1 8 G 1
APGAR5 % 3 557 (1.5) 134 (1.1) 25 (1.2)Male, n (%) 20275 (55) 6262 (51) 1074 (50)Antenatalsteroids, n (%)
18485 (50) 6815 (55)* 1531 (71)*
Delivered byC-section (%)
17498 (47) 8123 (66)* 2038 (95)*
RaceBlack, n (%) 6677 (18.1) 1690 (13.7) 91 (4.2)Hispanic, n (%) 7675 (20.8) 1733 (14.1) 215 (10)White, n (%) 19253 (52.1) 7898 (64.2)* 1673 (77.6)*Other, n (%) 3326 (9.0) 981 (8.0) 176 (8.2)
* P ! .01 compared with singleton admissions.
702 Garite et al
et al17 and Myles et al,18 but contrary to the commonly heldperception that the premature cervical effacement and dilata-tion occurs in multiple gestations favouring ascending infectionand the subsequent increased incidence of chorioamnionitis.19
We noted a decreased risk of previous preterm birth in twinand triplet pregnancies when compared with singleton preg-nancies. This finding can be explained by the fact that 27.0% oftwins and 65.3% of triplets were born to infertile mothers,conceiving for the first time as a result of assisted conception.
Twins and triplets received more antenatal steroids in ourstudy population. Similar observations have been made earlierin large population-based studies from Israel andPennsylvania.16 20 Twins and triplets were significantly morelikely to be born at a tertiary perinatal centre. This is alsoconsistent with earlier reports from Australia, as well as otherregions.13 20 21 There was no difference in the Caesarean sectionrate for twins (53.0%) when compared with singletons (53.5%).A similar observation has been reported in another population-based study.16 The Caesarean section rate was significantlyhigher for triplets (84.1%) than for twins (53.0%) in our study.Emergency Caesarean section was also done significantly morefor twins and triplets. This is also noted earlier from a singletertiary centre in Australia by Barkehall-Thomas et al.22
Neonatal morbiditiesIn our study, twins had an increased risk of HMD despite ahigher exposure to antenatal steroids. A similar observation hasalso been made previously in other studies.5 7 16 23 24 Researchershave suggested that the effects of antenatal steroids in multiples
might be less than in singletons.7 The lower risk of HMD intriplets in the present study might be explained by the very high(.95%) antenatal steroid coverage in this group.
The similar incidence of chronic lung disease (respiratorysupport at 36 weeks’ gestation) in all groups in our study isconsistent with other studies.5 7 20 25 The incidence of othermajor neonatal morbidities and the duration of hospital staywere similar between the groups.
Neonatal mortalityOur study reconfirms that lower gestational age, male genderand the absence of antenatal steroids are independent predictorsof mortality for infants born at 22–31 weeks’ gestation. This isconsistent with previously published reports.5 7
Furthermore, assisted conception was an independent pro-tective factor against mortality in this group of infants. Asystematic review of studies on perinatal outcome in singletonsand twins has revealed that overall perinatal outcomes insingleton pregnancies from assisted conception are significantlyworse than non-assisted singleton pregnancies.26 However, intwin pregnancies, perinatal mortality is approximately 40%lower after assisted compared with natural conception.26 Thereasons for this remain uncertain. However, there are multiplefactors that could have contributed to this. Chorionicity hasbeen identified as an important factor.27 Dichorionic pregnanciesfare better than monochorionic pregnancies28 and the latteraccount for 5–7% of assisted compared with 30% of naturaltwin pregnancies.27 Another explanation could be the fact thatassisted pregnancies may actually be a marker for a number ofunstudied factors such as early heathcare provision and otherpsychosocial and biological factors26 29 In our analysis we couldnot account for all the confounders due to the non-availabilityof data such as chorionicity and zygosity,28 cord anomalies30 andsocioeconomic factors in our database.
In our multivariable regression model, plurality was not a riskfactor for mortality in the overall group. This finding is similarto a number of other large population and multicentre studies.Shinwell et al7 collected data from the Israel national very lowbirth weight infant database and reported similar mortalityrates among very low birth weight twins and singletons.Donovan et al5 found no difference between overall outcomes oftwins and singletons in the National Institute of Child Healthand Disease Very Low Birth Weight Network. Twins in our 22–27 weeks subgroup were found to have a higher mortality rate
Table 3 Multiple logistic regression model for clinical features predictive of mortality in NICU amongsingletons, twins and triplets 22–31 weeks’ gestation
Factor b coefficient (SE) OR (95% CI) p Value
Twins versus singletons 0.15 (0.08) 1.16 (0.99 to 1.36) 0.069
22–27 weeks’ gestation 0.33 (0.11) 1.39 (1.12 to 1.72) 0.002
28–31 weeks’ gestation 20.08 (0.14) 0.93 (0.71 to 1.21) 0.582
Triplets versus singletons 20.05 (0.24) 0.95 (0.59 to 1.52) 0.830
22–27 weeks’ gestation 0.50 (0.30) 1.66 (0.92 to 2.99) 0.093
28–31 weeks’ gestation 20.80 (0.47) 0.45 (0.18 to 1.14) 0.092
Assisted conception 20.36 (0.11) 0.69 (0.57 to 0.86) 0.001
Outborn 0.13 (0.12) 1.14 (0.95 to 1.45) 0.259
No antenatal steroid 0.65 (0.10) 1.92 (1.62 to 2.29) ,0.001
Emergency Caesarean delivery 0.05 (0.91) 1.05 (0.88 to 1.26) 0.564
Birth weight percentile 20.01 (0.01) 0.99 (0.98 to 0.99) ,0.001
Gestational age 20.54 (0.02) 0.58 (0.57 to 0.60) ,0.001
Male gender 0.21 (0.07) 1.23 (1.08 to 1.40) 0.002
Analysis of twins and triplets was performed for the whole 22–31 weeks cohort and then stratified for the two subgroups of 22–27 weeks’ and 28–31 weeks’ gestational age with singletons as the reference group. NICU, neonatal intensive care unit.
Figure 2 Gestational age-specific mortality for twins, singletons andtriplets. NICU, neonatal intensive care unit.
Original article
Arch Dis Child Fetal Neonatal Ed 2010;95:F20–F24. doi:10.1136/adc.2009.157701 F23
P = NS

Morbilità gemelli e singoli 22-32 W i gemelli:
Maggior rischio di n RDS (OR 1,2 - CI 1,1-1,3)
Analogo rischio per n IVH 3°-4°
n Anomalie ecografiche cerebrali: (idrocefalo, cisti parenchimali)
n ROP 3°-4° n PNX Garg et al. 2010 Garite et al. 2004

Outcome trigemini vs bigemini e singoli
Ballabh et al. 2002
!"#$"%&'(" )* &#+!,"&- #"./+#+%( +%&/0'&+)%1 &2" 3"'% 4/#'5&+)% )* +%&/0'&+)%1 &2" /-" )* -/#*'$&'%&1 +%$+4"%$" )* 678'%4 &2" %/30"# )* +%*'%&- #"$"+9+%( !)-&%'&', -&"#)+4- 4+4%)& 4+**"# -+(%+:$'%&,; '3)%( &2" &2#"" 3'&$2"4 (#)/!-<=%$+4"%$" )* '!%"' )* !#"3'&/#+&; '%4 !%"/3)&2)#'> ?'-',-) -+3+,'# '3)%( &2" &2#"" -&/4; (#)/!-<
!"#" $%&'()*+,(-.%(/ %0.1%2)
@)%5#"-!+#'&)#; )/&$)3"- '#" -2)?% +% A'0," B< A?)+%*'%&- )* )%" -"& )* &#+!,"& )* CD5?""E ("-&'&+)% 4+"4FG<HIJ ?2"#"'- K<BI )* &?+%- '%4 K<LI )* -+%(,"&)%- 4+"4<M/# !"#+%'&', 3)#&',+&; *)# &#+!,"&- ?'- DH<N !"# KGGG ,+9"0+#&2-< O3)%( &#+!,"&-1 B<LI 2'4 78O 0/& )%,; G<NI ?"#"&#"'&"4 ?+&2 +%4)3"&2'$+%< A2" +%$+4"%$" )* 78O +% &#+!,"&-?'- -+3+,'# +% &?+%- FP<HIJ '%4 -+%(,"&)%- FH<GIJ< Q+,4 =RSF(#'4"- = '%4 ==J ?'- *)/%4 +% P<LI '%4 -"9"#" =RS F(#'4"-=== '%4 =RJ ?'- *)/%4 +% C<KI &#+!,"& +%*'%&-< 7RT ?'-)0-"#9"4 '3)%( G<HI '%4 -"+U/#"- '3)%( G<BI )* &2"&#+!,"& %")%'&"-< 7"#$"%&'(" )* &#+!,"&-1 4"9",)!+%( =RS17RT '%4 -"+U/#"-1 4+4 %)& 4+**"# +% $)3!'#+-)% &) &?+%-'%4 -+%(,"&)%-< 72)&)&2"#'!; ?'- #"./+#"4 +% BD<CI )*&#+!,"&-1 ?2+$2 ?'- %)& -+(%+:$'%&,; 4+**"#"%& $)3!'#"4 &)&?+%- FBC<LIJ )# -+%(,"&)%- FBL<HIJ< V/-!"$&"4 @WX ?'-4+'(%)-"4 +% C<GI &#+!,"& +%*'%&- 0/& %)%" )* &2"-" +%*'%&-4"9",)!"4 4":%+&" @WX< M%" )* &2" &?+%- 4"9",)!"4'49'%$"4 @WX #"./+#+%( -/#("#;< S)?"9"#1 &2" !"#$"%&'(")* +%*'%&- 4"9",)!+%( -/-!"$&"4 @WX ?'- -+3+,'# '3)%( &2"&2#"" (#)/!- FC<GI 9"#-/- K<LI 9"#-/- K<LIJ< A2" +%$+4"%$")* 4":%+&" ('-&#)"-)!2'("', #"Y/> 4+-"'-" 4+4 %)& 4+**"#-+(%+:$'%&,; '3)%( &2" &2#"" (#)/!- FC<HI 9"#-/- K<LI9"#-/- P<CIJ< Q)#")9"#1 &2" !"#$"%&'(" )* 0'0+"- ?+&2-/-!"$&"4 ('-&#)"-!2'("', #"Y/> ?'- ',-) -+3+,'# +% &2"&2#"" (#)/!-< A2" !"#$"%&'(" )* 0'0+"- 4+'(%)-"4 ?+&2!#"&2#"-2),4 '%4 &2#"-2),4 ZM71 -"!-+-1 #"./+#+%( 4""! ,+%"!,'$"3"%&1 '%4 *'+,/#" )* &2" 2"'#+%( -$#""% ?'- ',-) %)&-+(%+:$'%&,; 4+**"#"%& +% &2" &2#"" (#)/!-< O%)3',+"-#"$)#4"4 '3)%( &2" &2#"" (#)/!- )* 0'0+"- '#" ,+-&"4 +%A'0," D< O('+%1 &2" !"#$"%&'(" )* 0'0+"- 4+'(%)-"4 ?+&23'[)# '%4 3+%)# '%)3',+"- ?'- -+3+,'# +% &2" &2#"" (#)/!-<
A2" 3'[)#+&; FLG<LIJ )* &#+!,"& +%*'%&- ?'- 0)#% 0"&?""%BB5 '%4 BH5?""E ("-&'&+)%< O -/0-&'%&+', %/30"# )* &#+!,"&-?"#" 0)#% 0"&?""% C\5 '%4 BC5?""E )* ("-&'&+)% FC\<DIJ1?+&2 )%,; ' *"? FG<NIJ 0"+%( 0)#% 0"*)#" C\5?""E ("-&'&+)%<X)3!'#"4 &) -+%(,"&)%-1 &#+!,"&- ?"#" -3',,"# +% ?"+(2& *)#"'$2 ?""E )* ("-&'&+)% 0/& &2+- 4+**"#"%$" 4+4 %)& #"'$2-&'&+-&+$', -+(%+:$'%$" *)# CD51 CN51 BC5 '%4 BB5?""E ("-&'5&+)%< =% $)%&#'-&1 $)3!'#"4 &) &?+%-1 &#+!,"&- ?"#" %)& -3',,"#+% ?"+(2& *)# "'$2 ?""E )* ("-&'&+)% ">$"!& *)# BC5 '%4 BD5?""E ("-&'&+)%<=% &2" 3/,&+9'#+'&" '%',;-"- )* 3)#&',+&; '%4 3)#0+4+&;1
&2" '4[/-&"4 )44- #'&+) )* &#+!,"&- $)3!'#"4 &) &?+%- F#"*"#5"%&J *)# 2'9+%( ' !))# )/&$)3" ?'- K<L FNPI X= !G!\B"B!HD] 3 ! G!KD1 A'0," PJ< O%4 &2" '4[/-&"4 )44- #'&+)-*)# Z8V '%4 '%; =RS ',)%" ?"#" C<GL FNPIX= ! G!N\"D!BN] 3 ! G!GHJ '%4 G<PD FNPI X= ! G!CK"K!B\] 3 ! G!CJ1 #"-!"$&+9",;< T+E"?+-"1 &2" '4[/-&"4 )44-#'&+)- )* &#+!,"&- 9"#-/- -+%(,"&)%- F#"*"#"%&J ?+&2 #"-!"$& &)!))# )/&$)3"1 Z8V ',)%"1 '%4 '%; =RS ',)%" ?"#" C<NKFNPI X= ! G!CK"DG!BH] 3 ! G!DBJ1 C<H FNPI X= ! G!KN"BH!CP] 3 ! G!DLJ1 '%4 G<KL FNPI X= ! G!GK"B!KH]3 ! G!CDJ1 #"-!"$&+9",; FA'0," HJ< Z+-E )* !))# )/&$)3"1
A'0," CZ"-!+#'&)#; )/&$)3"
A#+!,"&-F& ! BD\J
A?+%-F& ! CBCJ
V+%(,"&)%-F& ! KKHJ
Z8V FIJ BH<K BC<P BC<KV/#*'$&'%& FIJ KL<\ KD<H K\<N=%&/0'&+)% FIJ CG<BC KD<\ KH<L8';- )* +%&/0'&+)% F3"'%J D<C # \<N H<L # KC<N P<D # H<N678 FIJ K<L C<H K<L7#"%'&', -&"#)+4 FIJ BK<\ BC<L BK<G7)-&%'&', -&"#)+4 FIJ D<C B<P C<PO!%"' )* !#"3'&/#+&; FIJ KN<D KL<D KD<L7%"/3)&2)#'> FIJ K<KL K<CP K<H
Z8V^ #"-!+#'&)#; 4+-&#"-- -;%4#)3"] 678^ 0#)%$2)!/,3)%'#; 4;-!,'-+']&#+!,"& 9-< &?+% '%4 &#+!,"& 9-< -+%(,"&)%1 *)# ',, &2" '0)9" 9'#+'0,"-13 " G!GP<
A'0," B@)%5#"-!+#'&)#; )/&$)3"
A#+!,"&-F& ! BD\J
A?+%-F& ! CBCJ
V+%(,"&)%-F& ! KKHJ
@")%'&', 3)#&',+&; FIJ G<H K<B K<LV"!-+- FIJ B<C B<G P<C8""! ,+%" FIJ \<N L<\ H<G78O FIJ B<L P<H H<G78O &#"'&"4 ?+&2+%4)3"&2'$+% FIJ
G<N K<L B<P
=RS_#'4" = FIJ D<G H<P D<B_#'4" == FIJ K<L G<N C<H_#'4" === FIJ K<C G<N K<L_#'4" =R FIJ G<N G<D G<G
V"+U/#" FIJ G<B G<N C<P7RT FIJ G<H K<L K<L7#"-/3"4 _WZ8 FIJ D<H B<G H<G8"*+%+&" _WZ8 FIJ C<H K<L P<CV/-!"$&"4 @WX FIJ C<G K<L K<L8"*+%+&" @WX FIJ G<G G<D G<G`'/%4+$" FIJ BD<C BC<L BL<HZM7^ !#"&2#"-2),4 FIJ C<N B<P B<PZM7^ &2#"-2),4 FIJ G<G G<G G<NO%)3',+"- FIJ P<P P<H H<GQ'[)# 3',*)#3'&+)% FIJ C<H B<P B<PS"'#+%( FOT_MJ -$#""%!"#*)#3"4 FIJ
DG<C PG<N HK<H
S"'#+%( -$#""% *'+,"4 FIJ G<H G<D G<G@=Xa '43+--+)% FIJ HD<D HN<K LH<\b",, 0'0; '43+--+)% FIJ BP<H BG<N CB<CQ"'% @=Xa 4';- KD<P # KN<L KC<P # KH<H KP<B # CB<D
A#+!,"& 9-< &?+% '%4 &#+!,"& 9-< -+%(,"&)%1 *)# ',, &2" '0)9" 9'#+'0,"-13 " G!GP] _WZ8^ ('-&#)"-)!2'("', #"*,/> 4+-"'-"] @WX^ %"$#)&+U+%("%&"#)$),+&"-] ZM7^ #"&+%)!'&2; )* !#"3'&/#+&;] 78O^ !'&"%& 4/$&/-'#&"#+)-/-] =RS^ +%&#'9"%&#+$/,'# 2"3)##2'("] 7RT^ !"#+9"%&#+$/,'# ,"/$)53','$+'] @=Xa^ %")%'&', +%&"%-+9" $'#" /%+&<
3" 4-55-67 ). -5" 8 90(%+)-& :%0(&-5 %; <6*.).(,1* = >/&)1%5%?/ -&@ A)+(%@01.,B) 4,%5%?/ CDE FGDD!H GIJ!K BK
P= NS
P= NS
!"#$"%&'(" )* &#+!,"&- #"./+#+%( +%&/0'&+)%1 &2" 3"'% 4/#'5&+)% )* +%&/0'&+)%1 &2" /-" )* -/#*'$&'%&1 +%$+4"%$" )* 678'%4 &2" %/30"# )* +%*'%&- #"$"+9+%( !)-&%'&', -&"#)+4- 4+4%)& 4+**"# -+(%+:$'%&,; '3)%( &2" &2#"" 3'&$2"4 (#)/!-<=%$+4"%$" )* '!%"' )* !#"3'&/#+&; '%4 !%"/3)&2)#'> ?'-',-) -+3+,'# '3)%( &2" &2#"" -&/4; (#)/!-<
!"#" $%&'()*+,(-.%(/ %0.1%2)
@)%5#"-!+#'&)#; )/&$)3"- '#" -2)?% +% A'0," B< A?)+%*'%&- )* )%" -"& )* &#+!,"& )* CD5?""E ("-&'&+)% 4+"4FG<HIJ ?2"#"'- K<BI )* &?+%- '%4 K<LI )* -+%(,"&)%- 4+"4<M/# !"#+%'&', 3)#&',+&; *)# &#+!,"&- ?'- DH<N !"# KGGG ,+9"0+#&2-< O3)%( &#+!,"&-1 B<LI 2'4 78O 0/& )%,; G<NI ?"#"&#"'&"4 ?+&2 +%4)3"&2'$+%< A2" +%$+4"%$" )* 78O +% &#+!,"&-?'- -+3+,'# +% &?+%- FP<HIJ '%4 -+%(,"&)%- FH<GIJ< Q+,4 =RSF(#'4"- = '%4 ==J ?'- *)/%4 +% P<LI '%4 -"9"#" =RS F(#'4"-=== '%4 =RJ ?'- *)/%4 +% C<KI &#+!,"& +%*'%&-< 7RT ?'-)0-"#9"4 '3)%( G<HI '%4 -"+U/#"- '3)%( G<BI )* &2"&#+!,"& %")%'&"-< 7"#$"%&'(" )* &#+!,"&-1 4"9",)!+%( =RS17RT '%4 -"+U/#"-1 4+4 %)& 4+**"# +% $)3!'#+-)% &) &?+%-'%4 -+%(,"&)%-< 72)&)&2"#'!; ?'- #"./+#"4 +% BD<CI )*&#+!,"&-1 ?2+$2 ?'- %)& -+(%+:$'%&,; 4+**"#"%& $)3!'#"4 &)&?+%- FBC<LIJ )# -+%(,"&)%- FBL<HIJ< V/-!"$&"4 @WX ?'-4+'(%)-"4 +% C<GI &#+!,"& +%*'%&- 0/& %)%" )* &2"-" +%*'%&-4"9",)!"4 4":%+&" @WX< M%" )* &2" &?+%- 4"9",)!"4'49'%$"4 @WX #"./+#+%( -/#("#;< S)?"9"#1 &2" !"#$"%&'(")* +%*'%&- 4"9",)!+%( -/-!"$&"4 @WX ?'- -+3+,'# '3)%( &2"&2#"" (#)/!- FC<GI 9"#-/- K<LI 9"#-/- K<LIJ< A2" +%$+4"%$")* 4":%+&" ('-&#)"-)!2'("', #"Y/> 4+-"'-" 4+4 %)& 4+**"#-+(%+:$'%&,; '3)%( &2" &2#"" (#)/!- FC<HI 9"#-/- K<LI9"#-/- P<CIJ< Q)#")9"#1 &2" !"#$"%&'(" )* 0'0+"- ?+&2-/-!"$&"4 ('-&#)"-!2'("', #"Y/> ?'- ',-) -+3+,'# +% &2"&2#"" (#)/!-< A2" !"#$"%&'(" )* 0'0+"- 4+'(%)-"4 ?+&2!#"&2#"-2),4 '%4 &2#"-2),4 ZM71 -"!-+-1 #"./+#+%( 4""! ,+%"!,'$"3"%&1 '%4 *'+,/#" )* &2" 2"'#+%( -$#""% ?'- ',-) %)&-+(%+:$'%&,; 4+**"#"%& +% &2" &2#"" (#)/!-< O%)3',+"-#"$)#4"4 '3)%( &2" &2#"" (#)/!- )* 0'0+"- '#" ,+-&"4 +%A'0," D< O('+%1 &2" !"#$"%&'(" )* 0'0+"- 4+'(%)-"4 ?+&23'[)# '%4 3+%)# '%)3',+"- ?'- -+3+,'# +% &2" &2#"" (#)/!-<
A2" 3'[)#+&; FLG<LIJ )* &#+!,"& +%*'%&- ?'- 0)#% 0"&?""%BB5 '%4 BH5?""E ("-&'&+)%< O -/0-&'%&+', %/30"# )* &#+!,"&-?"#" 0)#% 0"&?""% C\5 '%4 BC5?""E )* ("-&'&+)% FC\<DIJ1?+&2 )%,; ' *"? FG<NIJ 0"+%( 0)#% 0"*)#" C\5?""E ("-&'&+)%<X)3!'#"4 &) -+%(,"&)%-1 &#+!,"&- ?"#" -3',,"# +% ?"+(2& *)#"'$2 ?""E )* ("-&'&+)% 0/& &2+- 4+**"#"%$" 4+4 %)& #"'$2-&'&+-&+$', -+(%+:$'%$" *)# CD51 CN51 BC5 '%4 BB5?""E ("-&'5&+)%< =% $)%&#'-&1 $)3!'#"4 &) &?+%-1 &#+!,"&- ?"#" %)& -3',,"#+% ?"+(2& *)# "'$2 ?""E )* ("-&'&+)% ">$"!& *)# BC5 '%4 BD5?""E ("-&'&+)%<=% &2" 3/,&+9'#+'&" '%',;-"- )* 3)#&',+&; '%4 3)#0+4+&;1
&2" '4[/-&"4 )44- #'&+) )* &#+!,"&- $)3!'#"4 &) &?+%- F#"*"#5"%&J *)# 2'9+%( ' !))# )/&$)3" ?'- K<L FNPI X= !G!\B"B!HD] 3 ! G!KD1 A'0," PJ< O%4 &2" '4[/-&"4 )44- #'&+)-*)# Z8V '%4 '%; =RS ',)%" ?"#" C<GL FNPIX= ! G!N\"D!BN] 3 ! G!GHJ '%4 G<PD FNPI X= ! G!CK"K!B\] 3 ! G!CJ1 #"-!"$&+9",;< T+E"?+-"1 &2" '4[/-&"4 )44-#'&+)- )* &#+!,"&- 9"#-/- -+%(,"&)%- F#"*"#"%&J ?+&2 #"-!"$& &)!))# )/&$)3"1 Z8V ',)%"1 '%4 '%; =RS ',)%" ?"#" C<NKFNPI X= ! G!CK"DG!BH] 3 ! G!DBJ1 C<H FNPI X= ! G!KN"BH!CP] 3 ! G!DLJ1 '%4 G<KL FNPI X= ! G!GK"B!KH]3 ! G!CDJ1 #"-!"$&+9",; FA'0," HJ< Z+-E )* !))# )/&$)3"1
A'0," CZ"-!+#'&)#; )/&$)3"
A#+!,"&-F& ! BD\J
A?+%-F& ! CBCJ
V+%(,"&)%-F& ! KKHJ
Z8V FIJ BH<K BC<P BC<KV/#*'$&'%& FIJ KL<\ KD<H K\<N=%&/0'&+)% FIJ CG<BC KD<\ KH<L8';- )* +%&/0'&+)% F3"'%J D<C # \<N H<L # KC<N P<D # H<N678 FIJ K<L C<H K<L7#"%'&', -&"#)+4 FIJ BK<\ BC<L BK<G7)-&%'&', -&"#)+4 FIJ D<C B<P C<PO!%"' )* !#"3'&/#+&; FIJ KN<D KL<D KD<L7%"/3)&2)#'> FIJ K<KL K<CP K<H
Z8V^ #"-!+#'&)#; 4+-&#"-- -;%4#)3"] 678^ 0#)%$2)!/,3)%'#; 4;-!,'-+']&#+!,"& 9-< &?+% '%4 &#+!,"& 9-< -+%(,"&)%1 *)# ',, &2" '0)9" 9'#+'0,"-13 " G!GP<
A'0," B@)%5#"-!+#'&)#; )/&$)3"
A#+!,"&-F& ! BD\J
A?+%-F& ! CBCJ
V+%(,"&)%-F& ! KKHJ
@")%'&', 3)#&',+&; FIJ G<H K<B K<LV"!-+- FIJ B<C B<G P<C8""! ,+%" FIJ \<N L<\ H<G78O FIJ B<L P<H H<G78O &#"'&"4 ?+&2+%4)3"&2'$+% FIJ
G<N K<L B<P
=RS_#'4" = FIJ D<G H<P D<B_#'4" == FIJ K<L G<N C<H_#'4" === FIJ K<C G<N K<L_#'4" =R FIJ G<N G<D G<G
V"+U/#" FIJ G<B G<N C<P7RT FIJ G<H K<L K<L7#"-/3"4 _WZ8 FIJ D<H B<G H<G8"*+%+&" _WZ8 FIJ C<H K<L P<CV/-!"$&"4 @WX FIJ C<G K<L K<L8"*+%+&" @WX FIJ G<G G<D G<G`'/%4+$" FIJ BD<C BC<L BL<HZM7^ !#"&2#"-2),4 FIJ C<N B<P B<PZM7^ &2#"-2),4 FIJ G<G G<G G<NO%)3',+"- FIJ P<P P<H H<GQ'[)# 3',*)#3'&+)% FIJ C<H B<P B<PS"'#+%( FOT_MJ -$#""%!"#*)#3"4 FIJ
DG<C PG<N HK<H
S"'#+%( -$#""% *'+,"4 FIJ G<H G<D G<G@=Xa '43+--+)% FIJ HD<D HN<K LH<\b",, 0'0; '43+--+)% FIJ BP<H BG<N CB<CQ"'% @=Xa 4';- KD<P # KN<L KC<P # KH<H KP<B # CB<D
A#+!,"& 9-< &?+% '%4 &#+!,"& 9-< -+%(,"&)%1 *)# ',, &2" '0)9" 9'#+'0,"-13 " G!GP] _WZ8^ ('-&#)"-)!2'("', #"*,/> 4+-"'-"] @WX^ %"$#)&+U+%("%&"#)$),+&"-] ZM7^ #"&+%)!'&2; )* !#"3'&/#+&;] 78O^ !'&"%& 4/$&/-'#&"#+)-/-] =RS^ +%&#'9"%&#+$/,'# 2"3)##2'("] 7RT^ !"#+9"%&#+$/,'# ,"/$)53','$+'] @=Xa^ %")%'&', +%&"%-+9" $'#" /%+&<
3" 4-55-67 ). -5" 8 90(%+)-& :%0(&-5 %; <6*.).(,1* = >/&)1%5%?/ -&@ A)+(%@01.,B) 4,%5%?/ CDE FGDD!H GIJ!K BK

Garite et al. 2004
Morbilità gemelli e singoli
were more likely to receive antenatal corticosteroids,which may improve survival, we compared mortalityrates at each gestational age in babies who did not re-ceive antenatal corticosteroids and found that the mor-tality rate was similar at all gestational ages (Figure 3).There was a statistically lower rate of mortality in thosebabies who were treated antenatally with corticosteroidsfor both singletons and twins at 23 to 29 weeks of gesta-tion (Figure 3). The mortality rate beyond 29 weeks ofgestation was quite low with or without antenatal corti-costeroids. Because very few triplets were delivered vag-inally, we analyzed the effects of route of delivery andbirth order for twins only. The mortality rate was statis-tically and numerically similar at all gestational ages,regardless of order of birth. This similarity in birth order-related outcome remained when a correction was madefor the route of delivery (Figure 4). In univariate analy-sis, triplets and twins were more likely to receive surfac-tant and be ventilated at the gestational ages of 27, 28,and 29 weeks; and they also more often were on oxygenor ventilator support at 28 days after birth. However, inmultivariate analysis that included estimated gestationalage, birth weight, use of antenatal steroids, cesareandelivery, and gender; birth number was not associatedwith increased odds of any of these events. Compositemorbidity of babies who were discharged home is shownin Figure 5; again there were no differences among sin-gletons, twins, and triplets.
We next compared growth rates for fetuses of multi-ple versus singleton gestations by comparing mean birthweights for each group at each gestational age incre-ment. As in previously reported studies on birth weight,our data reveal that twins diverged significantly fromsingletons at 32 weeks of gestation, triplets at 29 to 30weeks of gestation, and quadruplets at approximately27 weeks of gestation.13 However, in a separate compar-ison, we then added the analysis of individual meanbirth weights of the smaller and larger of the twins pairs.
Figure 3 The percentage of mortality for singletons andtwins with and without antenatal corticosteroid administrationis given. In each set of 4 bars, the bar on the left (A) representssingletons who did receive antenatal steroids, the second bar(B) twins who did receive antenatal steroids, the third bar (C)singletons who did NOT receive antenatal steroids, and the baron the right (D) twins who did NOT receive antenatal steroids.There are no differences between A and B or C and D, butthere is a statistical difference in mortality rates for bothsingletons and twins between those infants who did and didnot receive antenatal steroids from 23 to 29 weeks of gestationinclusively.
Figure 4 The percentage of neonatal deaths is given by routeof delivery and by birth order. There are no statisticallysignificant differences at any of the grouped weeks ofgestational age for either route of delivery or order of delivery.The medium gray bars represent Twin A vaginal delivery; thedark gray bars represent Twin B vaginal delivery; the open barsrepresent Twin A cesarean delivery; and the light gray barsrepresent Twin B cesarean delivery.
Figure 5 Babies who were discharged to home alive at eachweek of gestational age without NEC, severe (grades 3 or 4)IVH or severe degrees (grades 3 or 4) of ROP is given. Thereare no differences in these composite morbidities at anygestational age between singletons (closed bars), twins (darkgray bars), or triplets (medium gray bars). EGA, Estimatedgestational age.
Garite et al 703

Discordanza peso neonatale
What is remarkable is that the birth weight of the largertwin was similar to singletons at all gestational ages thatwere evaluated, whereas the smaller twin diverges fromthe larger twin and singleton as early as 27 to 28 weeksof gestation (Figure 6). Because multiple gestations aremore likely to have diabetes mellitus, preeclampsia,and IUGR from other causes, we eliminated thesevariables; and the differences that were described inFigure 6 remained the same.
Data on twin discordance were evaluated in 5166 twins(10,322 babies). The degree of discordance and frequen-cies of each interval is shown in Figure 7. The mortalityrate at each interval did not differ until the difference be-tween the twins was R40%. Composite morbidity (dis-charged without NEC, IVH, or ROP) in multivariateanalysis showed that being the larger twin, regardless ofdegree of discordance, was associated with better out-come with a relative risk of 1.3 (95%CI, 1.1-1.8) of beingdischarged without these complications.
We next addressed whether the degree of discordanceor the absolute growth restriction was more predictiveof adverse outcome. Figure 8 compares singletons andtwins with progressive degrees of birth weight discor-dance. The degree of discordance is broken down bymultiples of the standard deviation from the mean(Z scores). This figure demonstrates that mortality rateswere not affected by twin discordance when correctedfor the degree of growth restriction and that the increasein mortality rate became significant when the degree ofgrowth restriction was at or below 2.5 standard devia-tions from the mean.
In the multivariate analyses, when gestational ageand plurality were evaluated by logistic regression,neither twins nor triplets independently increased theodds of death or morbidity. We also found that birth or-der and route of delivery were not associated indepen-dently with an increased risk of death or morbidityand that the effect of birth size (larger twin vs smallertwin) on both morbidity and mortality rates was signif-icant, but only in the earlier gestational age groups, asshown in the univariate analysis.
Comment
This in-depth analysis, which is of one of the largestaccumulations of data on multiple births, allowed theauthors to gather a substantial amount of clinically rel-evant data. It is reassuring for care of these patients thatgestational age-specific mortality rates and survivalwithout significant morbidity are similar for singletons,twins, and triplets. Our study that shows similar mortal-ity rates at various gestational ages for singletons versusmultiple births is similar to 2 other recent studies.14,15
However, it is reassuring and important that these sim-ilarities in mortality and morbidity rates are confirmedby this much larger study from many diverse institu-tions, which implies a higher likelihood of broader gen-eralizability. Thus, it is apparent that the primary anddominant factor that affects the higher rates of mortalityand morbidity for multiple births is prematurity andthat efforts at reducing prematurity and avoiding com-plications from prematurity should be our primary focus
Figure 6 Mean birth weights at each week of gestational agefor singletons (black line), the means of both twins (brown line),and the mean birth weights of the larger (blue line) and smaller(red line) of the twins. A statistically significant difference isreached at 32 weeks for the average of both twins versussingletons. There is no difference at any gestational agebetween the mean birth weights of the larger twin andsingletons. *Growth difference between large and small twinand between singleton and small twin becomes statisticallysignificant at P ! .01 between 27 and 35 weeks.
Figure 7 Comparison of mortality rates for twins by degreeof discordance between twins. Each bar represents a fractiondifference between twin birth weights of 0.10. A statisticallysignificant increase in mortality rates at each 10% difference inbirth weights is reached when there is a R40% differencebetween twins. The asterisk denotes a probability value of!.01.
704 Garite et al
Garite et al. 2004
“piccolo” vs “grande” e “piccolo” vs singolo
P<.01

Discordanza peso: morbilità
What is remarkable is that the birth weight of the largertwin was similar to singletons at all gestational ages thatwere evaluated, whereas the smaller twin diverges fromthe larger twin and singleton as early as 27 to 28 weeksof gestation (Figure 6). Because multiple gestations aremore likely to have diabetes mellitus, preeclampsia,and IUGR from other causes, we eliminated thesevariables; and the differences that were described inFigure 6 remained the same.
Data on twin discordance were evaluated in 5166 twins(10,322 babies). The degree of discordance and frequen-cies of each interval is shown in Figure 7. The mortalityrate at each interval did not differ until the difference be-tween the twins was R40%. Composite morbidity (dis-charged without NEC, IVH, or ROP) in multivariateanalysis showed that being the larger twin, regardless ofdegree of discordance, was associated with better out-come with a relative risk of 1.3 (95%CI, 1.1-1.8) of beingdischarged without these complications.
We next addressed whether the degree of discordanceor the absolute growth restriction was more predictiveof adverse outcome. Figure 8 compares singletons andtwins with progressive degrees of birth weight discor-dance. The degree of discordance is broken down bymultiples of the standard deviation from the mean(Z scores). This figure demonstrates that mortality rateswere not affected by twin discordance when correctedfor the degree of growth restriction and that the increasein mortality rate became significant when the degree ofgrowth restriction was at or below 2.5 standard devia-tions from the mean.
In the multivariate analyses, when gestational ageand plurality were evaluated by logistic regression,neither twins nor triplets independently increased theodds of death or morbidity. We also found that birth or-der and route of delivery were not associated indepen-dently with an increased risk of death or morbidityand that the effect of birth size (larger twin vs smallertwin) on both morbidity and mortality rates was signif-icant, but only in the earlier gestational age groups, asshown in the univariate analysis.
Comment
This in-depth analysis, which is of one of the largestaccumulations of data on multiple births, allowed theauthors to gather a substantial amount of clinically rel-evant data. It is reassuring for care of these patients thatgestational age-specific mortality rates and survivalwithout significant morbidity are similar for singletons,twins, and triplets. Our study that shows similar mortal-ity rates at various gestational ages for singletons versusmultiple births is similar to 2 other recent studies.14,15
However, it is reassuring and important that these sim-ilarities in mortality and morbidity rates are confirmedby this much larger study from many diverse institu-tions, which implies a higher likelihood of broader gen-eralizability. Thus, it is apparent that the primary anddominant factor that affects the higher rates of mortalityand morbidity for multiple births is prematurity andthat efforts at reducing prematurity and avoiding com-plications from prematurity should be our primary focus
Figure 6 Mean birth weights at each week of gestational agefor singletons (black line), the means of both twins (brown line),and the mean birth weights of the larger (blue line) and smaller(red line) of the twins. A statistically significant difference isreached at 32 weeks for the average of both twins versussingletons. There is no difference at any gestational agebetween the mean birth weights of the larger twin andsingletons. *Growth difference between large and small twinand between singleton and small twin becomes statisticallysignificant at P ! .01 between 27 and 35 weeks.
Figure 7 Comparison of mortality rates for twins by degreeof discordance between twins. Each bar represents a fractiondifference between twin birth weights of 0.10. A statisticallysignificant increase in mortality rates at each 10% difference inbirth weights is reached when there is a R40% differencebetween twins. The asterisk denotes a probability value of!.01.
704 Garite et al
tional age dating have been noted.14 However, we foundthat the accuracy of gestational age dating for twinpreterm births was much greater than for singletonbirths, as judged by appropriateness of birth weight dis-tributions for gestational age.15
Birth weight discordance, expressed in percentages,was determined as 100(A-B)/A, where A was the birthweight of the heavier twin and B was the birth weight ofthe lighter twin. Gestational age on the birth certificatewas calculated from the last normal menstrual period.The parameters of small for gestational age (SGA) andlarge for gestational age (LGA) were defined by respectivebirth weights at <10th percentile and ≥90th percentilefor gestational age among study cases with birth weightdiscordance <30%, stratified by birth order.
Relative risk and significance values were calculatedfrom 2 × 2 and from 2 × 3 contingency tables. Multiple lo-gistic regression was performed with SPSS 8.0 (SPSS Inc,Chicago, Ill) statistical software. Forward stepwise regres-sion was used, with entry variables that had predicted livebirth at <32 weeks’ gestation at P < .05 in univariate analysis.These were as follows: discordance >40% versus all oth-ers, discordance of 30% to 40% versus all others, blackversus white race of mother, unmarried versus marriedmother, maternal age <20 years versus ≥20 years, number(0, 1, or 2) of male fetuses, maternal education <12 yearsversus ≥12 years, nulliparous versus multiparous mother,and any cigarette smoking versus none. Because of its im-portance, the variable “either twin SGA” was also evalu-ated in the multivariate models, even though it was not(by definition) predictive in univariate analysis. Furtherdetails regarding the relationships between length of ges-tation, number of male fetuses, and sociodemographicfactors, including maternal race, marital status, age,and education, have previously been reported in thisdata set.11, 16
ResultsAn inverse correlation between length of gestation and
birth weight discordance ≥30% is shown in Fig 1. Most ofthe association of birth weight discordance with pretermgestation occurred in gestations <32 weeks, and thisgroup was analyzed further.
At discordances <30%, there was no correlation be-tween degree of birth weight discordance and risk of de-livery before 32 weeks. However, there was a strong posi-tive relationship thereafter (Fig 2). For further analysis,cases were stratified according to birth weight discor-dance into <30%, 30% to 40%, and ≥40%. The rate of
64 Cooperstock et al July 2000Am J Obstet Gynecol
Table I. Rates of SGA and LGA birth weights in twinpregnancies with birth weight discordance ≥40% anddelivery at <32 weeks’ gestation
Birth weight Birth weight discordance (%)
<30% ≥40% Attributable StatisticalSGA* LGA† (n = 903) (n = 43) risk (%) significance
Absent Absent 78 12Present Absent 12 63 51 P < .00001Absent Present 10 26 16 P < .01
100 100(total) (total)
*SGA occurring in one or both infants.†LGA occurring in one infant (LGA did not occur in both infants).
Fig 1. Frequency (±95% confidence intervals) with whichpreterm birth weight discordance was >30%, by gestational ageat delivery. Gestational weeks 17 to 25, 26 to 28, and 29 to 30were grouped to allow a minimum of 200 cases for every gesta-tional age point plotted.
Fig 2. Frequency of preterm gestation (<32) weeks by birthweight discordance at delivery.
Garite et al. 2004 Cooperstock et al 2000

Maggior frequenza di n Taglio cesareo n Divergenza di genere
Nessuna evidenza riguardo n NEC
n Rianimazione neonatale n RDS/surfactante/BPD/apnee n Iperglicemia
n Anemia/policitemia n Ittero
Morbilità nei gemelli discordanti

The study group comprised 84 singleton births thatstarted as twins (44 after conventional IVF and 40 afterIVF/ICSI). All cases were defined as dichorionic by sono-graphic criteria. The control group comprised 602 singletonbirths that started as singletons (322 after conventional IVFand 280 after IVF/ICSI). An additional five stillbirths wereexcluded from the gestational age and birth weight analysis(one from the study group and four from the control group).These frequencies suggest that survivors of the vanishingtwin syndrome occurred in 12.2% (95% CI 9.6%–14.9%)of all liveborn singletons following ART. Table 1 showsthat the two groups had similar mean gestational age andbirth weight and similar frequencies of preterm (33–36weeks gestation) and very preterm (!32 weeks gestation)births, low birth weight (!2,500 g), and very low birthweight (!1,500 g). The similarity between study and con-trol births was also found when conventional IVF and IVF
plus ICSI pregnancies were separately evaluated. No dif-ference in maternal and neonatal complications betweenthe study and control groups were found.
The vanishing twin syndrome, in its pure sense, is afirst-trimester missed abortion of one of the twins, andconceivably the etiologies of first-trimester missed abor-tions differ from those occurring in the second trimester.Moreover, the unique situation in twin pregnancies maysuggest, at least from a theoretic perspective, that thesurviving fetus might be influenced by the early demise ofits cotwin. Thus, the vanishing twin syndrome should beconsidered as a specific subtype of single fetal demise intwins during the first trimester.
Outcome following an early loss of a twin should bediscussed from two major aspects. First and foremost is thepotential direct impact of embryonic loss on its cotwin,
TABLE 1
Gestational age and birth weight of singletons following either conventional IVF or IVF plus ICSIand started as either singleton or twin gestations. Data are presented as mean ! SD and as n (%).
Starting number Singletons Twins Statistics
IVF (n ! 366)n 322 44Gestational age (wk) 38.2 " 2.4 38.3 " 2.4 P#.05
!32 12 (3.7) 2 (4.4) 0.8 (0.2, 3.7)33–36 40 (12.4) 6 (13.4) 0.9 (0.3, 2.5)"37 270 (83.9) 36 (81.8) 1.1 (0.5, 2.8)
Birth weight (g) 3,049 " 622 3,164 " 627 P#.05!1,500 13 (4.0) 1 (2.2) 1.8 (0.2, 14.0)!2,500 45 (14.0) 3 (6.7) 2.4 (0.7, 7.7)#2,500 277 (86.0) 41 (93.3) 0.4 (0.1, 1.6)
IVF $ ICSI (n ! 320)n 280 40Gestational age (wk) 38.5 " 2.1 38.0 " 1.6 p#.05
!32 3 (1.1) 0 —33–36 41 (14.6) 6 (15.0) 1.0 (0.4, 2.8)"37 236 (84.3) 34 (85.0) 0.9 (0.3, 2.5)
Birth weight (g) 3,108 " 567 3,045 " 450 p#.05!1,500 6 (2.1) 0 —!2,500 32 (11.4) 6 (15.0) 0.7 (0.3, 2.1)#2,500 248 (87.9) 34 (85.0) 1.3 (0.4, 3.5)
All cases (n ! 686)n 602 84Gestational age (wk) 38.3 " 2.3 38.2 " 2.0 P#.05
!32 15 (2.5) 2 (2.4) 1.0 (0.2, 4.7)33–36 81 (13.4) 12 (14.3) 0.9 (0.5, 1.9)"37 506 (84.1) 70 (83.3) 1.0 (0.5, 2.0)
Birth weight (g) 3,079 " 597 3,111 " 549 P#.05!1,500 19 (3.1) 1 (1.2) 2.7 (0.4, 18.9)!2,500 78 (12.9) 9 (10.7) 1.2 (0.6, 2.8)#2,500 525 (87.1) 75 (89.3) 0.8 (0.4, 1.7)
La Sala. “Vanishing” twin syndrome following ART. Fertil Steril 2006.
248 La Sala et al. Correspondence Vol. 86, No. 1, July 2006
La Sala et al 2006
Vanishing twin syndrome • I trimestre
• Esatta frequenza non conosciuta
• No aumentato rischio di danno neurologico

• 5% di tutte le gravidanze gemellari nel II-III trimestre
• Mortalità del secondo feto
• MC (12%) > DC (4%)
• OR 6,04 CI 1,84-19,87
• Sequele neurologiche
• MC (18%) > DC (1%)
• OR 4,07 CI 1,32-12,51
• Parto pretermine
• MC (68%) > DC (57%)
• OR 1,91 CI 0,70-5,21 (NS)
Morte endouterina di un feto
Ong et al 2006

Copyright © 2012 ISUOG. Published by John Wiley & Sons, Ltd. 20
0
1
2
3
4
5
6
7
26+0 - 27+6 28+0 - 29+6 30+0 - 31+6 32+0 - 33+6 34+0 - 35+6 >36+0
Gestational Age (wks)
Pros
pect
ive
risk
(per
100
0 on
goin
g fe
tuse
s)
Figure 2: The gestation-specific risk of stillbirth expressed per 1000 continuing fetuses in monochorionic (filled squares) and
dichorionic (filled circles) in the current STORK study.
Acc
epte
d A
rticl
e
monocoriali
bicoriali
Thilaganathan et al 2012: STORK COHORT
Morte endouterina: stratificazione del rischio per età gestazionale

NIH-PA Author ManuscriptNIH-PA Author ManuscriptNIH-PA Author Manuscript
Refuerzo et al.
Page 11
Table 3
Secondary neonatal outcomes
Neonatal outcome MPTB LPTB Term p value*
Respiratory Composite 54 (67.5) 93 (33.8) 16 (8.1) <0.001
RDS 23 (28.8) 32 (11.7) 0 (0) <0.001
TTN 31 (38.8) 57 (20.8) 13 (6.7) <0.001
MV 21 (26.3) 17 (6.2) 2 (1.0) <0.001
Oxygen supplementation 47 (58.8) 82 (30.2) 11 (5.7) <0.001
Length of MV (d) 0.5 ± 1.0 0.3 ± 2.1 0.02 ± 0.23 <0.001†
Length of oxygen (d) 2.9 ± 4.5 1.2 ± 7.1 0.16 ± 1.15 <0.001†
Length of NICU (d) 22.7 ± 9.4 12.4 ± 14.7 6.8 ± 6.5 <0.001†
NICU admission 78 (97.5) 148 (54.0) 33 (16.9) <0.001
PDA 0 (0) 2 (0.7) 5 (2.6) 0.05
Pneumonia 2 (2.5) 4 (1.5) 1 (0.5) 0.17
5 Minute Apgar Score <7 6 (7.5) 10 (3.7) 5 (2.6) 0.08
*p value is from the Cohran-Armitage test for trend except where indicated
†p value is from the Kruskal-Wallis test
Results are mean ± standard deviation or n (%). TThere was one case of seizure in the LPTB group. LPTB, late preterm birth; MPTB, moderately preterm birth; MV, mechanical ventilation; NICU, neonatalintensive care unit; PDA, patent ductus arteriosus; RDS, respiratory distress syndrome; TTN, transient tachypnea of the newborn.
Am J Perinatol. A
uthor manuscript; available in PM
C 2011 A
ugust 1.
Refuerzo et al. 2010
MPTB = 32-33+6
LPTB = 34-36+6
TERM ≥ 37
NIH-PA Author ManuscriptNIH-PA Author ManuscriptNIH-PA Author Manuscript
Refuerzo et al.Page 10
Table 2
Primary neonatal outcomes
Neonatal outcome MPTB LPTB Term Cochran-Armitage Trend p value
Primary Composite 24 (30.0) 35 (12.8) 1 (0.5) <0.001
RDS 23 (28.8) 32 (11.7) 0 (0) <0.001
Sepsis 4 (5.0) 6 (2.2) 0 (0) 0.004
Results are n (%). There were no cases of severe retinopathy of prematurity, stage 3 or 4 intraventricular hemorrhage, or periventricular leukomalacia. There was one case of stage 2 or 3 necrotizingenterocolitis in the MPTB group, one case of bronchopulmonary dysplasia in the LPTB group, and one neonatal death in the LPTB group. LPTB, later preterm birth; MPTB, moderately preterm birth; RDS,respiratory distress syndrome; Sepsis, early onset, culture-proven sepsis.
Am J Perinatol. Author manuscript; available in PMC 2011 August 1.

D A T A A N D A N A L Y S E S
Comparison 1. Planned caesarean section versus planned vaginal birth
Outcome or subgroup titleNo. ofstudies
No. ofparticipants Statistical method Effect size
1 Maternal death or seriousmaternal morbidity
1 60 Risk Ratio (M-H, Fixed, 95% CI) 0.0 [0.0, 0.0]
2 Perinatal or neonatal death 1 120 Risk Ratio (M-H, Fixed, 95% CI) 0.0 [0.0, 0.0]3 Serious neonatal morbidity 1 120 Risk Ratio (M-H, Fixed, 95% CI) 0.0 [0.0, 0.0]
4 Apgar score less than seven atfive minutes < eight
1 120 Risk Ratio (M-H, Fixed, 95% CI) 1.22 [0.18, 8.39]
5 Apgar score less than four at fiveminutes < five
1 120 Risk Ratio (M-H, Fixed, 95% CI) 0.0 [0.0, 0.0]
6 Neonatal encephalopathy, asdefined by trial authors
1 120 Risk Ratio (M-H, Fixed, 95% CI) 0.0 [0.0, 0.0]
7 Birth trauma, as defined by trialauthors
1 120 Risk Ratio (M-H, Fixed, 95% CI) 0.0 [0.0, 0.0]
8 Nerve palsy (including brachialplexus injury)
1 120 Risk Ratio (M-H, Fixed, 95% CI) 0.0 [0.0, 0.0]
9 Subdural or intracerebralhaemorrhage
1 120 Risk Ratio (M-H, Fixed, 95% CI) 0.0 [0.0, 0.0]
10 Intraventricular haemorrhage:grade III or IV
1 120 Risk Ratio (M-H, Fixed, 95% CI) 0.0 [0.0, 0.0]
11 Short-term maternal outcomes:caesarean section
1 60 Risk Ratio (M-H, Fixed, 95% CI) 13.36 [4.05, 44.09]
12 Short-term maternal outcomes:mortality
1 60 Risk Ratio (M-H, Fixed, 95% CI) 0.0 [0.0, 0.0]
13 Short-term maternal outcomes:serious maternal morbidity
1 60 Risk Ratio (M-H, Fixed, 95% CI) 0.0 [0.0, 0.0]
18Planned caesarean section for women with a twin pregnancy (Review)
Copyright © 2011 The Cochrane Collaboration. Published by John Wiley & Sons, Ltd.
Gemelli: cesareo o parto spontaneo?
Hofmeyr GJ, Barrett JF, Crowther CA – The COCHRANE Library 2011

Modalità di parto e ordine di nascita sulla mortalità
were more likely to receive antenatal corticosteroids,which may improve survival, we compared mortalityrates at each gestational age in babies who did not re-ceive antenatal corticosteroids and found that the mor-tality rate was similar at all gestational ages (Figure 3).There was a statistically lower rate of mortality in thosebabies who were treated antenatally with corticosteroidsfor both singletons and twins at 23 to 29 weeks of gesta-tion (Figure 3). The mortality rate beyond 29 weeks ofgestation was quite low with or without antenatal corti-costeroids. Because very few triplets were delivered vag-inally, we analyzed the effects of route of delivery andbirth order for twins only. The mortality rate was statis-tically and numerically similar at all gestational ages,regardless of order of birth. This similarity in birth order-related outcome remained when a correction was madefor the route of delivery (Figure 4). In univariate analy-sis, triplets and twins were more likely to receive surfac-tant and be ventilated at the gestational ages of 27, 28,and 29 weeks; and they also more often were on oxygenor ventilator support at 28 days after birth. However, inmultivariate analysis that included estimated gestationalage, birth weight, use of antenatal steroids, cesareandelivery, and gender; birth number was not associatedwith increased odds of any of these events. Compositemorbidity of babies who were discharged home is shownin Figure 5; again there were no differences among sin-gletons, twins, and triplets.
We next compared growth rates for fetuses of multi-ple versus singleton gestations by comparing mean birthweights for each group at each gestational age incre-ment. As in previously reported studies on birth weight,our data reveal that twins diverged significantly fromsingletons at 32 weeks of gestation, triplets at 29 to 30weeks of gestation, and quadruplets at approximately27 weeks of gestation.13 However, in a separate compar-ison, we then added the analysis of individual meanbirth weights of the smaller and larger of the twins pairs.
Figure 3 The percentage of mortality for singletons andtwins with and without antenatal corticosteroid administrationis given. In each set of 4 bars, the bar on the left (A) representssingletons who did receive antenatal steroids, the second bar(B) twins who did receive antenatal steroids, the third bar (C)singletons who did NOT receive antenatal steroids, and the baron the right (D) twins who did NOT receive antenatal steroids.There are no differences between A and B or C and D, butthere is a statistical difference in mortality rates for bothsingletons and twins between those infants who did and didnot receive antenatal steroids from 23 to 29 weeks of gestationinclusively.
Figure 4 The percentage of neonatal deaths is given by routeof delivery and by birth order. There are no statisticallysignificant differences at any of the grouped weeks ofgestational age for either route of delivery or order of delivery.The medium gray bars represent Twin A vaginal delivery; thedark gray bars represent Twin B vaginal delivery; the open barsrepresent Twin A cesarean delivery; and the light gray barsrepresent Twin B cesarean delivery.
Figure 5 Babies who were discharged to home alive at eachweek of gestational age without NEC, severe (grades 3 or 4)IVH or severe degrees (grades 3 or 4) of ROP is given. Thereare no differences in these composite morbidities at anygestational age between singletons (closed bars), twins (darkgray bars), or triplets (medium gray bars). EGA, Estimatedgestational age.
Garite et al 703
Garite et al. 2004

!"#$%!%&' %&($)*(%+& ,"!" -+,"! *.+&' (!%/-"(0 1 2+./*!"3(+ (!%/-"(0 4 *&3 56 7+,"8"!9 &+&" +: (;" 2+./*!%0+&0 ,"!"0(*(%0(%2*--< 0%'&%=2*&(6 >& *33%(%+& (;" %&2%3"&2" +: ?@190"/0%09 >A79 ?AB9 CD? *&3 EFC@ ,"!" *-0+ &+( 0%'&%=G2*&(-< 3%::"!"&( *.+&' (;" (;!"" '!+$/06 H;" ."*& )%!(;,"%';( :+! (,%&0 1,*0 IJJK ' *&3 (;" ."*& ,"%';( :+! (,%&04 ,*0 IJLJ '6 H;" 3%::"!"&2" ,*0 &+( 0(*(%0(%2*--< 0%'&%=G2*&(6 M" +)0"!8"3 %&2!"*0"3 :!"#$"&2%"0 :+! C@N OPJ6QR8"!0$0 QK6SRT9 $0" +: 0$!:*2(*&( OIQ6UR 8"!0$0 IV6PRT9%&:*&(0 !"#$%!%&' %&($)*(%+& OS6JR 8"!0$0 V6KRT *&3 4?@OI6VR 8"!0$0 Q6KRT *.+&' (,%& 4 %&:*&(0 2+./*!"3 (+ (,%&19 )$( (;%0 ,*0 &+( 0(*(%0(%2*--< 3%::"!"&(6 D(;"! .+!)%3%(%"0%&2-$3%&' %&2%3"&2" +: 0"/0%09 >A79 CD?9 EFC@ *&3 2+&G'"&%(*- *&+.*-%"0 ,"!" *-0+ &+( 0%'&%=2*&(-< 3%::"!"&()"(,""& =!0( *&3 0"2+&3 )+!& (,%& %&:*&(06
!"#" $%&'() *' '&+',-,. +/-0+1& +2 -%*3.&- 3%&4','0*&)
2%+1 566! -+ 7888
W"+&*(*- +$(2+." +: (!%/-"(0 :!+. IJJQ (+ PXXX %0 %--$0(!*("3%& H*)-" U6 1-(;+$'; (;" &$.)"! +: (!%/-"( )%!(;0 %&2!"*0"30%'&%=2*&(-< :!+. IJJQ (+ PXXX9 (;" ."*& '"0(*(%+&*- *'" *&3)%!(; ,"%';( +: (!%/-"(0 3%3 &+( 2;*&'" 0%'&%=2*&(-< +8"! (%."O1WDA1 $0"3T6 1& %&2!"*0" %& (;" $0" +: /!"&*(*- 0("!+%3O9 ! X"XS9 1WDA1T ,*0 +)0"!8"3 +8"! (;" /"!%+3 +: 0($3<9)$( (;" %&2%3"&2" +: C@N !".*%&"3 :*%!-< 2+&0(*&(6 W+ 3"=&%("(!"&3 %& (;" :!"#$"&2%"0 +: $0" +: 0$!:*2(*&(9 ?@19 >A79 CD?*&3 /+0(&*(*- $0" +: 0("!+%3 ,*0 &+("3 +8"! (;" V <"*!0 +: 0($3</"!%+36 D: L OI6VRT %&:*&(0 3%*'&+0"3 ,%(; 4?@9 Q +: (;".,"!" )+!& %& IJJU *&3 I "*2; %& IJJV9 IJJJ *&3 PXXX6
!" #$%&'%%$()
>&:*&(0 +: (!%/-"( '"0(*(%+& 2+&0(%($(" *& %&2!"*0%&' /!+G/+!(%+& +: YN )%!(;0 *&3 0%'&%=2*&( /!+/+!(%+& +: W>5Y
H*)-" LZ*2(+!0 "8*-$*("3 %& (;" .+3"-0 +: .+!(*-%(< *&3 .+!)%3%(< !%0[0 *.+&' (!%/-"( *&3 0%&'-"(+& %&:*&(0 O' ! KLKT*
Z*2(+!) ?++! +$(2+."2 C@N3 1&< >A7
DC" JSR 5>: 9 8*-$" DC" JSR 5>: 9 8*-$" DC" JSR 5>: 9 8*-$"
H!%/-"(* P6JI OX6PI9 KX6QLT X6KQ P6LX OX6IJ9 QL6PST X6KV X6IV OX6XI9 Q6ILT X6PK>AZ X6KK OX6XQ9 L6QLT X6SS X6SX OX6XK9 V6PLT X6LI V6II OX6QQ9 ISQ6LVT X6PI\*("!&*- *'" I6XI OX6JL9 I6XST X6UX I6XX OX6JL9 I6XST X6UV I6XI OX6JK9 I6XJT X6UQC*2" X6QS OX6IK9 X6JPT X6XQ X6QK OX6IQ9 X6JPT X6XQ I6VK OX6QS9 U6VKT X6SX?!"&*(*- 0("!+%3 I6PU OX6LP9 P6LIT X6SI I6IV OX6SV9 P6KIT X6LU I6SU OX6SP9 K6ULT X6KPE"&3"! X6JJ OX6SU9 I6VIT X6JJ I6XK OX6LX9 I6UXT X6UU I6IP OX6KU9 P6LQT X6VJ4%!(; ,"%';( X6JJ OX6JS9 I6XKT X6VV X6JJ OX6JS9 I6XKT X6VL I6XX OX6JQ9 I6XJT X6JQE"0(*(%+&*- *'" X6SX OX6QJ9 X6LST ]X6XXXI X6SX OX6QJ9 X6LST ]X6XXXI X6VU OX6SU9 I6XLT X6II
* H!%/-"(0 O' ! QKUT 806 0%&'-"(+&0 O' ! IILT O!":"!"&(T6) >AZ^ <"0 806 &+ O!":"!"&(T_ .*("!&*- *'"^ 2+&(%&$+$0 8*!%*)-" %& .+3"-_ !*2"^ )-*2[0 +! 10%*&0 806 ,;%("0 O!":"!"&(T_ /!"&*(*- '-$2+2+!(%2%+%30 O0("!+%30T^
<"0 806 &+ O!":"!"&(T_ '"&3"!^ .*-" 806 :".*-" O!":"!"&(T_ )%!(; ,"%';(^ 2+&(%&$+$0 8*!%*)-" %& .+3"- OSX ' %&2!"."&(0T_ '"0(*(%+&*- *'"^ 2+&(%&$+$0 8*!%*)-" %&.+3"-6
2 ?++! +$(2+."^ 3"*(;9 &"2!+(%`%&' "&("!+2+-%(%09 %&(!*8"&(!%2$-*! ;".+!!;*'" >a>>> +! >A9 0"/0%09 +! !"0/%!*(+!< 3%0(!"00 0<&3!+."63 C"0/%!*(+!< 3%0(!"00 0<&3!+."6" D330 !*(%+6 13b$0("3 :+! *-- +(;"! 8*!%*)-"0 %& * -+'%0(%2 !"'!"00%+& .+3"-6: JSR 2+&:%3"&2" %&("!8*-6
H*)-" VD$(2+." +: (!%/-"( 1 806 (!%/-"( 4 806 (!%/-"( 5
H!%/-"( 1O' ! IILT
H!%/-"( 4O' ! IILT
H!%/-"( 5O' ! IILT
M"%';( O'T PXXS6L " KSJ6Q IJLJ6K " KV6K IUKK6S " KLU6LC@N ORT QQ6J QU6I QL6KN$!:*2(*&( ORT IS6S PX6L IV6P>&($)*(%+& ORT PX6XL PP6K IJ6IQ@*<0 +: %&($)*(%+&O."*&T
L6P " IS6P P6J " P6V Q6Q " I6J
4?@ Q6K X6X I6VW"+&*(*- .+!(*-%(< ORT X6X X6J X6JN"/0%0 ORT K6Q P6L P6L?@1 ORT S6P P6L Q6K?@1 (!"*("3 ,%(; %&G3+."(;*2%& ORT
I6V X6J X6X
>A7E!*3" > ORT L6X I6V K6QE!*3" >> ORT P6L I6V X6JE!*3" >>> ORT I6V X6J X6JE!*3" >A ORT X6J I6V X6X
N"%`$!" ORT X6X X6J X?AB ORT X6X X6J X6J?!"0$."3 EFC@ ORT L6X P6L S6P@":%&%(" EFC@ ORT I6V I6V K6QN$0/"2("3 WF5 ORT I6V X6X Q6K@":%&%(" WF5 ORT X6X X6X X6Xc*$&3%2" ORT QS6X QI6X QL6PCD?^ /!"(;!"0;+-3 ORT Q6K P6L P6LCD?^ (;!"0;+-3 ORT X6X X6X X6J1&+.*-%"0 ORT K6Q S6P L6JW>5Y *3.%00%+& ORT LI6P LL6K LU6I\"*& W>5Y 3*<0 IQ6SL " PX6P IQ6L " IV6U IL6X " IJ6J
H!%/-"( 1 806 49 (!%/-"( 4 806 5 *&3 (!%/-"( 1 806 5_ :+! *-- (;" *)+8"8*!%*)-"09 9 # X"XS_ C@N^ !"0/%!*(+!< 3%0(!"00 0<&3!+."9 4?@^ )!+&2;+G/$-.+&*!< 3<0/-*0%*_ EFC@^ '*0(!+"0+/;*'"*- !":-$d 3%0"*0"_ WF5^&"2!+(%`%&' "&("!+2+-%("0_ CD?^ !"(%&+/*(;< +: /!".*($!%(<_ ?@1^ /*("&(3$2($0 *!("!%+0$0_ >A7^ %&(!*8"&(!%2$-*! ;".+!!;*'"_ ?AB^ /"!%8"&(!%2$-*!-"$2+.*-*2%*_ W>5Y^ &"+&*(*- %&("&0%8" 2*!" $&%(6
9" :,..,;< &- ,." = >/%+3&,' ?+/%',. +2 @;)-&-%*0) A BC'&0+.+4C ,'( D&3%+(/0-*E& :*+.+4C 58F G788!H 7IJ!# QQ
Fattori predittivi di outcome sfavorevole nei gemelli
Ballabh et al. 2002


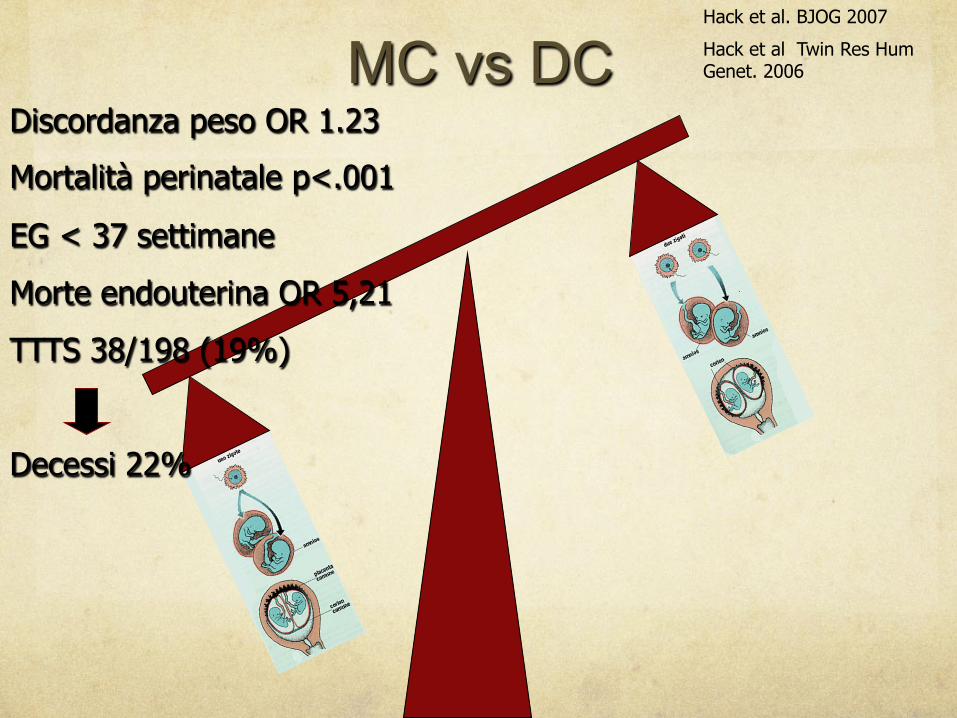
MC vs DC Discordanza peso OR 1.23
Mortalità perinatale p<.001
EG < 37 settimane
Morte endouterina OR 5,21
TTTS 38/198 (19%)
Decessi 22%
Hack et al. BJOG 2007
Hack et al Twin Res Hum Genet. 2006

A BREVE TERMINE
Hack et al. BJOG 2007

Eziopatogenesi " Anastomosi placentari à materiale trombotico à CID
" Alterazioni emodinamiche e fenomeni ischemici
Aumento della mortalità
Disturbi neurologici (paralisi cerebrali, encefalomalacia, atrofia corticale, ventricolomegalia, idrocefalo, oloprosoencefalia, epilessia, disturbi di cognitivi e di apprendimento…)
Agenesia renale
Atresia intestinale
Aplasia cutis
Anomalie cardiache
Infarti organi endoaddominali (milza, fegato, reni….)
Pharoah P.O.D. Semin Neonatolol 2002; 7 : 223-230

TTTS outcome
n Aumento mortalità 5-29% n Amnioriduzione 29% > laser 8% - p<.01
n La mortalià da TTTS è lagata a aumentato rischio di prematurità e basso peso alla nascita
Lopriore et al, 2011
lower in the donor twin than the recipient twin(14.8 (3.4) v 18.2 (4.2) g/dl, p = 0.02). In thecontrol group, there was no diVerence in themean haemoglobin level between twin 1 andtwin 2 (16.0 (3.1) v 16.4 (2.6) g/dl, p = 0.73).
Table 2 shows the neonatal characteristics ofthe TTTS twins and the controls. Acute respi-ratory morbidity, either transient tachypnoea ofthe newborn or respiratory distress syndrome,occurred with a similar incidence in the twogroups, with chronic neonatal lung disease alsooccurring with similar frequency. Although theincidence of hypotension did not diVer be-tween the groups, hypotension requiring ino-tropic support was more common in the TTTStwins. Oliguric renal failure was more commonin the TTTS twins, and the mean maximumcreatinine level was also higher. Importantly,renal function returned to normal in all survi-vors before discharge. There was no diVerencein the rate of infection, including sepsis andnecrotising enterocolitis, between the groups.None of the controls had clinically diagnosedseizures, but this was not statistically significantwhen compared with the TTTS twins. Haem-orrhagic lesions diagnosed by cranial ultra-sound occurred more commonly in the controlgroup, but this also was not statistically signifi-cant. The one infant with a grade 4 periven-tricular haemorrhage (PVH) died in theneonatal period.
Cystic periventricular leucomalacia (PVL)was diagnosed in three TTTS infants. Oneinfant had increased periventricular echogenic-ity detected on an ultrasound scan on day 7.The echogenicity resolved, but a scan at 2months disclosed cystic PVL adjacent to theleft lateral ventricle. A second infant hadnormal ultrasound scans during the first weeksof life. A computed tomography (CT) scan
performed at 3 months of age because of con-cerns about the infant’s muscle tone showedbilateral periventricular cysts in the parieto-occipital regions. The third infant had bilateralcystic PVL in the parieto-occipital region on anultrasound scan on day 24. Cerebral ultra-sonography during the first week of life wasnormal, while a CT scan on day 11 showed areduction in white matter density, but no cystformation. Two infants had evidence of cer-ebral atrophy. The first infant had a grade 1PVH on initial scans that resolved on follow up.An ultrasound scan at 3 months of age,however, showed that there was appreciableprominence of the subarachnoid space, whichwas confirmed on CT scan. The second infanthad no PVH, but a follow up ultrasound at 6weeks of age showed asymmetrical dilatation ofthe lateral ventricles. The changes seen in bothinfants were consistent with cerebral atrophy.None of the control group displayed anyevidence of cerebral ischaemia, this beingstatistically significant compared with theTTTS twins (p = 0.03). Of note, none of thecerebral lesions were present on the initialultrasound scans, performed during the firstdays of life, but became evident during theperiod of hospitalisation.
Analysis of the TTTS group according towhether the twins were donor or recipientshowed no diVerence in neonatal morbidities.In particular, renal failure occurred in seven ofthe 14 donor twins and seven of the 15 recipi-ent twins. Ischaemic brain lesions were foundin three of the donor twins and two of therecipient twins.
All the survivors of TTTS were seen for fol-low up in the growth and development clinic atthe age of at least 2 years (2–4.5 years)corrected for prematurity. Three infants werediagnosed with cerebral palsy, of whom twoalso had developmental delay, while two hadglobal developmental delay alone. All of thesecases showed neonatal ultrasound abnormali-ties (table 3). Case 1 was a child withmoderately severe cerebral palsy, who also hadconsiderable visual problems and developmen-tal delay. Cases 2 and 3 were from the sametwin pregnancy. The former had mild spasticdiplegia (walking at the age of 2 years) and alsohad developmental delay, while her twin haddevelopmental delay alone (GQ 63). In case 4,developmental delay (GQ 50) and also signifi-cant visual and auditory impairments werepresent. Case 5 was a child with spastic quad-riplegia. Thus five of the 23 surviving infants(22%; 95% confidence intervals 7% to 44%)
Table 2 Neonatal morbidities of twins with twin-twin transfusion syndrome (TTTS) andcontrols
TTTS (n=29) Controls (n=33) p Value
Transient tachypnoea of the newborn 9 (31%) 4 (12%) 0.06Respiratory distress syndrome 13 (45%) 20 (61%) 0.16CNLD 8 (28%) 10 (30%) 0.52Hypotension 15 (52%) 13 (39%) 0.23Dopamine administration 14 (48%) 8 (24%) 0.04Renal failure 14 (48%) 5 (15%) 0.005Mean (SD) creatinine (mmol/l) 0.14 (0.09) 0.09 (0.02) 0.01Sepsis 17 (59%) 13 (39%) 0.10Necrotising enterocolitis 1 (3%) 0 0.46Seizures 3 (10%) 1 (3%) 0.25PVH (grade 1–2) 2 (7%) 7 (21%) 0.41PVH (grade 3–4) 0 1 (3%) 0.53Cystic PVL 3 (10%) 0 0.09Cerebral atrophy 2 (7%) 0 0.21
CNLD, chronic neonatal lung disease; PVH, periventricular haemorrhage; PVL, periventricularleucomalacia.
Table 3 Case descriptions of survivors of twin-twin transfusion syndrome (TTTS) with adverse neurodevelopmental outcomes
Casenumber Twin
Gestation atdelivery Amnioreduction
Neonatal ultrasoundchanges Outcome Outcome of other twin Comments
1 Donor 29 1 Cerebral atrophy CP, GDD Survived normal Initially, recipient twin was hydropic at 23weeks and then resolved. At 29 weeks thedonor became acutely hydropic, while therecipient became bradycardic. Urgentcaesarean section
2 Donor 28 0 PVL CP, GDD GDD3 Recipient 28 0 Cerebral atrophy GDD CP4 Donor 27 3 PVL GDD Survived normal5 Recipient 33 3 PVL CP IUFD Delivered 24 h after IUFD
PVL, periventricular leucomalacia; CP, cerebral palsy; GDD, global developmental delay; IUFD, intrauterine fetal death.
Twin-twin transfusion syndrome F173
Cincotta et al. Arch Dis Child Fetal Neonatal Ed 2000; 83: F171 –F176

Lopriore et al. Am J Obstet Gynecol 2003

TTTS outcome
n Disfunzioni cardiache à rischio 12 volte > rispetto a popolazione “normale” (gemello ricevente) n Transitorie, n Progressive, n Persistenti
n 1 TEORIA: ipervolemia à éprecarico à ipertrofia cardiaca
n 2 TEORIA: sostanze vasocostrittici (endotelina1) à épostcarico à ipertrofia cardiaca
n IPETROFIA (Sinistra/Bilaterale) à idrope REVERSIBILE n RVOTO: ostruzione funzionale efflusso destro
PROGRESSIVA E LETALE à valvuloplastica a palloncino
Lopriore et al, 2011

TTTS outcome
n Complicanze renali (gemello donatore) n Necrosi/fibrosi corticale renale, n IRA transitoria/persitente, n Disfunzioni tubuari permanenti à poliuria n Disgenesia tubulare
n 50% reperti autoptici n Eziopatogenesi: danno ipossico-ischemico da
ipoperfusione cronica n Trattamento laser sembra protettivo per danno renale
(20% amnioriduzione vs 7% laser vs 1% controlli)
Lopriore et al, 2011 Lanclen et al, 2007

TTTS outcome
n Alterazioni ematologiche (entrambi) n Generalmente: anemia (donatore) e policitemia (ricevente)…
ma non sempre!
n ΔHb > 8 // reticolociti (donatore) ratio > 1,7 n ê Con laser n Laser à 2-13%TAPS (twin anemia polycitemia sequence) per
anastomosi residue, in assenza di sequenza oligo-polidramnios n Management: Trasfusione nel donatore / exanguinotrasfusione
parziale nel ricevente n Trombocitopenia (PLT< 150.000) nel ricevente
Lopriore et al, 2011 Slaghekke et al 2010

TTTS outcome
n Organi endoaddominali (entrambi i gemelli) n Infarti epatici n Calcificazioni epatiche n Atresia ileale/digiunale
n Eziopatogenesi: ipoperfusione ed ischemia mesenterica (donatore), iperviscosità (ricevente), alterazioni emodinamiche e fenomeni embolici (post-laser)
n Complicanze frequenti nel donatore: n Enterocolite necrotizzante (NEC) n Perforazione ileo distale n Eziopatogenesi: Ipoperfusione tratto GI à danno ipossico
Lopriore et al, 2011 Detlefsen et al, 2008

TTTS outcome
n SNC (entrambi) n Leucomalacia PVL n Cisti della sostanza bianca n Emorragie cerebrali IVH n Dilatazioni ventricolari n Atrofia cerebrale n Stroke ischemico n Polimicrogiria n Cisti subependimali
n Primitive per squilibri emodinamici in utero (10-35%), secondarie alla prematurità ed al basso peso
n Più frequenti in TTTS trattate con amnioriduzione (14%) che laser (6%) p =.02
Lopriore et al, 2011 Senat et al, 2004

A LUNGO TERMINE
Paralisi cerebrale - OR 4.2, CI 0,5 – 38,2
(PVL). The cause of CP in the infant of the DC group (born at 31weeks of gestation) is currently unknown, but may be geneticallydetermined as this child also suffers from albinism. This child hasdiplegia with psychomotor retardation.
Developmental status (results Griffiths Test)After losses to follow-up, 140 MC infants and 142 DC infants
without CP participated in this prospective follow-up study andwere tested with the Griffiths Mental Developmental Scales.Baseline characteristics of the study population are shown inTable 1. There were significantly more female sex pairs among theDC twins. Seven pregnancies were complicated by single fetaldemise (4 MC and 3 DC) and there were 3 neonatal deaths withsurvival of the sibling.
The majority of the tested infants showed normal development(98.2%). Five out of 282 long-term survivors had a milddevelopmental delay and two infants had a severe developmentaldelay. There was a significant difference in development betweenboys and girls. Boys had lower DQ scores (mean total DQ 101 and106, respectively; p,0.001) and the proportion of mildly delayeddevelopment was higher among male infants. Infants born before32 weeks of gestation and/or with a birth weight ,1500 gram hadsignificantly lower DQ-scores than infants born after 32 weeksand/or $1500 gram (mean total DQ 101 and 104, respectively;p = 0.05). There was no significant difference between infants whowere small-for-gestational age and infants with a birth weightabove the tenth percentile.
Table 2 shows the long-term outcome of twins according tochorionicity. No differences in height, weight and head circum-ference between MC and DC twins were found. One MC infant(0.7%) had a developmental delay compared to 6 DC infants(4.2%; OR 0.2, 95% CI 0.0–1.4). When the population wasdivided in infants born before 32 weeks of gestation and/or with abirth weight ,1500 gram and infants born after 32 weeks and/or
a birth weight $1500 gram also no significant differences werepresent between the MC and DC twins (data not shown). Meantotal DQ score was slightly lower in MC twins than in DC twins(mean TDQ 103 and 104, respectively, p = 0.423), which wasmainly due to the higher proportion of mildly delayed hearing andspeech development in MC twins. These results were in agreementwith the parental impression of the development of their infant(s),as assessed by the HSCS-PS questionnaire (Figure 2).
Developmental outcome of the twins after an uneventful courseof pregnancy (i.e. the pregnancy was not complicated by pretermbirth and/or a low birth weight ,1500 g, TTTS or a birth weightdiscordancy of more than 20% or fetal death) is shown in Table 3.There were no differences between uncomplicated MC and DCtwins, with exception of a significantly higher incidence of mildlydelayed development of hearing and language in uncomplicatedMC twins. Mean developmental score seems lower in uncompli-cated MC twins compared to DC twins (103 vs 106, p = 0.109).
Table 4 shows the outcome of discordant twins, which was alsocomparable between MC and DC twins. The smaller infant of theseverely discordant twin pair had slightly lower DQ-scorescompared to its larger sibling (mean TDQ 100 and 103,respectively; p = 0.338). This trend was found in both MC andDC discordant twins.
Eighteen MC pregnancies were complicated by antenatal signs ofTTTS (17.6%), of which six had been treated by laser coagulationof vascular anastomoses. Five pregnancies had been treated by serialamnioreduction. The other pregnancies did not receive anytreatment, either due to low stage TTTS or immediate deliveryafter diagnosis. Three TTTS pregnancies were complicated bydeath of one of the twins. There were 33 long-term survivors, ofwhich one had CP (3.0%). Twenty-seven long-term survivors weretested. All of them had a normal development (Table 5). However,recipients had slightly lower DQ-scores compared to the donortwins (mean TDQ 104 and 106, respectively; p = 0.640).
Figure 2. Health Status Classification System Preschool children (HSCS-PS) questionnaire completed by parents of monochorionicand dichorionic twins, each with three to five levels of severity.doi:10.1371/journal.pone.0006815.g002
Outcome of Twins
PLoS ONE | www.plosone.org 5 August 2009 | Volume 4 | Issue 8 | e6815
Sviluppo cognitivo - p NS
2,2% 0,5% Karien et al. 2009
Pharoah P.O.D. Semin Neonatolol 2002

TTTS outcome
n Ischemia degli arti 0,26% (ischemia, trombosi…) n Briglie amniotiche (legate a interventi invasivi per TTTS) n Aplasia cutis (patogenesi non chiara. Laser?)
Lopriore et al, 2011 Pharoah et al, 2002

Conclusioni
n La gravidanza gemellare in sè aumenta il rischio di parto pretemine il quale si associa ud una serie di problematiche tanto maggiori quanto inferiore è l’età gestazionale.
n Le gravidanze monocoriali richiedono una maggiore attenzione per la possibilità di TTTS, in questo caso è da preferire il trattamento Laser e dovrà seguire una stretta sorveglianza postnatale.