epa wwtf opportunities
DESCRIPTION
Opportunities for Combined Heat and Power at Wastewater Treatment Facilities:Market Analysis and Lessons from the FieldTRANSCRIPT

Opportunities for Combined Heat and Power at Wastewater Treatment Facilities
Market Analysis and Lessons from the Field
US Environmental Protection Agency Combined Heat and Power Partnership
October 2011
The US Environmental Protection Agency (EPA) CHP Partnership is a voluntary program that seeks to reduce the environmental impact of power generation by promoting the use of CHP CHP is an efficient clean and reliable approach to generating power and thermal energy from a single fuel source CHP can increase operational efficiency and decrease energy costs while reducing the emissions of greenhouse gases The CHP Partnership works closely with energy users the CHP industry state and local governments and other stakeholders to support the development of new CHP projects and promote their energy environmental and economic benefits
The CHP Partnership provides resources about CHP technologies incentives emission profiles and other information on its website at wwwepagovchp For more information contact the CHP Partnership Helpline at chpepagov or (703) 373shy8108
Acknowledgements
The CHP Partnership would like to thank the following people for their review and comments which were very helpful in the development of this report
Robert Bastian US EPA Office of Water John Cuttica University of Illinois at Chicago Lauren Fillmore Water Environment Research Foundation (WERF) Bruce Hedman ICF International Chris Hornback National Association of Clean Water Agencies (NACWA) Dana Levy New York State Energy Research and Development Authority (NYSERDA) John Moskal US EPA Region 1
Report prepared by Eastern Research Group Inc (ERG) and Resource Dynamics Corporation (RDC) for the US Environmental Protection Agency Combined Heat and Power Partnership October 2011
Table of Contents
EXECUTIVE SUMMARYiv
10 Introduction 1
20 CHP and Its Benefits at Wastewater Treatment Facilities3
30 The Market 5
31 Wastewater Treatment Facilities with CHP 5 32 Potential CHP Market7
40 Technical and Economic Potential 9
41 Technical Potential for CHP at Wastewater Treatment Facilities 9
411 Methodology 9 412 Electric and Thermal Generation Potential from CHP Systems at Wastewater
Treatment Facilities 10 413 National Electric Generation Potential from CHP at Wastewater Treatment
Facilities12 414 Potential Carbon Dioxide Emissions Benefits12
42 Economic Potential for CHP at Wastewater Treatment Facilities13
421 Methodology 14 422 Heating Requirements of Wastewater Treatment Facilities 15 423 Estimated Cost to Generate Electricity 18 424 National Economic Potential Scenarios24
50 Wastewater Treatment Facility Interviews CHP Benefits Challenges and Operational Insights28
51 Wastewater Treatment Facilities Interviewed and Interview Format28 52 Drivers and Benefits 30 53 Challenges 34 54 Operational Insights and Observations 38
Appendix A Data Sources Used in the Analysis 40
Appendix B Anaerobic Digester Design Criteria Used for Technical Potential Analysis42
Appendix C Space Heating Capability of CHP at Wastewater Treatment Facilities 43
Appendix D Cost-to-Generate Estimates by State45
Appendix E Additional Reference Resources49
i
List of Tables
Table 1 Number of Digester Gas Wastewater CHP Systems and Total Capacity by State 6
Table 2 Number of Sites and Capacity (MW) by CHP Prime Movers6
Table 3 Number of US Wastewater Treatment Facilities with Anaerobic Digestion8
Table 4 Wastewater Flow to US Wastewater Treatment Facilities with Anaerobic Digestion and without CHP 8
Table 5 Prime Mover Performance Specifications for Use in Technical Potential Model10
Table 6 Electric and Thermal Energy Potential with CHP for Typically Sized Digester11
Table 7 CHP Technical Potential at Wastewater Treatment Facilities in the United States 12
Table 8 Potential Carbon Dioxide Emissions Displaced with CHP at Wastewater Treatment Facilities13
Table 9 Thermal Energy Requirements for Anaerobic Digesters by Climate Zone 17
Table 10 Installed Cost Data Points for Anaerobic Digester Gas CHP Systems19
Table 11 Prime Mover Price and Performance Specifications for Use in Economic Potential Model 20
Table 12 Estimated Cost to Generate Anaerobic Digester Gas Electricity (Case 1 ndash No Natural Gas Purchases Displaced) 21
Table 13 Estimated Cost to Generate Anaerobic Digester Gas Electricity (Case 2 ndash CHP Heat Displaces Natural Gas Space Heating)22
Table 14 Estimated Cost to Generate Anaerobic Digester Gas Electricity (Case 3 ndash CHP Heat Displaces Natural Gas for Both Digester and Space Heating) 23
Table 15 Economic Potential of U S Wastewater Treatment Facilities (Scenario 1 ndash Most Facilities Do Not Utilize Digester Gas Prior to CHP)25
Table 16 Economic Potential of US Wastewater Treatment Facilities (Scenario 2 ndash All Facilities Use Digester Gas to Heat Digester Prior to CHP)26
Table 17 Wastewater Treatment Facilities Interviewed 29
Table 18 Interview Results ndash Drivers and Benefits 31
Table 19 Interview Results ndash Challenges35
Table 20 Interview Results ndash Operational Insights39
ii
List of Figures
Figure 1 Map of Five US Climate Zones by State16
Figure 2 Thermal Energy Requirements for Anaerobic Digesters by Heating Degree Days 17
Figure 3 Wastewater Treatment Facilities with Anaerobic Digesters ndash Number of Sites with Economic Potential (Scenario 2) 26
Figure 4 Economic Potential by Wastewater Treatment Facility Size (Scenario 2)27
iii
EXECUTIVE SUMMARY
Purpose of Report
This report presents the opportunities for combined heat and power (CHP) applications in the municipal wastewater treatment sector and it documents the experiences of wastewater treatment facility (WWTF) operators who have employed CHP It is intended to be used by CHP project developers WWTF operators state and local government policymakers and other parties interested in exploring the opportunities benefits and challenges of CHP at WWTFs
Key Findings
bull CHP is a reliable cost-effective option for WWTFs that have or are planning to install anaerobic digesters
The biogas flow from the digester can be used as fuel to generate electricity and heat in a CHP system using a variety of prime movers such as reciprocating engines microturbines or fuel cells The thermal energy produced by the CHP system is then typically used to meet digester heat loads and for space heating A well-designed CHP system using biogas offers many benefits for WWTFs because it
― Produces power at a cost below retail electricity ― Displaces purchased fuels for thermal needs ― May qualify as a renewable fuel source under state renewable portfolio standards and
utility green power programs ― Enhances power reliability for the plant ― Produces more useful energy than if the WWTF were to use biogas solely to meet
digester heat loads ― Reduces emissions of greenhouse gases and other air pollutants primarily by
displacing utility grid power
bull While many WWTFs have implemented CHP the potential still exists to use more CHP based on technical and economic benefits
As of June 2011 CHP systems using biogas were in place at 104 WWTFs representing 190 megawatts (MW) of capacity CHP is technically feasible at 1351 additional sites and economically attractive (ie payback of seven years or less) at between 257 and 662 of those sites1
bull The CHP technical potential is based on the following engineering rules of thumb
― A typical WWTF processes 100 gallons per day of wastewater for every person served2 and approximately 10 cubic foot (ft3) of digester gas can be produced by an anaerobic digester per person per day3
1 A range is presented due to uncertainties in the data available for WWTFs making it difficult to support a single
national economic potential 2 Great Lakes-Upper Mississippi Board of State and Provincial Public Health and Environmental Managers ldquoRecommended Standards for Wastewater Facilities (Ten-State Standards)rdquo 2004 3 Metcalf amp Eddy ldquoWastewater Engineering Treatment and Reuse 4th Editionrdquo 2003
iv
― The composition of anaerobic digester gas from WWTFs is usually 60 to 70 percent methane with the remainder primarily carbon dioxide (CO2) The lower heating value (LHV) of digester gas ranges from 550 to 650 British thermal units (Btu)ft3 and the higher heating value (HHV) ranges from 610 to 715 Btuft3 or about 10 percent greater than the LHV4
bull Each million gallons per day (MGD) of wastewater flow can produce enough biogas in an anaerobic digester to produce 26 kilowatts (kW) of electric capacity and 24 million Btu per day (MMBtuday) of thermal energy in a CHP system
bull The cost to generate electricity using CHP at WWTFs ranges from 11 to 83 cents per kilowatt-hour (kWh) depending on the CHP prime mover and other factors
Current retail electric rates range from 39 to over 21 cents per kWh so CHP can have clear economic benefits for WWTFs
bull On a national scale the technical potential for additional CHP at WWTFs is over 400 MW of biogas-based electricity generating capacity and approximately 38000 MMBtuday of thermal energy
This capacity could prevent approximately 3 million metric tons of carbon dioxide emissions annually equivalent to the emissions of approximately 596000 passenger vehicles
bull Also on a national scale the economic potential ranges from 178 to 260 MW This represents 43 to 63 percent of the technical potential5 The vast majority of economic potential comes from large (gt30 MGD) WWTFs that can support larger CHP units
bull Translating CHP potential into actual successes requires an understanding of operational realities This report includes interviews of 14 ownersoperators of CHP systems at WWTFs across the country Key operational observations from these interviews are included in Section 5
4 Metcalf amp Eddy ldquoWastewater Engineering Treatment and Reuse 4th Editionrdquo 2003 A fuelrsquos LHV does not include the heat of the water of vaporization 5 A range is presented due to uncertainties in the data available for WWTFs making it difficult to support a single national economic potential Economic potential is defined as a payback period of seven years or less
v
10 Introduction
In April 2007 the US Environmental Protection Agencyrsquos (EPArsquos) Combined Heat and Power Partnership (CHPP) released its first report identifying the opportunities for and benefits of combined heat and power (CHP) at wastewater treatment facilities (WWTFs)6 The primary purpose of the 2007 report was to provide basic information for assessing the potential technical fit for CHP at certain WWTFs―specifically those with influent flow rates greater than 5 million gallons per day (MGD) that have anaerobic digesters The 2007 report showed that these larger facilities produce enough biogas from anaerobic digestion based on typical practices to fuel a CHP system The report also provided basic information on the cost to generate power and heat at WWTFs with CHP
Since the release of the 2007 report CHPP Partners and other stakeholders have expressed increased interest in CHP at WWTFs and several additional reports on CHP at WWTFs have been released7 This updated report has been prepared in response to the increased interest The primary purposes of this update (which is intended to replace the 2007 report) are to
bull Expand the evaluation of technical and economic potential for CHP to include smaller WWTFs with influent flow rates of 1 to 5 MGD
bull Present operational observations obtained through interviews with WWTF operators who have employed CHP
The updated report is intended to be used by CHP project developers WWTF operators federal state and local government policymakers and other parties who are interested in exploring the opportunities benefits and challenges of CHP at WWTFs The report is organized accordingly
bull Section 2 provides an overview of CHP and its benefits at WWTFs
bull Section 3 describes the existing CHP capacity at WWTFs and the potential market for additional CHP at WWTFs
bull Section 4 analyzes the technical and economic potential for CHP at WWTFs presenting analyses of electric and thermal energy generation potential at WWTFs as well as costshyto-generate estimates under three digester gas utilization cases
bull Section 5 presents first-hand observations gathered through interviews of WWTF operators regarding the benefits and challenges of CHP development and operation
bull Appendix A lists the data sources and types of data used in the analysis
bull Appendix B provides anaerobic digester design criteria used in the technical potential analysis
bull Appendix C presents analysis of the space heating capability of CHP at WWTFs
6 The 2007 report was titled ldquoThe Opportunities for and Benefits of Combined Heat and Power at Wastewater Treatment Facilitiesrdquo 7 Recent reports pertaining to CHP at WWTFs include
bull Brown amp Caldwell ldquoEvaluation of Combined Heat and Power Technologies for Wastewater Treatment Facilitiesrdquo December 2010 Available at httpwaterepagovscitechwastetechpublicationscfm
bull Association of State Energy Research amp Technology Transfer Institutions ldquoStrategic CHP Deployment Assistance for Wastewater Treatment Facilitiesrdquo October 2009 Available at httpwwwaserttiorgwastewaterindexhtml
bull California Energy Commission ldquoCombined Heat and Power Potential at Californiarsquos Wastewater Treatment Plantsrdquo September 2009 Available at httpwwwenergycagov2009publicationsCEC-200shy2009-014CEC-200-2009-014-SFPDF
1
bull Appendix D presents the cost to generate by state for CHP at WWTFs under the three digester gas utilization cases presented in the economic potential analysis
bull Appendix E lists additional resources available from the CHPP and other organizations
2
20 CHP and Its Benefits at Wastewater Treatment Facilities
CHP is the simultaneous production of electricity and heat from a single fuel source such as natural gas biomass biogas coal or oil CHP is not a single technology but an energy system that can be modified depending on the needs of the energy end user CHP systems consist of a number of individual components configured into an integrated whole These components include the prime mover generator heat recovery equipment and electrical interconnection The prime mover that drives the overall system typically identifies the CHP system Prime movers for CHP systems include reciprocating engines combustion turbines steam turbines microturbines and fuel cells8
CHP plays an important role in meeting US energy needs as well as in reducing the environmental impact of power generation Regardless of sector or application CHP benefits include
bull Efficiency benefits CHP requires less fuel than separate heat and power generation to produce a given energy output CHP also avoids transmission and distribution losses that occur when electricity travels over power lines from central generating units
bull Reliability benefits CHP can provide high-quality electricity and thermal energy to a site regardless of what might occur on the power grid decreasing the impact of outages and improving power quality for sensitive equipment
bull Environmental benefits Because less fuel is burned to produce each unit of energy output CHP reduces emissions of greenhouse gases and other air pollutants
bull Economic benefits CHP can save facilities considerable money on their energy bills due to its high efficiency and it can provide a hedge against unstable energy costs
CHP has been successfully implemented in many different sectors including WWTFs CHP at WWTFs can take several forms including anaerobic digester gas-fueled CHP non-biogas fueled CHP (eg natural gas) heat recovery from a sludge incinerator that can drive an organic rankine cycle system and a combined heat and mechanical power system (eg an engine-driven pump or blower with heat recovery)
The analysis presented in this report is based on CHP fueled by anaerobic digester gas (biogas) and it focuses on WWTFs that already have or are planning to install anaerobic digesters Biogas produced by anaerobic digesters can be used as fuel in various prime moversmdashtypically reciprocating engines microturbines and fuel cellsmdashto generate heat and power in a CHP system The electric power produced can offset all or most of a WWTFrsquos power demand and the thermal energy produced by the CHP system can be used to meet digester heat loads and in some cases for space heating
It should be noted that CHP is one of several beneficial uses of biogas generated by WWTF anaerobic digesters and each WWTF must assess its own site-specific technical economic and environmental considerations to determine the best use of its biogas Other non-CHP uses of biogas include
bull Digester gas for heat WWTFs can use digester gas in a boiler to provide digester heating andor provide space heating for buildings on site
8 Information about CHP prime movers including cost and performance characteristics can be found in the ldquoCatalog of CHP Technologiesrdquo Available at httpwwwepagovchpbasiccataloghtml
3
bull Digester gas purification to pipeline quality WWTFs can market and sell properly treated and pressurized biogas to the local natural gas utility
bull Direct biogas sale to industrial user or electric power producer WWTFs can treat deliver and sell biogas to a local industrial user or power producer where it can be converted to heat andor power
bull Biogas to vehicle fuel WWTFs can treat and compress biogas on site to produce methane of a quality suitable for use as fleet vehicle fuel
A well-designed CHP system using biogas offers many benefits for WWTFs because it
bull Produces power at a cost below retail electricity
bull Displaces purchased fuels for thermal needs
bull May qualify as a renewable fuel source under state renewable portfolio standards and utility green power programs
bull Enhances power reliability for the plant
bull Produces more useful energy than if the WWTF were to use biogas solely to meet digester heat loads
bull Reduces emissions of greenhouse gases and other air pollutants primarily by displacing utility grid power
The benefits of CHP deployment at WWTFs are in addition to those provided by anaerobic digesters The typical benefits of anaerobic digesters at WWTFs include enhanced biosolids management reduced odors lower fugitive methane emissions and additional revenue sources such as soil fertilizers that can be produced from digester effluent
4
30 The Market
This section characterizes the market for CHP at WWTFs It first presents information about WWTFs that currently utilize CHP and then discusses the CHP market potential at WWTFs focusing on WWTFs that do not currently utilize CHP but that have anaerobic digesters
For economic reasons WWTFs that already operate anaerobic digesters9 or those planning to implement anaerobic digestion present the best opportunity for CHP therefore the analysis in this report focuses on WWTFs that have anaerobic digesters The incorporation of anaerobic digesters into the wastewater treatment process is typically driven by factors other than power and heat generation (eg enhanced biosolids management or odor control) However once in place anaerobic digesters produce digester gasmdashor biogasmdash which is key to CHP feasibility at WWTFs Biogas is approximately 60 to 70 percent methane and can be used to fuel a CHP system to produce electricity and useful thermal energy The electricity generated can offset all or most of a WWTFrsquos electric power demand and the recovered thermal energy can be used to meet digester heating loads and facility space heating requirements However at this time most biogas is used to heat digesters or is flared10
31 Wastewater Treatment Facilities with CHP
As of June 2011 wastewater treatment CHP systems were in place at 133 sites in 30 states representing 437 megawatts (MW) of capacity11 Although the majority of facilities with CHP use digester gas as the primary fuel source some employ CHP using fuels other than digester biogas (eg natural gas fuel oil) because they either do not operate anaerobic digesters (so do not generate biogas) or because biogas is not a viable option due to site-specific technical or economic conditions Of the 133 WWTFs using CHP 104 facilities (78 percent) representing 190 MW of capacity utilize digester gas as the primary fuel source12 Table 1 shows the number of sites and capacity (MW) by state that use digester gas as the primary fuel source for CHP
9 Anaerobic digestion is a biological process in which biodegradable organic matter is broken down by bacteria in the absence of oxygen into biogas consisting of methane (CH4) carbon dioxide (CO2) and trace amounts of other gases 10 Brown and CaldwellrdquoEvaluation of Combined Heat and Power Technologies for Wastewater Treatment FacilitiesrdquoDecember 2010 Available at httpwaterepagovscitechwastetechpublicationscfm 11 CHP Installation Database maintained by ICF International with support from the US Department of Energy and Oak Ridge National Laboratory Available at httpwwweea-inccomchpdataindexhtml 12 Some WWTFs blend biogas with natural gas if the volume of biogas from the digesters is not sufficient to meet a facilityrsquos thermal andor electric requirements (eg in the winter when digester heat loads are higher)
5
Table 1 Number of Digester Gas Wastewater CHP Systems and Total Capacity by State
State Number of Sites
Capacity (MW)
State Number of Sites
Capacity (MW)
AR 1 173 MT 3 109 AZ 1 029 NE 3 540 CA 33 6267 NH 1 037 CO 2 707 NJ 4 872 CT 2 095 NY 6 301 FL 3 1350 OH 3 1629 IA 2 340 OR 10 642 ID 2 045 PA 3 199 IL 2 458 TX 1 420 IN 1 013 UT 2 265 MA 1 1800 WA 5 1418 MD 2 333 WI 5 202 MI 1 006 WY 1 003 MN 4 719 Total 104 1898
Source CHP Installation Database ICF June 2011
Table 1 shows that the states with the greatest number of CHP systems utilizing biogas are California (33) Oregon (10) New York (6) Washington (5) Wisconsin (5) Minnesota (4) and New Jersey (4) States with the greatest capacity are California (6267 MW) Ohio (1629 MW) Washington (1418 MW) Florida (1350 MW) and New Jersey (872 MW) These states include eight of the top 15 largest US cities and six of the 15 most populous US states and therefore tend to support the largest treatment facilities where CHP is most economically beneficial Several of these states offer CHP incentives as well and tend to have higher retail electric rates which can make CHP more attractive economically
Several types of CHP prime movers can be used to generate electricity and heat at WWTFs13
Table 2 shows the CHP prime movers currently used at WWTFs that use digester gas as the primary fuel source
Table 2 Number of Sites and Capacity (MW) by CHP Prime Movers
Prime Mover Number of Sites
Capacity (MW)
Reciprocating engine 54 858 Microturbine 29 52
Fuel cell 13 79 Combustion turbine 5 399
Steam turbine 1 230 Combined cycle 1 280
Total 104 1898 Source CHP Installation Database ICF June 2011
The most commonly used prime movers at WWTFs are reciprocating engines microturbines and fuel cells The power capacities of these prime movers most closely match the energy content of biogas generated by digesters at typically sized WWTFs Opportunities for using
13 Information about CHP prime movers including cost and performance characteristics can be found in the ldquoCatalog of CHP Technologiesrdquo Available at httpwwwepagovchpbasiccataloghtml
6
combustion turbines steam turbines and combined cycle systems are typically found in the few very large WWTFs (ie greater than 100 MGD)
32 Potential CHP Market
To estimate the potential market for CHP at WWTFs the CHPP used the EPA 2008 Clean Watershed Needs Survey (CWNS) database14 to identify WWTFs that do not already operate CHP As the database was configured to provide a comprehensive assessment of capital needs to meet water quality goals established under the Clean Water Act the primary indicators used for the CHPPrsquos analysis were the number of facilities with anaerobic digestion and the total influent flow rate to those facilities The database collection process is voluntary and the data vary in level of completeness Since the CHPP 2007 report was released there have been other state-specific data sets that have become available However the uniform data collection method applied to the CWNS database introduces a consistency in the data collection methodology It is also at this time the primary comprehensive dataset on municipal wastewater treatment activity at a national scale These two criteria rendered the data more representative for the CHPPrsquos national analysis15
The CHPPrsquos 2007 report about CHP at WWTFs showed that influent flow rates of 5 MGD or greater were typically required to produce biogas in quantities sufficient for economically feasible CHP systems One of the CHPPrsquos goals for this 2011 study however was to be inclusive of all market opportunities for CHP at WWTFs Recognizing that CHP systems can and do operate at facilities with influent flow rates less than 5 MGD this 2011 analysis uses a lower limit of 1 MGD Some smaller WWTFs (ie between 1 and 5 MGD) can produce sufficient biogas through conventional means (if biosolid loadings are high enough) or augment their digestion process to boost the biogas generation rate of the anaerobic digesters (eg addition of collected fats oils and greases to digesters use of microbial stimulants)
Table 3 presents the total number of WWTFs in the United States and the number with anaerobic digestion excluding WWTFs that already utilize CHP Table 4 shows the wastewater flow to WWTFs with anaerobic digestion also excluding those that utilize CHP Table 3 shows that 1351 WWTFs greater than 1 MGD utilize anaerobic digesters but do not operate CHP systems The data indicate that systems with larger flow rates are more likely to have anaerobic digesters and therefore have greater potential for CHP This finding is corroborated by the data in Table 4 which indicate that for WWTFs greater than 1 MGD that do not employ CHP approximately 60 percent of wastewater flow goes to facilities with anaerobic digestion
14 EPArsquos Office of Wastewater Management in partnership with states territories and the District of Columbia conducts the CWNS every four years in response to Sections 205(a) and 516 of the Clean Water Act and develops a Report to Congress The 2008 CWNS is available at httpwaterepagovscitechdataitdatabasescwns 15 Water Environment Foundationrsquos Project on the ldquoPreparation of Baseline of the Current and Potential Use of Biogas from Anaerobic Digestion at Wastewater Plantsrdquo was initiated in August 2011 to create a robust consensus dataset regarding the current and potential production of biogas from anaerobic digestion at Publicly Owned Treatment Works (POTW) in the United States EPA is serving on the Advisory Panel for this project but is not responsible for its content
7
Table 3 Number of US Wastewater Treatment Facilities with Anaerobic Digestion and without CHP
WWTFs Flow Rate Range
(MGD)
Total WWTFs
WWTFs with Anaerobic Digestion
Percentage of WWTFs with Anaerobic
Digestion gt200 10 7 70
100ndash200 18 13 72 75ndash100 25 17 68 50ndash75 24 17 71 20ndash50 137 82 60 10ndash20 244 140 57 5ndash10 451 230 51 1ndash5 2262 845 37 Total 3171 1351 43
Source CWNS 2008
Table 4 Wastewater Flow to US Wastewater Treatment Facilities with Anaerobic Digestion and without CHP
WWTFs Flow Rate Range
(MGD)
Total Wastewater Flow (MGD)
Wastewater Flow to WWTFs with Anaerobic
Digestion (MGD)
Percentage of Flow to WWTFs with Anaerobic
Digestion gt200 3950 3010 76
100ndash200 2705 2076 77 75ndash100 2172 1469 68 50ndash75 1471 1078 73 20ndash50 4133 2491 60 10ndash20 3407 1959 57 5ndash10 3188 1630 51 1ndash5 5124 2082 41 Total 26150 15795 60
Source CWNS 2008
8
40 Technical and Economic Potential
This section presents the technical and economic potential for CHP at WWTFs The analyses focus on WWTFs that operate anaerobic digesters In the technical potential subsection this report presents an estimate of CHP electric capacity and thermal generation based on WWTF influent flow Owners and operators of WWTFs can compare their influent flow to this estimate to approximate the CHP system size that may be possible at their facility The economic potential subsection presents cost-to-generate estimates for various CHP prime movers under several digester gas utilization cases Owners and operators of WWTFs can compare these costshyto-generate estimates to current electricity rates to determine whether CHP might make sense at their facility In addition the report provides national estimates of both technical and economic potential based on 2008 CWNS data as well as an estimate for potential carbon dioxide (CO2) emissions reductions associated with meeting the national technical potential The technical and economic estimates presented in this section serve as indicators of CHP potential at WWTFs but every WWTF considering CHP will need to complete its own site-specific technical and economic analysis to assess the viability of CHP
41 Technical Potential for CHP at Wastewater Treatment Facilities
Section 411 discusses the assumptions and methodology used in the technical potential analysis Section 412 presents the relationship between influent flow and electric and thermal generation potential with CHP Section 413 presents the national technical potential estimate for CHP at WWTFs Section 414 presents the potential carbon dioxide emissions benefits associated with meeting the national technical CHP potential
411 Methodology
To determine the electric and thermal energy generation technical potential for CHP at WWTFs the analysis modeled the fuel produced and heating required by a typically sized digester The following assumptions were used to develop the model
bull Digester type There are two types of conventional anaerobic digestion processes―mesophilic and thermophilic―and they are distinguished by the temperature at which they operate Most anaerobic digesters operate at mesophilic temperatures between 95 and 100degF Thermophilic digesters operate at temperatures between 124 and 138degF The thermophilic process is usually faster due to the higher operating temperature but is usually more expensive because of higher energy demands16 Because most digesters in operation today are mesophilic the analysis presented here assumes the use of a mesophilic digester
bull Flow rate The digester model used in the analysis has an influent flow rate of 91 MGD which is based on the sludge capacity of a typically sized digester A wastewater flow rate of 91 MGD produces roughly 91000 standard cubic feet (ft3) of biogas per day which has an energy content of 589 million British thermal units per day (MMBtuday)17
16 Metcalf amp Eddy ldquoWastewater Engineering Treatment and Reuse 4th Editionrdquo 2003 17 Biogas generation was calculated based on 100 gallons of wastewater flow per day per capita (Great Lakes-Upper Mississippi Board of State and Provincial Public Health and Environmental Managers ldquoRecommended Standards
9
bull Season of operation The analysis models both summer and winter digester operation
Appendix B contains the digester design criteria used for the analysis
The analysis estimates the biogas utilization of the model digester under five possible cases
bull The first case assumes no CHP system where only the amount of biogas needed for the digester heat load is utilized and the rest is flared
bull The other four cases assume that a CHP system utilizes the captured biogas to produce both electricity and thermal energy The cases differ based on the CHP prime mover utilized
The CHP prime movers chosen for analysis are consistent with those currently used at WWTFs (see Table 2 in Section 31)18 The four modeled CHP prime movers include two reciprocating engines (one rich-burn and one lean-burn)19 a microturbine and a fuel cell The analysis uses the performance characteristics (ie electric efficiency and power-to-heat ratio) of commercially available equipment as stated by the manufacturers To develop estimates of electric and thermal output the analysis applies CHP prime mover performance characteristics to the produced biogas (589 MMBtuday) Table 5 presents the performance specifications of the CHP prime movers used to develop the technical potential estimate
Table 5 Prime Mover Performance Specifications for Use in Technical Potential Model
Prime Mover Size (kW) Thermal Output
(BtukWh)
Power to Heat Ratio
Electric Efficiency () (HHV)
CHP Efficiency () (HHV)
Reciprocating Engine (RichshyBurn)
280 5520 062 291 76
Reciprocating Engine (LeanshyBurn)
335 3980 086 326 71
Microturbine 260
(4 x 65) 3860 088 260 56
Fuel Cell 300 2690 126 423 76
412 Electric and Thermal Generation Potential from CHP Systems at Wastewater Treatment Facilities
Table 6 presents the results of the modeled CHP systems The results represent an average of winter and summer digester operation The fuel cell CHP system has the highest electric capacity
for Wastewater Facilities (Ten-State Standards)rdquo 2004) and approximately 10 cubic foot per day of digester gas per capita (Metcalf amp Eddy ldquoWastewater Engineering Treatment and Reuse 4th Editionrdquo 2003) 18 Although the prime mover specifications are taken from typical equipment available in the marketplace manufacturer names have been removed to avoid implicitly endorsing any manufacturers or products 19 Rich-burn engines are characterized by higher fuel-to-air-ratios whereas lean-burn engines have lower fuel-to-airshyratios Lean-burn engines have lower exhaust emissions and achieve higher fuel efficiency due to more complete fuel combustion Most of the engines installed at WWTFs today are rich-burn but these are gradually being phased out in favor of lean-burn engines with higher efficiencies and lower emissions
10
of the modeled systems (304 kilowatts [kW]) due to its high electric efficiency In many cases however the use of fuel cells at WWTFs is limited because of their high cost and challenges associated with pre-treating biogas before it can be used in a fuel cell The two most commonly used CHP prime movers at WWTFsmdashreciprocating engines and microturbinesmdash have electric capacities of 187 to 234 kW and produce 17 to 28 MMBtu of thermal energy based on a flow rate of 91 MGD
Table 6 Electric and Thermal Energy Potential with CHP for Typically Sized Digester
No CHP System
Reciprocating Engine CHP RichshyBurn
Reciprocating Engine CHP LeanshyBurn
Microturbine CHP
Fuel Cell CHP
Total WWTF Flow (MGD) 91 91 91 91 91 Heat Requirement for Sludge (Btuday)
6693375 6693375 6693375 6693375 6693375
Wall Heat Transfer (Btuday) 591725 591725 591725 591725 591725 Floor Heat Transfer (Btuday) 1109484 1109484 1109484 1109484 1109484 Roof Heat Transfer (Btuday) 741013 741013 741013 741013 741013 Total Digester Heat Load (Btuday)
9135597 9135597 9135597 9135597 9135597
Fuel Required for Digester Heat Load (Btuday) (HHV)
11419496
Energy Potential of Gas (Btuday) (HHV)
58901700 58901700 58901700 58901700 58901700
of Gas Used for Digester Heat Load (Btuday)
194
Excess Digester Gas (Btuday) 47482204 Electric Efficiency (HHV) 291 326 260 423 PowershytoshyHeat Ratio 062 086 088 126 Total CHP Efficiency (HHV) 76 71 56 76
Electric Production (Btuday) 17140395 19201954 15314442 24915419 Electric Production (kW) 209 234 187 304 Heat Recovery (Btuday) 27645798 22327854 17402775 19774142 Digester Heat Load (Btuday) 9135597 9135597 9135597 9135597 Additional Heat Available (Btuday)
18510201 13192257 8267178 10638545
Note Analysis assumes 50 percent summer and 50 percent winter digester operation Assumes 80 percent efficient boiler Assumes no other uses except boiler Available for nonshydigester heating uses at the facility (eg space heating hot water)
Based on the modeled CHP systems and 91 MGD the analysis developed an engineering rule of thumb for assessing CHP potential The analysis shows that 1 MGD of influent flow equates to 26 kW of electric capacity and 24 MMBtuday of thermal energy potential To develop a relationship between influent flow rate (ie MGD) and CHP capacity the analysis takes the average outputs of the four prime movers yielding the result that an influent flow rate of 91 MGD produces 234 kW of electric capacity and approximately 22 MMBtuday of thermal energy output The analysis scaled this result to a per MGD basis to provide a simple relationship between influent flow and CHP capacity that WWTF operators can use to approximate a CHP system size at their facilities
11
413 National Electric Generation Potential from CHP at Wastewater Treatment Facilities
Table 7 summarizes the CHP technical potential at WWTFs in the United States As shown in Tables 3 and 4 (see Section 32) the 2008 CWNS identified 1351 WWTFs greater than 1 MGD that have anaerobic digesters but that do not utilize CHP representing 15795 MGD of wastewater flow Using the results developed in the technical potential analysis (ie 1 MGD of influent flow can produce 26 kW of electric capacity and 24 MMBtuday of thermal energy) these 1351 WWTFs could produce approximately 411 MW of electric capacity and 37908 MMBtuday of thermal energy if they all installed and operated CHP
Table 7 CHP Technical Potential at Wastewater Treatment Facilities in the United States
Facility Type Number of WWTFs
Wastewater Flow (MGD)
Electric Potential (MW)
Thermal Potential (MMBtuday)
WWTFs with anaerobic digestion and no CHP (gt1 MGD)
1351 15795 411 37908
Electric and thermal potential estimates assume that 26 kW of electric capacity and 24 MMBtuday result from a wastewater influent flow rate of 1 MGD Note An additional 269 MW of electric capacity and 24852 MMBtuday of thermal energy is possible at WWTFs greater than 1 MGD that do not currently operate anaerobic digesters However as stated earlier power and heat generation is typically not a primary driver for installing and operating anaerobic digesters and because it is unlikely that all these WWTFs will install anaerobic digesters this potential is unlikely to be achieved
414 Potential Carbon Dioxide Emissions Benefits
As described in Section 413 411 MW of CHP technical potential exists at WWTFs that operate anaerobic digesters This subsection presents an estimate of the CO2 emissions that would be prevented if this potential were to be achieved
The following assumptions were used to develop the estimate of CO2 emissions prevented by CHP at WWTFs with anaerobic digesters
bull Prior to CHP development WWTFs purchase electricity from the grid and use biogas from the digesters in on-site boilers to meet digester heat loads and space heating needs and flare any excess biogas (CO2 emissions reductions therefore arise from displaced grid electricity only)
bull CO2 emissions from biogas combustion are emitted regardless of whether or not CHP is employed and therefore biogas combustion with CHP yields no net positive CO2
emissions
bull All of the electricity produced is utilized on site and excess power is not exported to the grid
bull The CHP system operates year-round
Since all of the estimated CO2 emissions reductions are associated with displaced grid-supplied electricity the key determinant for estimating total emissions reductions is a grid-based CO2
emissions factor The analysis uses the 2010 Emissions amp Generation Resource Integrated
12
Database (eGRID)20 to obtain this factor eGRID data include total mass emissions and emissions rates for nitrogen oxides sulfur dioxide CO2 methane and nitrous oxide net generation and resource mix associated with US electricity generation This analysis uses the national all-fossil average CO2 emissions factor (174481 lb CO2megawatt-hour [MWh] produced) because it most closely approximates the generation mix that is displaced by CHP21
eGRID CO2 emissions factors relate pollutant emissions to the amount of electricity generated and not the amount of electricity delivered Based on the assumption that all of the electricity generated by the CHP system is used on site at the WWTF the eGRID factor is adjusted to account for transmission and distribution (TampD) losses associated with displaced grid electricity since these losses do not occur with CHP According to eGRID the US average TampD line loss percentage is 62 percent meaning that 1 MWh produced results in 0938 MWh delivered As a result the adjusted all-fossil average CO2 emission factor is 186014 lb CO2MWh delivered
Multiplying the adjusted CO2 grid emissions factor by the electric potential estimate yields avoided CO2 emissions of 3040726 metric tons per year which is equivalent to the emissions from 596052 passenger vehicles22 Table 8 presents these results
Table 8 Potential Carbon Dioxide Emissions Displaced with CHP at Wastewater Treatment Facilities
InputOutput Value
Electric potential at WWTFs with anaerobic digesters
411 MW
Total annual electric production (assumes yearshyround operation)
3602826 MWh
Adjusted allshyfossil average CO2
emissions factor 186014 lb CO2MWh
Total displaced CO2 emissions 3350880 tons CO2year
or 3040726 metric tons CO2year
Equivalent number of passenger vehicles
596052
42 Economic Potential for CHP at Wastewater Treatment Facilities
Section 421 describes the assumptions and methodology used in the economic potential analysis Section 422 presents a discussion of the heating requirements of WWTFs and develops estimates for the thermal energy requirements of anaerobic digesters Section 423 presents the cost-to-generate estimates for each of the digester gas utilization cases Section 424 presents an estimate of national economic potential based on 2008 CWNS data and the cost-toshygenerate results
20 eGRID is the most comprehensive source of data on the environmental characteristics of electricity generated in the United States Available at httpwwwepagovcleanenergyenergy-resourcesegridindexhtml 21 For more information on the use and value of eGRID emission data see httpwwwepagovcleanenergydocumentsegridzipsThe_Value_of_eGRID_Dec_2009pdf 22 Equivalent passenger vehicles are calculated using the EPA Greenhouse Gas Equivalencies Calculator Available at httpwwwepagovcleanenergyenergy-resourcescalculatorhtml
13
421 Methodology
To determine the economic potential for CHP at WWTFs the analysis developed estimates of the cost to generate electricity on site using digester gas for three digester gas utilization cases The following assumptions were used to develop cost-to-generate estimates
bull Digester gas utilization cases Three cases of different uses of digester gas were considered in order to evaluate the thermal credit associated with CHP23 (The thermal credit represents the avoided fuel costs achieved through CHP heat recovery on a per kWh basis)
o Case 1 Assumes digester gas is used for both digester heating and space heating prior to CHP implementation
o Case 2 Assumes digester gas is used for digester heating only prior to CHP implementation and natural gas is used for space heating
o Case 3 Assumes digester gas is not used for heating and natural gas is used for digester and space heating prior to CHP implementation
Research conducted for this analysis indicates that Case 2 is the most frequent practice prior to CHP implementation242526 It is much less common to use digester gas to meet both digester and space heating needs or to not use it at all The cost-to-generate analysis evaluates all three cases however to provide a comprehensive examination of all possible digester gas utilization options and the benefits of using CHP thermal output
bull Thermal credit For all thermal credits the analysis uses the 2010 national average industrial gas price of $540 per thousand cubic feet27
bull WWTF plant size The plant sizes selected for the analysis are representative of the range of facility sizes that are applying CHP
bull CHP prime mover The CHP prime movers chosen for analysis are consistent with those currently used at WWTFs (see Table 2 Section 31) Systems are assumed to be available 95 percent of the time with 5 percent downtime for maintenance and repairs For systems using combustion turbines however availability is estimated at 98 percent based on Solar Turbines data
bull CHP prime mover size CHP prime mover size is based on the relationship between wastewater influent flow and CHP electric capacity as derived in the technical potential analysis (see Section 41) which shows that 1 MGD of flow can produce 26 kW of electric capacity in a CHP system
23 The CHPPrsquos 2007 report evaluated these same three cases with Case 3 providing the highest thermal value because the CHP thermal output displaces natural gas purchases and Case 1 providing the lowest thermal value because the CHP thermal output does not displace any purchased fuel 24 Fishman Bullard Vogt and Lundin ldquoBeneficial Use of Digester Gas ndash Seasonal and Lifecycle Cost Considerationsrdquo 2009 25 Brown and Caldwell (prepared for Town of Fairhaven Massachusetts Board of Public Works) ldquoAnaerobic Digestion and Combined Heat and Power Feasibility Studyrdquo December 19 2008 26 SEA Consultants ldquoCity of Pittsfield Feasibility Study Wastewater Treatment Plantrdquo April 2008 27 Energy Information Administration Form EIA-857 ldquoMonthly Report of Natural Gas Purchases and Deliveries to Consumersrdquo Washington DC
14
bull Interest rate and project lifespan The analysis assumes a 5 percent interest rate and a 20shyyear lifespan
The analysis calculates the cost to generate electricity under each of the three digester gas utilization cases using the thermal energy requirement for anaerobic digesters28 (Table 9) and CHP prime mover price and performance specifications (Table 11)
422 Heating Requirements of Wastewater Treatment Facilities
A critical characteristic of any economic CHP application is to use as much CHP thermal output as possible For WWTFs recovered thermal energy from CHP can be used for digester heating and space heating This subsection presents a discussion of the heating requirements of WWTFs and develops estimates of the thermal energy requirements for anaerobic digesters used in the CHP cost-to-generate estimates It also presents the results of an analysis of how much CHP thermal output can be utilized to meet space heating requirements at WWTFs
Thermal Energy Requirements for Anaerobic Digesters
Climate is the most important factor determining digester heating requirements When ambient air and sludge temperatures are low it takes more energy to heat the digesters The United States can be divided into five different climate zones29 based on cooling and heating degree days
Zone 1 ndash Cold climate with more than 7000 heating degree days Zone 2 ndash Coldmoderate climate with 5500 to 7000 heating degree days Zone 3 ndash Moderatemixed climate with 4000 to 5500 heating degree days Zone 4 ndash Warmhot climate with fewer than 4000 heating degree days and fewer than 2000 cooling degree days Zone 5 ndash Hot climate with fewer than 4000 heating degree days and more than 2000 cooling degree days
Figure 1 shows the five US climate zones by state (States that span more than one zone are assigned to the zone that covers most of the state)
28 Greater thermal energy requirements for anaerobic digesters means that there is less CHP recovered heat available to displace purchased natural gas for space heating loads resulting in a smaller thermal credit 29 US Energy Information Administration Commercial Buildings Energy Consumption Survey Washington DC 2003
15
Figure 1 Map of Five US Climate Zones by State
Recent feasibility studies and technical papers for various anaerobic digester gas projects were examined to determine how digester heating requirements correlate to climate (see Figure 2) These feasibility analyses and technical papers assessed digester gas projects in the following locations Georgia (Zone 5) North Carolina (Zone 4) Oregon (Zone 3) Massachusetts (Zone 2) and Maine (Zone 1) Using these locations the analysis determined the minimum and maximum energy requirements in terms of heating degree days In each case the average energy required each day (MMBtuday) was divided by the size of the WWTF as measured in MGD With minimum and maximum bounds for the energy requirements the average value for MMBtudayMGD was determined This was accomplished by first plotting the data points and constructing parallel lines that roughly intersect the two highest and the two lowest data points These two lines represent the maximum and minimum heating requirements The average heating requirement line was developed by adding a line that divides equally the area between these two lines Figure 2 shows the data points used along with the minimum maximum and average values according to heating degree days Table 9 presents the minimum maximum and average values in tabular form In each case the average energy required each day (MMBtuday) was divided by the size of the WWTF as measured in MGD The average values for each zone were used in the cost-to-generate analysis
16
Figure 2 Thermal Energy Requirements for Anaerobic Digesters by Heating Degree Days
05
1
15
2
25
3
0 1000 2000 3000 4000 5000 6000 7000 8000
MM
Btu
da
y p
er
MG
D
Zones 4 amp 5 Zone 3 Zone 2 Zone 1
Cape Fear NC
Atlanta GA
Dalles OR
Fairhaven MA
Pittsfield MA
Auburn ME
MAX
MIN
AVG
35
0
Heating Degree Days
Sources Atlanta GA Hardy Scott A AWEA Annual Conference 2011 ldquoAchieving Economic and Environmental Sustainability Objectives through On-Site Energy Production from Digester Gasrdquo April 11 2011 Auburn ME CDM Lewiston Auburn Water Pollution Control Authority ldquoMaine Anaerobic Digestion and Energy Recovery Project Conceptual Design Reportrdquo October 2009 Cape Fear NC Fishman Bullard Vogt and Lundin ldquoBeneficial Use of Digester Gas ndash Seasonal and Lifecycle Cost Considerationsrdquo 2009 Dalles OR Carollo ldquoThe Dalles Wastewater Treatment Plant Cogeneration Feasibility Studyrdquo September 2009 Fairhaven MA Brown and Caldwell (prepared for Town of Fairhaven Massachusetts Board of Public Works) ldquoAnaerobic Digestion and Combined Heat and Power Feasibility Studyrdquo December 19 2008 Pittsfield MA SEA Consultants ldquoFeasibility Study ndash Wastewater Treatment Plant City of Pittsfieldrdquo April 2008
Table 9 Thermal Energy Requirements for Anaerobic Digesters by Climate Zone
Average MMBtudayMGD
Climate Zone Minimum Maximum Average
Zone 1 (Cold) 18 37 28
Zone 2 (ModerateCold) 16 34 25
Zone 3 (ModerateMixed) 14 30 23
Zone 4 (WarmHot) 12 28 20
Zone 5 (Hot) 10 26 18
Space Heating Capability of CHP at Wastewater Treatment Facilities
In addition to estimating the thermal energy requirements for anaerobic digesters the analysis also developed estimates of how much CHP thermal output is available for space heating after
17
digester heating requirements are met The estimates of surplus thermal output for space heating were taken into consideration when developing the value of the thermal credit used in the costshyto-generate analysis
The analysis revealed that a substantial amount of surplus heat for space heating is available only in warm and hot climates where demand for space heating is minimal except in cold winter months In these warm and hot climates up to 25 percent of the CHP thermal output is available for space heating In cold climates where more energy is required to heat the digester surplus thermal energy for space heating is generally not available In these cooler climates the analysis estimated that less than 10 percent of the CHP thermal output is available and in many cases there is none left for space heating
While the data suggest that surplus heat may not be available in colder climates after the digester heating needs have been met some facilities in these climates do in fact have surplus heating For example one of the WWTFs interviewed by the CHPP the town of Lewiston NY (see Section 5) has enough thermal output to heat one building in the summer and to meet 95 percent of that buildingrsquos winter heating requirement This discrepancy between estimated and realized thermal surplus can be attributed to a number of factors
bull Digester heating requirements depend on many different factors and design and construction of the digester can influence the heat loss due to factors such as insulation
bull Certain methods for increasing digester gas production can allow for a larger CHP system and more surplus thermal output for space heating These methods include mixing of the contents of the digester tank or incorporating fats oils and greases (FOG) into the digester
bull WWTFs can also increase the size of the CHP system and incorporate natural gas in their fuel usage to increase the amount of CHP thermal output available for space heating
Further details about the analysis of space heating capability of CHP can be found in Appendix C
423 Estimated Cost to Generate Electricity
This subsection presents estimates of the cost to generate electricity with CHP using digester gas for each of the three digester gas utilization cases The cost-to-generate calculation involves calculating the investment cost (CHP system and gas pretreatment equipment) on a per-kWh generated basis adding in maintenance costs and applying a thermal credit as appropriate to derive the full cost per kWh to own and operate a CHP system WWTF operators can compare the cost-to-generate estimates to the current retail electric rate that they pay to help them evaluate if a more detailed analysis of CHP makes sense for their facility
Based on the results of the analysis the following observations can be made
bull The cost to generate electricity using CHP at WWTFs ranges from 11 to 83 cents per kWh depending on the CHP prime mover and other factors Current retail electric rates range from 39 to more than 21 cents per kWh so CHP can have clear economic benefits for WWTFs
bull Cost to generate tends to decrease as the prime mover increases in size
18
bull The more thermal energy a WWTF can use throughout the year the lower the cost to generate
Table 10 presents installed cost data for digester gas-fueled CHP systems Gas pretreatment equipment is typically required for digester gas generators so these costs are included Data were obtained from case studies and feasibility studies for digester gas reciprocating engines microturbines fuel cells and combustion turbines
Table 10 Installed Cost Data Points for Anaerobic Digester Gas CHP Systems
Facility Name State Prime Mover Size (kW) Total Installed
Cost Cost per kW
Essex Junction Wastewater Treatment Facility1 VT Microturbine 60 $303000 $5000 Lewiston Wastewater Treatment Facility2 NY Microturbine 60 $300000 $5000 Chiquita Water Reclamation Plant1 CA Microturbine 60 $275000 $4600 Albert Lea Wastewater Treatment Facility1 MN Microturbine 120 $500000 $4200 Columbia Blvd Wastewater Treatment Plant3 OR Microturbine 120 $346000 $2900 Fairfield Wastewater Treatment Facility4 CT Fuel Cell 200 $1200000 $6000 Wildcat Hill2 AZ Reciprocating
Engine 292 $1750000 $6000
Vander Haak Dairy Farm3 WA Reciprocating Engine
300 $1200000 $4000
Gresham Wastewater Treatment Plant5 OR Reciprocating Engine
395 $1352000 $3400
Janesville Wastewater Treatment Facility1 WI Reciprocating Engine
400 $910000 $2300
King County South Treatment Plant6 WA Fuel Cell 1000 $5000000 $5000 Salt Lake City Water Reclamation Plant7 UT Reciprocating
Engine 1400 $3500000 $2500
Rochester Wastewater Reclamation Plant1 NY Reciprocating Engine
2000 $4000000 $2000
Southside Wastewater Treatment Plant8 TX Combustion Turbine
4200 $10500000 $2500
Del Rio Wastewater Treatment Plant8 TX Combustion Turbine
4200 $9400000 $2200
Generic Site9 USA Combustion Turbine
4910 $8758000 $1800
1 Midwest CHP Application Center RAC Project Profiles httpwwwchpcentermworg15shy00_profileshtml 2 Project Interview 9142010 3 Northwest CHP Application Center Case Studies httpchpcenternworgProjectProfilesCaseStudiesaspx 4 Project Interview 9222010 installation uses natural gas and not digester gas 5 httpfilesharceduSitesGulfCoastCHPCaseStudiesGreshamORWastewaterServicespdf 6 Estimate from Greg Bush King County Project Manager on new MCFC Installation 7 httpwwwslcgovcomutilitiesNewsEventsnews2003news552003htm 8 Estimate by CDM (2005) 9 Estimate by Solar Turbines (2010) for landfill site
Based on data from Table 10
bull Microturbine CHP systems range from $3000kW to $5000kW30
30 Microturbine CHP systems can be the most versatile option for smaller (ie lt10 MGD) WWTFs
19
bull Reciprocating engine CHP systems in the 300 kW to 1 MW size range typically cost between $2500kW and $4000kW Larger engine systems over 1 MW in size tend to range from $2000kW to $3000kW31
bull Combustion turbine CHP systems are generally the least expensive option on a per-kW basis ranging between $1800kW and $2800kW32
bull In general fuel cell systems are the highest cost option at $5000kW to $6000kW even for large gensets greater than 1 MW33
Using the cost data points shown in Table 10 the analysis developed size ranges and costs for the different prime movers for use in the cost-to-generate estimates Specifications for the prime movers such as maintenance costs efficiencies and system availability (used to estimate down time) were also estimated based on manufacturer data The results are presented in Table 11
Table 11 Prime Mover Price and Performance Specifications for Use in Economic Potential Model
Prime Mover Min Size (kW)
Max Size (kW)
Modeled Installed Cost
($kW)
Maintenance ($kWh)
Thermal Output
(BtukWh)
Electric Efficiency
()
CHP Efficiency
() Small RichshyBurn Engine
30 100 4500 003 5800 28 76
Microturbine 30 250 4000 0025 3900 26 55
RichshyBurn Engine
100 300 3600 0025 5500 29 76
Fuel Cell 200 2000 5500 003 2700 42 76
Small LeanshyBurn Engine
300 900 3200 002 4000 32 71
LeanshyBurn Engine
1000 4800 2500 0016 3400 38 75
Combustion Turbine
4000 16000 2100 0012 3900 35 75
Note All equipment and maintenance costs include gas pretreatment Electric and CHP efficiencies are based on HHV of the digester gas supplied Maintenance costs for WWTFs using CHP can vary considerably During the interviews of WWTF operators with CHP installations (see Section 5) it was found that some facilities have maintenance costs as high as 7 cents per kWh primarily due to excessive contaminants in the digester gas leading to very high fuel treatment costs Other sites were able to keep maintenance costs down due to cleaner digester gas and ideal maintenance strategies As a result the maintenance costs in Table 11 should be seen as estimates and are not intended to indicate what any individual site will experience
The analysis used the CHP prime mover price and performance specification data in Table 11 and the thermal energy requirement for anaerobic digesters data in Table 9 to develop cost-toshygenerate estimates for CHP at WWTFs Tables 12 through 14 present the cost-to-generate estimates for the three digester gas utilization cases
bull Table 12 presents the cost-to-generate results for Case 1 This case assumes the site uses digester gas in its boiler to provide digester and space heating prior to CHP therefore no
31 Some smaller rich-burn engine systems have been employed at smaller WWTFs but they tend to be costly and do not offer the benefits of lean-burn technology in this smaller (under 300 kW) size Rich-burn engines tend to produce more emissions and have lower electric efficiencies than their lean-burn counterparts so deployment of rich-burn engines has declined in recent years as lean-burn engines have been produced at increasingly smaller sizes 32 Combustion turbines are mostly limited to WWTF applications 4 MW or larger in size 33 Some states (eg Connecticut) offer incentives for fuel cell installations which can help lower costs
20
value is given to the thermal output of the CHP because it does not displace any natural gas purchases As a result there is no variation in the value of thermal output by climate zone and the cost to generate is estimated to be constant for each climate zone Of the three cases modeled Case 1 results in the highest cost to generate although in areas with high retail electric rates CHP projects can have an acceptable payback period
bull Table 13 presents the cost-to-generate results for Case 2 This case assumes the site uses digester gas in its boiler to provide digester heating and purchases natural gas for space heating (when needed) prior to CHP resulting in a thermal credit for reductions in natural gas purchases used for space heating To account for the fact that space heating requirements are highest during cold winter periods when digester heating loads are also at their peak the analysis employed a seasonal digester load factor to adjust for peak loads34 For most climate zones and WWTF capacities the thermal credit was very small and had minimal impact on the cost to generate The thermal credit for space heating results in a lower cost to generate only in warmer climates where less energy is required to heat the digester
bull Table 14 presents the cost-to-generate results for Case 3 This case assumes the site uses natural gas to provide all digester and space heating resulting in a full thermal credit In this case the thermal credit is much more substantial and reduces the cost to generate by several cents in all climates for all WWTF sizes as compared to Case 2 The research conducted for this analysis indicates however that Case 3 is atypical and that Case 2 represents the most frequently observed practice
Appendix D provides state-by-state cost-to-generate estimates for Case 1 Case 2 and Case 3 for each type of CHP system
Table 12 Estimated Cost to Generate Anaerobic Digester Gas Electricity (Case 1 ndash No Natural Gas Purchases Displaced)
Estimated Cost to Generate ($kWh)
Climate Zone WWTF Plant Size
(MGD)
Corresponding CHP System Size (kW)
Microshyturbine
RichshyBurn Engine
Fuel Cell
LeanshyBurn Engine
Turbine
1ndash5 (All Zones)
1ndash5 30ndash130 0064 0073 shyshyshy shyshyshy shyshyshy
5ndash10 130ndash260 0064 0060 0083 shyshyshy shyshyshy
10ndash20 260ndash520 0064 0060 0083 0051 shyshyshy
20ndash40 520ndash1040 shyshyshy shyshyshy 0083 0051 shyshyshy
40ndash150 1040ndash3900 shyshyshy shyshyshy 0083 0040 shyshyshy
gt150 gt3900 shyshyshy shyshyshy shyshyshy 0040 0032
34 Average digester loads are lower than winter digester loads and subtracting average digester loads from CHP thermal output leaves more thermal output for space heating than actually is available during winter period Using seasonal loads is necessary to avoid overstating the amount of surplus heat available for space heating and the size of the thermal credit The seasonal digester load factor is the ratio of the winter digester heat load to the average monthly digester heat load The seasonal digester load factor chosen for the analysis was 136 which is based on data from the Cape Fear NC and Pittsfield MA feasibility analyses (these two analyses provided seasonal data whereas the other analyses cited in Figure 2 did not)
21
Table 13 Estimated Cost to Generate Anaerobic Digester Gas Electricity (Case 2 ndash CHP Heat Displaces Natural Gas Space Heating)
Estimated Net Cost to Generate ($kWh)
Climate Zone WWTF Plant Size
(MGD)
Corresponding CHP System Size (kW)
Microshyturbine
RichshyBurn Engine
Fuel Cell
LeanshyBurn Engine
Turbine
1 ndash Cold
ndash 30ndash130 0064 0073 shyshyshy shyshyshy shyshyshy
5ndash10 130ndash260 0064 0060 0083 shyshyshy shyshyshy
10ndash20 260ndash520 0064 0060 0083 0051 shyshyshy
20ndash40 520ndash1040 shyshyshy shyshyshy 0083 0051 shyshyshy
40ndash150 1040ndash3900 shyshyshy shyshyshy 0083 0040 shyshyshy
gt150 gt3900 shyshyshy shyshyshy shyshyshy 0040 0032
2 ndash Cold Moderate
1ndash5 30ndash130 0064 0073 shyshyshy shyshyshy shyshyshy
5ndash10 130ndash260 0064 0060 0083 shyshyshy shyshyshy
10ndash20 260ndash520 0064 0060 0083 0051 shyshyshy
20ndash40 520ndash1040 shyshyshy shyshyshy 0083 0051 shyshyshy
40ndash150 1040ndash3900 shyshyshy shyshyshy 0083 0040 shyshyshy
gt150 gt3900 shyshyshy shyshyshy shyshyshy 0040 0032
3 ndash Moderate Mixed
1ndash5 30ndash130 0064 0073 shyshyshy shyshyshy shyshyshy
5ndash10 130ndash260 0064 0059 0083 shyshyshy shyshyshy
10ndash20 260ndash520 0064 0059 0083 0051 shyshyshy
20ndash40 520ndash1040 shyshyshy shyshyshy 0083 0051 shyshyshy
40ndash150 1040ndash3900 shyshyshy shyshyshy 0083 0040 shyshyshy
gt150 gt3900 shyshyshy shyshyshy shyshyshy 0040 0032
4 ndash Warm Hot
1ndash5 30ndash130 0064 0073 shyshyshy shyshyshy shyshyshy
5ndash10 130ndash260 0064 0058 0083 shyshyshy shyshyshy
10ndash20 260ndash520 0064 0058 0083 0051 shyshyshy
20ndash40 520ndash1040 shyshyshy shyshyshy 0083 0051 shyshyshy
40ndash150 1040ndash3900 shyshyshy shyshyshy 0083 0040 shyshyshy
gt150 gt3900 shyshyshy shyshyshy shyshyshy 0040 0032
5 ndash Hot
1ndash5 30ndash130 0064 0072 shyshyshy shyshyshy shyshyshy
5ndash10 130ndash260 0064 0058 0083 shyshyshy shyshyshy
10ndash20 260 shy 520 0064 0058 0083 0051 shyshyshy
20ndash40 520ndash1040 shyshyshy shyshyshy 0083 0051 shyshyshy
40ndash150 1040ndash3900 shyshyshy shyshyshy 0083 0040 shyshyshy
gt150 gt3900 shyshyshy shyshyshy shyshyshy 0040 0031
22
Table 14 Estimated Cost to Generate Anaerobic Digester Gas Electricity (Case 3 ndash CHP Heat Displaces Natural Gas for Both Digester and Space Heating)
Estimated Net Cost to Generate ($kWh)
Climate Zone WWTF Plant Size (MGD)
Corresponding CHP System Size (kW)
Microshyturbine
RichshyBurn Engine
Fuel Cell
LeanshyBurn Engine
Turbine
1 ndash Cold
1ndash5 30ndash130 0043 0044 shyshyshy shyshyshy shyshyshy
5ndash10 130ndash260 0043 0035 0068 shyshyshy shyshyshy
10ndash20 260ndash520 0043 0035 0068 0029 shyshyshy
20ndash40 520ndash1040 shyshyshy shyshyshy 0068 0029 shyshyshy
40ndash150 1040ndash3900 shyshyshy shyshyshy 0068 0022 shyshyshy
gt150 gt3900 shyshyshy shyshyshy shyshyshy 0022 0011
2 ndash Cold Moderate
1ndash5 30ndash130 0043 0047 shyshyshy shyshyshy shyshyshy
5ndash10 130ndash260 0043 0037 0068 shyshyshy shyshyshy
10ndash20 260ndash520 0043 0037 0068 0029 shyshyshy
20ndash40 520 shy 1040 shyshyshy shyshyshy 0068 0029 shyshyshy
40ndash150 1040ndash3900 shyshyshy shyshyshy 0068 0022 shyshyshy
gt150 gt3900 shyshyshy shyshyshy shyshyshy 0022 0011
3 ndash Moderate Mixed
1ndash5 30ndash130 0043 0050 shyshyshy shyshyshy shyshyshy
5ndash10 130 shy 260 0043 0039 0068 shyshyshy shyshyshy
10ndash20 260ndash520 0043 0039 0068 0030 shyshyshy
20ndash40 520ndash1040 shyshyshy shyshyshy 0068 0030 shyshyshy
40ndash150 1040ndash3900 shyshyshy shyshyshy 0068 0022 shyshyshy
gt150 gt3900 shyshyshy shyshyshy shyshyshy 0022 0012
4 ndash WarmHot
1ndash5 30ndash130 0043 0052 shyshyshy shyshyshy shyshyshy
5ndash10 130ndash260 0043 0040 0068 shyshyshy shyshyshy
10ndash20 260ndash520 0043 0040 0068 0033 shyshyshy
20ndash40 520ndash1040 shyshyshy shyshyshy 0068 0033 shyshyshy
40ndash150 1040ndash3900 shyshyshy shyshyshy 0068 0022 shyshyshy
gt150 gt3900 shyshyshy shyshyshy shyshyshy 0022 0014
5 ndash Hot
1ndash5 30ndash130 0045 0053 shyshyshy shyshyshy shyshyshy
5shy10 130ndash260 0045 0042 0068 shyshyshy shyshyshy
10ndash20 260ndash520 0045 0042 0068 0034 shyshyshy
20ndash40 520ndash1040 shyshyshy shyshyshy 0068 0034 shyshyshy
40ndash150 1040ndash3900 shyshyshy shyshyshy 0068 0024 shyshyshy
gt150 gt3900 shyshyshy shyshyshy shyshyshy 0024 0016
23
424 National Economic Potential Scenarios
Using the cost-to-generate results presented in the previous subsection and the 2008 CWNS data national economic potential estimates were developed Two scenarios were evaluated due to uncertainties in 2008 CWNS data
bull Scenario 1 Most Facilities Do Not Use Digester Gas Prior to CHP This scenario assumes that the 2008 CWNS data on how WWTFs use their digester gas are completely accurate meaning that most WWTFs with anaerobic digesters do not use their biogas in any way As mentioned in Section 32 however there are limitations to using CWNS data and the CWNS finding that biogas is used minimally is inconsistent with research and interviews conducted as part of this report
bull Scenario 2 All Facilities Use Digester Gas to Heat Digester Prior to CHP This scenario assumes that the research conducted in preparing this report is correct and that most WWTFs use their digester gas to heat the digester For the purposes of the analysis Scenario 2 assumes that all WWTFs use their digester gas to heat the digester only and use natural gas for any additional space heating needs prior to CHP implementation
For both scenarios the analysis estimates the national economic potential by estimating the simple payback period for each WWTF and summing all CHP system sizes (MW) that have a payback period of seven years or less The analysis was done for each WWTF in the United States greater than 1 MGD that has an anaerobic digester but does not have CHP installed Payback period was determined by dividing the total capital investment for CHP by the total annual savings achieved through CHP use35
The results show an economic potential range for CHP of 178 to 260 MW at WWTFs greater than 1 MGD with anaerobic digesters with Scenario 1 providing an upper bound and Scenario 2 the lower bound
Details concerning each of the scenario analyses are discussed below
Scenario 1 Most Facilities Do Not Use Digester Gas Prior to CHP
Scenario 1 assumes that the 2008 CWNS data are completely accurate indicating that most WWTFs with anaerobic digesters do not use their biogas in any way Based on research and through the facility interviews conducted as part of this report however the authors believe that most WWTFs use at least some of their digester gas The CWNS data suggest otherwisemdashthat 1148 of the 1351 facilities evaluated do not use their digester gas As a result of this discrepancy the analysis of the CWNS is presented here as a scenario of what the economic potential could be if the CWNS data were fully accurate and the scenario is meant to serve as an upper bound of CHP economic potential
35 Total annual cost savings were calculated by adding the annual electric and natural gas bill savings and subtracting the annual maintenance costs Annual electric bill savings were derived from annual CHP electrical output multiplied by state average industrial electricity prices from 2010 (EIA) Annual natural gas bill savings were estimated using the thermal credit calculation described in Section 423 on cost to generate that were based on annual avoided gas purchases for each potential project using 2010 state industrial natural gas prices (EIA) Annual maintenance costs were derived from the maintenance costs as shown in Table 12 multiplied by the CHP annual electric output
24
Table 15 presents the number of WWTFs and the total capacity for each digester gas utilization case with an estimated payback period of less than seven years (see Section 421 for an explanation of the three digester gas utilization cases)
Table 15 Economic Potential of U S Wastewater Treatment Facilities (Scenario 1 ndash Most Facilities Do Not Utilize Digester Gas Prior to CHP)
Digester Gas Utilization Case Prior to CHP
WWTFs Analyzed
Number of Facilities Evaluated
Facilities with Economic Potential
Potential Capacity (MW)
Case 1 Digester Gas Used for both Digester Heating and Space Heating
Those Utilizing Digester Gas (not for CHP)
203 88 74
Case 2 Digester Gas Used for Digester Heating Only
Those Utilizing Digester Gas (not for CHP)
203 88 74
Case 3 Digester Gas Not Used
Those Not Utilizing Digester Gas
1148 574 186
Total 1351 662 260
The analysis revealed no difference in economic potential between Case 1 (ie no natural gas purchases displaced) and Case 2 (ie CHP heat displaces natural gas space heating) This is because most of the heat recovered from CHP units is required for digester heating leaving little (if any) thermal output for space heating For Case 3 (ie CHP heat displaces natural gas for both digester and space heating) full thermal credit is given for recovered CHP heat assuming that natural gas is used to heat the digester and provide space heating prior to CHP
Scenario 1 shows economically feasible CHP potential at 662 WWTFs across the country with a national potential capacity of 260 MW Since Case 1 and Case 2 draw from the same pool of WWTFs (ie those that are currently using their digester gas) their potentials are not additive The estimated economic potential of 260 MW represents approximately 63 percent of the 411 MW of national technical potential presented in Section 413
Scenario 2 All Facilities Use Digester Gas to Heat Digester
Scenario 2 assumes that all of the WWTFs larger than 1 MGD that do not already employ CHP use their digester gas for heating the digester and use natural gas for any additional space heating needs prior to CHP implementation therefore all facilities evaluated under this scenario fall under Case 2 (ie using digester gas to heat only the digester prior to CHP implementation) As mentioned previously Case 2 is the most common situation for a WWTF that has not already implemented CHP
Table 16 presents the number of WWTFs with economic potential and the total capacity under Scenario 2
25
Table 16 Economic Potential of US Wastewater Treatment Facilities (Scenario 2 ndash All Facilities Use Digester Gas to Heat Digester Prior to CHP)
Digester Gas Utilization Case Prior to CHP
WWTFs Analyzed Number of
Facilities in Data Pool
Facilities with Economic Potential
Potential Capacity (MW)
Case 2 Digester Gas Heats Digester
Those with Digesters gt1 MW not using CHP
1351 257 178
Total 1351 257 178
Scenario 2 shows economic CHP potential at 257 sites across the country with a national potential capacity of 178 MW The estimated economic potential of 178 MW represents approximately 43 percent of the 411 MW of national technical potential presented in Section 413 These data are graphically presented in Figure 3 below
Figure 3 Wastewater Treatment Facilities with Anaerobic Digesters ndash Number of Sites with Economic Potential (Scenario 2)
104 Sites with 257 Sites with CHP Already
Economic Installed Potential
1094 Sites
with No
Current
Economic
Potential
Under Scenario 2 the vast majority of potential comes from large WWTFs (ie gt30 MGD) that can support larger CHP units At smaller facilities using digester gas for digester heating prior to CHP implementation it is difficult to support CHP unless the facility is located in an area with extremely high electricity prices or the facility is willing to accept a longer payback period Figure 4 shows economic potential broken down by WWTF size
26
Figure 4 Economic Potential by Wastewater Treatment Facility Size (Scenario 2)
160shy
Po
ten
tia
l Ca
pa
city
(M
W)
140shy
120shy
100shy
80shy
60shy
40shy
20shy
0shy1-10 MGD 10-20 MGD 20-30 MGD gt30 MGD
WWTF Size Range
27
50 Wastewater Treatment Facility Interviews CHP Benefits Challenges and Operational Insights
The previous sections of this report demonstrate that there is both technical and economic potential for increased CHP use at WWTFs in the United States Translating potential into actual successes however requires an understanding of operational realities This section builds on the previous sections by presenting operational experiences from WWTFs that have already implemented CHP To assess operational experiences with CHP at WWTFs interviews of a number of WWTFs that utilize CHP were conducted The focus of these conversations was to gain a better understanding of their decision to utilize CHP the benefits they have realized from CHP to date and the challengesbarriers of operating and maintaining CHP systems Much of the information obtained through the interviews affirms common elements reported in other recent studies on CHP at WWTFs36 but new operational insights were also discovered
This section first provides an overview of the WWTFs interviewed by the CHPP and explains how they were chosen It also provides descriptions of the interview format used and the questions asked Subsequent subsections summarize the information obtained through the interviews and are organized by
bull Drivers for installing CHP and operational benefits
bull Challenges to CHP project development and operationmaintenance (OampM)
bull Operational insights and observations
51 Wastewater Treatment Facilities Interviewed and Interview Format
When selecting WWTFs to interview the objective was to build a representative pool of WWTFs so that the results were indicative of the sector WWTFs selected to be interviewed therefore represent operational geographical and technological diversity Thirty WWTFs were initially identified and 14 were ultimately interviewed Table 17 provides a summary of the 14 WWTFs interviewed
Of the 14 CHP systems represented the prime mover breakdown matches closely with what is seen in the marketplace (see Table 2 Section 31) with nine operating reciprocating engines four operating microturbines and one operating a fuel cell system CHP system sizes range from 60 kW to 3075 MW and WWTF flow capacities range from 2 MGD to 75 MGD The earliest CHP system was installed in 1987 and the most recent in 2009 The 14 WWTFs are also located across the country with four operating in the East one operating in the Southeast five operating in the Midwest and four operating in the West
36 Association of State Energy Research amp Technology Transfer Institutions ldquoStrategic CHP Deployment Assistance for Wastewater Treatment Facilitiesrdquo October 2009 Available at httpwwwaserttiorgwastewaterindexhtml Brown amp Caldwell ldquoEvaluation of Combined Heat and Power Technologies for Wastewater Treatment Facilitiesrdquo December 2010 Available at httpwaterepagovscitechwastetechpublicationscfm
28
Table 17 Wastewater Treatment Facilities Interviewed
Wastewater Treatment Facility Name
Location Average Flow Rate (MGD)
CHP Prime Mover
CHP Capacity (MW)
CHP Installation
Date Albert Lea Wastewater Treatment Plant
Albert Lea MN 50 Microturbine 0120 2004
Allentown Wastewater Treatment Plant
Allentown PA 310 Microturbine 0360 2001
Bergen County Utilities Authority
Little Ferry NJ 750 Reciprocating
Engine 2812 2008
Chippewa Falls Wastewater Treatment Plant
Chippewa Falls WI 20 Microturbine 0060 2003
City of Great Falls Wastewater Treatment Plant
Great Falls MT 210 Reciprocating
Engine 0540 2008
City of Santa Maria Wastewater Treatment Plant
Santa Maria CA 78 Reciprocating
Engine 0300 2009
Columbia Boulevard Wastewater Treatment Plant
Portland OR 600 Reciprocating
Engine 1700 2008
Des Moines Metro Wastewater Reclamation Facility
Des Moines IA 700 Reciprocating
Engine 1800 1987
Fairfield Water Pollution Control Authority
Fairfield CT 90 Fuel Cell (Natural
Gas) 0200 2005
Fourche Creek Treatment Plant
Little Rock AR 150 Reciprocating
Engine 1100 2009
Rock River Water Reclamation Plant
Rockford IL 310 Reciprocating
Engine 3075 2004
Theresa Street Wastewater Treatment Facility
Lincoln NE 195 Reciprocating
Engine 0900 1992
Town of Lewiston Water Pollution Control Center
Lewiston NY 20 Microturbine 0060 2001
Wildcat Hill Wastewater Treatment Plant
Flagstaff AZ 35 Reciprocating Engine
0292 2008
Phone interviews were conducted with the facility operators over a two-month period in August and September 2010 The interviews were conducted in an unstructured format and sought to gain information on specific CHP drivers benefits and challengesbarriers The interviews covered the following operational areas
bull The key operational characteristics of the CHP system (eg prime mover type and heat recovery equipment heat recovery use CHP sizing relative to facility demand biogas treatment method system start-up date)
bull The key drivers for installing CHP
bull Degree of local support the WWTF received in installing the CHP system
bull Whether the WWTF received financial incentives for the CHP system and if incentives were critical to project viability
bull The primary challenges and barriers encountered with CHP development and operation and how they were overcome
bull The WWTFrsquos experience working with the local utility
bull The benefits achieved to date and the benefits the WWTF expects to achieve in the future
bull Going forward whether the WWTF would consider CHP as part of any anticipated facility expansions if not what would make a difference in considering CHP
bull Lessons the WWTF can impart to other facilities considering CHP
29
52 Drivers and Benefits
WWTFs can experience efficiency reliability environmental and economic benefits with CHP Table 18 presents the primary drivers and benefits reported by the WWTFs which specifically include the following
bull Energy cost savings
bull Federal state local and utility incentives
bull Energysustainability plans and emissions reductions
bull Enhanced reliability
bull Facility upgrades
bull Increased biogas production
bull Enhanced biosolid management
bull ldquoGreenrdquo publicitypositive public relations
bull Utility load shedding
The interview results clearly show strong benefits from operating CHP at WWTFs and suggest that CHP is a proven method of utilizing digester gas to both produce and conserve energy
30
Table 18 Interview Results ndash Drivers and Benefits
DriverBenefit Summary Examples Energy Cost Savings Each WWTF interviewed utilizes their biogas in
a CHP system to displace electricity andor fuel for digester heat loads that they would otherwise have to purchase leading to significant energy cost savings for the facility Some facilities said they use the savings generated from CHP to invest in other infrastructure upgrades needed at the facility and some of the facilities mentioned that the use of CHP makes them more conscious of the energy they use resulting in additional projects that improve energy efficiency and reduce costs Several facilities also noted the desire to hedge against possible energy price increases as a driver for CHP
bull
bull
bull
bull
bull
bull
The 120 kW microturbine CHP system at Albert Lea Wastewater Treatment Plant generates approximately $100000 in annual energy savings Approximately 70 percent of the savings derives from reduced electricity and fuel purchases and 30 percent from reduced maintenance costs The facility noted that CHP made the facility more conscious of its energy use leading to a number of other energyshyefficiency improvements which resulted in further cost savings The 17 MW reciprocating engine CHP system at the Columbia Boulevard Wastewater Treatment Plant operates at an overall efficiency of 82 percent and generates approximately $700000 in annual energy savings The system offsets approximately 40 percent of the facilityrsquos electric power demand The 900 kW reciprocating engine CHP system at Theresa Street Wastewater Treatment Facility generates $50000 to $100000 in annual energy savings out of an operational budget of $45 million The 3075 MW reciprocating engine CHP system at the Rock River Water Reclamation Plant saves the facility approximately 50 percent on its energy bill an annual savings of approximately $250000 The business case for CHP clearly drove CHP installation for the Santa Maria Wastewater Treatment Plant Prior to installing its 300 kW reciprocating engine CHP system the facility was paying 13 to 15 cents per kWh but with CHP the facility is now only paying the equivalent of 8 cents per kWh37
The 18 MW reciprocating engine CHP system at the Des Moines Metro Wastewater Reclamation Facility has reduced the electrical bill by $500000year since 2002
Federal State Local and A number of the facilities interviewed received bull Fairfield Water Pollution Control Authority cited availability of public funding as a key Utility Incentives38 financial incentives that helped pay for the cost
of installing CHP with some describing the incentives as a key component to project viability Incentive examples include government grants or payments for the ldquogreenrdquo attributes of power generated at WWTFs using biogas and utility programs targeted at expanding clean energy or energy efficiency In addition some facilities can sell excess power to the grid through power purchase agreements which has enhanced CHP project economics at those sites
bull
bull
driver for installing their 200 kW fuel cell CHP system Their system is fueled with natural gas the site previously had biogasshyfueled microturbines but had challenges with gas treatment The facility received $880000 in funding from the Connecticut Clean Energy Fund approximately twoshythirds of the total $12 million CHP system cost For the Town of Lewiston Water Pollution Control Center state and utility funding provided 100 percent of the $300000 project cost of the 60 kW microturbine CHP system Allentown Wastewater Treatment Plant developed its 360 kW microturbine CHP system under a Master Energy Savings agreement with its local utility Under the arrangement installation of the system was funded through a 10shyyear leasepurchase agreement and an OampM agreement with the utility provides for fixed OampM costs (with an escalator) through 2014 In exchange the facility receives guaranteed energy savings achieved
37 The costs of purchasing backup power when the CHP system is down have made the total costs about the same as prior to CHP but this has been attributed to the contract with the third party not covering expected hours of operation or backup charges 38 National and state level incentives applicable to CHP and biogas can be found in the CHPP Funding Database (httpwwwepagovchpfundingfundinghtml) and the Database of State Incentives for Renewable Energy (DSIRE) (httpwwwdsireusaorg)
31
DriverBenefit Summary Examples
bull
bull
through the operation of the CHP system and other Energy Conservation Measures constructed throughout the plant The arrangement was a direct result of the Guaranteed Energy Savings Act passed by the Pennsylvania legislature Albert Lea Wastewater Treatment Plant developed its CHP system through an innovative relationship with its local utility Under the agreement the utility helped pay for the CHP system and agreed to maintain it for the first five years of operation In exchange the utility received clean energy credits for use under Minnesotarsquos Conservation Improvement Program The Columbia Boulevard Wastewater Treatment Plant took advantage of the Oregon Business Energy Tax Credit and received money from the Oregon Energy Trust in exchange for the clean energy credits generated from the CHP system The Business Energy Tax Credit provided 335 percent of the total CHP system cost Although the WWTF is not a taxshypaying entity the tax credit rules allow public entities to sell the credit to entities that are subject to state tax
EnergySustainability Many states localities and facilities have bull The Wildcat Hill Wastewater Treatment Plant the Great Falls Wastewater Treatment Plans and Emissions implemented energy and sustainability plans Plant the Des Moines Metro Wastewater Reclamation Facility and the Bergen County Reductions aimed at increasing energy efficiency and clean
sources of energy Several facilities noted that CHP at their WWTF was a driver for helping to meet a statelocalfacility sustainability plan In addition some of the facilities noted that as environmental organizations their goal is to enhance the health and welfare of their communities These facilities see CHP as a means to help further fulfill this goal because of CHPrsquos ability to displace gridshybased electricity with clean renewably fueled electricitymdash decreasing emissions of pollutants such as nitrogen oxide sulfur dioxide and CO2
bull
bull
Utilities Authority cited sustainability plans as a driverbenefit of CHP installation Both the Wildcat Hill and Great Falls facilities cited sustainability plans as the primary driver for CHP installation The Columbia Boulevard Wastewater Treatment Plantrsquos CHP system helps the city of Portland meet its sustainability plan but the plan was not a driver for the CHP installation The facility is considering expanding the CHP system however and sees the cityrsquos sustainability plan as a driver for the expansion Prior to CHP installation the Allentown Wastewater Treatment Plant fired a small portion of its biogas in boilers for heat flared the remaining biogas and purchased all of its electricity The facility cited the desire to reduce CO2 emissions associated with purchased electricity to be more in line with its environmental mission as a driver for CHP installation
Enhanced Reliability If interconnected in a way that also allows gridshyindependent operation CHP systems can enable WWTFs to sustain operations in case of a grid outage Some facilities stated that the ability to operate independently from the grid was a key driver for CHP Most of the facilities however said they are designed to shut down when the grid goes down to satisfy local utility requirements
bull The Rock River Reclamation Plant first installed a 2 MW reciprocating engine CHP system in midshy2004 In the spring of 2010 the facility expanded the CHP system to include three reciprocating engines with a total capacity of 3075 MW The main driver cited for the CHP system upgrade was the desire to fully meet the facilityrsquos electric demand on site allowing the facility to operate independently from the grid if needed The facility has a total electric demand of 22 MW and with the new CHP system the facility has plenty of excess capacity In addition to having the ability to operate independently from the grid the facilityrsquos excess capacity also enables it to take one engine off line at a time for maintenance while still maintaining the ability to fully meet the facilityrsquos electric demand
Facility Upgrades A portion of the facilities incorporated CHP as part of a scheduled facility equipment and process upgrade Some of these facilities operated CHP for a number of years and noted
bull In 1988 the Des Moines Metro Wastewater Reclamation Facility underwent a complete facility redesign which included installing anaerobic digesters and a 18 MW reciprocating engine CHP system In 1997 the facility started to experiment with taking industrial waste and fats oils and greases (FOG) to boost biogas production and
32
DriverBenefit Summary Examples that the scheduled facility upgrade allowed them to install a newer CHP system that would help simplify OampM increase system reliability and offer increased efficiencies
today approximately 70 percent of the biogas produced at the facility is derived from hauled waste The facility plans to take in additional hauled waste and is upgrading its anaerobic digesters to accommodate the increased load To take advantage of the resulting increased biogas production the facility plans to install four additional reciprocating engines two of which will be incorporated with the CHP system The other two will be used as standby power
Increased Biogas Production
Some facilities noted that they are taking on additional waste streams that will boost their biogas production and CHP was a natural fit to capitalize on the increased fuel availability Additional waste streams include wastes from other nearby treatment facilities additional industrial wastes or FOG
bull
bull
The Des Moines Metro Wastewater Reclamation Facility noted that it is upgrading its anaerobic digesters to handle additional hauled wastes and that expanding its existing CHP system will give the facility the ability to make efficient use of the increased biogas generation Little Rock Arkansas currently has a program in place for pretreatment of FOG to which participants must adhere The Fourche Creek Treatment Plant is interested in how it might adapt one of its existing digesters to handle FOG which is a possibility for future expansion The facility would consider CHP expansion to handle any increases in biogas generation
Enhanced Biosolid Once the decision was made to incorporate bull The Theresa Street Wastewater Treatment Facility described keeping raw sludge out of Management anaerobic digesters into the treatment process
all facilities recognized that utilizing the resulting biogas in a CHP system made sense Treating biosolids in anaerobic digesters reduces biosolid mass decreasing the burdens associated with drying biosolids on site andor shipping them to landfills while also producing biogas that can be used to generate power and heat on site
landfills through better biosolids management as a key driver for installing anaerobic digesters on site With the digesters in place CHP allowed the facility to generate clean power and heat with the resulting biogas
ldquoGreenrdquo PublicityPositive Public Relations
A couple of facilities noted that the ldquogreenrdquo attributes of CHP at WWTFs (ie increased efficiency and reduced emissions through the use of renewable biogas) and the myriad other benefits offered by CHP generated public interest and positive awareness for the facility Although not a driver for initial installation WWTFs see the positive response from the public as a benefit and a driver for continued operation
bull Both the Allentown Wastewater Treatment Plant and the Columbia Boulevard Wastewater Treatment Plant reported that their CHP systems were very well received by their communities and generated a lot of positive buzz
Utility Load Shedding Onshysite generation of power at WWTFs can help utilities that operate in constrained areas shed load rather than invest in new generation infrastructure or add additional burden to existing transmission and distribution systems
bull The Fairfield Water Pollution Control Authority noted that its CHP system not only helps the local utility avoid installing new capacity but also enables the facility to avoid the premium price paid for electricity during high demand periods The Fairfield facility is located in Southwestern Connecticut a highly constrained electric area
33
53 Challenges
Despite the benefits associated with CHP there are several key challenges to CHP development and operation regardless of sector or application These include regulated fees and tariffs interconnection issues environmental permitting and technical barriers All of the WWTFs interviewed noted these as challenges to CHP development and operation to some degree but also reported others specific to CHP operation at WWTFs including
bull Staff educationtraining with CHP
bull Gas pretreatment
bull Utility issues
bull Lack of adequate biosolid supply
bull Permitting issues
Although not discussed in detail by the interviewed WWTFs it should also be noted that obtaining the capital needed for a CHP system at a WWTF can pose a significant challenge for a WWTF and should not be overlooked There are also specific challenges associated with utilizing biogas beyond gas pretreatment A more detailed investigation of biogas utilization challenges is currently being undertaken by the Water Environment Research Foundation (WERF) in a report titled ldquoBarrier to Biogas Utilization Surveyrdquo (WERF Project Number OWSO11C10)
The interviewed WWTFs all successfully implemented CHP so all challenges encountered were overcome in various ways though they were not insignificant Table 19 presents the key challenges reported by the interviewed WWTFs along with relevant examples A key finding is that WWTFs need to recognize that CHP is a separate function beyond traditional wastewater treatment and therefore it is important to dedicate OampM staff time or contract with a third party to operate and maintain the CHP system
34
Table 19 Interview Results ndash Challenges
Challenge Summary Examples
Staff EducationTraining with CHP
Most facilities interviewed identified the training of staff in OampM of CHP and its components (eg gensets heat recovery gas pretreatment anaerobic digesters) as a key challenge to CHP implementation These facilities noted that onshysite energy production was a new experience for them and the process of transitioning from a wastewater treatmentshyonly facility to one that also produces onshysite power and heat was a hurdle for staff to overcome Some facilities however entered into OampM contracts with service providers so they did not have to take on the responsibility of traininghiring staff Some also required CHP equipment manufacturers to provide the requisite training
bull
bull
bull
bull
bull
The Rock River Water Reclamation Plant stated that it had to overcome the process of transitioning from a wastewater treatmentshyonly utility to one that also generated power and heat This process required the training of its staff which it did by hiring an engineering firm The CHP system requires at least a halfshytime employee equivalent which the facility absorbed into its existing staff Under the arrangement between Albert Lea Wastewater Treatment Plant and its local utility the local utility installed maintained and operated the CHP system for five years 2010 was the first year in which the facility operated and maintained the CHP system itself The facility noted that the five years of OampM provided by the local utility essentially constituted an extended training period for the facilityrsquos staff Under the Master Energy Savings agreement between the Allentown Wastewater Treatment Plant and its local utility the facility is paying the local utility a fee to maintain and operate the CHP system until 2014 The Des Moines Metro Wastewater Reclamation Facility noted that operating and maintaining its reciprocating engines has been a challenge The environment is noisy oily and physically demanding The facility described the importance of not only training its staff to maintain and operate the CHP system but also getting them to take ownership of the equipment The facility plans to expand its CHP system in the coming years and said that it plans to require the engine manufacturer to provide training The Columbia Boulevard Wastewater Treatment Plant purchased a maintenance contract from its engine manufacturer The bulk of the maintenance for the CHP system is supplied through this contract but the facility still relies on staff to help maintain the system The biggest challenge reported by the facility is sometimes inadequate response time under the maintenance contract
Gas Pretreatment Many facilities noted that understanding the importance of gas pretreatment and developing a gas pretreatment strategy was a key challenge Digester gas at WWTFs contains contaminants such as hydrogen sulfide siloxanes and excess moisture that can impair CHP equipment if not properly pretreated Gas pretreatment is more of a concern for some CHP prime movers than others (eg microturbines are more sensitive to contaminants than some reciprocating engines)
bull
bull
bull
bull
The Chippewa Falls Wastewater Treatment Plant reported biogas conditioning as the number one challenge to developing its microturbine CHP system Despite some early struggles and setbacks getting the conditioning system to work properly with the help of an experienced engineering consultant the facility no longer experiences any significant gas cleanup issues The Great Falls Wastewater Treatment Plant reported dealing with high hydrogen sulfide levels which leads to frequent replacement of its iron sponge and considerable maintenance costs The Town of Lewiston Water Pollution Control Center initially had much higher moisture levels than planned and had to incorporate better moisture removal equipment Allentown Wastewater Treatment Plantrsquos CHP system did not initially include a gas conditioning system which led to significant downtime Hydrogen sulfide and siloxanes in the digester gas damaged the compressors and microturbines The utility subsequently installed a gas conditioning system but noted that the facility still experiences a significant amount of downtime as a result of the lack of redundancy in
35
Challenge Summary Examples
the glycol chiller and digester gas compressor Utility Issues A number of facilities indicated that burdensome
interconnection requirements or high tariff and standby rates were significant challenges to developing CHP Some mentioned that their utility restricts sales of excess power to the grid impairing project economics However opportunities may exist for WWTFs to partner with their local utility to help move a CHP project forward
bull
bull
bull
bull
bull
bull
The Des Moines Metro Wastewater Reclamation Facility stated that working with the local utility on interconnection was a challenge It took the facility one to two years to negotiate an interconnection agreement creating great expense in terms of both money and staff time The Rock River Water Reclamation Plant reported that working with the local utility on interconnection was very difficult time consuming and expensive Of note the facility stated that the cost of interconnection represented 10 percent of the total cost associated with CHP implementation Fourche Creek Treatment Plant initially experienced problems with grid interruptions To remedy this the facility installed a fiber interlock between the plant and the electric substation that allows the facility to completely disconnect from the grid when there are interruptions This is mainly a safety feature that helps protect the CHP system equipment and helps to ensure smooth operation of the system The Columbia Boulevard Wastewater Treatment Plant experienced resistance from the local utility concerning selling power back to the utility under a contract The utility was not opposed to the facility operating CHP but it forced the facility to install reverse power relays to prevent any power export back to the grid The facility would have preferred the option of selling excess power The Theresa Street Wastewater Treatment Facility did not experience any problems working with the local utility on interconnection However although the facility is able to sell excess power it feels it does not receive enough credit for the power it supplies The facility buys power at 55 cents per kWh but receives only 25 cents per kWh for power sold back to the grid The Wildcat Hill Wastewater Treatment Plant ultimately partnered with the local utility to provide renewable energy credits (RECs) and motivate the utility to help move the project forward
Lack of Adequate Some WWTFs do not treat enough wastewater bull The Chippewa Falls Wastewater Treatment Plant was one of three facilities interviewed Biosolid Supply to generate sufficient biogas to make CHP
economically feasible In many cases this holds true for facilities with flow rates less than 5 MGD However smaller facilities can make CHP viable by hauling additional waste such as FOG or taking on industrial waste streams that are high in biological oxygen demand (BOD)39 Larger facilities can also expand their opportunities for CHP by increasing their biogas generation potential through processing of FOG or other industrial waste streams
with an influent flow rate less than 5 MGD Prior to installing a 60 kW microturbine CHP system the facility operated gasshypowered blowers with the biogas they produced and captured the waste heat off the blowers to help meet digester heat loads Although the facility only treats an average of 2 MGD approximately 50 percent of the BOD treated by the facility comes from a local brewer This enhanced BOD content allows the facility to generate enough biogas to power its CHP system
39 BOD is the amount of oxygen required by aerobic microorganisms to decompose the organic matter in a sample of water It is a common measure of the biosolid loading in wastewater treatment streams and an indicator of biogas generation potential
36
Challenge Summary Examples
Permitting Issues A couple of facilities noted that obtaining the correct permits for their CHP system was burdensome and timeshyconsuming Installing onshysite energy production requires facilities to obtain the necessary permits which can be a new challenge for WWTFs especially if a Title V Clean Air Act (CAA) permit is needed
bull
bull
The Bergen County Utilities Authority reported that its CHP system required careful negotiation of changes to their existing Title V CAA permit The Des Moines Metro Wastewater Reclamation Facility reported that the installation of its reciprocating engine CHP system required the facility to obtain a Title V CAA permit The process of obtaining a Title V permit was somewhat unfamiliar to the facility and it is still learning about all of the issues involved
37
54 Operational Insights and Observations
Based on the benefits achieved and challenges encountered several common operational insights became apparent at the conclusion of the interviews These insights were considered by all WWTFs as important to any facility considering CHP Table 20 presents the key CHP operational insights gathered from WWTFs across the following topic areas organizational acceptance utility relationship system design and OampM
In general the insights show that CHP is an added element to a WWTF beyond traditional treatment of wastewater and that it requires appropriate planning and attention To this end high-level buy-in from facility management is very important to project success In addition WWTFs need to be closely involved with the design of the CHP system including all of its components (eg fuel pretreatment) and understand how the system operates and its maintenance requirements
Coordination with the local utility was also seen as extremely important for developing and operating a successful CHP system From the beginning immediate and continuing coordination with the utility is needed to ensure that all components of the CHP system are in line with utility requirements This process often requires close negotiations over topics such as interconnection sale of excess power and potential changes in utility rates Several of the WWTFs encountered utilities unwilling to buy excess power or allow operation independent of the grid These restrictions eliminated a potential source of revenue and also one of the primary benefits of CHP enhanced reliability of the WWTFrsquos power supply
38
Table 20 Interview Results ndash Operational Insights
Topic Key Insights
Organizational
Highshylevel buyshyin for CHP can greatly facilitate project approval A CHP champion is needed to get the project off the ground and for continual successful operation
Acceptance Aligning the project with community goals for renewable energyenergy efficiency can serve as a great justification for the project
Utility Relationship
Immediate and continuing coordination with the local utility is highly recommended Issues such as interconnection sales of excess power and potential changes in utility rates all require close communication with the local utility and can require significant time to resolve
Identifying opportunities for collaboration or partnership with the local utility can be highly beneficial (eg master energy savings agreement sale of RECs other ownershipOampM agreements)
CHP projects require due diligence from design through OampM It is important for facilities to ensure that any consultants or project developers hired are fully versed in all aspects of design installation and OampM of CHP systems at WWTFs WWTFs want to avoid ldquoproblem fatiguerdquo that can arise from a poorly designed system and can lead to system shutdown
WWTFs should ensure that the fuel treatment and compression systems have been designed to satisfy the CHP manufacturer specifications A rigorous gas pretreatment approach is needed for certain applicationsmdashthorough gas analysis and possible gas treatment may be required
System Design In some cases blending digester gas with natural gas may help maintain desired heat content and composition
WWTFs should familiarize themselves with CHP equipment and processes and see what fits best with their plant and staff experience A comprehensive review of leading facilities that operate CHP is a good idea
WWTFs should consider outside waste streams and sludge preshytreatment to improve quantity and quality of digester biogas but also consider the facility requirements to receive and process these wastes during the design process
Specific training for OampM personnel is important for successful operation of a CHP system Having staff that is well trained regarding mechanical and electrical equipment is extremely beneficial WWTFs should ensure that agreements with CHP developers or suppliers include proper OampM training
Operations and Maintenance
WWTFs need to recognize that CHP is a separate function beyond traditional wastewater treatment and should dedicate OampM staff time or contract with a third party to operate and maintain the CHP system It takes more effort for a WWTF to operate CHP in addition to typical wastewater treatment operations
WWTFs should institute a preventive maintenance schedule instead of reactive maintenance
WWTFs need to be aware of the maintenance issues related to fuel treatment including siloxane deposits on CHP equipment Improper maintenance will lead to more frequent maintenance intervals
A comprehensive designbuildoperationmaintenance agreement can greatly simplify the process of installing and operating CHP for WWTFs Even if the maintenance agreement expires after a certain number of years a facility can gain valuable training experience over that time
39
Appendix A Data Sources Used in the Analysis
To develop an overview of the wastewater treatment sector and the potential for CHP the CHPP used publicly available information contained in the 2008 CWNS Databases40 the Combined Heat and Power Installation Database41 EPArsquos 2010 eGRID42 and US Energy Information Administration (EIA) electricity and natural gas prices43 The CHPP also conducted WWTF interviews and performed independent research The following describes each type of data used in the CHPPrsquos analysis
2008 Clean Watersheds Needs Survey EPArsquos Office of Wastewater Management in partnership with states territories and the District of Columbia conducts the CWNS every four years in response to Sections 205(a) and 516 of the Clean Water Act and develops a Report to Congress The CWNS is a comprehensive assessment of the capital needs to meet the water quality goals set in the Clean Water Act Every four years the states and EPA collect information about
bull Publicly owned wastewater collection and treatment facilities bull Stormwater and combined sewer overflow (CSO) control facilities bull Nonpoint source (NPS) pollution control projects bull Decentralized wastewater management
Information collected about these facilities and projects includes
bull Estimated needs to address water quality or water quality-related public health problems bull Location and contact information for facilities and projects bull Facility populations served and flow effluent and unit process information bull NPS best management practices
CHP Installation Database The CHP Installation Database is maintained by ICF with support from the US Department of Energy and Oak Ridge National Laboratory The database lists all CHP systems in operation in the United States Information is gathered in real time and originates from industry literature manufacturer contacts and regional CHP centers The database is continually updated
2010 eGRID eGRID is a comprehensive source of data on the environmental characteristics of almost all electric power generated in the United States These environmental characteristics include air emissions for nitrogen oxides sulfur dioxide carbon dioxide methane and nitrous oxide emission rates net generation resource mix and many other attributes
40 The 2008 CWNS is available through EPArsquos Office of Wastewater Management and can be accessed at httpwaterepagovscitechdataitdatabasescwnsindexcfm 41 The CHP Installation Database is available at httpwwweea-inccomchpdataindexhtml 42 eGRID is available at httpwwwepagovcleanenergyenergy-resourcesegridindexhtml 43 Average industrial electricity prices taken from Energy Information Administration (EIA) ldquoMonthly Electric Sales and Revenue Report with State Distributions Reportrdquo year to date through December 2010 Natural gas price data can be found at httpwwweiagovdnavngng_pri_sum_dcu_nus_mhtm
40
US EIA Electricity and Natural Gas Prices Electric Power Monthly is a report prepared by the EIA that summarizes the average price paid by industrial customers purchasing electricity on a state-by-state basis WWTFs are treated as industrial customers because they are fairly large electricity consumers and they consume power throughout the day and night as do other industrial facilities Data are collected from a multitude of EIA forms as well as from other federal sources
Wastewater Treatment Facility Interviews The CHPP attempted to contact 30 WWTFs that have operational CHP systems and ultimately spoke with 14 facilities The WWTFs chosen for contact and those ultimately interviewed represent operational geographical and technological diversity Information obtained from interviews included operational insights and addressed drivers and benefits of CHP barriers and challenges encountered and lessons learned
Independent Research The CHPP also conducted independent research which included reviewing reports studies and case studies of WWTFs that employ CHP and utilizing the extensive CHP resources and contacts available to the CHPP
41
Appendix B Anaerobic Digester Design Criteria Used for Technical Potential Analysis
The following anaerobic digester design criteria were used to estimate the total wastewater influent flow rate that a typically sized digester can treat as well as the biogas generation rate and the heat load of a typically sized digester All criteria are based on a typically sized mesophilic digester
System Design Parameter Value Reactor Type1 Complete Mix Reactor Shape1 Circular Organic Load2 (lbsday VS) 13730 Percent Solids in Flow2 ( ww) 8 Sludge Density2 (lbsgal) 85 Flow to Reactor (lbsday) 171625 Flow to Reactor (galday) 20191 Flow to Reactor (ft3day) 2699 Reactor Depth3 (ft) 20 Design Load1 (lbs VSft3day) 025 Total Reactor Volume (ft3) 54920 Reactor Area (ft) 2746 Reactor Diameter1 (ft) 60 Retention Time (days) 20 Influent Temp ndash Winter (degF) 40 Air Temp ndash Winter (degF) 40 Earth Around Wall Temp ndash Winter (degF) 40 Earth Below Floor Temp ndash Winter (degF) 40 Reactor Temp (degF) 98 Influent Temp ndash Summer (degF) 78 Air Temp shy Summer (degF) 78 Earth Around Wall Temp ndash Summer (degF) 47 Earth Below Floor Temp ndash Summer (degF) 47 Sp Heat Sludge1 (BtulbdegF) 10 Area Walls (ft2) 37699 Area Roof (ft2) 28274 Area Floor (ft2) 28274 U Walls ndash Concrete1 (Btuhrft2degF) 012 U Roof ndash Concrete1 (Btuhrft2degF) 028 U Floor ndash Concrete1 (Btuhrft2degF) 030 Gas Generation1 (ft3lb VS) 12 Gas Heat Content1 (Btuft3) (HHV) 650 VS Removal Percent at 20 days2 () 55 VS Removed (lbsday) 7552 Gas Generation (ft3day) 90618 Heat Potential of Gas (Btuday) 58901700 Gas Generation per Capita1 (ft3dayperson) 1 Population Served by POTW (persons) 90618 Flow per Capita3 (galdayperson) 100
Total POTW Flow (MGD) 91 Sources 1 Metcalf and Eddy ldquoWastewater Engineering and Design 4th Editionrdquo 2003 2 Eckenfelder ldquoPrincipals of Water Quality Managementrdquo 1980 3 Great LakesshyUpper Mississippi Board of State and Provincial Public Health and Environmental Managers ldquoRecommended Standards for Wastewater Facilities (TenshyState Standards)rdquo 2004
42
Appendix C Space Heating Capability of CHP at Wastewater Treatment Facilities
As discussed in Section 422 the analysis estimated the space heating capability of CHP at WWTFs demonstrating that after digester loads are met there is little CHP recovered heat available for space heating in most climates Based on the results shown in Figure 2 and Table 9 (both in Section 422) the analysis estimated the amount of heat available for space heating after digester heating is met By subtracting the average values for digester heating requirements (see Table 9) from the thermal output of representative CHP systems the amount of heat available for space heating was estimated for three different sizes of WWTFs (ie 3 16 and 40 MGD) for each of the five climate zones The CHP systems chosen represent typical prime mover types and sizes used at WWTFs and the WWTF sizes are representative of the range of facility sizes that are applying CHP The following table presents the results
Estimated Space Heating Capability for CHP Units in Different Climate Zones
Thermal OutputLoad (MMBtuday)
Climate Zone WWTF Plant Size (MGD)
Representative CHP System
Estimated CHP Thermal Output
Average Digester Load
Surplus Thermal Output for Space
Heating
1 ndash Cold
3 65 kW Microturbine 59 84 00
16 400 kW Engine 384 448 00
40 1 MW Engine 816 1120 00
2 ndash Cold Moderate
3 65 kW Microturbine 59 75 00
16 400 kW Engine 384 400 40
40 1 MW Engine 816 1000 00
3 ndash Moderate Mixed
3 65 kW Microturbine 59 69 00
16 400 kW Engine 384 368 16
40 1 MW Engine 816 920 00
4 ndash WarmHot
3 65 kW Microturbine 59 60 00
16 400 kW Engine 384 320 64
40 1 MW Engine 816 800 16
5 ndash Hot
3 65 kW Microturbine 59 54 05
16 400 kW Engine 384 288 96
40 1 MW Engine 816 720 96
The data in the table above reveal that a substantial amount of surplus heat for space heating is available only in warm and hot climates where demand for space heating is minimal (except in cold winter months) In cold climates where more energy is required to heat the digester surplus thermal energy for space heating is generally not available
CHP provides for much higher gas utilization than if the digester were heated directly with boilers since the use of digester gas is much higher in the summer months when heating loads are minimal Gas utilization by baseloaded CHP systems is fairly constant throughout the year other than during periods of maintenance whereas gas utilization for boilers drops significantly during summer periods when some digester heating may be needed but little or no space heating
43
is needed A WWTF in North Carolina44 indicated that 63 to 66 percent of available digester gas can be beneficially used with CHP whereas use of digester gas-fueled boilers would consume only 33 to 38 percent of the gas with the balance either stack losses or flared gas This experience is consistent with the interviews of WWTFs conducted for this report in which a number of facilities indicated that using CHP results in more beneficial use of the digester gas For example the Town of Lewiston NY indicated that prior to implementing CHP its boiler used only 40 to 50 percent of the gas whereas with the CHP system gas utilization reached 98 percent Future trends45 also indicate that more facilities are likely to build gas storage into their digester system which should result in improved gas utilization Storing digester gas during periods of low demand and drawing from storage when demand for heat is high minimizes the need for gas flaring For many WWTFs improving gas utilization while at the same time eliminating or minimizing flaring is a key driver for implementing CHP
44 Fishman Bullard Vogt and Lundin ldquoBeneficial Use of Digester Gas ndash Seasonal and Lifecycle Cost Considerationsrdquo 2009 45 Based on a number of recent installations and feasibility studies that included gas storage (City of Riverside CA Cape Fear NC Ithaca NY Rochester NY and Gloversville-Johnstown NY)
44
Appendix D Cost-to-Generate Estimates by State
To estimate the cost to generate for CHP at WWTFs the analysis considered three digester gas utilization cases for each WWTF greater than 1 MGD that operates anaerobic digesters
bull Case 1 Assumes digester gas is used for both digester heating and space heating prior to CHP implementation
bull Case 2 Assumes digester gas is used for digester heating only prior to CHP implementation and natural gas is used for space heating
bull Case 3 Assumes digester gas is not used for heating and natural gas is used for digester and space heating prior to CHP implementation
45
Cost to Generate Electricity with Digester Gas (Case 1 ndash No Thermal Credit)
State
Average
Industrial
Electricity
Price 1
(centskWh)
Average
Industrial
Natural Gas
Price 2
($1000 scf)
Cost to Generate (centskWh)
Small Rich-
Burn Engine
(1-5 MGD)
Microturbine
(1-10 MGD)
Rich-Burn
Engine
(5-15 MGD)
Fuel Cell
(10-80 MGD)
Small Lean-
Burn Engine
(12-40 MGD)
Lean-Burn
Engine
(40-160 MGD)
Combustion
Turbine
(gt160 MGD)
Alaska 141 42 73 64 60 83 51 40 32
Alabama 61 64 73 64 60 83 51 40 32
Arkansas 54 76 73 64 60 83 51 40 32
Arizona 67 82 73 64 60 83 51 40 32
California 109 70 73 64 60 83 51 40 32
Colorado 69 58 73 64 60 83 51 40 32
Connecticut 144 96 73 64 60 83 51 40 32
Delaware 96 140 73 64 60 83 51 40 32
Florida 89 94 73 64 60 83 51 40 32
Georgia 62 67 73 64 60 83 51 40 32
Hawaii 219 242 73 64 60 83 51 40 32
Iowa 54 61 73 64 60 83 51 40 32
Idaho 51 64 73 64 60 83 51 40 32
Illinois 67 73 73 64 60 83 51 40 32
Indiana 60 55 73 64 60 83 51 40 32
Kansas 62 53 73 64 60 83 51 40 32
Kentucky 51 53 73 64 60 83 51 40 32
Louisiana 58 46 73 64 60 83 51 40 32
Massachusetts 132 121 73 64 60 83 51 40 32
Maryland 95 86 73 64 60 83 51 40 32
Maine 88 91 73 64 60 83 51 40 32
Michigan 72 92 73 64 60 83 51 40 32
Minnesota 63 57 73 64 60 83 51 40 32
Missouri 55 96 73 64 60 83 51 40 32
Mississ ippi 64 59 73 64 60 83 51 40 32
Montana 56 91 73 64 60 83 51 40 32
North Carolina 61 81 73 64 60 83 51 40 32
North Dakota 57 52 73 64 60 83 51 40 32
Nebraska 59 57 73 64 60 83 51 40 32
New Hampshire 128 121 73 64 60 83 51 40 32
New Jersey 116 97 73 64 60 83 51 40 32
New Mexico 60 60 73 64 60 83 51 40 32
Nevada 74 105 73 64 60 83 51 40 32
New York 97 95 73 64 60 83 51 40 32
Ohio 63 89 73 64 60 83 51 40 32
Oklahoma 52 126 73 64 60 83 51 40 32
Oregon 55 73 73 64 60 83 51 40 32
Pennsylvania 76 102 73 64 60 83 51 40 32
Rhode Island 128 126 73 64 60 83 51 40 32
South Carolina 57 61 73 64 60 83 51 40 32
South Dakota 59 59 73 64 60 83 51 40 32
Tennessee 67 62 73 64 60 83 51 40 32
Texas 63 46 73 64 60 83 51 40 32
Utah 49 55 73 64 60 83 51 40 32
Virginia 67 71 73 64 60 83 51 40 32
Vermont 95 66 73 64 60 83 51 40 32
Washington 40 94 73 64 60 83 51 40 32
Wisconsin 68 76 73 64 60 83 51 40 32
West Virginia 59 54 73 64 60 83 51 40 32
Wyoming 50 54 73 64 60 83 51 40 32
Average industrial electricity prices taken from Energy Information Administration (EIA) ldquoMonthly Electric Sales and Revenue Report with State Distributions Reportrdquo year to date through December 2010
Average industrial natural gas prices taken from EIA available at httpwwweiagovdnavngng_pri_sum_dcu_nus_mhtm
46
Net Cost to Generate Electricity with Digester Gas (Case 2 ndash Thermal Credit for Space Heating)
State
Average
Industrial
Electricity
Price 1
(centskWh)
Average
Industrial
Natural Gas
Price 2
($1000 scf)
Cost to Generate (centskWh)
Small Rich-
Burn Engine
(1-5 MGD)
Microturbine
(1-10 MGD)
Rich-Burn
Engine
(5-15 MGD)
Fuel Cell
(10-80 MGD)
Small Lean-
Burn Engine
(12-40 MGD)
Lean-Burn
Engine
(40-160 MGD)
Combustion
Turbine
(gt160 MGD)
Alaska 141 42 73 64 60 83 51 40 32
Alabama 61 64 71 64 58 83 51 40 32
Arkansas 54 76 72 64 58 83 51 40 32
Arizona 67 82 72 64 58 83 51 40 32
California 109 70 72 64 58 83 51 40 32
Colorado 69 58 73 64 59 83 51 40 32
Connecticut 144 96 73 64 60 83 51 40 32
Delaware 96 140 73 64 59 83 51 40 32
Florida 89 94 70 64 57 83 51 40 32
Georgia 62 67 70 64 56 83 50 40 32
Hawaii 219 242 68 64 53 83 51 40 32
Iowa 54 61 73 64 60 83 51 40 32
Idaho 51 64 73 64 60 83 51 40 32
Illinois 67 73 73 64 60 83 51 40 32
Indiana 60 55 73 64 60 83 51 40 32
Kansas 62 53 73 64 60 83 51 40 32
Kentucky 51 53 73 64 60 83 51 40 32
Louisiana 58 46 72 64 58 83 51 40 32
Massachusetts 132 121 73 64 60 83 51 40 32
Maryland 95 86 73 64 59 83 51 40 32
Maine 88 91 73 64 60 83 51 40 32
Michigan 72 92 73 64 60 83 51 40 32
Minnesota 63 57 73 64 60 83 51 40 32
Missouri 55 96 73 64 59 83 51 40 32
Mississ ippi 64 59 71 64 58 83 51 40 32
Montana 56 91 73 64 60 83 51 40 32
North Carolina 61 81 72 64 58 83 51 40 32
North Dakota 57 52 73 64 60 83 51 40 32
Nebraska 59 57 73 64 60 83 51 40 32
New Hampshire 128 121 73 64 60 83 51 40 32
New Jersey 116 97 73 64 60 83 51 40 32
New Mexico 60 60 72 64 59 83 51 40 32
Nevada 74 105 73 64 60 83 51 40 32
New York 97 95 73 64 60 83 51 40 32
Ohio 63 89 73 64 60 83 51 40 32
Oklahoma 52 126 72 64 58 83 51 40 32
Oregon 55 73 73 64 59 83 51 40 32
Pennsylvania 76 102 73 64 60 83 51 40 32
Rhode Island 128 126 73 64 60 83 51 40 32
South Carolina 57 61 72 64 58 83 51 40 32
South Dakota 59 59 73 64 60 83 51 40 32
Tennessee 67 62 72 64 58 83 51 40 32
Texas 63 46 72 64 58 83 51 40 32
Utah 49 55 73 64 60 83 51 40 32
Virginia 67 71 73 64 59 83 51 40 32
Vermont 95 66 73 64 60 83 51 40 32
Washington 40 94 73 64 60 83 51 40 32
Wisconsin 68 76 73 64 60 83 51 40 32
West Virginia 59 54 73 64 60 83 51 40 32
Wyoming 50 54 73 64 60 83 51 40 32
Includes thermal credit as described in Section 423
Average industrial electricity prices taken from Energy Information Administration (EIA) ldquoMonthly Electric Sales and Revenue Report with State Distributions Reportrdquo year to date through December 2010
Average industrial natural gas prices taken from EIA available at httpwwweiagovdnavngng_pri_sum_dcu_nus_mhtm
47
Net Cost to Generate Electricity with Digester Gas (Case 3 ndash Full Thermal Credit)
State
Average
Industrial
Electricity
Price 1
(centskWh)
Average
Industrial
Natural Gas
Price 2
($1000 scf)
Cost to Generate (centskWh)
Small Rich-
Burn Engine
(1-5 MGD)
Microturbine
(1-10 MGD)
Rich-Burn
Engine
(5-15 MGD)
Fuel Cell
(10-80 MGD)
Small Lean-
Burn Engine
(12-40 MGD)
Lean-Burn
Engine
(40-160 MGD)
Combustion
Turbine
(gt160 MGD)
Alaska 141 42 50 48 40 72 35 26 16
Alabama 61 64 49 42 39 66 32 21 13
Arkansas 54 76 39 31 30 60 23 12 04
Arizona 67 82 40 33 31 61 24 13 05
California 109 70 47 39 37 65 29 18 10
Colorado 69 58 40 35 31 63 23 15 04
Connecticut 144 96 32 31 25 60 17 11 00
Delaware 96 140 19 16 12 50 04 00 00
Florida 89 94 40 33 30 59 25 14 06
Georgia 62 67 48 42 37 64 31 21 12
Hawaii 219 242 02 00 00 32 00 00 00
Iowa 54 61 44 41 35 67 27 20 09
Idaho 51 64 35 37 27 64 23 16 05
Illinois 67 73 38 36 30 63 22 15 04
Indiana 60 55 43 40 34 66 26 19 08
Kansas 62 53 54 48 44 72 35 26 16
Kentucky 51 53 48 42 38 68 29 21 10
Louisiana 58 46 57 49 45 71 38 27 19
Massachusetts 132 121 00 01 00 39 00 00 00
Maryland 95 86 26 22 18 54 10 04 00
Maine 88 91 05 15 01 49 00 00 00
Michigan 72 92 21 26 15 57 12 07 00
Minnesota 63 57 42 42 33 68 28 21 10
Missouri 55 96 31 27 23 57 15 08 00
Mississippi 64 59 49 42 39 66 32 21 13
Montana 56 91 24 29 18 59 15 09 00
North Carolina 61 81 40 32 30 61 23 12 04
North Dakota 57 52 45 44 36 69 30 22 12
Nebraska 59 57 44 41 35 67 27 20 09
New Hampshire 128 121 00 03 00 40 00 00 00
New Jersey 116 97 30 29 23 59 16 10 00
New Mexico 60 60 53 44 42 69 34 23 15
Nevada 74 105 19 20 13 53 06 02 00
New York 97 95 15 22 10 54 08 03 00
Ohio 63 89 26 25 19 56 11 06 00
Oklahoma 52 126 35 28 26 58 20 09 01
Oregon 55 73 37 32 28 61 20 12 01
Pennsylvania 76 102 19 20 13 53 06 02 00
Rhode Island 128 126 13 15 08 49 01 00 00
South Carolina 57 61 47 39 37 66 29 18 10
South Dakota 59 59 41 41 32 67 27 20 09
Tennessee 67 62 43 35 33 63 26 15 07
Texas 63 46 54 46 43 69 36 25 17
Utah 49 55 45 41 35 67 27 20 09
Virginia 67 71 43 37 33 65 25 17 06
Vermont 95 66 35 37 27 64 23 16 05
Washington 40 94 31 30 23 59 16 10 00
Wisconsin 68 76 31 34 24 62 20 14 02
West Virginia 59 54 47 41 37 67 28 20 09
Wyoming 50 54 47 45 38 70 32 24 13
Includes thermal credit as described in Section 423
Average industrial electricity prices taken from Energy Information Administration (EIA) ldquoMonthly Electric Sales and Revenue Report with State Distributions Reportrdquo year to date through December 2010
Average industrial natural gas prices taken from EIA available at httpwwweiagovdnavngng_pri_sum_dcu_nus_mhtm
48
Appendix E Additional Reference Resources
EPA Combined Heat and Power Partnership (CHPP)
The CHPP is a voluntary program that seeks to reduce the environmental impact of power generation by promoting the use of CHP The CHPP works closely with energy users the CHP industry state and local governments and other stakeholders to support the development of new projects and promote their energy environmental and economic benefits
Website wwwepagovchp
The CHPP offers a number of tools and resources that can help a WWTF implement a CHP system These include
bull Description of the CHP project development process including information on key questions for each stage of the process along with specific tools and resources Website wwwepagovchpproject-developmentindexhtml
bull The CHP funding database with bi-weekly updates of new state and federal incentive opportunities Website wwwepagovchpfundingfundinghtml
bull The CHP Catalog of Technologies which describes performance and cost characteristics of CHP technologies Website wwwepagovchpbasiccataloghtml
bull The Biomass CHP Catalog of Technologies which provides detailed technology characterization of biomass CHP systems Website wwwepagovchpbasiccataloghtml
Reports
The following reports about CHP at WWTFs are available for download
Brown amp Caldwell ldquoEvaluation of Combined Heat and Power Technologies for Wastewater Treatment Facilitiesrdquo December 2010 Available at httpwaterepagovscitechwastetechpublicationscfm
Association of State Energy Research amp Technology Transfer Institutions ldquoStrategic CHP Deployment Assistance for Wastewater Treatment Facilitiesrdquo October 2009 Available at httpwwwaserttiorgwastewaterindexhtml
California Energy Commission ldquoCombined Heat and Power Potential at Californiarsquos Wastewater Treatment Plantsrdquo September 2009 Available at httpwwwenergycagov2009publicationsCEC-200-2009-014CEC-200-2009-014-SFPDF
49
Organizations
The following organizations work closely with the wastewater treatment industry and offer a wealth of knowledge concerning wastewater treatment and the use of anaerobic digestion
EPA Office of Wastewater Management (OWM) ndash The OWM oversees a range of programs contributing to the well-being of the nationrsquos waters and watersheds Website wwwepagovowm
National Association of Clean Water Agencies (NACWA) ndash NACWA represents the interests of more than 300 public agencies and organizations NACWA members serve the majority of the sewered population in the United States and collectively treat and reclaim more than 18 billion gallons of wastewater daily Website wwwnacwaorg
Water Environment Federation (WEF) ndash Founded in 1928 the WEF is a not-for-profit technical and educational organization with members from varied disciplines who work toward the organizationrsquos vision of preserving and enhancing the global water environment Website wwwweforgHome
Water Environment Research Foundation (WERF) ndash WERF helps improve the water environment and protect human health by providing sound reliable science and innovative effective cost-saving technologies for improved management of water resources Website wwwwerforg
Air and Waste Management Association (AampWMA) ndash AampWMA is a not-for-profit non-partisan professional organization that provides training information and networking opportunities to thousands of environmental professionals in 65 countries Website wwwawmaorg
Other
Database of State Incentives for Renewables and Efficiency (DSIRE) ndash DSIRE is a comprehensive source of information on federal state local and utility incentives and policies that promote renewable energy and energy efficiency Website httpwwwdsireusaorg
United States Environmental Protection Agency Office of Air and Radiation (6202J) 430R11018 October 2011 wwwepagovchp
50
- Opportunities for Combined Heat and Power at Wastewater Treatment Facilities Market Analysis and Lessons from the Field
- Acknowledgements
- Table of Contents
- List of Tables
- List of Figures
- EXECUTIVE SUMMARY
-
- Purpose of Report
- Key Findings
-
- 10 Introduction
- 20 CHP and Its Benefits at Wastewater Treatment Facilities
- 30 The Market
-
- 31 Wastewater Treatment Facilities with CHP
- 32 Potential CHP Market
-
- 40 Technical and Economic Potential
-
- 41 Technical Potential for CHP at Wastewater Treatment Facilities
-
- 411 Methodology
- 412 Electric and Thermal Generation Potential from CHP Systems at Wastewater Treatment Facilities
- 413 National Electric Generation Potential from CHP at Wastewater Treatment Facilities
- 414 Potential Carbon Dioxide Emissions Benefits
-
- 42 Economic Potential for CHP at Wastewater Treatment Facilities
-
- 421 Methodology
- 422 Heating Requirements of Wastewater Treatment Facilities
- 423 Estimated Cost to Generate Electricity
- 424 National Economic Potential Scenarios
-
- 50 Wastewater Treatment Facility Interviews CHP Benefits Challenges and Operational Insights
-
- 51 Wastewater Treatment Facilities Interviewed and Interview Format
- 52 Drivers and Benefits
- 53 Challenges
- 54 Operational Insights and Observations
-
- Appendix A Data Sources Used in the Analysis
- Appendix B Anaerobic Digester Design Criteria Used for Technical Potential Analysis
- Appendix C Space Heating Capability of CHP at Wastewater Treatment Facilities
- Appendix D Cost-to-Generate Estimates by State
- Appendix E Additional Reference Resources
-
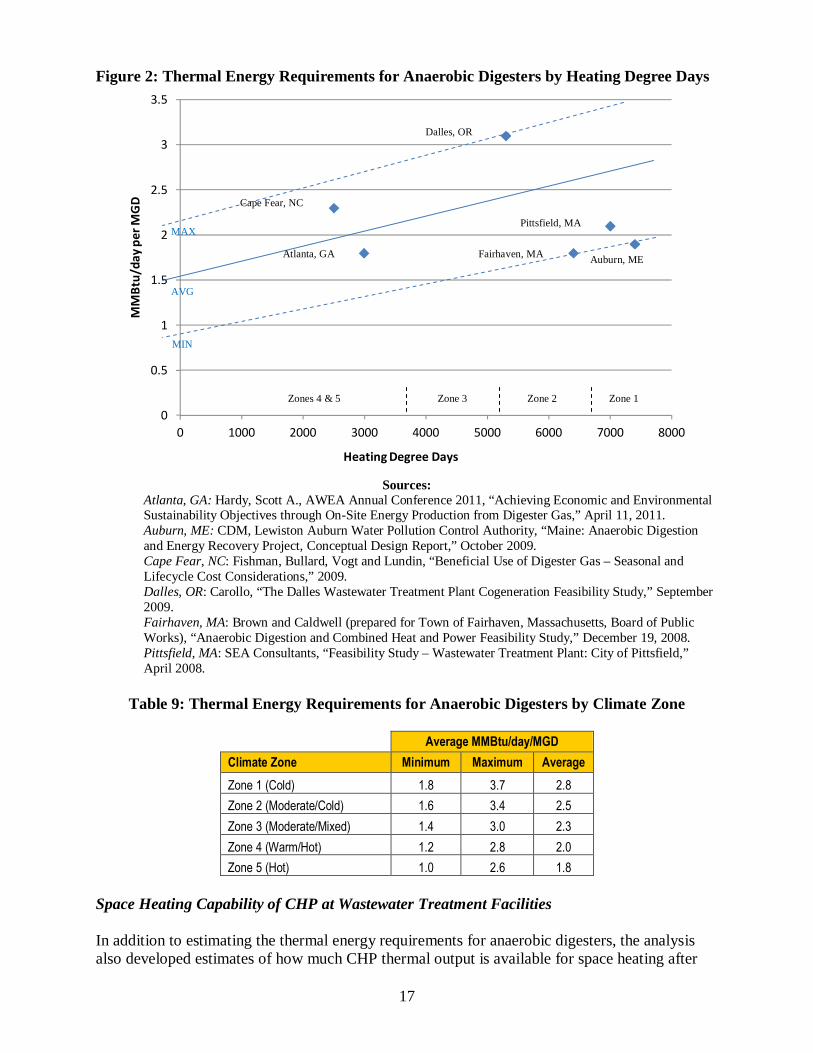
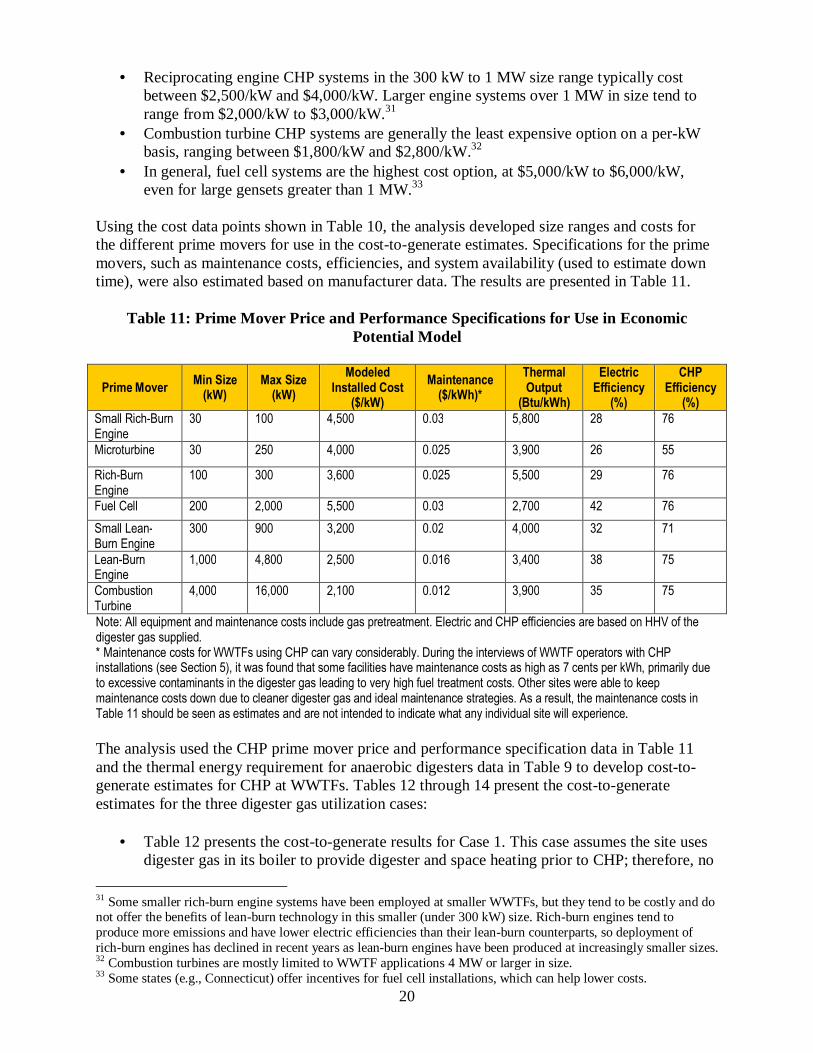

Challenge Summary Examples
Permitting Issues A couple of facilities noted that obtaining the correct permits for their CHP system was burdensome and timeshyconsuming Installing onshysite energy production requires facilities to obtain the necessary permits which can be a new challenge for WWTFs especially if a Title V Clean Air Act (CAA) permit is needed
bull
bull
The Bergen County Utilities Authority reported that its CHP system required careful negotiation of changes to their existing Title V CAA permit The Des Moines Metro Wastewater Reclamation Facility reported that the installation of its reciprocating engine CHP system required the facility to obtain a Title V CAA permit The process of obtaining a Title V permit was somewhat unfamiliar to the facility and it is still learning about all of the issues involved
37
54 Operational Insights and Observations
Based on the benefits achieved and challenges encountered several common operational insights became apparent at the conclusion of the interviews These insights were considered by all WWTFs as important to any facility considering CHP Table 20 presents the key CHP operational insights gathered from WWTFs across the following topic areas organizational acceptance utility relationship system design and OampM
In general the insights show that CHP is an added element to a WWTF beyond traditional treatment of wastewater and that it requires appropriate planning and attention To this end high-level buy-in from facility management is very important to project success In addition WWTFs need to be closely involved with the design of the CHP system including all of its components (eg fuel pretreatment) and understand how the system operates and its maintenance requirements
Coordination with the local utility was also seen as extremely important for developing and operating a successful CHP system From the beginning immediate and continuing coordination with the utility is needed to ensure that all components of the CHP system are in line with utility requirements This process often requires close negotiations over topics such as interconnection sale of excess power and potential changes in utility rates Several of the WWTFs encountered utilities unwilling to buy excess power or allow operation independent of the grid These restrictions eliminated a potential source of revenue and also one of the primary benefits of CHP enhanced reliability of the WWTFrsquos power supply
38
Table 20 Interview Results ndash Operational Insights
Topic Key Insights
Organizational
Highshylevel buyshyin for CHP can greatly facilitate project approval A CHP champion is needed to get the project off the ground and for continual successful operation
Acceptance Aligning the project with community goals for renewable energyenergy efficiency can serve as a great justification for the project
Utility Relationship
Immediate and continuing coordination with the local utility is highly recommended Issues such as interconnection sales of excess power and potential changes in utility rates all require close communication with the local utility and can require significant time to resolve
Identifying opportunities for collaboration or partnership with the local utility can be highly beneficial (eg master energy savings agreement sale of RECs other ownershipOampM agreements)
CHP projects require due diligence from design through OampM It is important for facilities to ensure that any consultants or project developers hired are fully versed in all aspects of design installation and OampM of CHP systems at WWTFs WWTFs want to avoid ldquoproblem fatiguerdquo that can arise from a poorly designed system and can lead to system shutdown
WWTFs should ensure that the fuel treatment and compression systems have been designed to satisfy the CHP manufacturer specifications A rigorous gas pretreatment approach is needed for certain applicationsmdashthorough gas analysis and possible gas treatment may be required
System Design In some cases blending digester gas with natural gas may help maintain desired heat content and composition
WWTFs should familiarize themselves with CHP equipment and processes and see what fits best with their plant and staff experience A comprehensive review of leading facilities that operate CHP is a good idea
WWTFs should consider outside waste streams and sludge preshytreatment to improve quantity and quality of digester biogas but also consider the facility requirements to receive and process these wastes during the design process
Specific training for OampM personnel is important for successful operation of a CHP system Having staff that is well trained regarding mechanical and electrical equipment is extremely beneficial WWTFs should ensure that agreements with CHP developers or suppliers include proper OampM training
Operations and Maintenance
WWTFs need to recognize that CHP is a separate function beyond traditional wastewater treatment and should dedicate OampM staff time or contract with a third party to operate and maintain the CHP system It takes more effort for a WWTF to operate CHP in addition to typical wastewater treatment operations
WWTFs should institute a preventive maintenance schedule instead of reactive maintenance
WWTFs need to be aware of the maintenance issues related to fuel treatment including siloxane deposits on CHP equipment Improper maintenance will lead to more frequent maintenance intervals
A comprehensive designbuildoperationmaintenance agreement can greatly simplify the process of installing and operating CHP for WWTFs Even if the maintenance agreement expires after a certain number of years a facility can gain valuable training experience over that time
39
Appendix A Data Sources Used in the Analysis
To develop an overview of the wastewater treatment sector and the potential for CHP the CHPP used publicly available information contained in the 2008 CWNS Databases40 the Combined Heat and Power Installation Database41 EPArsquos 2010 eGRID42 and US Energy Information Administration (EIA) electricity and natural gas prices43 The CHPP also conducted WWTF interviews and performed independent research The following describes each type of data used in the CHPPrsquos analysis
2008 Clean Watersheds Needs Survey EPArsquos Office of Wastewater Management in partnership with states territories and the District of Columbia conducts the CWNS every four years in response to Sections 205(a) and 516 of the Clean Water Act and develops a Report to Congress The CWNS is a comprehensive assessment of the capital needs to meet the water quality goals set in the Clean Water Act Every four years the states and EPA collect information about
bull Publicly owned wastewater collection and treatment facilities bull Stormwater and combined sewer overflow (CSO) control facilities bull Nonpoint source (NPS) pollution control projects bull Decentralized wastewater management
Information collected about these facilities and projects includes
bull Estimated needs to address water quality or water quality-related public health problems bull Location and contact information for facilities and projects bull Facility populations served and flow effluent and unit process information bull NPS best management practices
CHP Installation Database The CHP Installation Database is maintained by ICF with support from the US Department of Energy and Oak Ridge National Laboratory The database lists all CHP systems in operation in the United States Information is gathered in real time and originates from industry literature manufacturer contacts and regional CHP centers The database is continually updated
2010 eGRID eGRID is a comprehensive source of data on the environmental characteristics of almost all electric power generated in the United States These environmental characteristics include air emissions for nitrogen oxides sulfur dioxide carbon dioxide methane and nitrous oxide emission rates net generation resource mix and many other attributes
40 The 2008 CWNS is available through EPArsquos Office of Wastewater Management and can be accessed at httpwaterepagovscitechdataitdatabasescwnsindexcfm 41 The CHP Installation Database is available at httpwwweea-inccomchpdataindexhtml 42 eGRID is available at httpwwwepagovcleanenergyenergy-resourcesegridindexhtml 43 Average industrial electricity prices taken from Energy Information Administration (EIA) ldquoMonthly Electric Sales and Revenue Report with State Distributions Reportrdquo year to date through December 2010 Natural gas price data can be found at httpwwweiagovdnavngng_pri_sum_dcu_nus_mhtm
40
US EIA Electricity and Natural Gas Prices Electric Power Monthly is a report prepared by the EIA that summarizes the average price paid by industrial customers purchasing electricity on a state-by-state basis WWTFs are treated as industrial customers because they are fairly large electricity consumers and they consume power throughout the day and night as do other industrial facilities Data are collected from a multitude of EIA forms as well as from other federal sources
Wastewater Treatment Facility Interviews The CHPP attempted to contact 30 WWTFs that have operational CHP systems and ultimately spoke with 14 facilities The WWTFs chosen for contact and those ultimately interviewed represent operational geographical and technological diversity Information obtained from interviews included operational insights and addressed drivers and benefits of CHP barriers and challenges encountered and lessons learned
Independent Research The CHPP also conducted independent research which included reviewing reports studies and case studies of WWTFs that employ CHP and utilizing the extensive CHP resources and contacts available to the CHPP
41
Appendix B Anaerobic Digester Design Criteria Used for Technical Potential Analysis
The following anaerobic digester design criteria were used to estimate the total wastewater influent flow rate that a typically sized digester can treat as well as the biogas generation rate and the heat load of a typically sized digester All criteria are based on a typically sized mesophilic digester
System Design Parameter Value Reactor Type1 Complete Mix Reactor Shape1 Circular Organic Load2 (lbsday VS) 13730 Percent Solids in Flow2 ( ww) 8 Sludge Density2 (lbsgal) 85 Flow to Reactor (lbsday) 171625 Flow to Reactor (galday) 20191 Flow to Reactor (ft3day) 2699 Reactor Depth3 (ft) 20 Design Load1 (lbs VSft3day) 025 Total Reactor Volume (ft3) 54920 Reactor Area (ft) 2746 Reactor Diameter1 (ft) 60 Retention Time (days) 20 Influent Temp ndash Winter (degF) 40 Air Temp ndash Winter (degF) 40 Earth Around Wall Temp ndash Winter (degF) 40 Earth Below Floor Temp ndash Winter (degF) 40 Reactor Temp (degF) 98 Influent Temp ndash Summer (degF) 78 Air Temp shy Summer (degF) 78 Earth Around Wall Temp ndash Summer (degF) 47 Earth Below Floor Temp ndash Summer (degF) 47 Sp Heat Sludge1 (BtulbdegF) 10 Area Walls (ft2) 37699 Area Roof (ft2) 28274 Area Floor (ft2) 28274 U Walls ndash Concrete1 (Btuhrft2degF) 012 U Roof ndash Concrete1 (Btuhrft2degF) 028 U Floor ndash Concrete1 (Btuhrft2degF) 030 Gas Generation1 (ft3lb VS) 12 Gas Heat Content1 (Btuft3) (HHV) 650 VS Removal Percent at 20 days2 () 55 VS Removed (lbsday) 7552 Gas Generation (ft3day) 90618 Heat Potential of Gas (Btuday) 58901700 Gas Generation per Capita1 (ft3dayperson) 1 Population Served by POTW (persons) 90618 Flow per Capita3 (galdayperson) 100
Total POTW Flow (MGD) 91 Sources 1 Metcalf and Eddy ldquoWastewater Engineering and Design 4th Editionrdquo 2003 2 Eckenfelder ldquoPrincipals of Water Quality Managementrdquo 1980 3 Great LakesshyUpper Mississippi Board of State and Provincial Public Health and Environmental Managers ldquoRecommended Standards for Wastewater Facilities (TenshyState Standards)rdquo 2004
42
Appendix C Space Heating Capability of CHP at Wastewater Treatment Facilities
As discussed in Section 422 the analysis estimated the space heating capability of CHP at WWTFs demonstrating that after digester loads are met there is little CHP recovered heat available for space heating in most climates Based on the results shown in Figure 2 and Table 9 (both in Section 422) the analysis estimated the amount of heat available for space heating after digester heating is met By subtracting the average values for digester heating requirements (see Table 9) from the thermal output of representative CHP systems the amount of heat available for space heating was estimated for three different sizes of WWTFs (ie 3 16 and 40 MGD) for each of the five climate zones The CHP systems chosen represent typical prime mover types and sizes used at WWTFs and the WWTF sizes are representative of the range of facility sizes that are applying CHP The following table presents the results
Estimated Space Heating Capability for CHP Units in Different Climate Zones
Thermal OutputLoad (MMBtuday)
Climate Zone WWTF Plant Size (MGD)
Representative CHP System
Estimated CHP Thermal Output
Average Digester Load
Surplus Thermal Output for Space
Heating
1 ndash Cold
3 65 kW Microturbine 59 84 00
16 400 kW Engine 384 448 00
40 1 MW Engine 816 1120 00
2 ndash Cold Moderate
3 65 kW Microturbine 59 75 00
16 400 kW Engine 384 400 40
40 1 MW Engine 816 1000 00
3 ndash Moderate Mixed
3 65 kW Microturbine 59 69 00
16 400 kW Engine 384 368 16
40 1 MW Engine 816 920 00
4 ndash WarmHot
3 65 kW Microturbine 59 60 00
16 400 kW Engine 384 320 64
40 1 MW Engine 816 800 16
5 ndash Hot
3 65 kW Microturbine 59 54 05
16 400 kW Engine 384 288 96
40 1 MW Engine 816 720 96
The data in the table above reveal that a substantial amount of surplus heat for space heating is available only in warm and hot climates where demand for space heating is minimal (except in cold winter months) In cold climates where more energy is required to heat the digester surplus thermal energy for space heating is generally not available
CHP provides for much higher gas utilization than if the digester were heated directly with boilers since the use of digester gas is much higher in the summer months when heating loads are minimal Gas utilization by baseloaded CHP systems is fairly constant throughout the year other than during periods of maintenance whereas gas utilization for boilers drops significantly during summer periods when some digester heating may be needed but little or no space heating
43
is needed A WWTF in North Carolina44 indicated that 63 to 66 percent of available digester gas can be beneficially used with CHP whereas use of digester gas-fueled boilers would consume only 33 to 38 percent of the gas with the balance either stack losses or flared gas This experience is consistent with the interviews of WWTFs conducted for this report in which a number of facilities indicated that using CHP results in more beneficial use of the digester gas For example the Town of Lewiston NY indicated that prior to implementing CHP its boiler used only 40 to 50 percent of the gas whereas with the CHP system gas utilization reached 98 percent Future trends45 also indicate that more facilities are likely to build gas storage into their digester system which should result in improved gas utilization Storing digester gas during periods of low demand and drawing from storage when demand for heat is high minimizes the need for gas flaring For many WWTFs improving gas utilization while at the same time eliminating or minimizing flaring is a key driver for implementing CHP
44 Fishman Bullard Vogt and Lundin ldquoBeneficial Use of Digester Gas ndash Seasonal and Lifecycle Cost Considerationsrdquo 2009 45 Based on a number of recent installations and feasibility studies that included gas storage (City of Riverside CA Cape Fear NC Ithaca NY Rochester NY and Gloversville-Johnstown NY)
44
Appendix D Cost-to-Generate Estimates by State
To estimate the cost to generate for CHP at WWTFs the analysis considered three digester gas utilization cases for each WWTF greater than 1 MGD that operates anaerobic digesters
bull Case 1 Assumes digester gas is used for both digester heating and space heating prior to CHP implementation
bull Case 2 Assumes digester gas is used for digester heating only prior to CHP implementation and natural gas is used for space heating
bull Case 3 Assumes digester gas is not used for heating and natural gas is used for digester and space heating prior to CHP implementation
45
Cost to Generate Electricity with Digester Gas (Case 1 ndash No Thermal Credit)
State
Average
Industrial
Electricity
Price 1
(centskWh)
Average
Industrial
Natural Gas
Price 2
($1000 scf)
Cost to Generate (centskWh)
Small Rich-
Burn Engine
(1-5 MGD)
Microturbine
(1-10 MGD)
Rich-Burn
Engine
(5-15 MGD)
Fuel Cell
(10-80 MGD)
Small Lean-
Burn Engine
(12-40 MGD)
Lean-Burn
Engine
(40-160 MGD)
Combustion
Turbine
(gt160 MGD)
Alaska 141 42 73 64 60 83 51 40 32
Alabama 61 64 73 64 60 83 51 40 32
Arkansas 54 76 73 64 60 83 51 40 32
Arizona 67 82 73 64 60 83 51 40 32
California 109 70 73 64 60 83 51 40 32
Colorado 69 58 73 64 60 83 51 40 32
Connecticut 144 96 73 64 60 83 51 40 32
Delaware 96 140 73 64 60 83 51 40 32
Florida 89 94 73 64 60 83 51 40 32
Georgia 62 67 73 64 60 83 51 40 32
Hawaii 219 242 73 64 60 83 51 40 32
Iowa 54 61 73 64 60 83 51 40 32
Idaho 51 64 73 64 60 83 51 40 32
Illinois 67 73 73 64 60 83 51 40 32
Indiana 60 55 73 64 60 83 51 40 32
Kansas 62 53 73 64 60 83 51 40 32
Kentucky 51 53 73 64 60 83 51 40 32
Louisiana 58 46 73 64 60 83 51 40 32
Massachusetts 132 121 73 64 60 83 51 40 32
Maryland 95 86 73 64 60 83 51 40 32
Maine 88 91 73 64 60 83 51 40 32
Michigan 72 92 73 64 60 83 51 40 32
Minnesota 63 57 73 64 60 83 51 40 32
Missouri 55 96 73 64 60 83 51 40 32
Mississ ippi 64 59 73 64 60 83 51 40 32
Montana 56 91 73 64 60 83 51 40 32
North Carolina 61 81 73 64 60 83 51 40 32
North Dakota 57 52 73 64 60 83 51 40 32
Nebraska 59 57 73 64 60 83 51 40 32
New Hampshire 128 121 73 64 60 83 51 40 32
New Jersey 116 97 73 64 60 83 51 40 32
New Mexico 60 60 73 64 60 83 51 40 32
Nevada 74 105 73 64 60 83 51 40 32
New York 97 95 73 64 60 83 51 40 32
Ohio 63 89 73 64 60 83 51 40 32
Oklahoma 52 126 73 64 60 83 51 40 32
Oregon 55 73 73 64 60 83 51 40 32
Pennsylvania 76 102 73 64 60 83 51 40 32
Rhode Island 128 126 73 64 60 83 51 40 32
South Carolina 57 61 73 64 60 83 51 40 32
South Dakota 59 59 73 64 60 83 51 40 32
Tennessee 67 62 73 64 60 83 51 40 32
Texas 63 46 73 64 60 83 51 40 32
Utah 49 55 73 64 60 83 51 40 32
Virginia 67 71 73 64 60 83 51 40 32
Vermont 95 66 73 64 60 83 51 40 32
Washington 40 94 73 64 60 83 51 40 32
Wisconsin 68 76 73 64 60 83 51 40 32
West Virginia 59 54 73 64 60 83 51 40 32
Wyoming 50 54 73 64 60 83 51 40 32
Average industrial electricity prices taken from Energy Information Administration (EIA) ldquoMonthly Electric Sales and Revenue Report with State Distributions Reportrdquo year to date through December 2010
Average industrial natural gas prices taken from EIA available at httpwwweiagovdnavngng_pri_sum_dcu_nus_mhtm
46
Net Cost to Generate Electricity with Digester Gas (Case 2 ndash Thermal Credit for Space Heating)
State
Average
Industrial
Electricity
Price 1
(centskWh)
Average
Industrial
Natural Gas
Price 2
($1000 scf)
Cost to Generate (centskWh)
Small Rich-
Burn Engine
(1-5 MGD)
Microturbine
(1-10 MGD)
Rich-Burn
Engine
(5-15 MGD)
Fuel Cell
(10-80 MGD)
Small Lean-
Burn Engine
(12-40 MGD)
Lean-Burn
Engine
(40-160 MGD)
Combustion
Turbine
(gt160 MGD)
Alaska 141 42 73 64 60 83 51 40 32
Alabama 61 64 71 64 58 83 51 40 32
Arkansas 54 76 72 64 58 83 51 40 32
Arizona 67 82 72 64 58 83 51 40 32
California 109 70 72 64 58 83 51 40 32
Colorado 69 58 73 64 59 83 51 40 32
Connecticut 144 96 73 64 60 83 51 40 32
Delaware 96 140 73 64 59 83 51 40 32
Florida 89 94 70 64 57 83 51 40 32
Georgia 62 67 70 64 56 83 50 40 32
Hawaii 219 242 68 64 53 83 51 40 32
Iowa 54 61 73 64 60 83 51 40 32
Idaho 51 64 73 64 60 83 51 40 32
Illinois 67 73 73 64 60 83 51 40 32
Indiana 60 55 73 64 60 83 51 40 32
Kansas 62 53 73 64 60 83 51 40 32
Kentucky 51 53 73 64 60 83 51 40 32
Louisiana 58 46 72 64 58 83 51 40 32
Massachusetts 132 121 73 64 60 83 51 40 32
Maryland 95 86 73 64 59 83 51 40 32
Maine 88 91 73 64 60 83 51 40 32
Michigan 72 92 73 64 60 83 51 40 32
Minnesota 63 57 73 64 60 83 51 40 32
Missouri 55 96 73 64 59 83 51 40 32
Mississ ippi 64 59 71 64 58 83 51 40 32
Montana 56 91 73 64 60 83 51 40 32
North Carolina 61 81 72 64 58 83 51 40 32
North Dakota 57 52 73 64 60 83 51 40 32
Nebraska 59 57 73 64 60 83 51 40 32
New Hampshire 128 121 73 64 60 83 51 40 32
New Jersey 116 97 73 64 60 83 51 40 32
New Mexico 60 60 72 64 59 83 51 40 32
Nevada 74 105 73 64 60 83 51 40 32
New York 97 95 73 64 60 83 51 40 32
Ohio 63 89 73 64 60 83 51 40 32
Oklahoma 52 126 72 64 58 83 51 40 32
Oregon 55 73 73 64 59 83 51 40 32
Pennsylvania 76 102 73 64 60 83 51 40 32
Rhode Island 128 126 73 64 60 83 51 40 32
South Carolina 57 61 72 64 58 83 51 40 32
South Dakota 59 59 73 64 60 83 51 40 32
Tennessee 67 62 72 64 58 83 51 40 32
Texas 63 46 72 64 58 83 51 40 32
Utah 49 55 73 64 60 83 51 40 32
Virginia 67 71 73 64 59 83 51 40 32
Vermont 95 66 73 64 60 83 51 40 32
Washington 40 94 73 64 60 83 51 40 32
Wisconsin 68 76 73 64 60 83 51 40 32
West Virginia 59 54 73 64 60 83 51 40 32
Wyoming 50 54 73 64 60 83 51 40 32
Includes thermal credit as described in Section 423
Average industrial electricity prices taken from Energy Information Administration (EIA) ldquoMonthly Electric Sales and Revenue Report with State Distributions Reportrdquo year to date through December 2010
Average industrial natural gas prices taken from EIA available at httpwwweiagovdnavngng_pri_sum_dcu_nus_mhtm
47
Net Cost to Generate Electricity with Digester Gas (Case 3 ndash Full Thermal Credit)
State
Average
Industrial
Electricity
Price 1
(centskWh)
Average
Industrial
Natural Gas
Price 2
($1000 scf)
Cost to Generate (centskWh)
Small Rich-
Burn Engine
(1-5 MGD)
Microturbine
(1-10 MGD)
Rich-Burn
Engine
(5-15 MGD)
Fuel Cell
(10-80 MGD)
Small Lean-
Burn Engine
(12-40 MGD)
Lean-Burn
Engine
(40-160 MGD)
Combustion
Turbine
(gt160 MGD)
Alaska 141 42 50 48 40 72 35 26 16
Alabama 61 64 49 42 39 66 32 21 13
Arkansas 54 76 39 31 30 60 23 12 04
Arizona 67 82 40 33 31 61 24 13 05
California 109 70 47 39 37 65 29 18 10
Colorado 69 58 40 35 31 63 23 15 04
Connecticut 144 96 32 31 25 60 17 11 00
Delaware 96 140 19 16 12 50 04 00 00
Florida 89 94 40 33 30 59 25 14 06
Georgia 62 67 48 42 37 64 31 21 12
Hawaii 219 242 02 00 00 32 00 00 00
Iowa 54 61 44 41 35 67 27 20 09
Idaho 51 64 35 37 27 64 23 16 05
Illinois 67 73 38 36 30 63 22 15 04
Indiana 60 55 43 40 34 66 26 19 08
Kansas 62 53 54 48 44 72 35 26 16
Kentucky 51 53 48 42 38 68 29 21 10
Louisiana 58 46 57 49 45 71 38 27 19
Massachusetts 132 121 00 01 00 39 00 00 00
Maryland 95 86 26 22 18 54 10 04 00
Maine 88 91 05 15 01 49 00 00 00
Michigan 72 92 21 26 15 57 12 07 00
Minnesota 63 57 42 42 33 68 28 21 10
Missouri 55 96 31 27 23 57 15 08 00
Mississippi 64 59 49 42 39 66 32 21 13
Montana 56 91 24 29 18 59 15 09 00
North Carolina 61 81 40 32 30 61 23 12 04
North Dakota 57 52 45 44 36 69 30 22 12
Nebraska 59 57 44 41 35 67 27 20 09
New Hampshire 128 121 00 03 00 40 00 00 00
New Jersey 116 97 30 29 23 59 16 10 00
New Mexico 60 60 53 44 42 69 34 23 15
Nevada 74 105 19 20 13 53 06 02 00
New York 97 95 15 22 10 54 08 03 00
Ohio 63 89 26 25 19 56 11 06 00
Oklahoma 52 126 35 28 26 58 20 09 01
Oregon 55 73 37 32 28 61 20 12 01
Pennsylvania 76 102 19 20 13 53 06 02 00
Rhode Island 128 126 13 15 08 49 01 00 00
South Carolina 57 61 47 39 37 66 29 18 10
South Dakota 59 59 41 41 32 67 27 20 09
Tennessee 67 62 43 35 33 63 26 15 07
Texas 63 46 54 46 43 69 36 25 17
Utah 49 55 45 41 35 67 27 20 09
Virginia 67 71 43 37 33 65 25 17 06
Vermont 95 66 35 37 27 64 23 16 05
Washington 40 94 31 30 23 59 16 10 00
Wisconsin 68 76 31 34 24 62 20 14 02
West Virginia 59 54 47 41 37 67 28 20 09
Wyoming 50 54 47 45 38 70 32 24 13
Includes thermal credit as described in Section 423
Average industrial electricity prices taken from Energy Information Administration (EIA) ldquoMonthly Electric Sales and Revenue Report with State Distributions Reportrdquo year to date through December 2010
Average industrial natural gas prices taken from EIA available at httpwwweiagovdnavngng_pri_sum_dcu_nus_mhtm
48
Appendix E Additional Reference Resources
EPA Combined Heat and Power Partnership (CHPP)
The CHPP is a voluntary program that seeks to reduce the environmental impact of power generation by promoting the use of CHP The CHPP works closely with energy users the CHP industry state and local governments and other stakeholders to support the development of new projects and promote their energy environmental and economic benefits
Website wwwepagovchp
The CHPP offers a number of tools and resources that can help a WWTF implement a CHP system These include
bull Description of the CHP project development process including information on key questions for each stage of the process along with specific tools and resources Website wwwepagovchpproject-developmentindexhtml
bull The CHP funding database with bi-weekly updates of new state and federal incentive opportunities Website wwwepagovchpfundingfundinghtml
bull The CHP Catalog of Technologies which describes performance and cost characteristics of CHP technologies Website wwwepagovchpbasiccataloghtml
bull The Biomass CHP Catalog of Technologies which provides detailed technology characterization of biomass CHP systems Website wwwepagovchpbasiccataloghtml
Reports
The following reports about CHP at WWTFs are available for download
Brown amp Caldwell ldquoEvaluation of Combined Heat and Power Technologies for Wastewater Treatment Facilitiesrdquo December 2010 Available at httpwaterepagovscitechwastetechpublicationscfm
Association of State Energy Research amp Technology Transfer Institutions ldquoStrategic CHP Deployment Assistance for Wastewater Treatment Facilitiesrdquo October 2009 Available at httpwwwaserttiorgwastewaterindexhtml
California Energy Commission ldquoCombined Heat and Power Potential at Californiarsquos Wastewater Treatment Plantsrdquo September 2009 Available at httpwwwenergycagov2009publicationsCEC-200-2009-014CEC-200-2009-014-SFPDF
49
Organizations
The following organizations work closely with the wastewater treatment industry and offer a wealth of knowledge concerning wastewater treatment and the use of anaerobic digestion
EPA Office of Wastewater Management (OWM) ndash The OWM oversees a range of programs contributing to the well-being of the nationrsquos waters and watersheds Website wwwepagovowm
National Association of Clean Water Agencies (NACWA) ndash NACWA represents the interests of more than 300 public agencies and organizations NACWA members serve the majority of the sewered population in the United States and collectively treat and reclaim more than 18 billion gallons of wastewater daily Website wwwnacwaorg
Water Environment Federation (WEF) ndash Founded in 1928 the WEF is a not-for-profit technical and educational organization with members from varied disciplines who work toward the organizationrsquos vision of preserving and enhancing the global water environment Website wwwweforgHome
Water Environment Research Foundation (WERF) ndash WERF helps improve the water environment and protect human health by providing sound reliable science and innovative effective cost-saving technologies for improved management of water resources Website wwwwerforg
Air and Waste Management Association (AampWMA) ndash AampWMA is a not-for-profit non-partisan professional organization that provides training information and networking opportunities to thousands of environmental professionals in 65 countries Website wwwawmaorg
Other
Database of State Incentives for Renewables and Efficiency (DSIRE) ndash DSIRE is a comprehensive source of information on federal state local and utility incentives and policies that promote renewable energy and energy efficiency Website httpwwwdsireusaorg
United States Environmental Protection Agency Office of Air and Radiation (6202J) 430R11018 October 2011 wwwepagovchp
50
- Opportunities for Combined Heat and Power at Wastewater Treatment Facilities Market Analysis and Lessons from the Field
- Acknowledgements
- Table of Contents
- List of Tables
- List of Figures
- EXECUTIVE SUMMARY
-
- Purpose of Report
- Key Findings
-
- 10 Introduction
- 20 CHP and Its Benefits at Wastewater Treatment Facilities
- 30 The Market
-
- 31 Wastewater Treatment Facilities with CHP
- 32 Potential CHP Market
-
- 40 Technical and Economic Potential
-
- 41 Technical Potential for CHP at Wastewater Treatment Facilities
-
- 411 Methodology
- 412 Electric and Thermal Generation Potential from CHP Systems at Wastewater Treatment Facilities
- 413 National Electric Generation Potential from CHP at Wastewater Treatment Facilities
- 414 Potential Carbon Dioxide Emissions Benefits
-
- 42 Economic Potential for CHP at Wastewater Treatment Facilities
-
- 421 Methodology
- 422 Heating Requirements of Wastewater Treatment Facilities
- 423 Estimated Cost to Generate Electricity
- 424 National Economic Potential Scenarios
-
- 50 Wastewater Treatment Facility Interviews CHP Benefits Challenges and Operational Insights
-
- 51 Wastewater Treatment Facilities Interviewed and Interview Format
- 52 Drivers and Benefits
- 53 Challenges
- 54 Operational Insights and Observations
-
- Appendix A Data Sources Used in the Analysis
- Appendix B Anaerobic Digester Design Criteria Used for Technical Potential Analysis
- Appendix C Space Heating Capability of CHP at Wastewater Treatment Facilities
- Appendix D Cost-to-Generate Estimates by State
- Appendix E Additional Reference Resources
-