environmental reporting methodology memo - …€¦ · kering environmental reporting 2014 ......
TRANSCRIPT

ENVIRONMENTAL REPORTING
Methodology Memo 2014

2
15
Kering Environmental reporting 2014
Organisation
Indicators to monitor our environmental impacts
Kering monitors the main environmental impacts of its
business activities since 2004. The 2014 list of indicators
fully covers the topics mentioned in the article 225 of the
July 2010 “Grenelle 2” French law (in a quantitative or
qualitative way) and its application decree of 24 April
2012.
These indicators are split into 10 main themes:
Energy consumption
Water consumption
Waste production
Paper consumption
Packaging consumption
Consumption of raw materials
Transport (BtoB, BtoC and company cars)
Air pollution
Environmental management
General data on the site (surface, turnover, …),
enabling ratios calculation
A dedicated web-based reporting tool
Since 2004, Kering has implemented and updated a
reliable and secure web-based platform dedicated to the
collection, validation and consolidation of its extra-
financial data. This IT tool is designed to allocate
indicators according to site and brand specificities (e.g. a
Gucci store won’t receive exactly the same indicators as
a PUMA store or as a Gucci warehouse).
The reporting is done at site level (each physical site),
which allows Kering to assess the environmental
impacts of 1716 sites. The sites are organized as
following:
Kering
Brand A
Business unit A1
Site A1Site A1-a
Site A1-b
Business Unit A2
Site A2-a
Brand B
….
Each data point goes through four successive checks:
The IT tool automatically compares the 2014 value
versus the 2013 value – if the difference is more
than 25%, the contributor has to explain the variation
The validator 1 assesses the variation between 2014
and 2013 for all the sites within his scope (one site,
all the sites of a country, a whole Business Unit…),
and compares the values with similar sites – he is a
different person from the contributor to ensure a
higher level of reliability – if needed, he corrects or
asks the contributor to correct the data
The validator 2 performs the same kind of analysis
for all the sites at brand level
The Kering sustainability team performs the same
analysis at Kering level

3
15
A global network of users
More than 450 people (“contributors” and “validators”)
across the world perform two roles for the sites they are
responsible for:
Input primary data for each indicator (contributors)
Carry out verification checks and validate data
(validators)
Consistent methodology and guidelines
The Sustainability Leads of each brand manage their
network of users and define along with the Kering
sustainability department the list of indicators and the
main reporting guidelines (timeline, process,
extrapolation and estimation procedures, emission
factors, breakdown of indicators by brand and type of
site…). These guidelines and the precise definition of the
indicators are compiled and distributed in the network
through the Kering reporting protocol 2014, as well as
other supporting documentation.
The recommended guidelines are as follow:
Collect invoices to gather actual data
If the data does not cover the whole period,
extrapolate the invoices data to the whole year
If no invoices can be collected, estimate the figure
based on similar sites by applying a ratio of impact
per square meter (or per turnover), or if this is not
possible by applying the ratios provided by Kering
sustainability department that are specific (per
region/type of site/division) averages of past year
Group data
To ensure that these guidelines are properly understood
and followed, the Kering sustainability department, as
well as the Sustainability leads of each brands, organize
training sessions for users and provide them with
constant support.

4
15
Kering Environmental reporting 2014
Scope
Indicators to monitor our environmental impacts
The sites covered in the reporting consolidation scope
are brands and business units over which the Group
holds operational control (i.e. more than 50% stake), and
with operational control takeover since July 1st 2014 at
least. However, in the event of a disposal or loss of
operational control, the site is automatically removed
from the reporting scope regardless of the time of year
when the disposal or closure occurred. Similarly,
activities listed as “discontinued” under the IFRS
standards on 31 December 2014 are removed from the
reporting scope.
Since the 2013 reporting, Kering has managed to collect
(or estimate) the environmental impacts of 100% of the
sites within its reporting scope. Moreover, within all
these sites, no indicator data has been excluded from
the reporting scope, as missing data have been
estimated and erroneous data corrected.
This means that:
The 2014 reporting scope and reported scope of the
consolidated figures are identical
The 2013-2014 pro forma scope only excludes the
sites that were not opened in 2013 and the sites that
were closed in 2014
Hereafter are the types of sites included in the reporting
scope 2014, and the exclusions due to the reporting
methodology:
Brand Within reporting
scope
Outside
reporting scope
PUMA
All stores, offices,
industrial sites and
warehouses
Sourcing offices of less
than 10 people
Volcom All stores, offices and
warehouses
Gucci
All stores, offices,
industrial sites and
warehouses
Bottega Veneta
All stores, offices,
industrial sites and
warehouses
Saint Laurent
All stores, offices,
industrial sites and
warehouses
Alexander
McQueen
All stores, offices and
warehouses
Balenciaga All stores, offices and
warehouses
Brioni
All stores, offices,
industrial sites and
warehouses
Stella McCartney All stores, offices and
warehouses
Girard-
Perregaux/
JEANRICHARD
All stores, offices,
industrial sites and
warehouses
Pomellato/Dodo
All stores, offices,
industrial sites and
warehouses
Qeelin All stores and offices
Christopher
Kane All offices
Kering
Corporate All offices
Note: Sergio Rossi is not consolidated in the 2014 environmental reporting in accordance with the financial consolidation rules.

5
15
Pro forma scopes 2013 – 2014
To ensure reliable monitoring of trends over the years,
several Group indicators are presented on a pro forma
basis in this report. This method eliminates any bias due
to changes in scope, by taking into account only the
sites that were present in two consecutive years (in this
case 2012 and 2013).
This means that the pro forma excludes:
The 2014 sites that were not present in the 2013
reporting (which automatically excludes the new
brands that joined the Kering Group in 2014)
The 2013 sites that have been closed in 2014
The data from previous years may be corrected if errors
are identified or if the reporting methodology changes.
Coverage rate of pro forma scopes 2013 - 2014:
At Group level, 80% of the 1717 sites de 2014 are
included in the pro forma figures.
% of 2014 sites included
in the pro forma scope
Boucheron 100%
% of 2014 sites included
in the pro forma scope
Sowind Group 100%
Christopher Kane 100%
Kering Corporate 96%
Stella Mc Cartney 95%
Gucci 91%
Volcom 89%
Balenciaga 89%
Bottega Veneta 88%
Yves Saint Laurent 83%
Alexander Mc Queen 83%
PUMA 76%
Brioni 74%
Qeelin 65%
Pomellato 0%

6
15
Kering Environmental reporting 2014
Freight Transport
Since every brand handles its own logistics, the
transportation flows are extremely diversified. In this
document, we present the methodology used for
reporting purposes at Kering to consolidate indicators on
goods transport.
Scope covered: paid flows
The transportation flows included in the environmental
reporting correspond exclusively to all transport carried
out under the brands’ control, i.e. paid by them.
Transport is split into two categories:
“B to B” transport:
deliveries from suppliers when paid by
Kering brands, regardless of the type of site
delivered (store, warehouse, industrial site,
etc.),
flows of supply to stores by the warehouses
or between warehouses
express deliveries (since 2014, to take into
account the Groupe evolution)
“B to C” transport:
deliveries to customers,
Indicators used to report on freight streams: litres of
diesel fuel, tonne.km and TEU.km
“B to B” units of measurement:
Road, rail, river or air freight: tonne.kilometer
(t.km). This unit corresponds to the total sum of
the distance travelled multiplied by the tonnage
transported. The weight used is the actual
weight of products when available or the taxable
weight otherwise.
Express deliveries: tonne.kilometer (t.km).
These deliveries correspond to the quick
transportation of small quantities of goods.
They include road and air transportation.
Express deliveries are made by service
providers and the CO2 emissions are
calculated based on the t.km data the
service providers provide to us (to Kering
headquarters directly).
Maritime shipping: TEU.kilometer (TEU.km;
TEU = Twenty-foot Equivalent Unit). This
unit corresponds to the total sum of the
distance travelled multiplied by the total
volume transported. A TEU represents an
estimation of the volume transported by a
20-foot cargo.
“B to C” units of measurement:
Deliveries to customers: litre of fuel (L). This
B to C flow covers deliveries of finished
products directly to clients from logistics
platforms or points of sale. Deliveries to
customer are made by the brands’ own (or
subcontracted) vehicles and the CO2
emissions are calculated based on the fuel
consumption consumed.
7
15
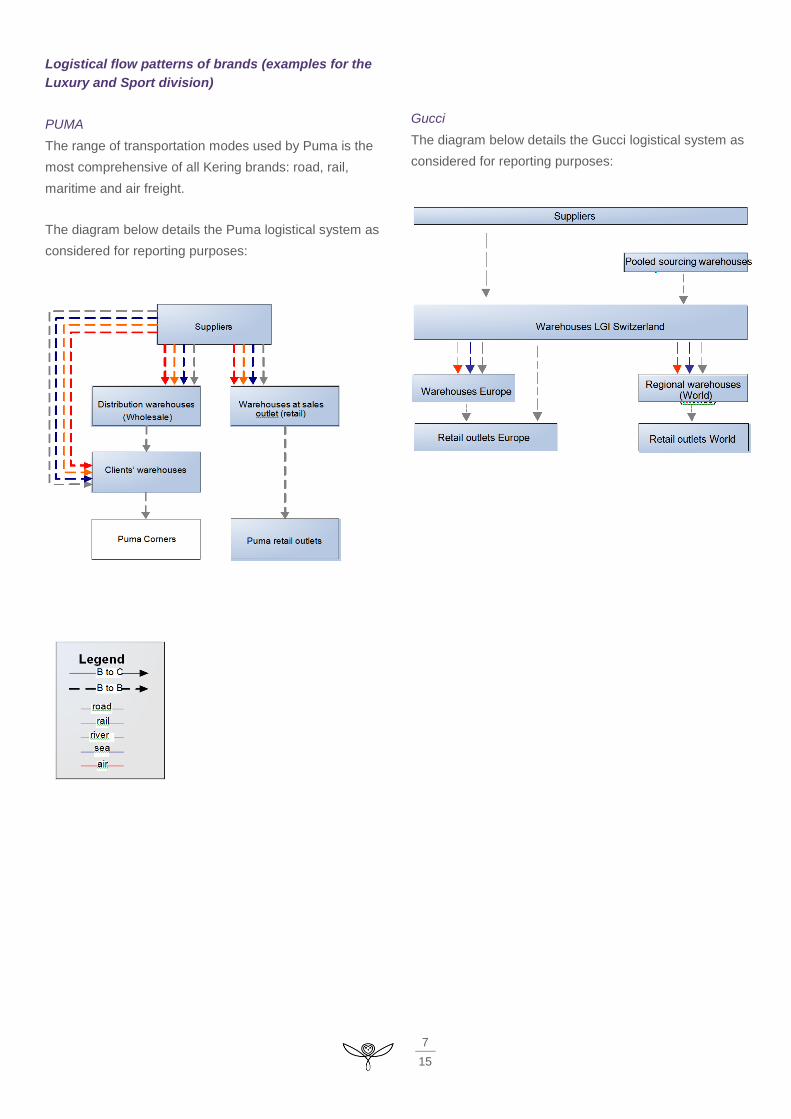
Logistical flow patterns of brands (examples for the
Luxury and Sport division)
PUMA
The range of transportation modes used by Puma is the
most comprehensive of all Kering brands: road, rail,
maritime and air freight.
The diagram below details the Puma logistical system as
considered for reporting purposes:
Gucci
The diagram below details the Gucci logistical system as
considered for reporting purposes:
8
15
Kering Environmental reporting 2014
Emissions Factors
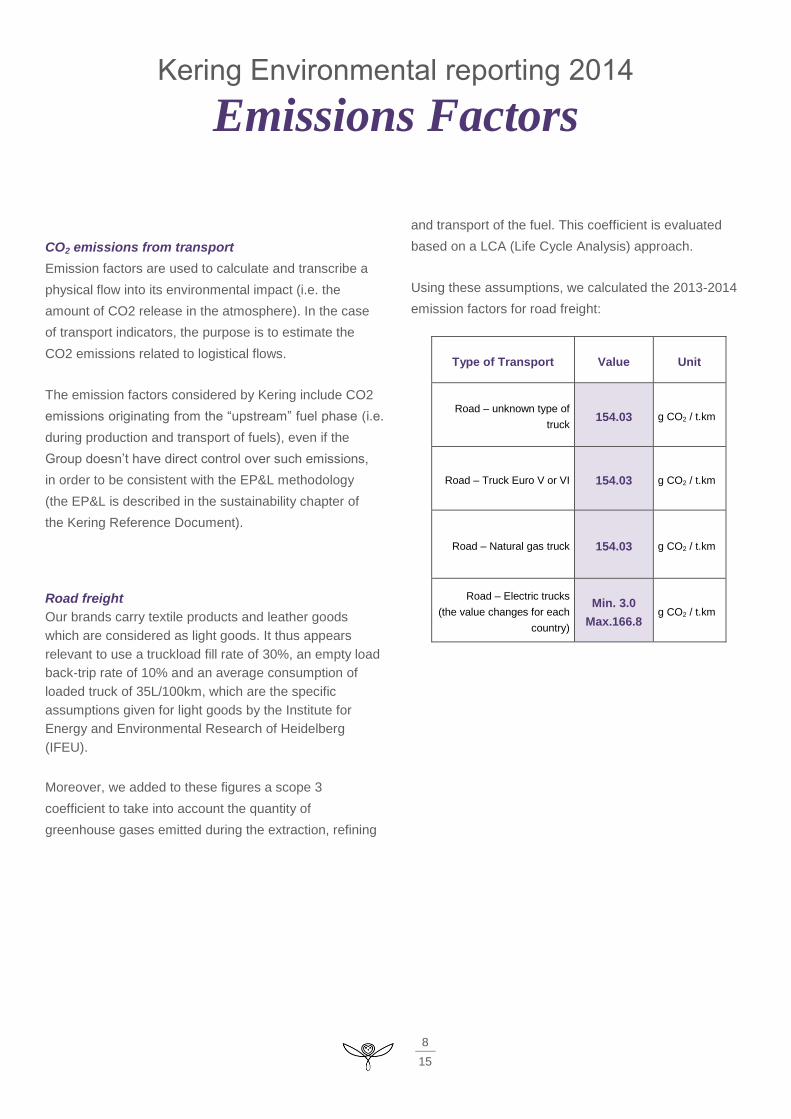
CO2 emissions from transport
Emission factors are used to calculate and transcribe a
physical flow into its environmental impact (i.e. the
amount of CO2 release in the atmosphere). In the case
of transport indicators, the purpose is to estimate the
CO2 emissions related to logistical flows.
The emission factors considered by Kering include CO2
emissions originating from the “upstream” fuel phase (i.e.
during production and transport of fuels), even if the
Group doesn’t have direct control over such emissions,
in order to be consistent with the EP&L methodology
(the EP&L is described in the sustainability chapter of
the Kering Reference Document).
Road freight
Our brands carry textile products and leather goods
which are considered as light goods. It thus appears
relevant to use a truckload fill rate of 30%, an empty load
back-trip rate of 10% and an average consumption of
loaded truck of 35L/100km, which are the specific
assumptions given for light goods by the Institute for
Energy and Environmental Research of Heidelberg
(IFEU).
Moreover, we added to these figures a scope 3
coefficient to take into account the quantity of
greenhouse gases emitted during the extraction, refining
and transport of the fuel. This coefficient is evaluated
based on a LCA (Life Cycle Analysis) approach.
Using these assumptions, we calculated the 2013-2014
emission factors for road freight:
Type of Transport Value Unit
Road – unknown type of
truck 154.03 g CO2 / t.km
Road – Truck Euro V or VI 154.03 g CO2 / t.km
Road – Natural gas truck 154.03 g CO2 / t.km
Road – Electric trucks
(the value changes for each
country)
Min. 3.0
Max.166.8 g CO2 / t.km

9
15
Sea freight
BSR’s « clean cargo working group » is the source
followed by Kering for emission factors. Indeed Kering’s
main sea transportation provider was part and even a
leading actor of this group.
Moreover, we added to these figures a scope 3
coefficient to take into account the quantity of
greenhouse gases emitted during the extraction, refining
and transport of the fuel. This coefficient is evaluated
based on a LCA (Life Cycle Analysis) approach.
The 2013-2014 sea freight emission factors are:
Type of Transport Value Unit
Sea - Asia – Asia 89.9 g CO2 / TEU.km
Sea - Europe – Asia 79.2 g CO2 / TEU.km
Sea - North America –
Asia 92.2 g CO2 / TEU.km
Sea - Europe – North
America 100.5 g CO2 / TEU.km
Sea - Europe – Europe 86.3 g CO2 / TEU.km
Sea - Europe – South
America 102.9 g CO2 / TEU.km
Sea - Europe – Africa 105.2 g CO2 / TEU.km
Sea - North America –
South America 100.5 g CO2 / TEU.km
Sea – South America –
Asia 95.8 g CO2 / TEU.km
Sea – Intra-Americas 120.6 g CO2 / TEU.km
Air freight
The British Department for Environment, Food and Rural
Affairs (DEFRA) publishes figures that take into account
the carrying of light goods in commercial flights, which is
a growing practice in the Group. Therefore this source
has been chosen by Kering.
Moreover, we added to these figures a scope 3
coefficient to take into account the quantity of
greenhouse gases emitted during the extraction, refining
and transport of the fuel. This coefficient is evaluated
based on a LCA (Life Cycle Analysis) approach.
The 2013-2014 air freight emission factors are:
TYPE OF TRANSPORT Value Unit
Air - short/medium-haul 1 601.7
g CO2 / t.km
Air - long-haul 666.6
g CO2 / t.km
10
15
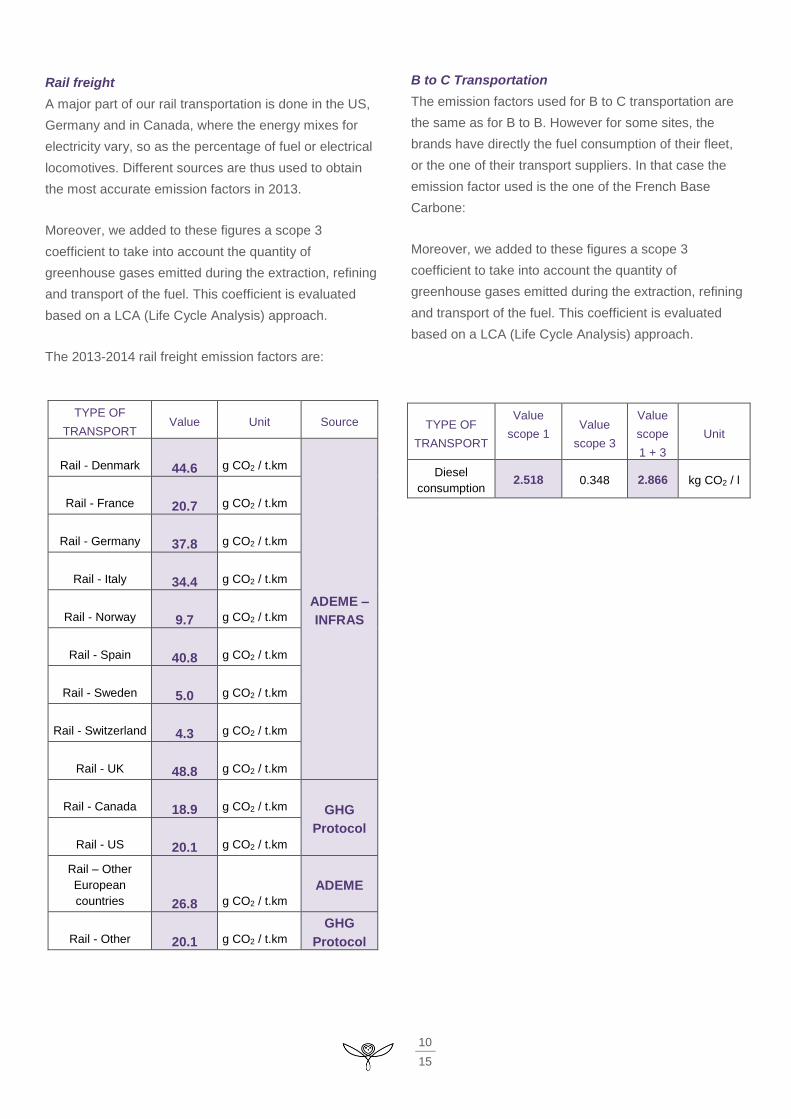
Rail freight
A major part of our rail transportation is done in the US,
Germany and in Canada, where the energy mixes for
electricity vary, so as the percentage of fuel or electrical
locomotives. Different sources are thus used to obtain
the most accurate emission factors in 2013.
Moreover, we added to these figures a scope 3
coefficient to take into account the quantity of
greenhouse gases emitted during the extraction, refining
and transport of the fuel. This coefficient is evaluated
based on a LCA (Life Cycle Analysis) approach.
The 2013-2014 rail freight emission factors are:
TYPE OF
TRANSPORT Value Unit Source
Rail - Denmark
44.6 g CO2 / t.km
ADEME –
INFRAS
Rail - France
20.7 g CO2 / t.km
Rail - Germany
37.8 g CO2 / t.km
Rail - Italy
34.4 g CO2 / t.km
Rail - Norway
9.7 g CO2 / t.km
Rail - Spain
40.8 g CO2 / t.km
Rail - Sweden
5.0 g CO2 / t.km
Rail - Switzerland
4.3 g CO2 / t.km
Rail - UK
48.8 g CO2 / t.km
Rail - Canada
18.9 g CO2 / t.km GHG
Protocol
Rail - US
20.1 g CO2 / t.km
Rail – Other
European
countries
26.8 g CO2 / t.km
ADEME
Rail - Other
20.1 g CO2 / t.km
GHG
Protocol
B to C Transportation
The emission factors used for B to C transportation are
the same as for B to B. However for some sites, the
brands have directly the fuel consumption of their fleet,
or the one of their transport suppliers. In that case the
emission factor used is the one of the French Base
Carbone:
Moreover, we added to these figures a scope 3
coefficient to take into account the quantity of
greenhouse gases emitted during the extraction, refining
and transport of the fuel. This coefficient is evaluated
based on a LCA (Life Cycle Analysis) approach.
TYPE OF
TRANSPORT
Value
scope 1 Value
scope 3
Value
scope
1 + 3
Unit
Diesel
consumption 2.518 0.348 2.866 kg CO2 / l

11
15
Company cars
The brands report in priority their diesel or gasoline
consumption. When this information was not available,
the contributors could report the average emission factor
of their fleet (given by their leasing supplier or car maker)
together with the distance done.
Moreover, we added to these figures a scope 3
coefficient to take into account the quantity of
greenhouse gases emitted during the extraction, refining
and transport of the fuel. This coefficient is evaluated
based on a LCA (Life Cycle Analysis) approach.
Type of
Transport
Value
scope 1
Value
scope 3
Value
scope
1 + 3
Unit
Diesel
consumption 2.518 0.347 2.866
T
CO2e/m3
Gasoline
consumption 2.26 0.31 2.57
T
CO2e/m3
Air travel
Finally the CO2 emission factors for air travel are the
one of French Base Carbone. Moreover, we added to
these figures a scope 3 coefficient to take into account
the quantity of greenhouse gases emitted during the
extraction, refining and transport of the fuel. This
coefficient is evaluated based on a LCA (Life Cycle
Analysis) approach.
Type of Transport Value Unit
Air travel 127.2 g CO2 /passenger.km
Energy related CO2 emissions
The CO2 emission factors related to the consumption of
energy are obtained through the French Base Carbone.
The emission factors used to calculate the emissions of
greenhouse gases linked to the production of the
electricity consumed by Kering are specific to the
countries where the sites of Kering are located. In an
effort to match numbers with the reality of the different
types of energy mix in the various countries and regions
of Group operations, Kering used emission factors
specific to each of its countries and regions of operation.
These factors were extracted from the regularly updated
data bases published by the International Energy
Agency (IEA).
Moreover, we added to these figures a scope 3
coefficient to take into account the extraction of the
energy, line losses, transport and nuclear waste
treatment, evaluated based on a LCA approach.
Type of
Energy
Value
scope
1
Value
scope
2
Value
scope
3
Value
scope
1,2,3
Unit
steam - 191.0 34.9 225.9
g CO2 /
kWh
heavy fuel 266.4 - 45.4 311.8
g CO2 /
kWh
light fuel 262.1 - 35.1 297.2
g CO2 /
kWh
natural gas 192.0 - 38.1 230.1
g CO2 /
kWh
Solar
electricity
(for onsite
production)
- - 18.0 18.0 g CO2 /
kWh
LPG 295.7 - 50.4 346.1
g CO2 /
kWh

12
15
ELECTRICITY EMISSION FACTORS
Value scope 2 (conventional
electricity)
Value scope 3 (conventional
electricity)
Total value conventional
electricity (scope 2+3)
Value green
electricity (scope 3
only)
Unit
Argentina 403.91 137.68 541.59 20.42 g CO2 / kWh
Aruba 573.31 163.55 736.86 18 g CO2 / kWh
Australia 859.15 235.19 1 094.34 15.96 g CO2 / kWh
Austria 191.49 51.48 242.97 18.48 g CO2 / kWh
Bangladesh 531.17 133.09 664.27 21.8 g CO2 / kWh
Belgium 169.69 32.4 202.09 8.2 g CO2 / kWh
Brazil 72.71 44.95 117.66 20.15 g CO2 / kWh
Bulgaria 573.31 163.55 736.86 18.14 g CO2 / kWh
Cambodia 573.31 163.55 736.86 16.58 g CO2 / kWh
Canada 168.61 45.68 214.29 20.66 g CO2 / kWh
Chile 573.31 163.55 736.86 18 g CO2 / kWh
China 872.99 241.71 1 114.70 18.87 g CO2 / kWh
Croatia 573.31 163.55 736.86 18 g CO2 / kWh
Czech Republic 640.18 146.92 787.1 20.57 g CO2 / kWh
Denmark 410.03 288.24 698.27 0.08 g CO2 / kWh
El Salvador 573.31 163.55 736.86 18 g CO2 / kWh
Finland 251.97 46.13 298.1 11.14 g CO2 / kWh
France 53.69 15.76 69.44 16.48 g CO2 / kWh
ELECTRICITY EMISSION FACTORS
Value scope 2 (conventional
electricity)
Value scope 3 (conventional
electricity)
Total value conventional
electricity (scope 2+3)
Value green
electricity (scope 3
only)
Unit
Georgia 573.31 163.55 736.86 18 g CO2 / kWh
Germany 489.16 148.45 637.62 10.75 g CO2 / kWh
Greece 702.74 213.51 916.25 14.44 g CO2 / kWh
Guam 573.31 163.55 736.86 18 g CO2 / kWh
Hong Kong 882.46 327.19 1 209.65 0.01 g CO2 / kWh
Hungary 366.99 102.26 469.25 1.72 g CO2 / kWh
India 944.79 540.08 1 484.87 15.57 g CO2 / kWh
Indonesia 573.31 163.55 736.86 21.46 g CO2 / kWh
Ireland 473.54 215.63 689.17 2.85 g CO2 / kWh
Italy 388.31 101.03 489.34 22.13 g CO2 / kWh
Japan 485.68 82.19 567.87 16.27 g CO2 / kWh
Kuwait 573.31 163.55 736.86 18 g CO2 / kWh
Lithuania 573.31 163.55 736.86 18 g CO2 / kWh
Luxembourg 573.31 163.55 736.86 18.83 g CO2 / kWh
Macau 573.31 163.55 736.86 18 g CO2 / kWh
Malaysia 770.84 188.43 959.27 18.52 g CO2 / kWh
Mexico 492.12 183.9 676.03 19.58 g CO2 / kWh
Montenegro 573.31 163.55 736.86 18 g CO2 / kWh
Netherlands 466.94 104.76 571.71 0.44 g CO2 / kWh
New Zealand 132.31 42.26 174.57 19.78 g CO2 / kWh
Norway 0.96 21.34 22.29 21.49 g CO2 / kWh

13
15
Pakistan 573.31 163.55 736.86 21.8 g CO2 / kWh
Peru 573.31 163.55 736.86 18 g CO2 / kWh
Philippines 573.31 163.55 736.86 18 g CO2 / kWh
Poland 878.23 256.63 1 134.86 4.35 g CO2 / kWh
Portugal 311.99 157.48 469.47 11.2 g CO2 / kWh
Puerto Rico 573.31 163.55 736.86 18 g CO2 / kWh
Qatar 573.31 163.55 736.86 18 g CO2 / kWh
Romania 573.31 163.55 736.86 18 g CO2 / kWh
Russia 500.05 129.16 629.21 21.44 g CO2 / kWh
Serbia 573.31 163.55 736.86 21.8 g CO2 / kWh
Singapore 540.18 108.52 648.7 0.24 g CO2 / kWh
Slovakia 573.31 163.55 736.86 20.36 g CO2 / kWh
Slovenia 573.31 163.55 736.86 18 g CO2 / kWh
South Africa 573.31 163.55 736.86 18 g CO2 / kWh
South Korea 532.1 100.09 632.19 19.16 g CO2 / kWh
Spain 301.69 141.46 443.15 12.09 g CO2 / kWh
Sweden 15.57 16.09 31.66 16.96 g CO2 / kWh
Switzerland 9.52 15.01 24.53 20.37 g CO2 / kWh
Taiwan 673.87 143.98 817.85 12.79 g CO2 / kWh
ELECTRICITY EMISSION FACTORS
Value scope 2 (conventional
electricity)
Value scope 3 (conventional
electricity)
Total value conventional
electricity (scope 2+3)
Value green
electricity (scope 3
only)
Unit
Turkey 462.77 165.66 628.43 19.83 g CO2 / kWh
Ukrain 573.31 163.55 736.86 21.44 g CO2 / kWh
United Arab Emirates 573.31 163.55 736.86 18 g CO2 / kWh
United Kingdom 444.83 124.26 569.09 5.16 g CO2 / kWh
United States of America 542.76 138.68 681.44 14.15 g CO2 / kWh
Uruguay 573.31 163.55 736.86 18 g CO2 / kWh
Vietnam 526.01 433.26 959.27 21.7 g CO2 / kWh
Precisions on the Group’s pro forma year-on-
year change in CO2 emissions
In order to have a comparable basis for the pro
forma variation, the emission factors in 2014 are
the same than in 2013.

14
15
External verification by
statutory auditors
For the eighth year in a row, the extra-financial data
published in the Reference document were verified by
one of the statutory auditors, Deloitte & Associés.
Pursuant to Article L.225-102-1 of the French
Commercial Code, Kering has appointed one of its
Statutory Auditors as independent third party responsible
for the verification of the information published in
Chapter 3 of the 2014 reference document. The report
by the Statutory Auditor published page 113 of the 2014
reference document concerns the presence and the
fairly presentation of the qualitative and quantitative
published environmental, social and societal information.
In accordance with professional auditing standards
applicable in France, with the order of May 13, 2013
determining the methodology according to which the
independent third party entity conducts its assignment,
Deloitte & Associés’ work has consisted to:
verify data-collection processing and control
procedure to ensure the completeness and
consistency of the CSR Information;
perform analytical procedures on the quantitative
information and verified, using sampling techniques,
the calculations and the data consolidation;
consult the documentary sources and conduct
interviews to corroborate the qualitative information
(organization, policies, actions);
verify the consistency of the CSR Information
presented in the management report.
The report issued by our Statutory Auditors can be found
in page 122 to 124 of Kering 2014 Reference document.
