environmental assessment of shell canada ltd.’s · pdf fileenvironmental assessment of...
TRANSCRIPT

Environmental Assessment of Shell Canada Ltd.’s
Shelburne Basin 3-D Seismic Survey
Prepared by
for
April 2013 Project No. SA1175


Environmental Assessment of Shell Canada Ltd.’s
Shelburne Basin 3-D Seismic Survey
Prepared by
LGL Limited environmental research associates
388 Kenmount Road, Box 13248, Stn. A. St. John’s, NL A1B 4A5
Tel: 709-754-1992 [email protected]
www.lgl.com
and
P.O. Box 205, Mahone Bay, NS, B0J 2E0 [email protected]
Tel: 902-478-2268
Prepared for
Shell Canada Limited 400 4th Avenue SW Calgary, AB T2P 0J1
April 2013 Project No. SA1175

Suggested format for citation: LGL Limited. 2013. Environmental assessment of Shell Canada Ltd.’s Shelburne Basin 3-D Seismic Survey. LGL Rep.
SA1175. Rep. by LGL Limited, St. John’s, NL and Mahone Bay, NS, for Shell Canada Limited, Calgary, AB. 127p + Appendices.

Shelburne Basin 3-D Seismic Survey LGL Limited Environmental Assessment Page ii
Table of Contents Page Table of Contents ..................................................................................................................................... ii List of Figures .......................................................................................................................................... vi List of Tables .......................................................................................................................................... vii List of Acronyms .....................................................................................................................................viii 1.0 Introduction ................................................................................................................................... 1
1.1 The Proponent ................................................................................................................... 2 1.1.1 Proponent’s Objectives for the Project ............................................................... 2 1.1.2 Proponent’s Management System ..................................................................... 3
1.2 Social Responsibility and Canada-Nova Scotia Benefits .................................................. 4 1.3 Contacts ............................................................................................................................ 4
2.0 Proposed Project ........................................................................................................................... 6 2.1 Name and Location ........................................................................................................... 6 2.2 Spatial and Temporal Boundaries ..................................................................................... 6 2.3 Project Overview ............................................................................................................... 7
2.3.1 Wide Azimuth Versus Narrow Azimuth Seismic Surveys ................................... 8 2.3.2 Project Phases and Scheduling ........................................................................ 10 2.3.3 Seismic Survey Site Plans ................................................................................ 10 2.3.4 Seismic Vessel(s) ............................................................................................. 12 2.3.5 Seismic Energy Source Parameters ................................................................. 12 2.3.6 Seismic Streamers ........................................................................................... 13 2.3.7 Geohazard Surveys .......................................................................................... 14 2.3.8 Logistics and Support ....................................................................................... 14
2.3.8.1 Picket Vessel ............................................................................... 14 2.3.8.2 Supply Vessel .............................................................................. 14 2.3.8.3 Helicopter ..................................................................................... 15 2.3.8.4 Shore Base .................................................................................. 15
2.3.9 Waste Management ......................................................................................... 15 2.3.10 Air Emissions .................................................................................................... 15 2.3.11 Malfunctions and Accidental Events ................................................................. 15
3.0 Environmental Assessment Scoping ........................................................................................... 16 3.1 Regulatory Context and Considerations .......................................................................... 16 3.2 Scoping Document .......................................................................................................... 17
3.2.1 Factors to be Considered and Key Interactions ............................................... 17 3.2.2 Identification of Valued Environmental Components ........................................ 18
3.2.2.1 Species of Special Status ............................................................ 18 3.2.2.2 Special Areas ............................................................................... 19 3.2.2.3 Other Ocean Users ...................................................................... 19
3.2.3 Malfunctions and Accidental Events ................................................................. 19 3.2.4 Cumulative Effects ............................................................................................ 19
3.3 Temporal and Spatial Assessment Boundaries .............................................................. 19 3.3.1 Temporal .......................................................................................................... 19 3.3.2 Spatial ............................................................................................................... 20
3.3.2.1 Project Area ................................................................................. 20 3.3.2.2 Study Area ................................................................................... 20

Shelburne Basin 3-D Seismic Survey LGL Limited Environmental Assessment Page iii
3.3.2.3 Regional Area .............................................................................. 20 3.4 Stakeholder Engagement ................................................................................................ 20
4.0 Effects Assessment Procedures ................................................................................................. 22 4.1 Effects Definitions and Evaluation of Significance .......................................................... 22
4.1.1 Magnitude of Effects ......................................................................................... 22 4.1.2 Geographic Extent ............................................................................................ 23 4.1.3 Duration of Effects ............................................................................................ 23 4.1.4 Ecological/Social-cultural and Economic Context............................................. 24 4.1.5 Significance of Environmental Effects .............................................................. 24 4.1.6 Level of Confidence .......................................................................................... 24
4.2 Noise Criteria for Assessing Effects ................................................................................ 24 4.2.1 Marine Mammals .............................................................................................. 25
4.2.1.1 Auditory Weighting Function ........................................................ 27 4.2.2 Sea Turtles ....................................................................................................... 27 4.2.3 Fishes ............................................................................................................... 27
4.3 Cumulative Effects .......................................................................................................... 28 4.4 Follow-up Monitoring ....................................................................................................... 28
5.0 Acoustic Modelling ...................................................................................................................... 29 5.1 Precautionary Steps ........................................................................................................ 30
6.0 Effects on Valued Environment Components ............................................................................. 32 6.1 Species of Special Status ................................................................................................ 32
6.1.1 SARA Schedule 1 Species ............................................................................... 36 6.1.1.1 North Atlantic Right Whale ........................................................... 37 6.1.1.2 Blue Whale ................................................................................... 40 6.1.1.3 Northern Bottlenose Whale .......................................................... 43 6.1.1.4 Fin Whale ..................................................................................... 45 6.1.1.5 Sowerby’s Beaked Whale ............................................................ 48 6.1.1.6 Leatherback Sea Turtle ................................................................ 50 6.1.1.7 Wolffishes .................................................................................... 53 6.1.1.8 White Shark ................................................................................. 56 6.1.1.9 Roseate Tern ............................................................................... 57 6.1.1.10 Red Knot ...................................................................................... 59
6.1.2 Migratory Birds ................................................................................................. 60 6.1.2.1 Temporal and Spatial Distributions .............................................. 60 6.1.2.2 Effects Assessment ..................................................................... 62
6.2 Special Areas .................................................................................................................. 63 6.2.1 Special Areas Proximate to Study Area ........................................................... 65
6.2.1.1 Northeast Channel Coral Conservation Area ............................... 65 6.2.1.2 Hell Hole ...................................................................................... 65 6.2.1.3 Redfish Nursery Closure Area ..................................................... 65
6.2.2 Special Areas that “Overlap” the Study Area .................................................... 65 6.2.2.1 Roseway Basin Right Whale Critical Habitat ............................... 65 6.2.2.2 Haddock Box ................................................................................ 69 6.2.2.3 Scotian Slope/Shelf Break EBSA ................................................. 70 6.2.2.4 Haddock Spawning Closure Area ................................................ 72 6.2.2.5 LFA 40 Lobster Closure Area ...................................................... 72 6.2.2.6 Georges Bank Moratorium Area (GBMA) .................................... 73
6.3 Other Ocean Users ......................................................................................................... 74

Shelburne Basin 3-D Seismic Survey LGL Limited Environmental Assessment Page iv
6.3.1 Commercial Fisheries ....................................................................................... 74 6.3.1.1 Commercial Fisheries (2005 to 2010) .......................................... 75
6.3.2 Marine Shipping ................................................................................................ 88 6.3.2.1 Background .................................................................................. 88 6.3.2.2 Effects Assessment ..................................................................... 90
6.3.3. DFO Scientific Research .................................................................................. 90 6.3.3.1 Background .................................................................................. 90 6.3.3.2 Effects Assessment ..................................................................... 91
6.3.4 Department of National Defence (DND) Operations......................................... 92 6.3.4.1 Background .................................................................................. 92 6.3.4.2 Effects Assessment ..................................................................... 93
7.0 Malfunctions and Accidental Events ........................................................................................... 94 7.1 Scenarios ........................................................................................................................ 94 7.2 Mitigations ....................................................................................................................... 95 7.3 Effects Assessment ......................................................................................................... 95
7.3.1 Marine Mammals and Sea Turtles .................................................................... 95 7.3.2 Migratory Birds ................................................................................................. 96 7.3.3 Invertebrates and Fishes .................................................................................. 96 7.3.4 Special Areas ................................................................................................... 96 7.3.5 Commercial Fisheries ....................................................................................... 97
8.0 Effects of the Environment on the Project ................................................................................... 98 9.0 Cumulative Effects .................................................................................................................... 100 10.0 Follow-up Program .................................................................................................................... 102
10.1 Marine Mammals and Sea Turtles ................................................................................ 102 10.1.1 Visual and Acoustic (PAM) Monitoring ........................................................... 102
10.2 Seabirds ........................................................................................................................ 102 10.2.1 Standardized Counts ...................................................................................... 102 10.2.2 Monitoring for Stranded Birds ......................................................................... 103
10.3 Benthic Environment ..................................................................................................... 103 11.0 Assessment Summary .............................................................................................................. 104
11.1 Marine Mammals/Sea Turtles and Airgun Array Noise ................................................. 104 11.1.1 Ramp Up ........................................................................................................ 104 11.1.2 Line Changes ................................................................................................. 104 11.1.3 Selection of a Safety Zone for Shut Downs .................................................... 104 11.1.4 Delay of Ramp Up .......................................................................................... 105 11.1.5 Shut Downs .................................................................................................... 105
11.2 Special Areas and Airgun Array Noise .......................................................................... 105 11.3 Lighting and Stranded Birds .......................................................................................... 106 11.4 Fisheries Interactions .................................................................................................... 106 11.5 Interactions with Other Ocean Users ............................................................................ 106 11.6 General Ship Operations and Seismic Gear ................................................................. 107 11.7 Vessel Wastes and Air Emissions ................................................................................. 107 11.8 Malfunctions and Accidental Events .............................................................................. 107 11.9 Residual Effects of the Project ...................................................................................... 108
12.0 Literature Cited.......................................................................................................................... 117

Shelburne Basin 3-D Seismic Survey LGL Limited Environmental Assessment Page v
List of Appendices Appendix A: JASCO Modelling Report Appendix B: Scoping Document Appendix C: Summary of Consultations Appendix D: Review of the Effects of Airgun Sounds on Marine Mammals Appendix E: Review of the Effects of Airgun Sounds on Sea Turtles Appendix F: Review of the Effects of Airgun Sounds on Fishes Appendix G: Review of the Effects of Airgun Sounds on Marine Invertebrates Appendix H: Supplemental Fisheries Data

Shelburne Basin 3-D Seismic Survey LGL Limited Environmental Assessment Page vi
List of Figures Page Figure 1.1 Location of Shell’s Exploration Licenses. .......................................................................... 1 Figure 2.1 Locations of the 2013 Seismic Activity, Project, Study, and Regional areas. ................... 6 Figure 2.2 Potential 3D WAZ Seismic Vessel, Airgun Array, and Streamer Set Up for Vessel
Separation of 1,200 m ....................................................................................................... 8 Figure 2.3 Figure Comparison of 3D NAZ and WAZ Operational Footprints and Vessel
Configurations. .................................................................................................................. 9 Figure 2.4 WAZ Seismic Survey Line Spacing. ................................................................................ 11 Figure 2.5 Schematic of a Racetrack Turn Pattern. ......................................................................... 11 Figure 2.6 Schematic of an Anti-Parallel Turn Pattern. .................................................................... 12 Figure 5.1 Locations of the Acoustic Modelling Sites Within the Project Area. ................................ 31 Figure 6.1 Sightings of Marine Mammal and Sea Turtle Species Listed on Schedule 1 of SARA
(excluding fin whales) Observed from April–September, 1966–2012 (DFO database). ....................................................................................................................... 37
Figure 6.2 Sightings of Fin Whales Observed from April–September, 1966–2012 (DFO database). ....................................................................................................................... 46
Figure 6.3 Locations of Special Areas in and Near the Project Area. .............................................. 64 Figure 6.4 Predicted SPLs (rms) from the 5,085 in3 Airgun Array at the Closest Point of the
Project Area to the Right Whale Critical Habitat (modelling Site 01 in Appendix A) During April. SPLs are Maximum-over-depth Sound Levels (i.e., maximum estimates). ....................................................................................................................... 68
Figure 6.5 Predicted SPLs (rms) from the 5,085 in3 Airgun Array at the Closest Point of the Project Area to the Right Whale Critical Habitat (modelling Site 01 in Appendix A) During September. SPLs are Maximum-over-depth Sound Levels (i.e., maximum estimates). ......... 68
Figure 6.6 All species Domestic Commercial Harvesting Locations, April to September 2005 to 2010 Combined. .............................................................................................................. 75
Figure 6.7 Aggregated Catch Weight of all Groundfish and Pelagic Species in the 2013 Seismic Activity Area, April to September 2005 to 2010. ................................................ 79
Figure 6.8 Groundfish Domestic Commercial Harvesting Locations, April to September 2005 to 2010 Combined. .............................................................................................................. 80
Figure 6.9 Pelagic Domestic Commercial Harvesting Locations, April to September 2005 to 2010 Combined. .............................................................................................................. 80
Figure 6.10 Swordfish Domestic Commercial Harvesting Locations, April to September 2005 to 2010 Combined. .............................................................................................................. 81
Figure 6.11 Silver Hake Domestic Commercial Harvesting Locations, April to September 2005 to 2010 Combined. .......................................................................................................... 81
Figure 6.12 Haddock Domestic Commercial Harvesting Locations, April to September 2005 to 2010 Combined. .............................................................................................................. 82
Figure 6.13 Bigeye Tuna Domestic Commercial Harvesting Locations, April to September 2005 to 2010 Combined. .......................................................................................................... 82
Figure 6.14 Atlantic (striped) Wolffish Domestic Commercial Harvesting Locations, April to September 2005 to 2010 Combined. .............................................................................. 83
Figure 6.15 Average Monthly Catch Weight of all Species in the Study Area, 2005 to 2010. ............ 83 Figure 6.16 Average monthly Catch Weight of all Species in the Project Area, 2005 to 2010. .......... 84 Figure 6.17 Average Monthly Catch Weight of all Species in the 2013 Seismic Activity Area,
2005 to 2010. .................................................................................................................. 84

Shelburne Basin 3-D Seismic Survey LGL Limited Environmental Assessment Page vii
Figure 6.18 Approximate Locations of Seismic Streamer Deployment on the Scotian Shelf. ............ 87 Figure 6.19 Commercial Shipping Traffic Density in and Near the Project Area in 2000. .................. 90 Figure 6.20 Locations of DFO’s RAPID Moorings and AZMP Activities for 2013. .............................. 91 Figure 6.21 Designated DND Operations Areas in and Near the Project Area. ................................. 92
List of Tables Page Table 1.1 Shell’s Commitment and Policy on Health, Safety, Security, Environment, and
Social Performance. .......................................................................................................... 3 Table 2.1 Coordinates of the Project Area Corners (mapping projection: NAD27, UTM, Zone
20). .................................................................................................................................... 7 Table 6.1 SARA Schedule 1- and COSEWIC-listed Marine Species with Reasonable
Likelihood of Occurrence in the Study Area. ................................................................... 33 Table 6.2 Bird Species Included in Bird Families Listed in Article I of the Migratory Birds
Convention Act (1994) with Reasonable Likelihood of Occurrence in the Study Area. ... 34 Table 6.3 Average Domestic Harvest by Species within the Study Area, April to September
2005 to 2010. .................................................................................................................. 77 Table 6.4 Average Domestic Harvest by Species within the Project Area, April to September
2005 to 2010. .................................................................................................................. 77 Table 6.5 Average Domestic Harvest by Species within the 2013 Seismic Activity Area, April
to September 2005 to 2010. ............................................................................................ 78 Table 6.6 Average Annual Project Area Catch Weight by Gear Type, April to September 2005
to 2010. ........................................................................................................................... 85 Table 6.7 Average Annual 2013 Seismic Activity Area Catch Weight by Gear Type, April to
September 2005 to 2010. ................................................................................................ 85 Table 8.1 Annual Summary of Climatological and Oceanographic Features of the Project
Area. ................................................................................................................................ 99 Table 11.1 Summary of Potential Interactions, Mitigations, Significance Criteria Ratings,
Significance Ratings and Levels of Confidence Associated with the Proposed Project. .......................................................................................................................... 109

Shelburne Basin 3-D Seismic Survey LGL Limited Environmental Assessment Page viii
List of Acronyms 2D Two Dimensional (seismic survey) 3D Three Dimensional (seismic survey) AASM Airgun Array Source Model AZMP Atlantic Zone Monitoring Program C-NLOPB Canada-Newfoundland and Labrador Offshore Petroleum Board CNSOPB Canada-Nova Scotia Offshore Petroleum Board CEAA Canadian Environmental Assessment Act COSEWIC Committee on the Status of Endangered Wildlife in Canada CSAS Canadian Science Advisory Secretariat CV Coefficient of Variation CWS Canadian Wildlife Service DFO Department of Fisheries and Oceans Canada DND Department of National Defence EA Environmental Assessment EAC Ecology Action Centre EBSA Ecologically and Biologically Significant Area EC Environment Canada ECSAS Eastern Canada Seabirds at Sea EL Exploration Licence EEZ Exclusive Economic Zone FAC Fisheries Advisory Committee FLO Fisheries Liaison Officer FWRAM Full-Waveform Range-dependent Acoustic Model GBMA Georges Bank Moratorium Area HSE Health, Safety, Environment HSSE Health, Safety, Security, Environment IMO International Maritime Organization KMKNO Mi’kmaq Kwilmu’kw Maw-Klusuaqn Negotiation Office LFA Lobster Fishing Area MARLANT Maritime Forces Atlantic MARPOL International Convention for the Prevention of Pollution from Ships MDO Marine Diesel Oil MGO Marine Gas Oil MMO Marine Mammal Observer MONM Marine Operations Noise Model NAFO North Atlantic Fisheries Organization NOAA National Oceanic and Atmospheric Administration NAZ Narrow Azimuth NMFS National Marine Fisheries Service NS Not Significant NSLTWG Nova Scotia Leatherback Turtle Working Group PAM Passive Acoustic Monitoring PE Parabolic Equation PTS Permanent Threshold Shift RAM Range-dependent Acoustic Model RAPID Rapid Climate Change Program (UK) RL Received Level RV Research Vessel

Shelburne Basin 3-D Seismic Survey LGL Limited Environmental Assessment Page ix
List of Acronyms (Cont’d) SAG Surface Active Group SARA Species at Risk Act SDL Significant Discovery Licence SEA Strategic Environmental Assessment SEL Sound Exposure Level SL Source Level SP Social Performance SPL Sound Pressure Level TTS Temporary Threshold Shift VEC Valued Environmental Component WAZ Wide Azimuth WWF World Wildlife Fund

Shelburne Basin 3-D Seismic Survey LGL Limited Environmental Assessment Page 1
1.0 Introduction Shell Canada Limited (Shell or the Proponent) is proposing to conduct three dimensional (3D) seismic surveys in the southwest Scotian Slope region of the Nova Scotia offshore commencing in the second or third quarter 2013. Pursuant to the acquisition of its Exploration Licenses (ELs), Shell has committed to conducting an exploration program within its ELs 2423, 2424, 2425, 2426, 2429 and 2430 during the initial six–year exploration period, which commenced on 1 March 2012 for ELs 2423 to 2426 and January 15, 2013 for ELs 2429 and 2430. Note that a portion of EL 2429 extends beyond the northern boundary of the Project Area and is therefore outside the scope of the EA. These ELs cover an area of approximately 1,984,540 ha or 19,845 km2 and are located approximately 300 km south of Halifax Nova Scotia (Figure 1.1). Geohazard surveys are also proposed during this exploration period to identify seabed hazards at future drilling sites. These surveys may involve the collection of high resolution two dimensional (2D) seismic, side-scan sonar, or multi-beam sonar data. Collectively, the above activities will be referred to as “the Project”.
Figure 1.1 Location of Shell’s Exploration Licenses. This document is an environmental assessment (EA) designed to apply to the Project (i.e. all geophysical surveys (seismic and geohazard) conducted over the ELs during their respective six-year exploration periods) and intended to enable the Canada-Nova Scotia Offshore Petroleum Board (CNSOPB) to fulfill its responsibilities under Section 142(1)(b) of the Canada-Nova Scotia Offshore Petroleum Resources Accord Implementation Act. This EA has been guided by a Scoping Document
Shelburne Basin 3-D Seismic Survey LGL Limited Environmental Assessment Page 2
released by the CNSOPB on 4 October 2012 as well as technical and scoping advice received from the CNSOPB, other federal agencies, and stakeholders engaged by the Proponent.
1.1 The Proponent Shell has been active in Canada since 1911 and is now one of the country’s largest integrated oil and gas companies. Headquartered in Calgary, Alberta, Shell employs more than 8,000 people across Canada. Shell’s core values of honesty, integrity and respect for people form the basis of the Shell General Business Principles. Shell works with neighbouring communities, employees, First Nations, governments, and other stakeholders to reduce effects and to develop appropriate ways to provide benefits from their operations. Shell's Upstream businesses explore for and extract crude oil and natural gas. Shell’s Downstream businesses refine, supply, trade and ship crude oil worldwide as well as manufacturing and marketing a range of products. Shell’s experience operating offshore Nova Scotia dates back almost 50 years. Since the company acquired its first leases offshore in 1963 (~20 million acres), Shell has participated in 77 or close to one-third of the nearly 200 wells drilled offshore Nova Scotia to date. Shell drilled Nova Scotia’s first offshore gas discovery well, Onondaga B-84 in 1969. Nova Scotia’s first offshore rig made at the Halifax shipyards, the semi-submersible Sedco H, was built and put into service by Shell in 1970. Shell drilled 24 wells in the early 1970s and had an active exploration program through the 1980s, which involved drilling the first deepwater well (Shubenacadie H-100) and led to significant new gas discoveries (Glenelg, Alma, North Triumph). These discoveries resulted in the development of the Sable Offshore Energy Project, of which Shell has a 31.3% interest. As a result of Shell’s activities, the company holds 28 Significant Discovery Licences (SDL) in the Nova Scotia offshore, including the Primrose, Onondaga, Intrepid, Chebucto and Uniacke discoveries near Sable Island. In 2000 to 2004, Shell conducted an exploration program that included a large seismic program on two deep water ELs and participated with EnCana in drilling the Weymouth A-45 well (in 2004). The company’s last 100% interest well was drilled in 2002 on the Onondaga B-84 discovery. Shell owns a 100% working interest in and is the operator of EL 2423, 2424, 2425 and 2426, 2429 and 2430. ELs 2423, 2424, 2425 and 2426 were acquired in March 2012. ELs 2429 and 2439 were acquired in January 2013. 1.1.1 Proponent’s Objectives for the Project The primary objective of the proposed 3D seismic survey is to identify potential drilling targets. Shell is presently examining vintage 2D seismic data for EL 2423, 2424, 2425, 2426, 2429 and 2430 to gain a better understanding of the regional geology, but due to the geological complexity of the Scotian Slope region, acquisition of 3D seismic data is considered to be the most effective method to accurately map subsurface features in this area and more appropriately identify potential drilling locations. Once a potential drilling site is located it is standard offshore industry procedure, and a requirement of the CNSOPB, to conduct a geohazard survey or examine pre-existing survey data to identify, and thus avoid, any potential shallow drilling hazards. Drilling hazards could include steep and/or unstable substrates or pockets of “shallow gas” and seabed obstructions (man-made or natural).
Shelburne Basin 3-D Seismic Survey LGL Limited Environmental Assessment Page 3
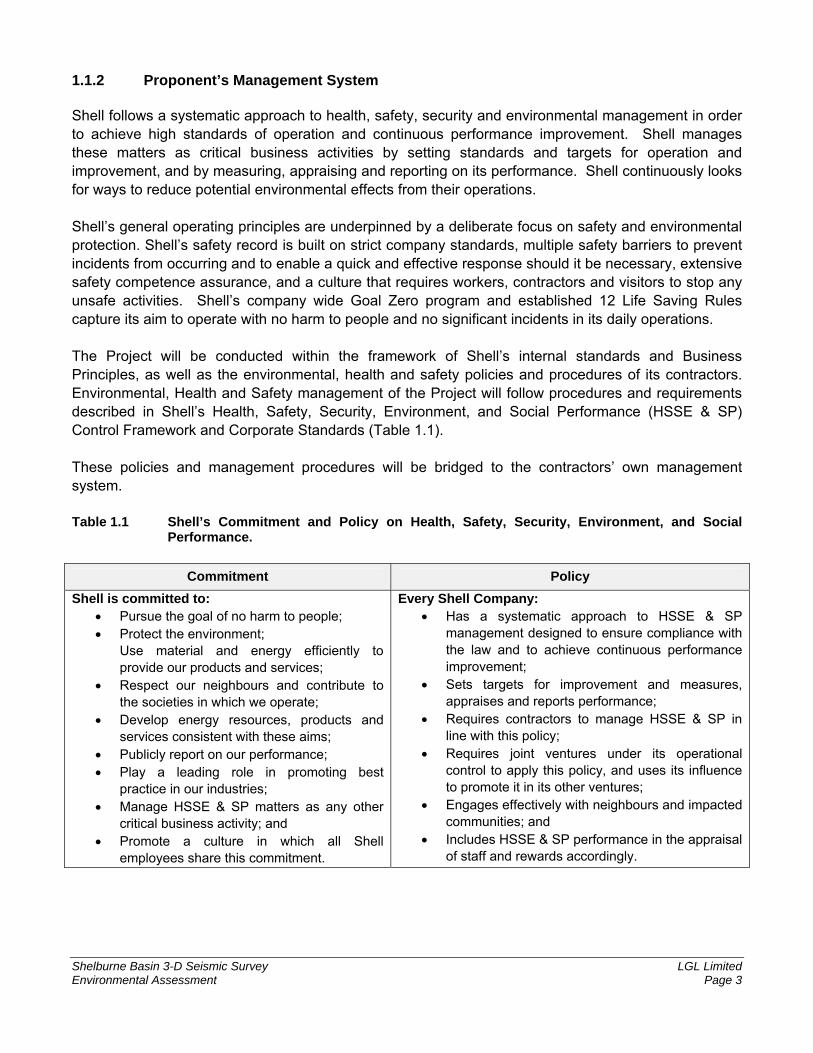
1.1.2 Proponent’s Management System Shell follows a systematic approach to health, safety, security and environmental management in order to achieve high standards of operation and continuous performance improvement. Shell manages these matters as critical business activities by setting standards and targets for operation and improvement, and by measuring, appraising and reporting on its performance. Shell continuously looks for ways to reduce potential environmental effects from their operations. Shell’s general operating principles are underpinned by a deliberate focus on safety and environmental protection. Shell’s safety record is built on strict company standards, multiple safety barriers to prevent incidents from occurring and to enable a quick and effective response should it be necessary, extensive safety competence assurance, and a culture that requires workers, contractors and visitors to stop any unsafe activities. Shell’s company wide Goal Zero program and established 12 Life Saving Rules capture its aim to operate with no harm to people and no significant incidents in its daily operations. The Project will be conducted within the framework of Shell’s internal standards and Business Principles, as well as the environmental, health and safety policies and procedures of its contractors. Environmental, Health and Safety management of the Project will follow procedures and requirements described in Shell’s Health, Safety, Security, Environment, and Social Performance (HSSE & SP) Control Framework and Corporate Standards (Table 1.1). These policies and management procedures will be bridged to the contractors’ own management system. Table 1.1 Shell’s Commitment and Policy on Health, Safety, Security, Environment, and Social
Performance.
Commitment Policy
Shell is committed to: Pursue the goal of no harm to people; Protect the environment;
Use material and energy efficiently to provide our products and services;
Respect our neighbours and contribute to the societies in which we operate;
Develop energy resources, products and services consistent with these aims;
Publicly report on our performance; Play a leading role in promoting best
practice in our industries; Manage HSSE & SP matters as any other
critical business activity; and Promote a culture in which all Shell
employees share this commitment.
Every Shell Company: Has a systematic approach to HSSE & SP
management designed to ensure compliance with the law and to achieve continuous performance improvement;
Sets targets for improvement and measures, appraises and reports performance;
Requires contractors to manage HSSE & SP in line with this policy;
Requires joint ventures under its operational control to apply this policy, and uses its influence to promote it in its other ventures;
Engages effectively with neighbours and impacted communities; and
Includes HSSE & SP performance in the appraisal of staff and rewards accordingly.

Shelburne Basin 3-D Seismic Survey LGL Limited Environmental Assessment Page 4
All operations relating to the Project will be required as a minimum to comply with Shell standards and with external regulatory standards. Where requirements differ, the more stringent requirement will apply. Shell will require contractors to demonstrate that they have in place a Health, Safety and Environment (HSE) Management System compatible with these standards, and that they are committed to implementing it. In the event that sub-contractors are used, the main contractor will be required to ensure that these sub-contractors also conform to the same standards and requirements.
1.2 Social Responsibility and Canada-Nova Scotia Benefits Shell recognizes the importance of providing benefits associated with the Project to both Canada and Nova Scotia. Consistent with the requirements of the Accord Acts, Shell is committed to enhancing the opportunities for Canadian and, in particular, Nova Scotian participation. Section 45 of the Accord Acts establishes the requirement that an Operator have an approved Benefits Plan prior to the approval or authorization of any work or activity in the Nova Scotia Offshore Area. In addition, the Accord Acts outline the specific provisions that the Operator must commit to within its Benefits Plan (CNSOPB 2011). Shell has recently opened an office in Halifax to support the Project. Shell will provide full and fair opportunity to Canadian individuals and organizations, in particular those from Nova Scotia, to participate in exploration activities off Nova Scotia. Shell supports the principle that first consideration be given to personnel, support and other services that can be provided within Nova Scotia, and to goods manufactured in Nova Scotia, where such goods and services can be delivered at a high standard of Health, Safety and Environmental competency, be of high quality and are competitive in terms of fair market price. Contractors and sub-contractors working for Shell in Nova Scotia must also apply these principles in their operations.
1.3 Contacts Relevant Shell contacts for the seismic program include: Erik Goodwin Robert M. Lupton, P.Geo. Exploration Team Lead Geophysical Lead Nova Scotia Venture Upstream Americas Exploration Shell Deepwater Americas Shell Canada Limited Houston, TX, USA P.O. Box 100, Station M Phone: (281) 450-5841 Calgary, AB T2P 2H5 [email protected] Phone : (403) 691-3215 [email protected] Candice Cook-Ohryn Regulatory/Environment Lead Shell Canada Limited 400 4th Avenue S.W. Calgary, AB T2P 0J1 Phone: (403) 384-8747 [email protected]

Shelburne Basin 3-D Seismic Survey LGL Limited Environmental Assessment Page 5
Larry Lalonde Manager, Communications – Canada Exploration and Commercial Projects Shell Canada Limited 400 – 4th Avenue S.W. Calgary, AB T2P 0J1 Phone; (403) 691-2168 [email protected]
Scott McDonald, P.Eng East Coast Operations Manager Shell Canada Limited 1701 Hollis Street 9th Floor Founders Square Halifax, NS. B3J 3M8 Phone: (902) 471-3798 [email protected]

Shelburne Basin 3-D Seismic Survey LGL Limited Environmental Assessment Page 6
2.0 Proposed Project
2.1 Name and Location The Project has been designated as the “Shelburne Basin 3D Seismic Survey.” As part of the Project, Shell may acquire seismic data near and in ELs 2423, 2424, 2425, 2426, 2429 and 2430 located approximately 300 km south of Halifax, NS. The small northern portion of EL 2429 that occurs outside of the Project Area (Figure 2.1) is not included within the scope of this EA and thus seismic acquisition in this area will not be conducted in association with this Project. 2.2 Spatial and Temporal Boundaries The spatial boundaries of the Project Area, the area where geophysical data could be acquired plus an additional area around the outer perimeter of the data acquisition area to accommodate the ships’ turning radii, are shown in Figure 2.1. The coordinates of the Project Area (Easting and Northings, NAD27, Zone 20N) are presented in Table 2.1. Water depth in the Project Area ranges from approximately 500 m to >4,000 m. Also shown are the Study Area and Regional Area, which extend beyond the Project Area and are discussed in more detail in Section 3.3.
Figure 2.1 Locations of the 2013 Seismic Activity, Project, Study, and Regional areas.

Shelburne Basin 3-D Seismic Survey LGL Limited Environmental Assessment Page 7
Table 2.1 Coordinates of the Project Area Corners (mapping projection: NAD27, UTM, Zone 20).
Project Area “Corner” NAD27, UTM Zone 20
Easting Northing NE 622761.6075 4733929.615 SE 625199.3373 4595137.543 SW 333065.7148 4595982.469 NW 500 m Isobath, South 335235.287 4688979.017 NW 500 m Isobath, North 422793.716 4733270.155
Seismic and geohazard surveys will be conducted during the April to September timeframe within the term of the ELs (see Section 2.3.2 for more details).
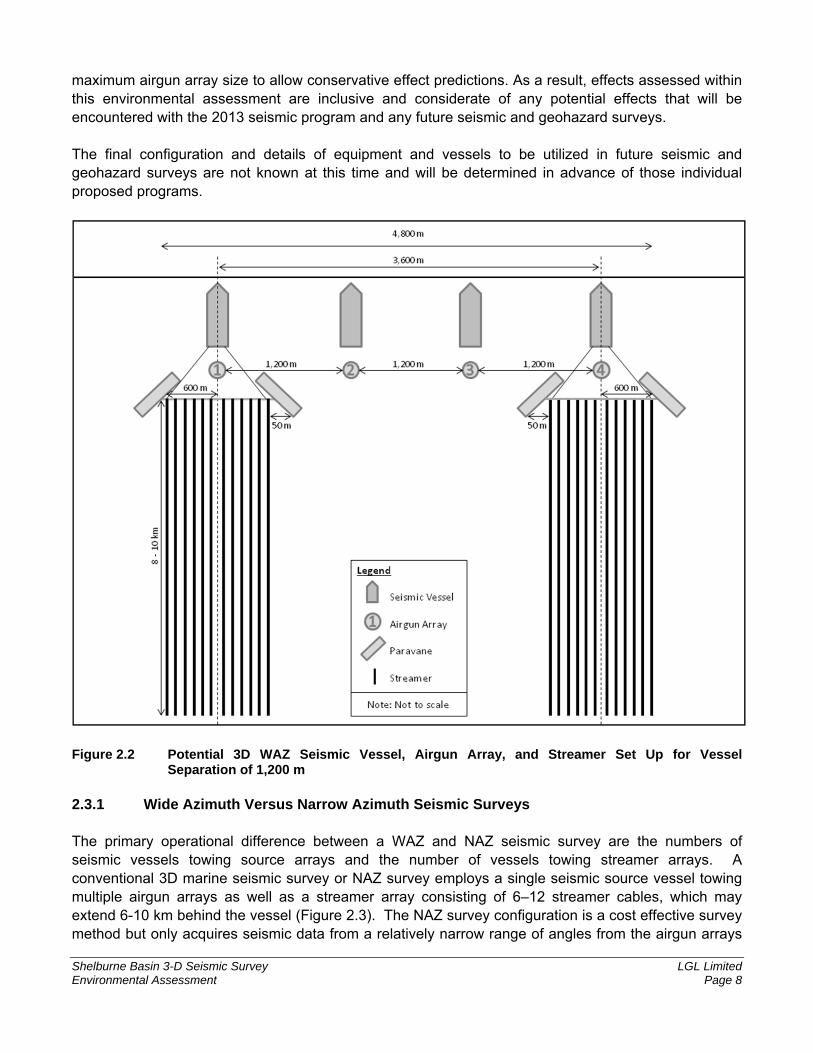
2.3 Project Overview Shell is proposing to conduct 3D seismic surveys and geohazard surveys in a phased approach (see Section 2.3.2 below) in and near ELs 2423, 2424, 2425, 2426, 2429 and 2430. In 2013 (Phase 1) and potentially for future seismic surveys for this Project, a proposed 3D seismic survey will utilize a Wide Azimuth (WAZ) configuration, which varies from a conventional Narrow Azimuth (NAZ) survey configuration. The key differences between NAZ and WAZ seismic surveys are presented in Section 2.3.1. The 3D seismic survey area proposed for 2013 is indicated in Figure 2.1. The WAZ configuration involves the use of multiple seismic vessels to gain a wider range of angles from the airgun array to the receivers and is typically employed in areas where the geological setting is complex. The details of the WAZ survey are not finalized at present but the 2013 survey is expected to involve four vessels, all towing airgun source arrays with the two outer vessels also towing streamers (which contain the receivers) (Figure 2.2). Though the WAZ configuration includes multiple vessels towing airgun arrays, the arrays are not activated simultaneously but instead are activated sequentially (i.e., only one airgun array is activated at a time across all vessels) (see Section 2.3.5). This configuration is designed to enhance the efficiency of the operation and to provide a more complete image of the subsurface. Prior to any drilling activity, Shell will conduct a comprehensive geohazard assessment of each proposed drill site—this will involve evaluating existing 2D and 3D seismic data as well as conducting geohazard surveys. Geohazard surveys will be conducted to locate and identify potential hazards to drilling on the seabed (e.g., pipelines, wrecks, telecommunication cables) and within the first few hundred meters below the seafloor (e.g., pockets of shallow gas, deposits of gas hydrates). It is anticipated that geohazard surveys would occur during 2014 to 2018 (Phase 2). Section 2.3.7 provides an overview of the types of survey equipment that are proposed for use during future geohazard surveys. The technical details associated with the 2013 seismic survey are currently being finalized and provided to the CNSOPB as available. The current anticipation is for the survey to utilize a four vessel fleet inclusive of two streamer vessels and two additional source vessels. The streamer vessels will function as the outside vessels with the two additional source vessels functioning as the inner vessels as detailed in Figure 2.2. All vessels will be separated by 1200m. As the details associated with the 2013 survey were not available at the time of conducting this assessment, it was based on the anticipated maximum numbers of survey vessels and streamers; the likely spacing between seismic vessels; and
Shelburne Basin 3-D Seismic Survey LGL Limited Environmental Assessment Page 8
maximum airgun array size to allow conservative effect predictions. As a result, effects assessed within this environmental assessment are inclusive and considerate of any potential effects that will be encountered with the 2013 seismic program and any future seismic and geohazard surveys. The final configuration and details of equipment and vessels to be utilized in future seismic and geohazard surveys are not known at this time and will be determined in advance of those individual proposed programs.
Figure 2.2 Potential 3D WAZ Seismic Vessel, Airgun Array, and Streamer Set Up for Vessel
Separation of 1,200 m 2.3.1 Wide Azimuth Versus Narrow Azimuth Seismic Surveys The primary operational difference between a WAZ and NAZ seismic survey are the numbers of seismic vessels towing source arrays and the number of vessels towing streamer arrays. A conventional 3D marine seismic survey or NAZ survey employs a single seismic source vessel towing multiple airgun arrays as well as a streamer array consisting of 6–12 streamer cables, which may extend 6-10 km behind the vessel (Figure 2.3). The NAZ survey configuration is a cost effective survey method but only acquires seismic data from a relatively narrow range of angles from the airgun arrays

Shelburne Basin 3-D Seismic Survey LGL Limited Environmental Assessment Page 9
to the receivers (i.e. hydrophones in the streamers) and thus is best suited where the geological setting is considered fairly simple.
In contrast, a 3D WAZ survey typically involves the use of multiple seismic vessels sailing as a single coordinated unit while towing multiple source and streamer arrays. This allows the recording of a wider range of angles from the airgun array to the receivers and is typically employed in areas where the geological setting is complex. It is expected that Shell’s 2013 WAZ survey will involve four seismic source vessels, all towing airgun arrays with the two outer vessels also towing streamers (Figure 2.2). As a result of the additional seismic vessels associated with a WAZ survey, the ‘operational footprint’ in the water is larger than that of a NAZ survey. The width of the WAZ configuration for the 2013 seismic survey is nominally 4.8 km whereas a typical NAZ survey (assuming 12 streamers) would be 1.2 km (Figure 2.3).
Figure 2.3 Figure Comparison of 3D NAZ and WAZ Operational Footprints and Vessel Configurations. Line changes in a marine 3D seismic project typically take a considerable amount of time to complete. The larger footprint of the WAZ survey in comparison to a NAZ survey means that more time will be required to turn the source vessels for a survey line change. A NAZ vessel typically requires 2–3 hours to turn, whereas it is expected to take 5–7 hours, dependent on the width and length of the seismic array, to turn the WAZ vessels. In addition, up to 5 picket vessels may be required to support the WAZ source vessels versus 1–2 picket vessel(s) typically required for a NAZ survey. WAZ and NAZ seismic surveys also have a number of similarities—separate airgun arrays are not activated simultaneously but rather are activated separately in sequence once every 10–15 seconds depending on vessel speed (approximately every 25–50 m); airgun array size is nominally 3,000–

Shelburne Basin 3-D Seismic Survey LGL Limited Environmental Assessment Page 10
6,000 in3; number of streamers per vessel is 6–12; and the length of streamers is nominally 8–10 km. Further information regarding the WAZ survey configuration is provided below. 2.3.2 Project Phases and Scheduling Shell anticipates that the Project will occur in at least two phases. Phase 1: involves the proposed 3D WAZ survey in 2013. It is anticipated that the 3D WAZ seismic survey will be at least 65 days in duration and occur during the period from mid-April to mid-September. Data acquisition is not expected to take longer than 120 days. Geohazard surveys are not expected to occur in 2013 as the seismic data gathered will require processing prior to potential drilling locations being selected. Phase 2: a smaller infill seismic survey may be conducted in 2014 within the mid-April to mid-September timeframe, likely requiring 45–65 days. The need for this survey and the type of survey is contingent upon the findings of the Phase 1 data. In addition, geohazard surveys will be conducted over potential drilling locations, requiring a 2 to 3 week timeframe at each location. Other seismic or geohazard surveys may occur within the term of the ELs. The need for additional surveys depends on the results of surveys conducted during previous phases. 2.3.3 Seismic Survey Site Plans The following sections cover details associated with the 2013 seismic survey. It is anticipated that future seismic surveys conducted over the term of the ELs would utilize similar parameters. In 2013, Shell is proposing to acquire approximately 8,500 km2 of fully imaged/migrated 3D seismic data. This acquisition will require that approximately 12,000 km2 of surface area be surveyed (see ‘2013 Seismic Activity Area’ in Figure 2.1). Water depth in the 2013 Seismic Activity Area ranges from approximately 1,500–3,500 m. The portion of EL 2429 that is beyond the Project Area will not be included in the 2013 seismic survey program. . The proposed survey in 2013 will likely be characterized by survey lines running East/Northeast–West/Southwest (approximately 71 degrees East of North). The survey lines will follow the general isobath trend of the shelf slope and be spaced approximately 1,200 m apart (i.e., the distance between adjacent seismic survey lines is 1,200 m; Figure 2.4). At the end of each survey line, the vessels will require a 10–15 km turning radius to re-align with the subsequent survey line. Each line change is likely to take between 5–7 hours to complete dependant on the width and length of the streamer array being towed. Line changes associated with WAZ surveys can be classified into two broad categories, race-track and anti-parallel. During a race-track turn, aptly titled as a result of the race-track like pattern that is followed, vessels follow a roughly oval path from the end of one source line to the beginning of the subsequent source line approximately halfway across the survey area (Figure 2.5). During an anti-parallel turn pattern, vessels move from one line to the immediately adjacent line (i.e., 1,200 m spacing) utilizing a complicated turn pattern, which requires the individual vessels to separate at the end of each survey line and coordinate their associated turning patterns to realign for the

Shelburne Basin 3-D Seismic Survey LGL Limited Environmental Assessment Page 11
subsequent pass. Figure 2.6 illustrates a typical anti-parallel turn pattern for the purposes of this EA; the actual anti-parallel turn pattern can vary amongst seismic contractors.
Figure 2.4 WAZ Seismic Survey Line Spacing.
Figure 2.5 Schematic of a Racetrack Turn Pattern.

Shelburne Basin 3-D Seismic Survey LGL Limited Environmental Assessment Page 12
Figure 2.6 Schematic of an Anti-Parallel Turn Pattern. The distance travelled by the vessels from the end of one seismic line to the beginning of the subsequent line depends on the associated turn pattern. In an anti-parallel scenario, the total distance travelled from the end of the initial pass to the beginning of the subsequent pass could be 40-50 km. In the racetrack scenario the total distance travelled between subsequent lines would depend on how many lines they pass, but could be ~60 km. Both options would require similar turning radii (i.e., 10–15 km). 2.3.4 Seismic Vessel(s) Up to four seismic vessels may be used during the 3D WAZ survey. The vessels will likely range from 80-100 m in length and use some form of diesel-electric propulsion system. Each vessel will have a crew of about 50-70 people. Seismic vessels are designed to remain at sea for long periods of time and are typically equipped with helidecks that allow for crew change and light resupply via helicopter. The number and specifications of the vessels will be provided once the contractors are selected. Each seismic vessel will tow an airgun array. Only the two outermost vessels will tow seismic streamers. The vessels will operate side-by-side, likely with a 1,200 m separation between them (Figure 2.2). This will result in a maximum vessel/streamer swath size of 4.8 km x 10 km. Typical survey speed is 4.5 knots (8.3 km/h) to 5 knots (9.3 km/h). 2.3.5 Seismic Energy Source Parameters The seismic energy source consists of individual airguns arranged in an array. The airguns in the array are strategically arranged to direct most of the energy vertically downward rather than sideways (see Appendix D for a review of airgun sound characteristics). The exact parameters of the airgun arrays will be finalized and made available after Shell has chosen its seismic contractor. A generic description of
Shelburne Basin 3-D Seismic Survey LGL Limited Environmental Assessment Page 13
possible airgun arrays is provided here and is meant to give the reader a sense of the range of array parameters that may be used. In addition, a description of the airgun array used for acoustic modelling is provided below and detailed in Appendix A. The total volume of each of the airgun arrays utilized in the Project will be between 3,000 to 6,000 in3. Each seismic vessel will operate either one or two arrays. If two airgun arrays are used per vessel, they will be activated alternately (flip-flop arrangement) along the survey lines, typically every 10 seconds. The arrays will be towed at depths ranging from 8 to 10 m, approximately 100 m to 150 m astern of the seismic vessel. Airguns will be operated at 2,000 psi (pounds per square inch). For the 3D WAZ survey, each vessel’s source array will be activated individually, cycling from one array to the next in succession typically every 10-15 seconds along the survey line. Airgun arrays will not be activated simultaneously. For the purposes of acoustic modelling, a 24 airgun, 5,085 in3 array was used. This array was selected to represent the upper end of the typical array size range for the 2013 WAZ survey and potential future surveys. As a result, it is intended to provide a reasonable scenario that will illustrate the potential airgun pulse sound levels that could occur during the Project. The 5,085 in3 array consists of three sub-arrays, each with a volume of 1,695 in3 and consisting of 8 airguns ranging in volume from 105 in3 to 290 in3. The array length and width are 16 m each. A deployment depth of 10 m was assumed. The estimated source level (horizontal at 1 m) of the array is 248.2 re 1 µPa (zero to peak; endfire direction). 2.3.6 Seismic Streamers A seismic vessel will tow 8 to 12 streamers (strings of hydrophone sound receivers); each up to 8 or 10 km in length, to record the reflection of the airgun pulses from the earths subsurface during the seismic surveys. These streamers can be towed at depths ranging from 5 to 50 m below the water surface, but are typically towed 12 to 15 m below the surface. Dilt floats are utilized in vessels towing large numbers of streamers in order to keep the front end of the streamers at a specified depth. Paravanes are attached on each side of the seismic vessel to maintain a constant streamer spread. A tail buoy with radar reflectors will be installed at the end of each streamer to act as a warning beacon to nearby marine vessels. Streamers used in Shell’s seismic program will be either solid (contain no fluids) or fluid-filled. The 2013 seismic survey program as well as any surveys conducted in 2014 will utilize solid streamers, therefore mitigating the release of streamer fluids. If fluid-filled streamers are used for post-2014 seismic or geohazard surveys, the fluid used to control buoyancy is called Isopar-M. Isopar-M predominantly consists of isoparaffinic hydrocarbons (C12-C15). In a typical Isopar-filled streamer, each 100 m hydrophone section contains 11.7 L of Isopar divided amongst 78 hydrophone pockets. Each hydrophone pocket contains 150 mL of Isopar and is isolated and completely sealed from other pockets. This isolation of pockets greatly reduces the amount of hydrocarbons released in the event of streamer damage. For the 2013 WAZ survey, only the two outside seismic vessels will tow streamers (see Figure 2.2). The width of the array may extend from 400 to 600 m on either side of each of the seismic streamer vessels.

Shelburne Basin 3-D Seismic Survey LGL Limited Environmental Assessment Page 14
2.3.7 Geohazard Surveys It is anticipated that the geohazard program will involve acquisition of high resolution 2D seismic, side scan sonar, multi-beam sonar, sub-bottom profile, magnetometer, gravity, and bathymetric data over defined area(s) where drilling may occur. The streamer that will record the high resolution 2D seismic data will likely be solid core (contain no fluids) but there is some limited potential that a fluid-filled streamer will be used. A tail buoy will be used, equipped with a radar reflector and strobe light. No sediment samples will be acquired. Geohazard surveys are conducted on a much smaller scale than seismic surveys. These surveys typically utilize one survey vessel with closer line spacing, smaller equipment and lower pressures, and occur over a much shorter time period (i.e., several days) and much smaller survey area compared to 3D seismic programs. As a result, effects assessed within this environmental assessment are inclusive and considerate of any potential effects that will be encountered with future geohazard surveys. Geohazard surveys will be conducted at exploratory drill sites identified in future years. These surveys will follow the appropriate CNSOPB guidelines for Geophysical and Geological Programs in the Nova Scotia Offshore Area and have a line spacing of not more than 0.5 km in one direction and appropriate cross-tie lines and tie lines to adjacent wellsite surveys. Vessel and survey equipment specifics are not known at this time, but will be provided to the CNSOPB following contractor selection in advance of survey activities in future years. Most, if not all likely survey vessels will use diesel-electric propulsion systems (main and thrusters) and operate on marine diesel. Vessel speed during surveying is typically on the order of 4 to 5 knots. 2.3.8 Logistics and Support Offshore seismic operations will be supported by picket vessel(s) and supply vessel(s) and potentially a helicopter. 2.3.8.1 Picket Vessel The seismic vessel(s) will be accompanied by a picket vessel(s) with responsibilities that include communications with other vessels (primarily fishing vessels) that may be operating in the area and scouting for hazards. In 2013, a minimum of 2 and up to 5 picket vessels may be required to support the seismic fleet. The geohazard vessel will not be accompanied by a picket vessel given the smaller scale of the program. 2.3.8.2 Supply Vessel Heavy re-supply (including water, food, parts and fuel) to the seismic vessel(s) will be conducted by offshore supply vessels throughout the duration of the program. Supply vessels will be typical of those that regularly service the offshore oil and gas industry in Atlantic Canada and will be crewed by about 6 to 12 marine qualified personnel. Final determination of supply vessel specifications will be made after selection of the seismic contractor. Given the short duration of a typical geohazard survey, re-supply for these surveys is not anticipated.

Shelburne Basin 3-D Seismic Survey LGL Limited Environmental Assessment Page 15
2.3.8.3 Helicopter The use of helicopter support is being considered for the Project. The larger seismic vessels are usually equipped with a helicopter platform and helicopters are typically used for crew changes and light re-supply, as well as emergency medical evacuation. Helicopter operations will be according to safety requirements as specified by relevant authorities, including the CNSOPB. 2.3.8.4 Shore Base Shell will establish and maintain an office in Halifax in 2013. Some seismic contractors may have their own local shore-base facilities or may choose to use existing port facilities for crew changes or resupply. No new shore-base facilities will be constructed as part of this Project. 2.3.9 Waste Management Wastes produced from the seismic, geohazard, supply and picket vessels, including grey and black water, bilge water, deck drainage, discharges from machinery spaces and hazardous and non-hazardous waste material will be managed in accordance with MARPOL (International Convention for the Prevention of Pollution from Ships) and Shell’s waste management plan. The contracted vessels’ policies and procedures will be reviewed against the Shell Plan. A licensed waste contractor will be used for any waste returned to shore. No solid waste will be intentionally disposed of overboard. 2.3.10 Air Emissions Air emissions will be those associated with standard operations for marine vessels in general, including the seismic vessel, picket vessel, geohazard and supply vessel. Vessels will adhere to MARPOL Annex VI, Regulations for the Prevention of Air Pollution from Ships. 2.3.11 Malfunctions and Accidental Events In the unlikely event of the accidental release of hydrocarbons during the Project, Shell and its seismic and geohazard survey contractor(s) will implement the measures outlined in its spill response plan which will be filed with the CNSOPB in support of the Geophysical Work Authorization application. In addition, Shell will have emergency response plans in place for the Project and these will be bridged with the seismic (and geohazard) contractor’s response plans prior to commencement of the seismic program.

Shelburne Basin 3-D Seismic Survey LGL Limited Environmental Assessment Page 16
3.0 Environmental Assessment Scoping The CNSOPB provided a Scoping Document (dated 4 October 2012) for the Project, which outlined the factors to be considered in this Environmental Assessment. In addition, various stakeholders were contacted for input on their potential issues and concerns (see Section 3.4 below). Scoping for the EA also involved reviewing recent EAs that included the Strategic Environmental Assessment (SEA) for petroleum exploration activities on the southwestern Scotian slope (Hurley 2011), the draft SEA for the eastern Scotian slope (Stantec 2012), the Scoping Document for the proposed South Triumph 3D seismic survey on the Sable Island Bank, Marathon Canada Limited’s Scotian Slope 3D seismic program (Moulton et al. 2003), and recent seismic EAs and their amendments for offshore Newfoundland and Labrador. Reviews of the literature and present state of knowledge on potential adverse effects from seismic operations were also conducted.
3.1 Regulatory Context and Considerations The Canadian Environmental Assessment Act, 2012 (CEAA 2012) came into force on 6 July 2012. The “Regulations Designating Physical Activities” lists physical activities which require an environmental assessment under the new Act. Marine seismic surveys are not included on the list and therefore do not require an environmental assessment under CEAA 2012. The CNSOPB has confirmed that although seismic surveys do not fall under CEAA 2012, an environmental assessment is required before an authorization can be issued under paragraph 142(1) (b) of the Canada-Nova Scotia Offshore Petroleum Resources Accord Implementation Act. The CNSOPB has delegated the preparation of the EA to the proponent and will make the determination of whether the Project may result in significant adverse environmental effects based on the EA. The CNSOPB advised that the EA for the proposed Project will follow a process that is similar to a screening EA previously undertaken under the former CEAA. A Project Description for this Project was submitted to the CNSOPB on 29 June 2012. Based on the Project Description, Fisheries and Oceans Canada (DFO) and Environment Canada (EC) have determined that they are in possession of specialist or expert knowledge and will be participating in the EA process. The Department of National Defence (DND) has declared that it is in possession of information relevant to the Project. An initial draft of this EA (LGL 2012) was submitted by Shell and posted by the CNSOPB on their website on 4 December 2012. Formal written comments were submitted to the CNSOPB from both DFO (1 February 2013) and EC (31 January 2013) as part of the public comment period. As a result of Shell’s acquisition of ELs 2429 and 2430 in January 2013, as well as further refinement of the necessary space for acquisition across ELs 2423, 2424, 2425 and 2426, an additional 1,830 km2 were added to the 2013 Seismic Activity Area originally defined in the EA submitted in December. Given that the expansion of the original 2013 Seismic Activity Area was located entirely within both the Project and Study Areas evaluated in the EA and that the Project would otherwise remain unchanged, the CNSOPB advised that an Addendum to the EA (LGL 2013) was appropriate for evaluating any potential adverse environmental effects from this expansion. An addendum to the EA was submitted on February 8,

Shelburne Basin 3-D Seismic Survey LGL Limited Environmental Assessment Page 17
2013 (the “Addendum”). The 2013 Seismic Activity Area in this updated EA includes the additional 1,830 km2
and incorporates any additional considerations and mitigations detailed in the Addendum. The “Statement of Canadian Practice with respect to the Mitigation of Seismic Sound in the Marine Environment” specifies the mitigation requirements that must be met during the planning and conduct of marine seismic surveys. These requirements are set out as minimum standards, which apply in all non-ice covered marine waters in Canada, including the Project Area. The Statement has been developed to complement existing environmental assessment processes. Additional legislation that is relevant to the environmental planning and assessment of the Project includes:
Oceans Act Fisheries Act Canada Shipping Act Migratory Birds Convention Act Species at Risk Act (SARA)
3.2 Scoping Document The CNSOPB, in consultation with DFO and EC, released a Scoping Document that includes a description of the scope of the project to be assessed, the factors to be considered in the assessment, and the scope of those factors related to the EA of the Project. The Scoping Document provides the primary guidance for the completion of this EA and is attached as Appendix B for reference.
Based on previous EAs involving similar projects, the CNSOPB focused the scope of the factors to be considered to those with the potential for significant adverse environmental effects. Regulations, guidelines, and standard mitigation were also considered in determining the scope of the EA.
Sections 3.2.1 and 3.2.2 of this EA summarize the guidance provided by the Scoping Document. The Scoping Document provides additional detail on the scope of this EA, particularly the environmental assessment requirements for each Valued Environmental Component (VEC). 3.2.1 Factors to be Considered and Key Interactions The Scoping Document identified the following factors to be considered in this EA:
The environmental effects of the project, including the environmental effects of malfunctions or accidental events that may occur in connection with the project and any cumulative environmental effects that are likely to result from the project in combination with other projects or activities that have been or will be carried out;
The significance of the environmental effects; Any comments from the public that are received; and Measures that are technically and economically feasible and that would mitigate any
significant adverse environmental effects of the project.

Shelburne Basin 3-D Seismic Survey LGL Limited Environmental Assessment Page 18
These factors have typically been considered in offshore oil and gas environmental screenings conducted in the past under the CEAA. The Scoping Document provided clear guidance on the key interactions between Project activities and VECs (see Section 3.2.2) that require assessment including: underwater noise from the airgun arrays, ship strikes on marine mammals and sea turtles, vessel lighting on seabirds, and Project interactions with other users of the Project Area. In addition, malfunctions and accidental events required assessment. Appendix A of the Scoping Document also sets out the specific components and activities that are considered by the CNSOPB to be outside the scope of this EA. These components and activities relate to specifics regarding air quality, marine birds, marine fish, marine benthos, marine mammals and sea turtles. Additionally, following the guidance in the Scoping Document, the potential effects from air emissions, waste disposal, and helicopter flights associated with the Project have not been assessed. Appropriate mitigation measures will be implemented (see Section 11). 3.2.2 Identification of Valued Environmental Components The Scoping Document issued by the CNSOPB included the following under VECs:
Species of Special Status; Special Areas; Malfunctions and Accidental Events; Other Ocean Users; and Cumulative Effects.
Assessment requirements specific to each of these VECs, as indicated in the Scoping Document, are overviewed below. For the purposes of this assessment, Malfunctions and Accidental Events and Cumulative Effects are assessed as separate sections as each may result in potential effects on Species of Special Status, Special Areas, and Other Ocean Users. 3.2.2.1 Species of Special Status The EA shall include assessment of all species of special status known to occur in the Study Area. The EA will identify all species listed on Schedule 1 of the SARA and their critical habitat determined to be potentially affected during the seismic survey, migratory birds, and all species assessed as endangered, threatened, or of special concern by the Committee on the Status of Endangered Wildlife of Canada (COSEWIC). The EA shall evaluate all environmental effects, including cumulative effects, of the Project on species listed on Schedule 1 of the SARA and their critical habitat, and any migratory birds, having regard for the means by which potential negative effects will be mitigated.
Shelburne Basin 3-D Seismic Survey LGL Limited Environmental Assessment Page 19
3.2.2.2 Special Areas Assessment of potential effects on areas designated of special interest due to their ecological and/or conservation sensitivities that could be affected by seismic exploration activities are to be included in the EA. No identified special areas with existing management designations currently overlap with the ELs; special areas within the vicinity of the Project Area, such as the Haddock Box, are to be included in the assessment. Sable Island National Park and The Gully were considered to be sufficiently distant (>175 km) from the ELs; therefore, an assessment of effects on these areas was not required. 3.2.2.3 Other Ocean Users Commercial fisheries for groundfish, pelagics and invertebrates (shellfish), marine shipping, DND operations and DFO scientific research may occur in the Project Area. Therefore, an assessment of the potential effects of the Project on other ocean users in the Project Area, including new activities that develop during the life of the program, shall be included in the EA. 3.2.3 Malfunctions and Accidental Events Hydrocarbon releases from seismic streamers have occurred on the Scotian Shelf and there is the possibility of light spills, such a fuel oil, from seismic vessels. The proponent shall provide information on the sources and volumes of petroleum products expected to be on board all vessels and to be used for the Project to the CNSOPB following contractor selection. The proponent shall also be required to state the measures to be used to minimize the potential for accidental release of these materials into the environment. 3.2.4 Cumulative Effects The EA is required to assess the potential cumulative effects of the Project and other significant sources of sound in the marine environment, such as other seismic programs and military exercises, as well as the cumulative effects of increased vessel presence as a result of the Project on the above listed VECs. The assessment shall include the means by which design and/or operational procedures, including follow-up measures, will be implemented to mitigate significant adverse environmental effects as a result of cumulative effects (Appendix B).
3.3 Temporal and Spatial Assessment Boundaries For the purposes of this EA, the following boundaries are defined. 3.3.1 Temporal The temporal boundaries of the Project are 1 April to 30 September during 2013-2018.

Shelburne Basin 3-D Seismic Survey LGL Limited Environmental Assessment Page 20
3.3.2 Spatial 3.3.2.1 Project Area The Project Area is the area within which geophysical data could be acquired plus additional area around the outer perimeter of the data acquisition area to accommodate the ships’ turning radii (see Figure 2.1). The 2013 Seismic Activity Area, which occurs within the Project Area, is the area within which 3D seismic data will be acquired in 2013 and includes the additional 1,830 km2 assessed in the Addendum (LGL 2013). The Project Area was modified (reduced) from the original Project Area identified in the Project Description submitted to the CNSOPB on June 29, 2012. This modification was made in consideration of sensitivities associated with the Roseway Basin Right Whale Critical Habitat (Section 6.2.2.1). 3.3.2.2 Study Area The Study Area is an area larger than the Project Area that encompasses potential effects from the Project (see Figure 2.1). This area was based on the results of acoustic modelling of the airgun array (see Appendix A). 3.3.2.3 Regional Area The Regional Area boundary is the study area boundary as defined in the Southwestern Scotian Slope SEA (see Figure 2.1 and Figure 3 in Hurley (2011). This area is used as a basis for assessing cumulative effects.
3.4 Stakeholder Engagement In preparing and finalizing the EA report for the Project, stakeholder engagement was undertaken with relevant government agencies, representatives of the fishing industry and other interested groups. Additionally, information sharing has been conducted with the Mi’kmaq Kwilmu’kw Maw-Klusaqn Negotiation Office (KMKNO). The primary objective of these engagement activities has been to ensure that potentially interested parties were provided information regarding the Project as well as the opportunity to provide feedback. Parties contacted in regards to the EA for the Project were those identified to be interested in Project activities, those holding specific knowledge in regards to the Project and those that could be potentially affected by the Project. The EA has been compiled in consideration of the input and information received to date. Government agencies were engaged via phone or face-to-face meetings following review of the Project Description (Shell 2012). This was done to identify issues and concerns, acquire departmental knowledge and information as well as to determine their preferred manner of engagement for the Project. Non-governmental stakeholder and interest groups were provided individualized information packages in October 2012. Fisheries representatives were sent an additional information package in February 2013. Information packages included up to date descriptions of the proposed Project as well as relevant Project details and location maps. Recipients were asked to review the information packages and encouraged to contact Shell with any comments or desire for further discussions regarding the Project activities. Shell

Shelburne Basin 3-D Seismic Survey LGL Limited Environmental Assessment Page 21
sought to follow up in November 2012 following distribution of the October 2012 information packages. Follow up was completed in March 2013 with fisheries representatives that had not responded following distribution of the February 2013 package. Follow up was done to ensure that all stakeholders with an interest were engaged. Face to face meetings were organized where requested. Follow up in-person consultation sessions were held with several fisheries in mid-March 2013. Information was provided to Shell on swordfish, tuna, gillnet, scallop and lobster fishery activities including areas of interest near seismic area, relative timings of activity, fleet sizes and fishing direction flows in the season. Shell will incorporate this information into the seismic program as applicable and feasible. Engagements for the Project were undertaken with the following agencies, stakeholders and interest groups:
CNSOPB; Fisheries and Oceans Canada (DFO); Environment Canada (EC); Department of National Defence (DND); CNSOPB’s Fisheries Advisory Committee (FAC); Mi’kmaq Kwilmu’kw Maw-Klusuaqn Negotiation Office (KMKNO); Nova Scotia Office of Aboriginal Affairs (NS OAA); Fisheries Industries Representatives; World Wildlife Fund (WWF); and Ecology Action Centre (EAC)
Engagement will be ongoing throughout the Project and Shell will continue to work with stakeholders to identify and seek to address issues and concerns, if any. Shell will also continue to provide information about the Project to stakeholders as it becomes available through information sessions or follow up information packages. Appendix C provides an overview of engagements that have taken place to date during the preparation and finalization of the EA document. This overview is inclusive of any issues and concerns identified as part of the engagement process to date.

Shelburne Basin 3-D Seismic Survey LGL Limited Environmental Assessment Page 22
4.0 Effects Assessment Procedures The following sections provide a description of the approach to the effects assessment process. The effects assessment sections integrate the descriptions of the Project, results of acoustic modelling, the descriptions of the VECs, the issues identified by stakeholders during consultations (see Appendix C for a summary of consultations), public comments, and review of related EA documents—particularly the southwestern Scotian slope SEA. Written descriptions of the nature of the potential effects are presented as are magnitude ratings using similar terminology, definitions, and ranking system developed in the generic EA of seismic exploration on the Scotian Shelf (Davis et al. 1998) as well as a site-specific seismic EA on the Scotian Slope (Moulton et al. 2003). Although this EA is not being conducted pursuant to CEAA, assessment methods also conform to CEAA and its associated Guides and CEA Agency Operational Policy Statements. The assessment of the potential effects of the Project on VECs is made considering the application of regulatory requirements, and of general industry and Project-specific mitigation measures. These residual effects, including mitigation measures are summarized in Section 11.
4.1 Effects Definitions and Evaluation of Significance Three primary types of effects definitions were used in the assessment: magnitude, geographic extent, and duration. Other definitions that have been used in EAs that have previously fallen under CEAA include ecological/social-cultural and economic context, frequency, and reversibility. Note that frequency and reversibility have not been included in our effects definitions. Frequency was not included given that geophysical data acquisition is expected to be a continuous activity and that operational shutdowns of the airgun arrays will likely be too short to differentiate between “impact bouts”. Unless otherwise indicated, all effects from the Project are considered reversible given the temporary nature of the seismic and geohazard surveys. The assessment of significance is evaluated on the basis that Shell will implement the Project mitigation measures included in this EA and detailed in Section 11, i.e., it is an assessment of residual effects. 4.1.1 Magnitude of Effects Magnitude describes the nature and extent of the environmental effects for each activity. The biological measures to be included in the definition of magnitude are not clearly established and provided in any single document of authority. After careful consideration, LGL has used definitions of magnitude similar to those used by LGL for seismic EAs in Atlantic Canada, including Nova Scotia (e.g., Moulton et al. 2003) and for seismic EAs conducted in the Canadian Beaufort (LGL et al. 2006; LGL 2007, 2008; Upun-LGL 2010). For this EA, the magnitude of effects can be rated as:
Major - An effect from the Project on a VEC is rated major if it is judged to result in a 10%, or greater, change in the size or health of a population, the carrying capacity of its habitat, or a commercial harvest. A change in a population can result from an absolute reduction in population size or from displacement of animals to areas outside the area of consideration.

Shelburne Basin 3-D Seismic Survey LGL Limited Environmental Assessment Page 23
Moderate - An effect from the Project on a VEC is rated moderate if it is judged to result in a 1% to less than 10% change in the size or health of a population, the carrying capacity of its habitat, or a commercial harvest. Minor - An effect from the Project on a VEC is rated minor if it is judged to result in a less than 1% change in the size or health of the population, the carrying capacity of its habitat, or a commercial harvest. Negligible - Negligible effects are from those interactions that are judged to have either no or very minimal effects.
It should be noted that the percentage changes cannot be measured in practice as field studies are beyond the scope of this environmental assessment and there would be difficulty in attributing any observed changes to the Project as opposed to changes from natural variability or other sources. However, these percentage levels are used to provide the reader with a clear understanding of the expected magnitude of potential effects from the Project. The categorization of magnitude includes consideration of scientific literature, acoustic modelling results, and the use of professional judgement. The magnitude ranking contributes to the assessment of significance. 4.1.2 Geographic Extent The geographic extent or scale of effects refers to the specific area (km2) affected by the Project activity, which may vary depending on the activity and the relevant VEC. Geographic extent can be categorized as:
< 1 km2 1-10 km2 11-100 km2 101-1,000 km2 1,001-10,000 km2 >10,000 km2
It should be noted that an area of 100 km² is a circle with a radius of 5.6 km around the airgun array. A circular area of 1,000 km² would have a radius of about 17.8 km and an area of 10,000 km² would have a radius of about 56 km around the array. 4.1.3 Duration of Effects Duration categories (time period effects are expected to occur) include:
< 1 month (short-term) 1 – 12 months (short-term) 13 – 36 months (medium-term) 37 – 72 months (medium-term) 72 months (long-term)

Shelburne Basin 3-D Seismic Survey LGL Limited Environmental Assessment Page 24
4.1.4 Ecological/Social-cultural and Economic Context The ecological, socio-cultural and economic context describes the current status of the area affected by the proposed seismic project in terms of existing environmental effects. Three levels were considered:
pristine area, area affected by human activity, and area with existing evidence of adverse effects.
Based on the presence of shipping and fishing activity within and near the Study Area, the ecological, socio-cultural and economic context was classified as an area affected by human activity. 4.1.5 Significance of Environmental Effects Significant environmental effects are those that are considered to be of sufficient magnitude, duration, and geographic extent to cause a change in the VEC that will alter its status or integrity beyond an acceptable level. Establishment of the criteria is based on professional judgement, but should be transparent and repeatable. An effect can be considered significant (negative by definition), not significant, or positive. In this EA, a significant effect is defined as one having either:
A major magnitude; or A moderate magnitude for a duration >1 year over a geographic extent >100 km2.
For this assessment, effects are judged assuming the implementation of Project mitigation measures, i.e., an assessment of residual effects. 4.1.6 Level of Confidence An assessment of scientific certainty (i.e., low, medium, and high levels of confidence) is provided based on confidence in the scientific information available when an effect is judged to have a particular negative effect on a VEC. Level of confidence can be assessed as:
Low: Based on incomplete understanding of cause-effect relationships and/or incomplete data specific to the Project Area.
Medium: Based on good understanding of cause-effect relationships using data from elsewhere or incompletely understood cause-effect relationships using data specific to the Project Area.
High: Based on good understanding of cause-effect relationships and data specific to the Project Area.
4.2 Noise Criteria for Assessing Effects Airguns function by venting high pressure air into the water column. The resulting downward-directed pulse has duration of only 10-20 ms, with only one strong positive and one strong negative peak pressure (Caldwell and Dragoset 2000). Most energy emitted from airguns is at relatively low frequencies with typical high-energy airgun arrays emitting most energy at 10-20 Hz. However, pulses

Shelburne Basin 3-D Seismic Survey LGL Limited Environmental Assessment Page 25
do contain significant energy up to 500-1,000 Hz and some energy at higher frequencies (Goold and Fish 1998; Potter et al. 2007). Although the pulsed sounds associated with seismic exploration have higher peak levels than other industrial sounds to which whales and other marine mammals are routinely exposed, there are several characteristics of seismic sound that mitigate this issue. These characteristics include:
Airgun arrays produce intermittent sounds, involving emission of a strong pulse for a small fraction of a second followed by several seconds of near silence;
Airgun arrays are designed to transmit strong sounds downward through the seafloor, making the amount of sound emitted in near horizontal directions considerably reduced [Nonetheless, they also emit sounds that travel horizontally toward non-target areas.]; and
An airgun array is a distributed source, not a point source (i.e. the nominal source level is an estimate measured from a theoretical point source emitting the total energy of the airgun array). In reality, because the airgun array is not a point source, there is no one location within the near field (or anywhere else) where the received level is as high as the nominal source level.
Section 1.3 in Appendix D provides further detail regarding the characteristics of airgun sounds. Acoustic modelling of the airgun array (5,085 in3) was undertaken to allow for a description and assessment of potential sound exposure levels and to provide estimates of the distances and areas where the sound level criteria used in this assessment would be exceeded. This information is used to assist in the assessment of the spatial extent of potential effects of airgun array noise on VECs. See Section 5 and Appendix A for more details on the acoustic modelling undertaken for the Project. As airgun arrays associated with the WAZ survey will be activated individually, as opposed to multiple arrays being activated at the same time, aggregate effects from seismic sound as a result of the WAZ survey are not anticipated and thus have not been considered as Project effects. There is no single standard setting out which sound levels or criteria are appropriate for assessing effects on marine VECs. A summary of the criteria used in this assessment and the rationale for the selection is provided below for marine mammals, sea turtles, and fishes. 4.2.1 Marine Mammals There are four types of potential effects of seismic sounds on marine mammals considered in this assessment. These include
1. temporary reduction in hearing sensitivity, evident as Temporary Threshold Shift (TTS); 2. permanent hearing impairment, evident as Permanent Threshold Shift (PTS); 3. masked communication; and 4. changes in behaviour and distribution of the animals (i.e., “disturbance”) that are of sufficient
magnitude to be “biologically significant”.
A detailed description of the current scientific knowledge of the potential effects of seismic sound on marine mammals, as it relates to these four types of potential effects, is provided in Appendix D, Sections 1.4–1.6.

Shelburne Basin 3-D Seismic Survey LGL Limited Environmental Assessment Page 26
Masking is the obscuring of sounds of interest by interfering sounds, generally at similar frequencies. Masking can occur if the frequency of the source is close to that used as a signal by the marine mammal and if the anthropogenic sound is present for a significant fraction of time (Richardson et al. 1995; Clark et al. 2009). Conversely, masking is not expected if little or no overlap occurs between the introduced sound and the frequencies used by the species or if the introduced sound is infrequent. Based on reviewed research the potential for masking of marine mammal calls and/or important environmental cues is considered quite low from the proposed WAZ seismic program (see Section 1.4 of Appendix D for a review of masking). During surveying, airgun arrays will be activated individually approximately every 10 seconds. As a result of these considerations, masking is therefore not considered further in this assessment. The following received levels (RL)1 of sound (or criteria) were used to assess effects (hearing impairment and behavioural) of airgun array noise on cetaceans:
Hearing Impairment: Received energy level (SEL) ≥198 dB re 1 μPa2 · s. Temporary or permanent hearing impairment is possible when marine mammals are exposed to very strong sounds. Recently acquired data indicate that TTS onset in marine mammals is more closely correlated with the received energy levels than with (rms) levels (Southall et al. 2007) that have previously been used to assess hearing impairment effects. In odontocetes exposed to impulsive sounds, the TTS threshold can be as low as ~183 dB re 1 μPa2 · s. There are no specific data concerning the levels of underwater sound necessary to cause permanent hearing damage (PTS) in any species of marine mammal. A conservative estimate of the offset between TTS and PTS, when sound exposure is measured on an SEL basis (received energy level), is 15 dB (Southall et al. 2007). Thus, available data indicate that the lowest cumulative received SEL that could elicit auditory injury (PTS) in cetaceans is 198 dB re 1 μPa2 · s (i.e., 183 dB + 15 dB) (Southall et al. 2007). [In addition, Southall et al. concluded that PTS might occur if cetaceans (as exemplified by belugas and bottlenose dolphins) were exposed to peak pressures exceeding 230 re 1 μPa (peak).] In addition, there is much uncertainty regarding the exposure period that should be used to calculate cumulative SEL for purposes of assessing potential auditory effects.
Behaviour: one or more airgun pulses with RL ≥160 dB re 1 μPa (rms or root mean square). These are the levels of sound that are typically assumed, by U.S. National Marine Fisheries Service (NMFS), to elicit behavioural disturbance in marine mammals based on observations of mysticetes reacting to airgun pulses (Malme et al. 1983, 1984; Richardson et al. 1986). Specifically, NMFS considers 160 dB re 1 μPa (rms) to be the received level above which Level B Harassment is likely. Level B Harassment is considered by NMFS to be the level at which there is potential to disturb a marine mammal or marine mammal stock in the wild by causing disruption of behavioural patterns, including, but not limited to, migration, breathing, nursing, breeding, feeding, or sheltering, but not at which there is the
1 The numerical value of the level or “strength” of a received seismic pulse varies depending on the methods used to measure the sound pulse, and the units in which it is expressed. Thus, it is important to be clear about the basis of the measurement when quoting received levels of seismic pulses. “rms” or “root mean square” refers to a particular method of measuring the pulsed sounds, and represents an average level over the duration of the received pulse. Pulse levels measured in this way are lower than peak or peak-to-peak levels (typically by 10–12 dB and by 16–18 dB, respectively), but higher than sound exposure levels (SEL), typically by 10–15 dB. (SEL is a measure of the energy in the pulse, and has different units: dB re 1 μPa2 · s.)

Shelburne Basin 3-D Seismic Survey LGL Limited Environmental Assessment Page 27
potential to injure a marine mammal or marine mammal stock in the wild. Although applied by NMFS to all marine mammals, here is variation in response thresholds, with some species reacting at RLs lower than 160 dB re 1 μPa (rms) and others not reacting unless levels are higher (see Appendix D). The 160 dB re 1 μPa (rms) criterion has commonly been used in EAs of seismic programs in Atlantic Canada.
4.2.1.1 Auditory Weighting Function For the purposes of assessment, flat-weighting (i.e., no weighting) was applied when calculating the distances within which RLs would diminish to 160 dB re 1 μPa (rms) (behavioural effect). Most available literature on marine mammal behavioural response to noise, including airgun pulses, has been reported as SPL rms. In addition, the proper application of M-weighting functions to modelled rms SPL is complicated by the frequency dependence of the pulse duration (see Appendix A). M-weighting (see Section 5 for a description) was applied when calculating the distances within which the RLs would diminish to 198 dB re 1 μPa2 · s (PTS for cetaceans). 4.2.2 Sea Turtles Based on available data, it is considered possible that leatherback sea turtles could exhibit temporary hearing loss if the turtles are close to the airguns (see Appendix E). However, there is not enough information on sea turtle temporary hearing loss and no data on permanent hearing loss to reach any definitive conclusions about received sound levels that would trigger TTS or PTS. Based on behavioural observations of captive green and loggerhead sea turtles (see Section 2 of Appendix E), it is assumed, for the purposes of this assessment, that behavioural avoidance of an airgun array may occur at received sound levels ranging from 166–175 dB re 1 μPa (rms). 4.2.3 Fishes Although there are inter- and intra-specific differences in received sound pressure levels (SPLs) that evoke explicit behavioural responses, it is generally accepted that fishes may exhibit subtle behavioural responses at received SPLs of 160-170 dB re 1 µPa (0-p), but that strong changes in fish behaviour (e.g., swimming activity) are not typically observed until received SPLs reach about 180 dB re 1 µPa (0-p) (Appendix F). Based on evidence from existing research, any substantial physical/physiological effects of exposure to seismic noise on fish considered in this assessment can be confidently dismissed (Appendix F). While there is evidence for physical and physiological effects on all fish life stages, these effects were observed only when the subject was exposed in close proximity to the seismic noise source (i.e., metres) and sometimes could not move away from the seismic noise source (i.e., captive subject). In natural conditions, juvenile and adult fish stages can move away from a seismic source. While eggs and larvae do not have to ability to actively move away, a very small proportion of all the eggs and larvae in an area would be exposed to the seismic source at very close range.

Shelburne Basin 3-D Seismic Survey LGL Limited Environmental Assessment Page 28
Studies indicate that bluefin tuna (Thunnus thynnus) migrate annually through the Study Area from about May to October (NOAA unpubl. Data; LPRC unpubl. Data; Walli et al. 2009; Galuardi et al. 2010; Maguire and Lester 2012). Fonteneau (2009 in Maguire and Lester 2012) states the following:
“Bluefin tuna in the Atlantic has been the tuna species showing the greatest flexibility, and permanently changing its areas of concentration and its apparent migration routes.”
Maguire and Lester (2012) indicate that this statement suggests that usual concepts of habitat and trends in habitat may not be applicable to Atlantic bluefin tuna as long as spawning and larval and juvenile rearing habitats, which are located outside of Canada, are protected. In their study of the effect of boat noise on the behaviour of bluefin tuna in the Mediterranean Sea, Sarà et al. (2007) concluded that local noise pollution generated by vessels elicited behavioural responses by the tuna, including changes in swimming direction and increased vertical movement either upwards or downwards in the water column. They also noted that schools of tuna exhibited less concentrated structure and more uncoordinated swimming behaviour. Note that their observations were made on semi-captive tuna. Seismic and vessel noise generated during the Shell survey could affect the behaviour of migrating bluefin tuna in the area but the effects would most likely be temporary and localized, and therefore not cause significant interruption of the migratory patterns of this large pelagic fish.
4.3 Cumulative Effects Cumulative effects refer to the effect a project or activity has on the environment when combined with the effects of other past, existing and reasonably foreseeable projects and activities. Projects and activities that will be considered in the cumulative effects assessment include other human activities in Nova Scotia offshore waters, with emphasis on the Regional Area.
Other “significant sources of sound”. Based on guidance received from the CNSOPB, this includes other seismic surveys and DND operations that use military sonar.
Vessel presence. Based on guidance received from the CNSOPB, this includes an assessment of effects from the vessels (i.e., vessel presence) associated with the Project plus other vessels operating in the area.
4.4 Follow-up Monitoring Monitoring for marine mammals, sea turtles and seabirds will be conducted during the geophysical program(s). Monitoring and observation procedures are presented in Section 10 and a monitoring report detailing marine mammal, sea turtle, and seabird observations will be submitted to the CNSOPB following completion of each program associated with the Project. In the event of a malfunction or accidental event, the need for follow-up monitoring will be assessed in consultation with the CNSOPB.

Shelburne Basin 3-D Seismic Survey LGL Limited Environmental Assessment Page 29
5.0 Acoustic Modelling Acoustic modelling of the airgun array (5,085 in3) was undertaken by JASCO Applied Sciences to assist in the predictions of the spatial extent of potential effects of airgun array sound on VECs. This array was selected to represent the upper end of the typical array size range proposed for the 2013 WAZ survey and potential future surveys. As a result, it is intended to provide a reasonable scenario that will illustrate the potential airgun pulse sound levels that could occur during the survey. Appendix A provides a detailed description of the modelling approach and results; it also provides the sound speed profile information and assumptions used in the models. The modelling methods are summarized below. Two complementary acoustic models were used to predict the underwater acoustic field of the 3-D seismic airgun array proposed for use in the seismic surveys for the Project: (1) airgun array pressure signatures and directional source levels (SL) were predicted with an Airgun Array Source Model (AASM) (MacGillivray 2006), and (2) propagated acoustic fields were modelled with a Marine Operations Noise Model (MONM), based on the computed signatures (as described below) and SLs. AASM is based on the physics of the oscillation and radiation of airgun bubbles. It produces a set of “notional” signatures for each array element (i.e., airgun) based on the
• array layout; • volume, tow depth, and firing pressure of each airgun; and • interactions between the different airguns in the array.
The signatures are summed with the appropriate phase delays to obtain the far-field source signature2 of the entire array in different directions. This far-field array signature is then filtered into 1/3-octave pass-bands to compute the SLs of the array as a function of frequency band and azimuthal angle in the horizontal plane. MONM treats sound propagation in range-varying acoustic environments through a wide-angled parabolic equation (PE) solution to the acoustic wave equation, based on a version of the U.S. Naval Research Laboratory’s Range-dependent Acoustic Model (RAM) (Collins et al. 1996). The model accounts for depth and/or range dependence of several environmental variables, including bathymetry and sound speed profiles in the water column and the sub-bottom. Processing the modelled received levels involves gridding all data points in each horizontal plane separately (i.e., at each modelled depth). The resulting stack of grids is collapsed into a single grid using a maximum-over-depth rule. This means that the sound level at each horizontal planar point is taken to be the maximum value occurring over all modelled depths for that point. A third acoustic mode, the Full-Waveform Range-dependent Acoustic Model (FWRAM), was used to determine the acoustic pulse time integration periods as a function of range from the sources, and consequently, the range-dependent conversion factor between sound exposure level (SEL) and root mean square sound pressure level (rms SPL) and between SEL and peak SPL.
2 The far field is the zone where, to an observer, sound originating from a spatially-distributed source appears to radiate from a single point. The distance to the acoustic far field increases with frequency.
Shelburne Basin 3-D Seismic Survey LGL Limited Environmental Assessment Page 30
Based on a literature review of marine mammal hearing and on physiological and behavioural responses to anthropogenic sound, Southall et al. (2007) proposed standard frequency-weighting functions—referred to as M-weighting functions—for functional hearing groups of marine mammals. This marine mammal frequency weighting (M-weighting) was applied to four functional hearing groups to weight the importance of received sound levels at particular frequencies. These four functional hearing groups include:
Low-frequency cetaceans (LFCs)—mysticetes (baleen whales); Mid-frequency cetaceans (MFCs)—most odontocetes (toothed whales); High-frequency cetaceans (HFCs)—odontocetes specialized for using high-frequencies; Pinnipeds in water (Pw)—seals, sea lions, and walrus.
The predicted distances to specific sound levels were computed from the planar grids of the maximum-over-depth sound fields. Two distances from the source are reported for each sound level: (1) Rmax, the maximum range at which the given sound level was encountered in the modelled field grid; and (2) R95%, the maximum range to a grid point at which the given sound level was encountered after exclusion of the 5% farthest such points. Three sites were selected to represent sound propagation properties within the Project Area (Figure 5.1):
Site 01 is the closest point within the Project Area to the North Atlantic Right Whale Critical Habitat (discussed in Section 6.2.2.1);
Site 02 is the point closest to the Haddock Box (discussed in Section 6.2.2.2) and is within the 2013 Proposed Seismic Area (or 2013 Seismic Activity Area); and
Site 03 is the southern point of the 2013 Proposed Seismic Area and is in the deepest water for the 2013 Proposed Seismic Area.
5.1 Precautionary Steps A conservative or precautionary approach was taken when predicting sound levels from the airgun array. Sound verification tests of previous acoustic modelling completed by JASCO in the Beaufort and Chukchi seas were on average 3 dB higher than the modelled predictions (Aerts et al. 2008; Funk et al. 2008; Ireland et al. 2009; O’Neill et al. 2010; Warner et al. 2010). Therefore, a factor of 3 dB was added to the predicted received levels to provide precautionary results reflecting the inherent variability of sound levels in the modelled area. In addition, a maximum-over-depth approach was used. Received sound levels were determined for various water depths at each modelled distance from each of the three sites. Whereas received sound levels varied with depth at each distance from the source, the maximum received value was always used for the purposes of assessing environmental effects in this report. In addition, the most reflective geoacoustic profile (i.e., the profile resulting in the least acoustic attenuation) was used throughout the modelled areas. These precautionary acoustic modelling estimates are incorporated into the effects predictions below.

Shelburne Basin 3-D Seismic Survey LGL Limited Environmental Assessment Page 31
Figure 5.1 Locations of the Acoustic Modelling Sites Within the Project Area.
Shelburne Basin 3-D Seismic Survey LGL Limited Environmental Assessment Page 32
6.0 Effects on Valued Environment Components This section focuses on the assessment of those Project activities identified in the Scoping Document “that have the potential to have significant adverse environmental effects” on VECs. The Project activities requiring assessment include underwater noise from the airgun arrays; ship strikes on marine mammals and sea turtles; vessel lighting on seabirds, and Project interactions with other users of the Project Area. In addition, malfunctions and accidental events required assessment. Noise from the airgun arrays is the key Project activity with impact potential and as such, a large portion of the assessment focuses on this topic. Comprehensive literature reviews of the auditory abilities and the potential effects of exposure to seismic airgun noise on marine mammals, sea turtles, fishes, and invertebrates are provided in Appendices D-G, respectively. For birds, the key Project activity with impact potential is the lighting on the Project vessels due to the possible attraction of the birds to the lights. As discussed previously, effects are judged assuming the implementation of Project mitigation measures, i.e., an assessment of residual effects. Mitigation measures are provided in detail in Section 11 and are summarized below in the effects assessment for each VEC.
6.1 Species of Special Status The Scoping Document required the evaluation of environmental effects, including cumulative effects, of the Project on the identified SARA Schedule 1 species and their critical habitats, and migratory birds (protected by the Migratory Birds Convention Act, 1994). Table 6.1 presents the species that constitute the SARA portion of the Species of Special Status VEC. Also, provided in this table are the species currently considered at risk by COSEWIC but which are not listed on Schedule 1 of SARA. The migratory bird species/groups that are also considered part of this VEC are presented in Table 6.2. Biological background summaries, inclusive of spatial and temporal distribution, of the SARA Schedule 1 and migratory bird species/groups are presented in the subsections below, followed by an assessment of residual effects. As noted in the Scoping Document (Appendix B) if new species-at-risk are added to Schedule 1 of SARA during the assessment, additional mitigation measures may be required. LGL Limited will continue to monitor Schedule 1 for newly listed species that may be affected by the Project. A number of mitigation measures and monitoring commitments have been developed to minimize the effects of airgun array noise. Many of these measures are applicable to marine mammal and sea turtle Species of Special Status (as well as other marine mammals and sea turtles, and to a limited extent fish). A summary of these measures and commitments are provided below.

Shelburne Basin 3-D Seismic Survey LGL Limited Environmental Assessment Page 33
Table 6.1 SARA Schedule 1- and COSEWIC-listed Marine Species with Reasonable Likelihood of Occurrence in the Study Area.
SPECIES SARA Schedule 1a COSEWICb
Common Name Scientific Name Endangered Threatened Special concern
Endangered Threatened Special concern
SARA Schedule 1 Species Blue whale (Atlantic population) Balaenoptera musculus X X North Atlantic right whale Eubalaena glacialis X X Northern bottlenose whale (Scotian Shelf population)
Hyperoodon ampullatus X X
Leatherback sea turtle c Dermochelys coriacea X X Roseate Tern Sterna dougallii X X Red Knot rufa subspecies Calidris canutus rufa X X White shark Carcharodon carcharias X X Northern wolffish Anarhichas denticulatus X X Spotted wolffish Anarhichas minor X X Fin whale (Atlantic population) Balaenoptera physalus X X Sowerby’s beaked whale Mesoplodon bidens X X Atlantic wolffish Anarhichas lupus X X Non-SARA Schedule 1 Species Listed by COSEWIC Loggerhead sea turtle Caretta caretta X Atlantic bluefin tuna Thunnus thynnus X Atlantic cod (Southern population) Gadus morhua X Roundnose grenadier Coryphaenoides rupestris X Porbeagle shark Lamna nasus X Atlantic salmon (Nova Scotia Southern Upland population)
Salmo salar X
Cusk Brosme brosme X Shortfin mako shark (Atlantic population) Isurus oxyrinchus X Acadian redfish (Atlantic population) Sebastes fasciatus X Winter skate (Eastern Scotian Shelf population)
Leucoraja ocellata X
Harbour porpoise (Northwest Atlantic population)
Phocoena phocoena X
Spiny dogfish (Atlantic population) Squalus acanthias X Roughhead grenadier Macrourus berglax X Basking shark (Atlantic population) Cetorhinus maximus) X Blue shark (Atlantic population) Prionace glauca X Winter skate (Georges Bank-Western Scotian Shelf-Bay of Fundy population)
Leucoraja ocellataa X
Killer whale (Northwest Atlantic- Eastern Arctic population)
Orcinus orca X
Sources: a SARA website (http://www.sararegistry.gc.ca/default_e.cfm) (as of 5 October 2012); b COSEWIC website (http://www.cosewic.gc.ca/index.htm) (as of 5 October 2012); c Leatherback sea turtles were split into two populations (Atlantic and Pacific) in May 2012 and assessed by COSEWIC as endangered. The current SARA listing for leatherback sea turtles considers both the Atlantic and Pacific populations combined.

Shelburne Basin 3-D Seismic Survey LGL Limited Environmental Assessment Page 34
Table 6.2 Bird Species Included in Bird Families Listed in Article I of the Migratory Birds Convention Act (1994) with Reasonable Likelihood of Occurrence in the Study Area.
Common Name Scientific Name
Procellariidae
Northern Fulmar Fulmarus glacialis
Cory’s Shearwater Calonectris diomedea
Greater Shearwater Puffinus gravis
Sooty Shearwater Puffinus griseus
Manx Shearwater Puffinus puffinus
Hydrobatidae
Leach's Storm-Petrel Oceanodroma leucorhoa
Wilson's Storm-Petrel Oceanites oceanicus
Sulidae
Northern Gannet Morus bassanus
Charadriidae
Black-bellied Plover Pluvialis squatarola
American Golden-Plover Pluvialis dominica
Scolopacidae
Whimbrel Numenius phaeopus
Hudsonian Godwit Limosa haemastica
Red Knot Calidris canutus rufa
White-rumped Sandpiper Calidris fuscicollis
Red Phalarope Phalaropus fulicarius
Red-necked Phalarope Phalaropus lobatus
Laridae
Black-legged Kittiwake Rissa tridactyla
Ivory Gull Pagophila eburnea
Herring Gull Larus argentatus
Iceland Gull Larus glaucoides
Lesser Black-backed Gull Larus fuscus
Glaucous Gull Larus hyperboreus
Great Black-backed Gull Larus marinus
Roseate Tern Sterna dougallii
Arctic Tern Sterna paradisaea
Stercorariidae
Great Skua Stercorarius skua
South Polar Skua Stercorarius maccormicki
Pomarine Jaeger Stercorarius pomarinus
Parasitic Jaeger Stercorarius parasiticus
Long-tailed Jaeger Stercorarius longicaudus
Parulidae
Warblers Setophaga spp. Sources: Williams and Willams (1978); Richardson (1979); Brown (1986); Lock et al. (1994); Skeel and Mallory (1996); Harrington (2001); Moulton et al. (2006); LGL Limited (2009).

Shelburne Basin 3-D Seismic Survey LGL Limited Environmental Assessment Page 35
Shell is committed to the mitigation measures and monitoring requirements as outlined in the Statement of Canadian Practice with Respect to the Mitigation of Seismic Noise in the Marine Environment (i.e., Statement), and in many instances will surpass the minimum requirements outlined in the Statement in order to reduce environmental effects on marine species. The key mitigation measures and monitoring commitments are summarized below and in Section 11.
1. Ramp up of the airgun array will occur over a 30 minute period. 2. Shut down all airguns during line changes. 3. Delay ramp up if a marine mammal or sea turtle is detected inside the “safety zone” during a
monitoring period prior to ramp up. Two safety zones will be used for ramp up delay. For marine mammal and sea turtle species listed on Schedule 1 of SARA, as well as all other baleen whales and sea turtles, a safety zone based on an area where sound levels from the airgun array are predicted to exceed 180 dB rms [3] will be used. Based on precautionary acoustic modelling of the 5,085 in3 array, this 180 dB rms distance is predicted as 1,000 m [4] (Appendix A). For all other marine mammals (cetaceans and pinnipeds), a 500 m safety zone will be implemented for delay of ramp up. A minimum ramp up delay of 30 minutes will be utilized unless a beaked whale species is noted at the surface within the respective safety zone prior to ramp up at which point the ramp up delay will be increased to 60 minutes in consideration of extended diving behavior.
4. Airguns will be shut down if a marine mammal or sea turtle species listed on Schedule 1 of SARA, as well as all other baleen whales and sea turtles, is observed within the 180 dB rms
safety zone (1,000 m). The CNSOPB will be notified of any shutdown within 24 hours of its occurrence.
5. There will be three Marine Mammal Observers/Seabird Observers (MMOs/SBOs) on each seismic vessel (12 in total on all four seismic vessels) to monitor the established safety zones. Two MMOs/SBOs per vessel will be tasked with visual monitoring during all daylight hours when the airgun array is active and during pre-ramp up watches. A third observer will be tasked with PAM during ramp up watch and during nighttime and other periods with poor visibility conditions (i.e., the full safety zone cannot be seen). Each MMO/SBO will work a maximum shift of 12 hours per day, but will not conduct more than eight hours of visual watches per day, and each watch will not exceed four hours. Shifts for MMOs and SBOs will be five weeks in duration.
6. The key responsibilities of MMOs/SBOs are as follow: a. Implementation of marine mammal observer protocols established for the Project;
b. Conduct systematic sea bird surveys in accordance with the recommended CWS
protocol; 3 Prior to Southall et al. (2007), the NMFS recommendation was that cetaceans should not be exposed to RLs from pulsed sounds of 180 dB rms—this was considered the sound level above which one could not rule out hearing damage or other injury. Since the Southall et al. (2007) approach varies from the approach used previously offshore Nova Scotia (and in other Canadian waters), Shell has opted to use the 180 dB rms criterion for defining safety zones for cetaceans and sea turtles listed on Schedule 1 of SARA as well as all other baleen whales and sea turtles. The implementation of a 180 dB rms safety zone for the Project is considered precautionary and more protective of cetaceans than the 198 dB re 1 μPa2 · s criterion for PTS. 4 Once a decision has been made on the seismic contractor, additional acoustic modelling will be conducted if the seismic array differs from the 5085 in3 array in order to estimate the appropriate 180 dB safety zone.

Shelburne Basin 3-D Seismic Survey LGL Limited Environmental Assessment Page 36
c. Perform daily searches of vessels for stranded birds and implement appropriate protocol for any stranded birds found; and
d. Record and compile daily Marine Mammal and Seabird Observations.
7. Passive Acoustic Monitoring (PAM) systems will be installed on all four seismic vessels to detect marine mammals during periods of poor visibility (e.g., darkness, fog) and during the pre-ramp up watch. As indicated above, MMOs/SBOs will be tasked with monitoring the PAM systems and identifying the appropriate mitigation in the event that a marine mammal is acoustically detected.
6.1.1 SARA Schedule 1 Species The following sections provide biological overviews, inclusive of spatial and temporal distribution, as well as effects assessments for each of the identified SARA Schedule 1 species with a likelihood of occurrence in the Study Area. For the purposes of describing marine mammals and sea turtles sightings within the Study Area, a database of sightings in Nova Scotia waters compiled by DFO (as provided by P. Emery, Species at Risk, Aquatic Science Technician, DFO; 30 October 2012) was utilized. These data were used to indicate what species have occurred in the region, but do not provide fine-scale descriptions or predictions of abundance or distribution. As noted by DFO, a number of caveats should be considered when using the DFO marine mammal (and sea turtle) sighting data, and include:
The sighting data have not yet been completely error-checked. Survey effort is not consistent across all data collection areas (i.e. some areas have had
greater survey efforts than others). The quality of some of the sighting data is unknown. Most sightings are collected on an
opportunistic basis and observations may come from individuals with a variety of expertise in marine mammal identification experiences.
Most data have been gathered from platforms of opportunity that were vessel-based. The inherent problems with negative or positive reactions by cetaceans to the approach of such vessels have not yet been factored into the data.
Sighting effort has not been quantified (i.e., the numbers cannot be used to estimate true species density or abundance for an area). Lack of sightings does not represent lack of species present in a particular area.
Numbers sighted have not been verified (especially in light of the significant differences in detectability among species).
For completeness, these data represent an amalgamation of sightings from a variety of years and seasons. Effort (and number of sightings) is not necessarily consistent among months, years, and areas. There are large gaps between years. Thus seasonal, depth, and distribution information should be interpreted with caution.
Many sightings could not be identified to species, but are listed to the smallest taxonomic group possible.

Shelburne Basin 3-D Seismic Survey LGL Limited Environmental Assessment Page 37
As provided by DFO, sighting locations were restricted to Canadian waters in an area between 41° and 46° N latitude and 56° and 68° W longitude. Figure 6.1 shows sightings of marine mammals (exclusive of fin whales—see Figure 6.2) and sea turtles listed on Schedule 1 of SARA and those species that are relevant to the Project.
Figure 6.1 Sightings of Marine Mammal and Sea Turtle Species Listed on Schedule 1 of SARA
(excluding fin whales) Observed from April–September, 1966–2012 (DFO database). 6.1.1.1 North Atlantic Right Whale Biological Background Summary The western North Atlantic right whale population ranges from calving grounds in coastal waters off the southeastern United States to feeding grounds in New England waters and the Canadian Bay of Fundy, Scotian Shelf, and Gulf of St. Lawrence. Research results suggest the existence of six major habitats or congregation areas for western North Atlantic right whales: the coastal waters of the southeastern United States; the Great South Channel; Georges Bank/Gulf of Maine; Cape Cod and Massachusetts Bays; the Bay of Fundy; and the Scotian Shelf (COSEWIC 2003; Waring et al. 2011a). North Atlantic right whales became severely depleted during industrial whaling and the population is currently in danger of

Shelburne Basin 3-D Seismic Survey LGL Limited Environmental Assessment Page 38
extinction. Based on a census of individual whales identified using photo-identification, the western North Atlantic population size is estimated to be comprised of at least 396 individuals (Waring et al. 2011a). The North Atlantic right whale is currently listed as endangered on Schedule 1 of SARA and by COSEWIC (Table 6.1; COSEWIC 2003). The North Atlantic right whale is also listed by the United States as endangered throughout its US range (Waring et al. 2011a). Two of the six high-use habitat areas for the western North Atlantic right whale are located in Atlantic Canada. In the summer and autumn, North Atlantic right whales suckle, feed and socialize in the lower Bay of Fundy (Grand Manan Basin), and feed and socialize in Roseway Basin between Browns and Baccaro Banks on the western Scotian Shelf about 50 km south of Nova Scotia (Stone et al. 1988; Kraus and Brown 1992; Brown et al. 1995). Roseway Basin and Grand Manan Basin (Figure 6.1) are designated Critical Habitat for right whale pursuant to the Species at Risk Act (Brown et al. 2009). The Grand Manan Basin is greater than 200 km north of the Project Area and thus is sufficiently distanced from the Project to not require assessment. The Roseway Basin critical habitat is, at its closest point, ~80 km, 41 km, and 15 km from the 2013 Seismic Activity, Project, and Study areas, respectively and is discussed in more detail in Section 6.2.2.1. Right whales locate aggregations of prey at the surface (skim feeding) or at depth (down to at least 200 m). Research suggests that right whales must locate and exploit extremely dense patches of zooplankton to feed efficiently (Mayo and Marx 1990). In the Bay of Fundy, right whales sometimes swim near the bottom as evidenced by the fact that they surface with mud on their heads. Right whales in the Bay of Fundy, tracked with timed depth recorders, were recorded on feeding dives to depths of 80-175 m and lasting for 5 to 14 minutes (Baumgartner and Mate 2003). Baumgartner et al. (2003) observed right whales feeding on Stage 5 Calanus finmarchicus in diapause in Roseway Basin and the lower Bay of Fundy, which were only available in the coldest water, i.e., near the bottom. Based on the DFO sightings database, there have been nine sightings of right whales in the Study Area and one of these sightings occurred within the Project Area (Figure 6.1). Sightings were made in each month from April to August, but primarily occurred in July and August. Most sightings of right whales recorded in the DFO database were made in the Grand Manan Basin critical habitat and to a lesser extent the Roseway Basin critical habitat. However, the sightings of right whales in the Study Area and to the west of the Study Area indicate that it is possible that right whales may be encountered during the seismic survey but likely in small numbers. Effects Assessment The following assessment focuses on right whales that may occur in the Study Area. The effects of the Project on right whales in their Roseway Basin critical habitat are assessed in Section 6.2.2. Airgun Array Noise The hearing abilities of baleen whales (mysticetes) have not been studied directly. Behavioural and anatomical evidence indicates that they hear well at low frequencies below 1 kHz (Richardson et al. 1995; Ketten 2000), where most of the energy from seismic pulses occurs (see Section 1.2.2 and 1.3 of Appendix D). Although there have been no direct studies of right whale response to airgun array noise, there has been considerable systematic study and monitoring of baleen whale response to airgun noise, which indicates a general trend of avoidance of operating airguns with variable avoidance radii. The results of such studies and monitoring are reviewed in detail in Section 1.5.1 of Appendix D.

Shelburne Basin 3-D Seismic Survey LGL Limited Environmental Assessment Page 39
As set out in Section 4.2.1, the key types of airgun array noise effects on marine mammals considered in detail in this assessment are hearing impairment and behavioural effects (i.e., disturbance). Hearing Impairment: Given that baleen whales typically exhibit at least localized avoidance of seismic (see Appendix D); right whales within the Study Area are unlikely to be exposed to levels of sound from the airgun array high enough to cause hearing damage. Based on precautionary acoustic modelling results, it is estimated that right whales (and other baleen whales) would have to occur about <30 m from the airgun array to be exposed to sound levels from a single airgun pulse exceeding the 198 dB SEL criterion for PTS (see Section 4.2 in Appendix A). The mitigation measure of ramping-up the airgun array over a 30-minute period will allow right whales close to the airguns to move away before the sounds become sufficiently strong to have any potential for hearing impairment. Also, ramp-up will not commence if a right whale is sighted within the 180 dB rms safety zone (for the 5,085 in3 array, estimated as ~1,000 m) and the airgun array will be shutdown if a right whale is sighted within this safety zone. In addition to visual monitoring by MMOs, PAM will be used during periods of poor visibility (i.e., when the safety zone cannot be seen) and during pre-ramp up watches. If a right whale is acoustically detected during periods of poor visibility or the pre-ramp up watch, airguns will be shut down or ramp up will be delayed until the whale has been determined to leave the safety zone or 30 minutes have passed from the last detection within the safety zone. Given these mitigation measures and that right whales are expected to exhibit at least localized avoidance of airgun array noise, there is little potential for right whales being close enough to the array to experience PTS. If some whales did experience TTS, the effects would likely be quite “temporary” given the short-term nature of temporary shifts in hearing thresholds. Additionally, few right whales are expected to occur within the Project Area where hearing impairment has the potential to occur. Based on these considerations, airgun array noise is judged to have negligible to minor hearing impairment effects on right whales, over a short-term duration of <1 month to 1-12 months, in an area <1 km2 to 1-10 km2. Therefore, hearing impairment residual effects on right whales are judged to be not significant. The level of confidence associated with this judgement is high. Disturbance Effects: Based on the literature review provided in Appendix D, there could be behavioural or disturbance effects on right whales in the Study Area. Reported behavioural effects for baleen whales range from changes in swimming behaviour to avoidance of seismic vessels operating airgun array(s) (see Section 1.5.1 of Appendix D). Based on acoustic modelling and utilizing the160 dB rms sound level as a guide for avoidance response, the area where avoidance would most likely occur would have a radius of ~8–26 km from the airgun array (see Section 4.2 in Appendix A). This estimate is likely conservative given that some baleen whale species have been observed in areas relatively close to an active seismic source. . It is uncertain how many right whales may occur in the Study Area during the period when seismic surveying will occur (April to September). The Study Area does not contain any identified critical habitat for right whales (the Roseway Basin critical habitat is located approximately 15 km from the Study Area and effects on right whales in their Roseway Basin critical habitat are assessed in Section 6.2.2) Additionally, the Study Area is not known to contain any important feeding, breeding, or socializing areas for right whales. As a result, displacement from an area within the Study Area is unlikely to constitute a significant effect for right whales. Based on these considerations, airgun array noise is judged to have minor to moderate disturbance effects on right whales, over a short-term duration of 1-12 months and a geographic extent ranging from 101-1,000 km2 to 1,001-10,000 km2. Therefore, residual effects related to disturbance, are judged to be not significant for right whales. The level of confidence associated with this judgement is medium.

Shelburne Basin 3-D Seismic Survey LGL Limited Environmental Assessment Page 40
Presence of Vessels Much of the literature concerning marine mammals and ship strikes is about the North Atlantic right whale. Ship strikes have been identified as a major cause of mortality for this species with more than half (53 %) of the documented right whale deaths resulting from ship strikes (Campbell-Malone et al. 2008). While nearly all species of large whale have been victims of collisions with ships (Laist et al. 2001; Glass et al. 2008), right whales are especially vulnerable likely because of certain characteristic behaviours during which they may be less aware of their surroundings. These behaviours include: surface active group (SAG) activity (individuals interacting at the surface with frequent physical contact); skim feeding (swimming slowly at the surface with mouth open); and logging (resting motionlessly at the surface), an activity frequently observed in nursing mothers (Knowlton 1997). There is evidence suggesting that a greater rate of mortality and serious injury correlates with a greater vessel speed at the time of a ship strike (Laist et al. 2001; Vanderlaan and Taggart 2007; Vanderlaan et al. 2009). Most lethal and severe injuries to large whales resulting from documented ship strikes have occurred when vessels were travelling at 26 km/hr (14 knots [kt]) or greater (Laist et al. 2001). Vanderlaan and Taggart (2007) found that if vessel speeds are less than 28 km/hr (15 kt), the probability of a lethal injury (mortality or severely injured) due to a ship-strike substantially decreases. In a review of 58 large whale ship strikes in which the vessel speed was known, the average speed of vessels involved in ship strikes that resulted in mortality or serious injuries to the whale was found to be 34.4 km/hr (19 kt) (Jensen and Silber 2003). In two documented right whale ship strike mortalities in which the vessel speed was known with some degree of certainty, the vessels were travelling at 40.8 km/hr (22 kt) and 28 km/hr (15 kt) (NOAA Fisheries 2004). Though there is some risk for collision between right whales and Project vessels, the slow surveying speed (4.5 to 5 kt; 8.3 to 9.3 km/h) of the seismic vessels and their picket vessels minimizes this risk (Laist et al. 2001; NOAA Fisheries 2004; Vanderlaan and Taggart 2007). The 2013 Seismic Activity Area is more than 80 km from the Roseway Basin right whale critical habitat area (see Figure 6.3 in Section 6.2, Special Areas) and 25 km from the Scotian Shelf. Passive acoustic monitoring (PAM) will also be conducted at nighttime and during periods of poor visibility. In addition, right whales in the Study Area are expected to exhibit at least localized avoidance of vessels, even in the absence of airgun array noise (Appendix D). Effects of the presence of vessels on right whales, i.e., the risk of collisions, are judged to be negligible, over a short-term duration of <1 month, in an area 1-10 km2. Therefore, residual effects related to the presence of vessels, are judged to be not significant for right whales. The level of confidence associated with this judgement is high. 6.1.1.2 Blue Whale Biological Background Summary The blue whale has a broad distribution, but tends to be more frequently observed in deep water than in coastal environments (Jefferson et al. 2008). Blue whales became severely depleted during industrial whaling and still occur at relatively low densities in the North Atlantic. The Atlantic population of blue whales is considered endangered both on SARA Schedule 1, and by COSEWIC. Off Atlantic Canada, blue whales frequent areas of high plankton productivity, including the Gulf of St. Lawrence and shallow coastal zones off Newfoundland, where bottom and surface waters mix. They rely on euphausiids for food, and are migratory animals, which travel in close-knit groups of three or four individuals, but at times congregate in larger herds (Mansfield 1985). This species may dive to depths below 150 m
Shelburne Basin 3-D Seismic Survey LGL Limited Environmental Assessment Page 41
(Rutherford and Breeze 2002). They range widely among their summer feeding grounds (Searsand Larsen 2002), and are found in spring, summer and fall in the Gulf of St. Lawrence, off eastern Nova Scotia and along the north shore of the Gulf, from the St. Lawrence River estuary to the Strait of Belle Isle (Waring et al. 2011a). Little is known about the population size of blue whales except for the Gulf of St. Lawrence area. From 1979 to the summer of 2009, a total of 440 blue whales have been photo-identified, most of which were in the St. Lawrence estuary and northwestern Gulf of St. Lawrence (Waring et al. 2011b). A few blue whales have been photographed along the coast of Newfoundland, on the Scotian Shelf and in the Gulf of Maine, some of which are not included among the 440 blue whales that have been identified in the estuary and northwest of the Gulf of St. Lawrence (Sears and Calambokidis 2002; COSEWIC 2002a). Given the small proportion of the distribution range that has been sampled and considering the low number of blue whales encountered and photographed in a given year, the current data, based on photo-identification, do not allow for an estimate of abundance of this species in the Northwest Atlantic with a minimum degree of certainty (Sears et al. 1987; Hammond et al. 1990; Sears et al. 1990; Sears and Calambokidis 2002; DFO 2009; Waring et al. 2011b). Mitchell (1974) estimated that the blue whale population in the western North Atlantic may number only in the low hundreds. R. Sears (pers. comm.) suggests that 400 to 600 individuals may be found in the western North Atlantic (Waring et al. 2011b). COSEWIC (2002) estimates the number of mature adults at less than 250. Blue whales enter the Gulf of St. Lawrence primarily through the Cabot Strait, where they can be found as early as March. From there, they disperse north into the Gulf, reaching the eastern tip of the Gaspé Peninsula by April. Most have left the Gulf of St. Lawrence by December, although some whales have been sighted along the North Shore of the Gulf well into January, and even on rare occasions in February (Sears 1999). Some blue whales are thought to overwinter along the south and west coasts of Newfoundland. Sutcliffe and Brodie (1977) reported that whalers regularly saw blue whales on the Scotian Shelf from June to November, although few have been reported since whaling ceased in 1972 (CETAP 1982). However, the number of historical observations of blue whales in the North Atlantic is too small to infer the routes and timing of this species’ migration (Reeves 2004). In mid and late August, a few blue whales are consistently seen in the deep canyon area of the Gully, and it is the only portion of the Scotian Shelf/Slope where they have been consistently reported (Whitehead et al. 1998). Based on the DFO sightings database, there have been 18 sightings of blue whales in the Study Area during the April–September time period and two of these sightings occurred within the Project Area (Figure 6.1). Sightings were made in each month from April to September, except June, and primarily occurred in July and August. Most sightings of blue whales recorded in the DFO database were made in the shallower waters of the Scotian Shelf. However, the sightings of blue whales in the Study and Project areas indicate that it is quite possible that blue whales may be encountered during the seismic survey. Blue whales are considered uncommon in the Study Area. Effects Assessment Airgun Array Noise As discussed for right whales in Section 6.1.1.1, the key issues with respect to airgun array noise effects on marine mammals are the potential for hearing impairment and disturbance. Blue whales are thought to be sensitive to low frequency sounds such as those that contribute most of the energy in seismic pulses (see Section 1.2.2 of Appendix D).

Shelburne Basin 3-D Seismic Survey LGL Limited Environmental Assessment Page 42
Hearing Impairment: Given that blue whales (and other baleen whales), typically exhibit at least localized avoidance of seismic and other strong noise (see Appendix D), blue whales will likely not be exposed to levels of sound from the airgun array high enough to cause hearing damage. Results from eight ship-based seismic monitoring programs in Atlantic Canada conducted from 2003 to 2008, observed blue whales farther from the seismic ship during periods when the airguns were active vs. silent. The average sighting distance during periods of seismic vs. non-seismic was 1,904 m (n=17) and 1,227 m (n=12), respectively (Moulton and Holst 2010). The mitigation measure of ramping-up the airgun array over a 30 min period will allow blue whales close to the airguns to move away before the sounds become sufficiently strong to have any potential for hearing impairment. Also, ramp-up will not commence if a blue whale is sighted within the 180 dB rms safety zone (for the 5,085 in3 array, estimated as ~1,000 m) and the airgun array will be shutdown if a blue whale is sighted within this safety zone. In addition to visual monitoring by, PAM will be used during periods of poor visibility (i.e., when the safety zone cannot be seen) and during pre-ramp up watches. If a blue whale is acoustically detected within the safety zone during a 30-minute pre-ramp up watch or during periods of poor visibility, ramp up will not commence or air guns will be shut down until the whale has been determined to leave the safety zone or 30 minutes have passed from the time the blue whale was last detected in the safety zone. Given these mitigation measures and that blue whales are expected to exhibit at least localized avoidance of airgun array noise, there is little potential for blue whales being close enough to the array to experience PTS. Based on precautionary acoustic modelling results, it is estimated that blue whales (and other baleen whales) would have to occur about <30 m from the airgun array to be exposed to sound levels exceeding the 198 dB SEL criterion for PTS (see Section 4.2 in Appendix A). If some whales did experience TTS, the effects would likely be quite “temporary” given the short-term nature of temporary shifts in hearing thresholds. Based on these considerations, airgun array noise is judged to have negligible to minor hearing impairment effects on blue whales, over a short-term duration of <1 month to 1-12 months, in an area <1 km2 to 1-10 km2. Therefore, hearing impairment residual effects on blue whales are judged to be not significant. The level of confidence associated with this judgement is high. Disturbance Effects: Based on the literature review provided in Appendix D, there could be behavioural or disturbance effects on blue whales in the Study Area. Reported effects for baleen whales range from changes in swimming behaviour to avoidance of seismic vessels operating airgun array(s) (see Section 1.5.1 of Appendix D). Using acoustic modelling results along with the 160 dB rms sound level as a guide for avoidance response, the area where avoidance would most likely occur would have a radius of ~8–26 km from the airgun array (see Section 4.2 in Appendix A). This estimate is likely conservative given that some baleen whale species, including blue whales, have been observed in areas relatively close to an active seismic source. It is uncertain how many blue whales may occur in the Study Area during the period when seismic surveying will occur (April to September). The Study Area does not include any identified critical habitat for blue whales and is not known to be an important feeding or breeding area for blue whales. Available evidence suggests that their preferred habitat is shallower waters of the Scotian Shelf and the Gulf of St. Lawrence. As a result, it is unlikely that localized displacement from an area within the Study Area constitutes a significant effect for blue whales. Based on these considerations, airgun array noise is judged to have minor to moderate disturbance effects on blue whales, over a short-term duration of 1-12 months and a geographic extent ranging from 101-1,000 km2 to 1,001-10,000 km2. Therefore, residual effects related to disturbance, are judged to be not significant for blue whales. The level of confidence associated with this judgement is medium.

Shelburne Basin 3-D Seismic Survey LGL Limited Environmental Assessment Page 43
Presence of Vessels There is some risk for collision between whales and Project vessels, but given the slow surveying speed (4.5 to 5 kt; 8.3 to 9.3 km/h) of the seismic vessels and their picket vessels, this risk is considered minimal (Laist et al. 2001; Vanderlaan and Taggart 2007). In addition, blue whales are expected to exhibit at least localized avoidance of vessels, even in the absence of airgun array noise (see Section 1.5.1 of Appendix D). Effects of the presence of vessels on blue whales, i.e., the risk of collisions, are therefore judged to be negligible, over a short-term duration of <1 month, in an area 1-10 km2. Therefore, residual effects related to the presence of vessels, are judged to be not significant for blue whales. The level of confidence associated with this judgement is high. 6.1.1.3 Northern Bottlenose Whale Biological Background Summary The distribution of northern bottlenose whales is restricted to the North Atlantic, primarily in deep, offshore areas with two regions of concentration: The Gully and adjacent submarine canyons on the eastern Scotian Shelf, and Davis Strait off northern Labrador (Reeves et al. 1993). Throughout their range, northern bottlenose whales were harvested extensively during industrial whaling, which likely greatly reduced total numbers (COSEWIC 2011). The total abundance of northern bottlenose whales in the North Atlantic is unknown, but the Scotian Shelf population is believed to be comprised of ~163 individuals (Whitehead and Wimmer 2005). The northern bottlenose whales of the Scotian Shelf population are most commonly sighted in three large canyons, the Gully, Shortland Canyon and Haldimand Canyon. It is thought that northern bottlenose whales from the Gully population spend 40% of their time in the Gully concentration area, 15% in Shortland Canyon, and 15% in Haldimand Canyon located 50 km and 100 km to the east of the Gully, respectively. It is unknown where whales spend the remaining 30% of their time (H. Whitehead, Dalhousie University, pers. comm. in Moulton et al. 2003). The Gully is estimated to contain a third to half of the Scotian Shelf population at any given time of year (Gowans et al. 2000). The Scotian Shelf population is currently designated as endangered under Schedule 1 of SARA and by COSEWIC. This population is considered to be present in the Gully and adjacent submarine canyons year-round (Whitehead and Wimmer 2002). Northern bottlenose whales are believed to breed in July and August. Waters approximately 1,000 m deep are thought to be the bottlenose whales’ preferred habitat (Whitehead and Wimmer 2002). In the Gully, bottlenose whales are primarily distributed in waters 500–1,750 m deep, with relatively steep slopes; concentrations are greatest in waters from 750–1,500 m (Hooker et al. 2002). Hooker et al. (2002) found a strong relationship between bottlenose distributions and local depths and slopes. It is thought that northern bottlenose whales spend 30% of their time in the upper 150 m of the water column. Foraging apparently occurs at depth, primarily on mesopelagic squid of the genus Gonatus and fish (Hooker et al. 2001; COSEWIC 2011). Based on the DFO sightings database, there have been 25 sightings of northern bottlenose whales in the Study Area during the April–September time period and four of these sightings occurred within the Project Area (Figure 6.1). Sightings were made in the Study Area each month from April to August, with most sightings made in July and August. Group size of sightings ranged from 1–7 northern bottlenose whales. Most sightings of northern bottlenose whales recorded in the DFO database in and near the Study Area were made along the shelf break, with some sightings in much deeper water (>3,500 m). Northern bottlenose whales could be present within the Study Area during the seismic

Shelburne Basin 3-D Seismic Survey LGL Limited Environmental Assessment Page 44
survey period (and indeed any time of the year), but will most likely occur outside of the Study Area on the eastern Scotian Shelf in the Gully and adjacent submarine canyons. Effects Assessment Airgun Array Noise The smaller species of odontocetes that have been studied have exhibited relatively poor hearing sensitivity at the low frequencies that contribute most of the energy in seismic pulses. Sounds from seismic pulses are sufficiently strong that they remain above the hearing threshold of odontocetes (presumably including northern bottlenose whales) at tens of kilometres from the source (see Section 1.2.1 of Appendix D). Hearing Impairment: Available data on odontocetes, including northern bottlenose whales, indicates that these marine mammals typically exhibit at least localized avoidance of seismic and other strong noise (see Appendix D). As such, northern bottlenose whales will likely not be exposed to levels of sound from the airgun array high enough to cause hearing damage. Results from eight ship-based seismic monitoring programs conducted in Atlantic Canada from 2003 to 2008, observed northern bottlenose whales (n=3 sightings, totalling 17 individuals), ~ 0.6–1 km from the seismic vessel during periods when airguns were activated (Moulton and Holst 2010). Based on conservative acoustic modelling results, it is estimated that northern bottlenose whales (and other mid-frequency cetaceans) would have to occur about ~10 m from the airgun array to be exposed to sound levels exceeding the 198 dB SEL criterion for PTS (see Section 4.2 in Appendix A). The mitigation measure of ramping-up the airgun array over a 30-min period will allow northern bottlenose whales close to the airguns to move away before the sounds become sufficiently strong to have any potential for hearing impairment. Also, ramp-up will not commence if a northern bottlenose whale is sighted within the 180 dB rms safety zone (for the 5,085 in3 array, estimated as ~1,000 m) and the airgun array will be shutdown if this species is sighted within this safety zone. In addition to visual monitoring by MMOs, PAM will be used during periods of poor visibility (i.e., when the safety zone cannot be seen) and during pre-ramp up watches. If a bottlenose whale is acoustically detected within the safety zone during a pre-ramp up watch or during periods of poor visibility, ramp up will be delayed or airguns will be shut down. Ramp up will not commence until the whale has been determined to leave the safety zone or 60 minutes have passed from the last time the whale was detected within the safety zone. Given these mitigation measures and that northern bottlenose whales are expected to exhibit at least localized avoidance of airgun array noise, there is little potential for bottlenose whales being close enough to the array to experience PTS. In addition, this species is most likely to occur outside of the Study Area on the eastern Scotian Shelf in the Gully and adjacent submarine canyons. If some whales did experience TTS, the effects would likely be quite “temporary” given the short-term nature of temporary shifts in hearing thresholds. Based on these considerations, airgun array noise is judged to have negligible hearing impairment effects on bottlenose whales, over a short-term duration of <1 month, in an area <1 km2. Therefore, hearing impairment residual effects on bottlenose whales are judged to be not significant. The level of confidence associated with this judgement is high. Disturbance Effects: Based on the review provided in Appendix D, there could be behavioural or disturbance effects on some northern bottlenose whales in the Study Area. Based on acoustic modelling results and using the 160 dB rms sound level as a guide for avoidance response, the area where avoidance would most likely occur would have a radius of ~8–26 km from the airgun array (see Section 4.2 in Appendix A). This

Shelburne Basin 3-D Seismic Survey LGL Limited Environmental Assessment Page 45
estimate is likely conservative given that some odontocetes, including northern bottlenose whales, have been observed in areas relatively close to an active seismic source (i.e., ~ 0.6–1 km). . It is uncertain how many bottlenose whales may occur in the Study Area during the period when seismic surveying will occur (April to September) but numbers are expected to be low given that this species is most likely to occur outside of the Study Area on the eastern Scotian Shelf in the Gully and adjacent submarine canyons. The Study Area does not contain any designated critical habitat for bottlenose whales and is not known to be an important feeding or breeding area for bottlenose whales. As a result, it is unlikely that displacement from an area within the Study Area constitutes a significant effect for northern bottlenose whales. Based on these considerations, airgun array noise is judged to have minor to moderate disturbance effects on bottlenose whales, over a short-term duration of 1-12 months and a geographic extent ranging from 101-1,000 km2 to 1,001-10,000 km2. Therefore, residual effects related to disturbance, are judged to be not significant for northern bottlenose whales. The level of confidence associated with this judgement is medium. Presence of Vessels As discussed previously, there is some risk for collision between whales and Project vessels. This risk is somewhat higher for bottlenose whales given that this species is known to approach vessels in contrast to other beaked whales. However, given the slow surveying speed (4.5 to 5 kt; 8.3 to 9.3 km/h) of the seismic vessels and their picket vessels, this risk is considered minimal (Laist et al. 2001; Vanderlaan and Taggart 2007). Also, few northern bottlenose whales are expected to occur in the Project Area. Thus, effects of the presence of vessels on northern bottlenose whales, i.e., the risk of collisions, are judged to be negligible, over a duration of <1 month, in an area 1-10 km2. Therefore, residual effects related to the presence of vessels, are judged to be not significant for northern bottlenose whales. The level of confidence associated with this judgement is high. 6.1.1.4 Fin Whale Biological Background Summary Fin whales are widely dispersed in the north Atlantic and likely occur year-round on the Scotian Shelf and Shelf Edge (Meredith and Campbell 1988). This species appears to favour the south-western portions of the Scotian Shelf and the Gulf of Maine, but is also found west of Sable Island, on Sable Island Bank (Kenney 1994). There are an estimated 3,985 individuals in the western North Atlantic stock (Coefficient of Variation [CV] = 0.24; Waring et al. 2011a). Based on aerial surveys conducted from northern Labrador to the Scotian Shelf in July-August 2007, an estimated 1,716 fin whales (CV = 0.26) occur in this region (Table 6 in Lawson and Gosselin 2009; Waring et al. 2011a). The Atlantic population of fin whale is currently designated as special concern under Schedule 1 of SARA and by COSEWIC (Table 6.1). In eastern Canadian waters, fin whales consume primarily euphausiids and capelin, with euphausiids occurring more frequently early in the year and the capelin proportion increasing later in the summer (Sergeant 1966). Fin whales have also been observed feeding on herring off Nova Scotia. They tend to be found in areas where these prey concentrate, such as in areas of upwelling, shelf breaks, and banks (COSEWIC 2005). Fin whales dive to depths below 450 m (Rutherford and Breeze 2002). Fin whales are found in summer feeding concentrations between the shore and the 1,800 m depth contour.

Shelburne Basin 3-D Seismic Survey LGL Limited Environmental Assessment Page 46
The stock that summers off Nova Scotia may be distinct from the stock which summers off Newfoundland, with as little as 10% overlap. It is suggested that the Newfoundland and Nova Scotia stocks move southward in the winter, with the Newfoundland stock moving into the summer grounds of the Nova Scotia stock and the Nova Scotia stock moving further south (Kellogg 1929; Allen 1971; Mitchell 1974; Meredith and Campbell 1988). Little is known of the fall and winter distribution of fin whales, but they are known to move southwards, migrating to winter feeding grounds along the North American coast as far south as 35°N. Some whales remain farther north, and fin whales have been reported off eastern Nova Scotia and along the Continental Shelf from November to May (Meredith and Campbell 1988). Based on the DFO sightings database, there have been 169 sightings of fin whales in the Study Area during the April–September time period, including 32 sightings within the Project Area (Figure 6.2). Sightings were made in each month from April to September and primarily occurred in July and August. Most sightings in the Study Area were of individual fin whales but a maximum group size of 29 fin whales was recorded. Also, most sightings of fin whales recorded in the DFO database were made in the shallower waters of the Scotian Shelf. However, the sightings of fin whales in the Project Area indicate that it is very likely that fin whales will be encountered during the seismic survey.
Figure 6.2 Sightings of Fin Whales Observed from April–September, 1966–2012 (DFO database).

Shelburne Basin 3-D Seismic Survey LGL Limited Environmental Assessment Page 47
Effects Assessment Airgun Array Noise As discussed for right and blue whales, the key considerations with respect to airgun array noise effects on marine mammals are the potential for hearing impairment and disturbance. Fin whales are thought to be sensitive to low frequency sounds such as those that contribute most of the energy in seismic pulses (see Section 1.2.2 of Appendix D). Hearing Impairment: Given that fin whales (and other baleen whales), typically exhibit at least localized avoidance of seismic and other strong noise (see Section 1.6 of Appendix D), fin whales will likely not be exposed to levels of sound from the airgun array high enough to cause hearing damage. For example, based on the results of eight ship-based seismic monitoring programs conducted in Atlantic Canada from 2003 to 2008, fin whales (n=68), on average, were sighted ~ 2 km from the seismic vessel during periods when airguns were activated (Moulton and Holst 2010). Based on precautionary acoustic modelling results, it is estimated that fin whales (and other baleen whales) would have to occur about <30 m from the airgun array to be exposed to sound levels from a single airgun pulse exceeding the 198 dB SEL criterion for PTS (see Section 4.2 of Appendix A). The mitigation measure of ramping-up the airgun array over a 30-min period will allow fin whales close to the airguns to move away before the sounds become sufficiently strong to have any potential for hearing impairment. Also, ramp-up will not commence if a fin whale is sighted within the 180 dB rms safety zone (for the 5,085 in3 array, estimated as ~1,000 m) and the airgun array will be shutdown if a fin whale is sighted within this safety zone. In addition to visual monitoring by MMOs, PAM will be used during periods of poor visibility (i.e., when the safety zone cannot be seen) and during pre-ramp up watches. If a fin whale is acoustically detected within the safety zone during a pre-ramp up watch or during a period of poor visibility, ramp up will not commence or airguns will be shut down until the whale has been determined to leave the safety zone or 30 minutes have passed since the last detection within the safety zone. Given these mitigation measures and that fin whales are expected to exhibit at least localized avoidance of airgun array noise, there is little potential for fin whales being close enough to the array to experience PTS. If some whales did experience TTS, the effects would likely be quite “temporary”. Based on these considerations, airgun array noise is judged to have negligible to minor hearing impairment effects on fin whales, over a duration of <1 month to1-12 months, in an area <1 km2 to 1-10 km2. Therefore, hearing impairment residual effects on fin whales are judged to be not significant. The level of confidence associated with this judgement is high. Disturbance Effects: Based on the literature review provided in Appendix D, there could be behavioural or disturbance effects on some fin whales in the Study Area. Reported effects for baleen whales range from changes in swimming behaviour to avoidance of seismic vessels operating airgun array(s) (see Section 1.5.1 of Appendix D). Based on conservative acoustic modelling results and using the 160 dB rms sound level as a guide for avoidance response, the area where avoidance would most likely occur would have a radius of ~8–26 km from the airgun array (see Section 4.2 of Appendix A). This estimate is likely precautionary given that some baleen whale species, including fin whales, have been observed in areas relatively close to an active seismic source (~2 km; see Moulton and Holst 2010). It is uncertain how many fin whales may occur in the Study Area during the period when seismic surveying will occur (April to September). The Study Area does not include any designated critical habitat for fin whales and is not known to be an important feeding or breeding area for fin whales (although this

Shelburne Basin 3-D Seismic Survey LGL Limited Environmental Assessment Page 48
has not been specifically studied). Available evidence suggests that their preferred habitat is shallower waters of the Scotian Shelf. As a result, it is unlikely that displacement from an area within the Study Area constitutes a significant effect for fin whales. Based on these considerations, airgun array noise is judged to have minor to moderate disturbance effects on fin whales, over a short-term duration of 1-12 months and a geographic extent ranging from 101-1,000 km2 to 1,001-10,000 km2. Therefore, residual effects related to disturbance, are judged to be not significant for fin whales. The level of confidence associated with this judgement is medium. Presence of Vessels As discussed previously, there is some risk for collision between baleen whales and Project vessels, but given the slow surveying speed (4.5 to 5 kt; 8.3 to 9.3 km/h) of the seismic vessels and their picket vessels, this risk is considered minimal (Laist et al. 2001; Vanderlaan and Taggart 2007). In addition, fin whales are expected to exhibit at least localized avoidance of vessels, even in the absence of airgun array noise. Based on these considerations, effects of the presence of vessels on fin whales, i.e., the risk of collisions, are judged to be negligible, over a short-term duration of <1 month, in an area 1-10 km2. Therefore, residual effects related to the presence of vessels, are judged to be not significant for fin whales. The level of confidence associated with this judgement is high. 6.1.1.5 Sowerby’s Beaked Whale Biological Background Summary The Sowerby’s beaked whale is a small beaked whale found only in the North Atlantic, primarily in deep, offshore temperate to subarctic waters (COSEWIC 2006a). Designated as special concern (Schedule 1) under SARA and by COSEWIC, it is unclear if Sowerby’s beaked whales are truly uncommon or just poorly surveyed due to their deep-diving behaviour, small size, and offshore habitat. Sowerby’s beaked whales are the most northerly distributed of the Mesoplodon spp., with all but one record occurring in the NW Atlantic between New England and Labrador (MacLeod 2000; MacLeod et al. 2006). There are an unknown number of Sowerby’s beaked whales in the North Atlantic, but they are occasionally encountered offshore of eastern Canada. In 1997 and 1998 there were four confirmed sightings of Sowerby’s beaked whale in the Gully (located ~213 km from the Project Area); whales were in groups ranging from 3 to 8-10 individuals (Hooker and Baird 1999). One Sowerby’s beaked whale also stranded on Sable Island in 1997 (Lucas and Hooker 2000). There are no sightings recorded in the Study Area based on the DFO database (Figure 6.1). They are most often observed in deep water, along the shelf edge and slope. Based on analysis of stomach contents, they appear to prefer mid to deep-water fish and squid (MacLeod et al. 2003). Given the relatively few sightings of this species recorded in the offshore waters of Nova Scotia, it is considered rare in the Study Area though survey effort in deep waters off Atlantic Canada have been limited (COSEWIC 2006a). Effects Assessment Airgun Array Noise As discussed for the northern bottlenose whale in Section 6.1.1.3, the smaller species of odontocetes that have been studied have exhibited relatively poor hearing sensitivity at the low frequencies that contribute most of the energy in seismic pulses. Sounds from seismic pulses are sufficiently strong that
Shelburne Basin 3-D Seismic Survey LGL Limited Environmental Assessment Page 49
they remain above the hearing threshold of odontocetes (presumably including Sowerby’s beaked whales) at tens of kilometres from the source (see Section 1.2.1 of Appendix D). Hearing Impairment: Available data on odontocetes, including beaked whales, indicates that these marine mammals typically exhibit at least localized avoidance of seismic (and other strong) noise (see Section 1.6 of Appendix D). A single sighting of four Sowerby’s beaked whales was made during eight ship-based seismic monitoring programs conducted in Atlantic Canada from 2003 to 2008. This group was observed milling in front of a seismic vessel and allowed the vessel to approach within ~1.3 km before they dove out of sight (Moulton and Holst 2010). Based on precautionary acoustic modelling results, it is estimated that Sowerby’s beaked whales (and other mid-frequency cetaceans) would have to occur about ~10 m from the airgun array to be exposed to sound levels from a single airgun pulse exceeding the 198 dB SEL criterion for PTS (see Section 4.2 of Appendix A). As such, Sowerby’s beaked whales will likely not be exposed to levels of sound from the airgun array high enough to cause hearing damage. The mitigation measure of ramping-up the airgun array over a 30 min period will allow Sowerby’s beaked whales close to the airguns to move away before the sounds become sufficiently strong to have any potential for hearing damage. Also, ramp-up will not commence if a Sowerby’s beaked whale is sighted within the 180 dB rms safety zone (for the 5,085 in3 array, estimated as ~1,000 m) and the airgun array will be shutdown if a Sowerby’s beaked whale is sighted within this safety zone. In addition to visual monitoring by MMOs, PAM will be used during periods of poor visibility (i.e., when the safety zone cannot be seen) and during pre-ramp up watches. If a Sowerby’s beaked whale is acoustically detected within the safety zone during a pre-ramp up watch or during a period of poor visibility, ramp up will not commence or airguns will be shut down until the whale has been determined to leave the safety zone or 60 minutes have passed since the last detection. Given these mitigation measures and that Sowerby’s beaked whales are expected to exhibit at least localized avoidance of airgun array noise, there is little potential for this species being close enough to the array to experience PTS. In addition, this species is considered rare in the Study Area. If some whales did experience TTS, the effects would likely be quite “temporary” given the short-term nature of temporary shifts in hearing thresholds. Based on these considerations, airgun array noise is judged to have negligible hearing impairment effects on Sowerby’s beaked whales, over a short-term duration of <1 month, in an area <1 km2. Therefore, hearing impairment residual effects on Sowerby’s beaked whales are judged to be not significant. The level of confidence associated with this judgement is high. Disturbance Effects: Based on the literature review provided in Appendix D, there could be behavioural or disturbance effects on some Sowerby’s beaked whales in the Study Area. Based on conservative acoustic modelling results and using the 160 dB rms sound level as a guide for avoidance response, the area where avoidance would most likely occur would have a radius of ~8–26 km from the airgun array (see Section 4.2 of Appendix A). This estimate is likely conservative given that some odontocetes, including Sowerby’s beaked whales, have been observed in an area relatively close to an active seismic source (i.e., ~ 1.3 km). It is uncertain how many Sowerby’s beaked whales may occur in the Study Area during the period when seismic surveying will occur (April to September) but numbers are expected to be quite low given that this species is considered rare in the Study Area. Additionally, the Study Area does not include any designated critical habitat for Sowerby’s beaked whale and is not known to be an important feeding or breeding area for Sowerby’s beaked whale (although this has not been specifically studied). It is unlikely that displacement from an area within the Study Area constitutes a significant effect for Sowerby’s beaked whales. Based on these considerations, airgun array noise is judged to have minor to moderate disturbance effects on

Shelburne Basin 3-D Seismic Survey LGL Limited Environmental Assessment Page 50
Sowerby’s beaked whales, over a short-term duration of 1-12 months and a geographic extent ranging from 101-1,000 km2 to 1,001-10,000 km2. Therefore, residual effects related to disturbance, are judged to be not significant for this species. The level of confidence associated with this judgement is high. Presence of Vessels As discussed previously, there is some risk for collision between whales and Project vessels, but given the slow surveying speed (4.5 to 5 knots; 8.3 to 9.3 km/h) of the seismic vessels and their picket vessels, this risk is considered minimal (Laist et al. 2001; Vanderlaan and Taggart 2007). In addition, Sowerby’s beaked whales are expected to exhibit at least localized avoidance of vessels, even in the absence of airgun array noise. Also, few Sowerby’s beaked whales are expected to occur in the Project Area. Based on these considerations, effects of the presence of vessels on Sowerby’s beaked whales, i.e., the risk of collisions, are judged to be negligible, over a short-term duration of <1 month, in an area 1-10 km2. Therefore, residual effects related to the presence of vessels, are judged to be not significant for Sowerby’s beaked whales. The level of confidence associated with this judgement is high. 6.1.1.6 Leatherback Sea Turtle Biological Background Summary The largest and most widely ranging of sea turtles, the leatherback sea turtle ranges from sub-polar and cool temperate foraging grounds to tropical and sub-tropical nesting/wintering areas in all of the world’s oceans (Spotila 2004). There are an estimated 34,000-94,000 adult leatherback sea turtles in the North Atlantic (TEWG 2007), but there is no current reliable estimate of the number of leatherbacks using eastern Canadian waters. Leatherback sea turtles are currently designated as endangered by COSEWIC (COSEWIC 2002b, 2012). Leatherback sea turtles were split into two populations (Atlantic and Pacific) in May 2012 and reassessed by COSEWIC; however, they are not currently divided into two designatable units. Both populations were designated as endangered in May 2012 by COSEWIC. Leatherback sea turtles are listed as endangered on Schedule 1 of SARA; there are currently no separate listings for each population. Leatherback sea turtles have also been listed by the United States as endangered throughout its range since 1970 (NOAA 2002). Most leatherbacks that occur in Atlantic Canadian waters are large sub-adults and adults, with a female-biased sex ratio among mature turtles (James et al. 2007). The leatherback winters off western Africa or in the Caribbean, often crossing the Scotian Shelf in spring and fall on its way south (NS Leatherback Turtle Working Group 2002). Leatherback distribution correlates to the distribution of the jellyfish that make up their primary prey (COSEWIC 2012; Dodge et al. 2011). On the east coast of Canada, leatherbacks are often sighted between May and November (O’Boyle 2001; Atlantic Leatherback Turtle Recovery Team 2006; James et al. 2006). They have been found as far north as Labrador with a few animals reported in the Gulf of St. Lawrence (James 2001). In 1998 to 2005, 851 leatherback turtle sightings were documented by a fisher-scientist collaborative venture entitled the Nova Scotia Leatherback Turtle Working Group (NSLTWG; now called the Canadian Sea Turtle Network). The NSLTWG group was initiated in Atlantic Canada to investigate the distribution of leatherback turtles in the northwest Atlantic (James et al. 2006). Sightings peak on average around the first week of August (James et al. 2006). These sightings suggest regular occurrence on the Scotian Shelf as well as on the shelf slope and beyond. They also suggest that leatherbacks are broadly distributed on the Scotian Shelf. A study of satellite tagged leatherbacks in Canadian waters showed

Shelburne Basin 3-D Seismic Survey LGL Limited Environmental Assessment Page 51
that they concentrated their movements in water off eastern Canada and northeastern U.S. for up to four months (after tagging) (James et al. 2005). They spent the greatest part of their time on areas of the continental shelf and the shelf slope, including the Study Area. Tagged individuals started their southward migration on dates ranging from 12 August to 15 December, but the majority left in October. This migration occurred across a broad expanse of ocean. The satellite tagging study found a mean departure date of 23 October (Sherrill-Mix et al. 2008). A model based on these data predicted departure of 90% of the turtles from Cape Breton Island by 10 October and from Georges Bank by 11 December. On their return, northward migration, tagged leatherbacks typically arrived north of 38°N in June (range: 25 March to 16 August), usually returning to within several hundred kilometers of the foraging area used the previous summer (James et al. 2005). Based on the DFO sightings database, there have been four sightings of leatherback sea turtles in the Study Area during the April–September time period, all of which occurred within the Project Area (Figure 6.1) and during July. The numbers of leatherback sightings each summer suggest that summer leatherback densities in eastern Canada may be higher than the estimate of 100 to 900 leatherbacks per summer reported by Shoop & Kenney (1992) for a much larger study area along the coast of the northeastern United States (James et al. 2006). Effects Assessment Airgun Array Noise Although there have been studies on sea turtle hearing, these studies are limited and the available data are not comprehensive. However, these data do demonstrate that sea turtles appear to be low-frequency specialists (see Section 1 of Appendix E). Hearing Impairment: Based on available data, from studies conducted on captive and terrestrial turtles, it is possible that leatherback sea turtles might exhibit temporary hearing loss or perhaps even permanent hearing damage if the turtles are close to the airguns (see Section 4 of Appendix E). However, there is not enough information on sea turtle temporary hearing loss and no data on permanent hearing loss to reach any definitive conclusions about received sound levels that trigger TTS. In general, the received sound must be strong for either to occur, and must be especially strong and/or prolonged for permanent impairment to occur. Also, it is likely that sea turtles will exhibit behavioural reactions or avoidance within an area of unknown size around a seismic vessel(s). In the absence of specific hearing impact criteria for sea turtles, it has become standard practice to use the same criteria applied to cetaceans.
The mitigation measure of ramping-up the airgun array over a 30 min period should permit leatherback sea turtles close to the airguns to move away before the sounds become sufficiently strong to have any potential for hearing impairment. Also, ramp-up will not commence if a leatherback is sighted within the 180 dB rms safety zone (for the 5,085 in3 array, estimated as ~1,000 m) and the airgun array will be shutdown if a leatherback sea turtle (or other sea turtle) is sighted within the safety zone. It is recognized that visually detecting sea turtles at distances of 1,000 m from the seismic vessel will be challenging, particularly in periods of poor or even moderate visibility due to sea state and/or fog. However, given the endangered status of leatherback sea turtles, and their occurrence in the Project Area during summer, the use of a 180 dB rms safety zone is considered precautionary and doubles the minimum requirement

Shelburne Basin 3-D Seismic Survey LGL Limited Environmental Assessment Page 52
for sea turtles established in the Statement of Canadian Practice with respect to Mitigation of Seismic Sound in the Marine Environment. MMOs will be instructed to monitor the 180 dB rms safety zone for sea turtles with vigilance and to the best of their abilities.
It is anticipated that a low number of leatherback turtles is likely to occur in the Study Area. Mitigation measures (ramp up delay, ramp up, and shut downs of the airgun arrays) will minimize the exposure of leatherbacks to sound levels that may cause hearing impairment. If some turtles did experience TTS, the effects would likely be quite “temporary” given the short-term nature of temporary shifts in hearing thresholds. Based on these considerations, airgun array noise is judged to have negligible to minor hearing impairment on leatherback sea turtles, over a short-term duration of <1 month to 1-12 months, in an area <1 km2 to 1-10 km2. Therefore, hearing impairment residual effects on leatherback sea turtles are judged to be not significant. The level of confidence associated with this judgement is high. Disturbance Effects: Leatherback sea turtles would likely exhibit avoidance from airgun arrays (see Section 2 of Appendix E). Based on observations of green and loggerhead sea turtles, behavioural avoidance may occur at received sound levels ranging from 166–175 dB re 1 μPa (rms) (see Appendix E). Based on conservative acoustic modelling results and using these sound levels as a guide for avoidance, the area where avoidance would most likely occur would have a radius of ~3–16 km from the airgun array (see Section 4.2 of Appendix A). The Study Area does not include any designated critical habitat for Leatherback Sea Turtles and is not known to be an important feeding area or in proximity to any identified nesting sites. As a result, it is unlikely that displacement from an area within the Study Area constitutes a significant effect for Leatherback sea turtles. Based on these considerations, airgun array noise is judged to have minor disturbance effects on leatherback sea turtles, over a short-term duration of <1 month to 1-12 months and a geographic extent ranging from 11-100 km2 to 101-1,000 km2. Therefore, residual effects related to disturbance, are judged to be not significant for leatherback sea turtles. The level of confidence associated with this judgement is high. Presence of Vessels Other potential effects to leatherback sea turtles during seismic operations include entanglement with seismic gear (e.g., buoys) and ship strikes (Pendoley 1997; Ketos Ecology 2007; Weir 2007; Hazel et al. 2007). The risk of ship strikes is minimized because of the slow survey speed and constant course of travel of seismic vessels and their accompanying picket vessels. Entanglement of sea turtles with marine debris, fishing gear, and other equipment has been documented; turtles can become entangled in cables, lines, nets, or other objects suspended in the water column and can become injured or fatally wounded, drowned, or suffocated (e.g., Lutcavage et al. 1997). Seismic-survey personnel have reported that sea turtles (number unspecified) became fatally entrapped between gaps in tail-buoys associated with industrial seismic vessel gear deployed off West Africa in 2003 (Weir 2007). However, there have been numerous surveys where no incidents of entanglement of sea turtles have been documented. For example, during U.S. National Science Foundation-funded seismic surveys, which since 2003 have included dedicated ship-based monitoring by trained biological observers (over 74,000 km of monitoring), in some cases in areas with many sea turtles, there were no sea turtle entanglements (e.g., Holst et al. 2005a,b; Holst and Smultea 2008; Hauser et al. 2008). To further reduce the potential of leatherbacks (and other sea turtles) becoming entangled in towed seismic gear during the Project, turtle guards (Ketos Ecology 2009) will be deployed on tail buoys of the streamer vessels.

Shelburne Basin 3-D Seismic Survey LGL Limited Environmental Assessment Page 53
Based on these considerations, effects of the presence of vessels on leatherback sea turtles, including the risk of collisions and gear entanglement, are judged to be negligible to minor, over a short-term duration of <1 month to 1-12 months, in an area 1-10 km2. Therefore, residual effects related to the presence of vessels, are judged to be not significant for leatherback sea turtles. The level of confidence associated with this judgement is high. 6.1.1.7 Wolffishes The status of the northern wolffish and the spotted wolffish for both Schedule 1 of SARA and COSEWIC is threatened, while the status of the Atlantic wolffish for both Schedule 1 of SARA and COSEWIC is special concern (Table 6.1). The combined recovery strategy for northern and spotted wolffishes and management plan for Atlantic wolffish was completed in 2008 (Kulka et al. 2008). At a 2010 meeting for the Zonal Advisory Process for the Pre-COSEWIC Assessment of these three wolffish species, it was stated that there have not been any significant advances in DFO’s understanding of life history characteristics of the three species in recent times (DFO 2011a). Biological Background Summary Northern Wolffish The northern wolffish is a deepwater fish of cold northern seas that has been caught at depths ranging from 38 to 1,504 m. Observed densest concentrations have been between 500 and 1,000 m where water temperatures range from 2 to 5°C. During 1980-1984, this species was most concentrated on the northeast Newfoundland and Labrador shelf and banks, the southwest and southeast slopes of the Grand Banks, and along the Laurentian Channel. Between 1995 and 2003, the area occupied by this species and its associated density within this area were considerably reduced compared to results of earlier surveys. Northern wolffish are known to inhabit a wide range of bottom substrate types, including mud, sand, pebbles, small rock and hard bottom, with the highest concentrations observed over sand and shell hash in the fall, and coarse sand in the spring. Unlike other wolffish species, both juvenile and adult stages of this species have been found a considerable distance above the bottom (Kulka et al. 2008). Prey of northern wolffish are primarily bathypelagic (>200 m depth) biota such as ctenophores and medusa, but also include mesopelagic biota (<200 m depth) and benthic invertebrates. Pelagic fish represent the largest percentage of stomach contents on the basis of volume. Therefore, the northern wolffish is considered a piscivore (DFO 2011a). Tagging studies have suggested limited migratory behaviour by these wolffish. Northern wolffish typically spawn late in the year on rocky bottom. Cohesive masses of fertilized eggs are laid in crevices but are unattached to the substrate. Pelagic larvae hatch after an undetermined egg incubation time, and typically feed on crustaceans, fish larvae and fish eggs (Kulka et al. 2008). Analysis of DFO commercial fishery landings data, April to September 2005-2010, indicates that no northern wolffish were harvested within the Study Area during that six year period. FishBase (http://www.fishbase.org/search.php) indicates that the distribution for this wolffish species abuts or slightly overlaps with the Study Area but not the Project Area. A 2001 review of the status of northern wolffish indicated that this species was near the southern limit of its range in the Maritimes Region. A recent review confirms that conclusion with the composite distribution pattern from all data sources in the Maritimes Region indicating that this wolffish species is

Shelburne Basin 3-D Seismic Survey LGL Limited Environmental Assessment Page 54
restricted primarily to the eastern Scotian Shelf, with some fish found along the shelf edge in NAFO Divisions 4WX. Abundance in each survey examined has always been very low with this species occurring in less than 0.5% of the sets (Simon et al. 2011).
Spotted Wolffish
The life history of the spotted wolffish is very similar to that of the northern wolffish except that it seldom inhabits the deepest areas used by the northern wolffish. Although spotted wolffish have been caught at depths ranging from 56 to 1,046 m, the densest concentrations observed occur between 200 and 750 m where water temperatures range from 1.5 to 5°C. During 1980-1984, spotted wolffish were most concentrated on the northeast Newfoundland and Labrador shelf and banks, the southwest and southeast slopes of the Grand Banks, along the Laurentian Channel, and in the Gulf of St. Lawrence. Between 1995 and 2003, the area occupied by the spotted wolffish and its associated density within this area were considerably reduced compared to results of earlier surveys. As with northern wolffish, spotted wolffish also inhabit a wide range of bottom substrate types, including mud, sand, pebbles, small rock and hard bottom, with highest concentrations observed over sand and shell hash in the fall, and coarse sand in the spring (Kulka et al. 2008). Prey of spotted wolffish are primarily benthic (>75%) and typically include echinoderms, crustaceans and molluscs associated with both sandy and hard bottom substrates. This species is referred to as an echinoderm benthivore (DFO 2011a). Fish also constitutes part of the spotted wolffish diet (<25%). Tagging studies indicate the spotted wolffish migrations are local and limited. Spotted wolffish reproduction is characterized by internal fertilization. Cohesive masses of eggs are deposited in crevices, remaining unattached to the substrate. After an undetermined incubation time, pelagic larvae hatch and commence feeding on crustaceans, fish larvae and fish eggs within a few days of hatch (Kulka et al. 2008). Analysis of DFO commercial fishery landings data, April to September 2005-2010, indicates that no spotted wolffish were harvested within the Study Area during that six year period. FishBase (http://www.fishbase.org/search.php) indicates that the distribution for this wolffish species has slight overlap with the Study Area, primarily in the shallower regions, but not with the Project Area. A 2001 review of the status of spotted wolffish indicated that this species was near the southern limit of its range in the Maritimes Region. A recent review confirms that conclusion with the composite distribution pattern from all data sources in the Maritimes Region indicating that this wolffish species is restricted primarily to the eastern Scotian Shelf, with some fish found along the shelf edge in NAFO Divisions 4WX. Abundance in each survey examined has always been very low with this species occurring in less than 0.5% of the sets (Simon et al. 2011).
Atlantic Wolffish
Atlantic wolffish are primarily demersal and inhabit shallower areas than the northern and spotted wolffishes. It has been observed from near shore to a depth of 918 m and at water temperatures ranging from -1 to 10°C. Atlantic wolffish most commonly occur at water depths of 150 to 350 m where water temperatures range from 1.5 to 4°C. During 1980-1984, this species was most concentrated in the same areas as the northern wolffish, with additional concentrations on the southern Grand Banks and the Gulf of St. Lawrence. More recently, the area this species occupied and its relative density within this area was

Shelburne Basin 3-D Seismic Survey LGL Limited Environmental Assessment Page 55
considerably reduced in the northern part of its confirmed range, but has remained relatively constant in the Gulf of St. Lawrence. During feeding, Atlantic wolffish appear to prefer complex reliefs of rocks without algal growth and sand. Shelters in these rock reliefs are typically situated on 15-30° slopes with good water circulation. There is some indication that Atlantic wolffish form colonial settlements during the feeding period (Kulka et al. 2008). Prey of Atlantic wolffish are primarily benthic (>85%) and typically include molluscs, echinoderms and crustaceans associated with both sandy and hard bottom substrates. This species is referred to as a mollusc benthivore (DFO 2011a). Fish also constitutes part of the Atlantic wolffish diet (<15%; e.g., redfish). Migration by Atlantic wolffish is limited, with seasonal inshore movement in the spring when mature fish are found in areas where water depths are <15 m. The Atlantic wolffish seems to prefer stony bottom substrate for spawning in September and October. After internal fertilization, cohesive masses of eggs are deposited in crevices on the bottom and remain unattached to the substrate. The egg mass is guarded and maintained by the male Atlantic wolffish for the seven to nine month incubation period, after which pelagic larvae hatch and almost immediately commence to feed on crustaceans, fish larvae and fish eggs (Kulka et al. 2008). Unlike northern and spotted wolffishes, analysis of DFO commercial fishery landings data, April to September 2005-2010, indicates that Atlantic wolffish were harvested within the Study Area during that six year period, primarily in its shallower region outside of the Project Area (see Figure 6.14 in Section 6.3.1). Simon et al. (2011) suggest that although Atlantic wolffish are found throughout the Maritimes Region, there are two primary areas of concentration on the Scotian Shelf. On the eastern Scotian Shelf (NAFO Division 4VW), the abundance of mature individuals has declined by 99% since 1970, while the abundance of immature individuals has increased over the same period. On the western Scotian Shelf (NAFO Division 4X), both immature and mature abundance has declined since 1970. Although these two concentrations exhibit differing trends in abundance, there is no evidence to suggest that they are separate designatable units. On the northeast peak of Georges Bank, there is a small aggregation of Atlantic wolffish that appears to be spatially discrete from the remainder of the surveyed area (NAFO Division 5Z) and that has declined dramatically since 1986. Although there are no directed fisheries for wolffish in the Maritimes Region, the species is caught as bycatch in other fisheries. An examination of wolffish landings in NAFO Division 4X revealed that Atlantic wolffish were concentrated on the western peak of Browns Bank, west of German Bank, and in three isolated areas inshore of the 50 fathom (100 m) line. These inshore areas are not currently surveyed by the DFO Research Vessel (RV) surveys although they are potentially areas of critical habitat. These areas and other areas of potential critical habitat for Atlantic wolffish are not located in either the Project or Study Area (Simon et al. (2011). Effects Assessment Exposure to anthropogenic sounds can cause physical, physiological and behavioural effects on fishes. Studies that conclude that there are physical and physiological effects typically involve captive subjects that are unable to move away from the sound source and are therefore exposed to higher sound levels than under natural conditions. While some fishes lack a swim bladder and are therefore not sensitive to the sound pressure component of sound, only the particle motion component, other fishes do have a swim bladder and are sensitive, at varying degrees, to the sound pressure component as well as the particle motion component of sound. The hearing thresholds of the northern wolffish, spotted wolffish

Shelburne Basin 3-D Seismic Survey LGL Limited Environmental Assessment Page 56
and Atlantic wolffish are unknown although one can speculate that these fishes, like most fishes studied, are most sensitive at low frequencies (i.e., <1,500 Hz) (Appendix F). A comprehensive literature review related to auditory capabilities of fishes and the potential effects of exposure to seismic airgun noise on fishes is contained in Appendix F. Airgun Array Noise Wolffishes lack a swim bladder and are therefore not sensitive to the sound pressure component of sound, only the particle motion component. Since all three wolffish species typically occur at relatively great depth (i.e., at least 150 m), it is unlikely that the particle motion component of the noise being produced by the seismic airguns will have much effect on them. Any physical/physiological effects of exposure to seismic noise can be confidently dismissed as explained above and in Appendix F). There is always potential for behavioural effects but, as already stated, any effects are expected to be negligible. Based on wolffishes being sensitive to only the particle motion component of sound, airgun array noise is judged to have negligible effects on wolffish, over a short-term duration of <1 month and a geographic extent of <1 km2. Therefore, residual effects related to exposure to seismic sound, are judged to be not significant for wolffish. The level of confidence associated with this judgement is high. 6.1.1.8 White Shark Biological Background Summary Worldwide, the white shark is rare but does occur with some predictability in certain areas. The white shark is widely distributed in sub-polar to tropical seas of both hemispheres, but it is most frequently observed and captured in inshore waters over the continental shelves of the western N Atlantic, Mediterranean Sea, southern Africa, southern Australia, New Zealand, and the eastern N Pacific. The species is not found in cold polar waters (SARA website accessed October 2012). The status of the Atlantic population of the white shark for both Schedule 1 of SARA and COSEWIC is endangered (Table 6.1). Off Atlantic Canada, the white shark has been recorded from the NE Newfoundland Shelf, the Strait of Belle Isle, the St. Pierre Bank, Sable Island Bank, the Forchu Misaine Bank, in St. Margaret’s Bay, off Cape La Have, in Passamaquoddy Bay, in the Bay of Fundy, in the Northumberland Strait, and in the Laurentian Channel as far inland as the Portneuf River Estuary. The species is highly mobile, and individuals in Atlantic Canada are likely seasonal migrants belonging to a widespread NW Atlantic population. It occurs in both inshore and offshore waters, ranging in depth from just below the surface to just above the bottom, down to a depth of at least 1,280 m (SARA website accessed October 2012). The COSEWIC assessment and status report on the white shark (COSEWIC 2006b) indicates that sightings of this shark in Atlantic Canadian waters are rare. There are only 32 official sightings of the white shark in Atlantic Canadian waters since 1874. Therefore, the likelihood of white shark occurrence in the Study Area, especially coincident with Project activity, is low. The female produces eggs which remain in her body until hatching. When the young emerge, they are born live. Gestation period is unknown, but may be about 14 months. Litter size varies, with an average of 7 pups. Length at birth is assumed to be between 109 and 165 cm. Possible white shark pupping areas on the west and east coasts of North America include off southern California and the Mid-Atlantic Bight, respectively (SARA website accessed October 2012).

Shelburne Basin 3-D Seismic Survey LGL Limited Environmental Assessment Page 57
White sharks are an apex predator with a wide prey base feeding primarily on many types of fish, and marine mammals, as well as squid, molluscs, crustaceans, marine birds, and reptiles (SARA website accessed October 2012). Effects Assessment The hearing threshold of the white shark is unknown although thresholds have been determined for other shark species, including the nurse shark (Ginglymostoma cirratum), bamboo sharks (Chiloscyllium sp.), the Atlantic sharpnose shark (Rhizoprionodon terranovae), the horn shark (Heterodontus francisci), and the bull shark (Carcharhinus leucas) (see Appendix F). These previous studies identify that sharks are most sensitive at low frequencies (i.e., <1,500 Hz) (see Appendix F). Airgun Array Noise As is the case with the wolfish species, the white shark lacks a swim bladder and is therefore sensitive to only the particle motion component of underwater sound, not to the sound pressure component. Unlike the wolffishes, the white shark often occurs in the upper water column, likely making it more capable of detecting the particle motion component of the seismic noise. The physical/physiological effects of exposure to seismic noise can be confidently dismissed as explained above for the wolffishes (Appendix F), and any behavioural effects are still expected to be negligible despite the white shark’s higher likelihood of detecting the particle motion associated with seismic noise. The white shark might move away from a seismic source but without any detrimental consequences. Based on these considerations, airgun array noise is judged to have negligible effects on the white shark, over a short-term duration of <1 month and a geographic extent of <1 km2. Therefore, residual effects related to exposure to seismic sound, are judged to be not significant for the white shark. The level of confidence associated with this judgement is high. 6.1.1.9 Roseate Tern Biological Background Summary The Roseate Tern (Sterna dougallii) is a migratory bird protected under the Migratory Birds Convention Act, 1994 and is under the management jurisdiction of the federal government (Environment Canada). It was designated as endangered under the Species at Risk Act (SARA) in June 2003 and is listed on Schedule 1. The Canadian Wildlife Service, Atlantic Region, Environment Canada has led the development of a Recovery Strategy for the Roseate Tern (Environment Canada 2010). The Roseate Tern breeds worldwide on marine islands. In North America, a northeastern population breeds from the Gulf of St. Lawrence (Magdalen Islands) to New York; a disjunct Caribbean population breeds from Florida and the Bahamas to the Lesser Antilles (Environment Canada 2010). In Canada it has nested in Quebec (Gulf of St. Lawrence), Nova Scotia and New Brunswick. Since 1982 it has been known to nest at 28 sites in Canada with a maximum of 12 sites occupied during any one year (Environment Canada 2010). Between 2000 and 2010 only three colonies, all in Nova Scotia, were known to have more than 20 nesting pairs: The Brothers (33-86 pairs), Grassy Island (0-30 pairs) and Country Island (0-53 pairs). The number of pairs nesting in Canada represents 3-4% of the northwestern Atlantic population and less than 1% of the world population (Gochfeld et al. 1998).

Shelburne Basin 3-D Seismic Survey LGL Limited Environmental Assessment Page 58
The Roseate Tern requires small coastal islands with low vegetation for nesting. In Canada it has always been found nesting in colonies of the more abundant Common Tern (Sterna hirundo) (Gochfield et al.1998). During the breeding season (May to August in Canada) the Roseate Tern generally forages for small fish in shallow marine waters close to shore, often near tidal rips and shoals (Gochfield et al.1998). After the breeding season Roseate Terns typically collect at staging areas. These locations are unknown in Canada but two birds banded as chicks in Nova Scotia were observed a month later in Great Gull Island, New York. Recoveries of banded Roseate Terns at sea during late August and early September and the lack of recoveries along the U.S. Atlantic coast suggest that the northeastern breeding population travels south to cross the western part of the Atlantic Ocean and the eastern Caribbean Sea during fall migration (Nisbet 1984). However, band recoveries do not reveal the route or timing of spring migration. The Roseate Tern is probably an occasional transient in the offshore regions of North America. Roseate Terns are generally expected to occur over shallow coastal waters during the breeding season. However, small numbers used to nest on Sable Island, NS, which would have required migrating over offshore waters in order to reach Sable Island. There are no known sightings of Roseate Terns in the Project Area or Study Area, though these areas have not been extensively surveyed. As a result, the Roseate Tern may occur in the Study area though likely in small numbers as a transient during the migration periods of May and August-September. Effects Assessment The effects of airgun sound on diving birds was not assessed because previous EAs of offshore seismic exploration in Atlantic Canada have shown that Environment Canada (Canadian Wildlife Service [CWS]) considers light attraction to be the major effect of seismic exploration on seabirds (reflected in the Scoping Document, Appendix B). The CWS position is consistent with the current opinion among scientists that hearing in seabirds is less vulnerable to damage from underwater sound than in marine mammals. This opinion is based on: 1) lack of contact between seawater and the auditory meatus (Dooling and Therrien 2012); 2) shallower, shorter duration dives; and 3) a field study that found no behavioural effect of a seismic survey on Long-tailed Ducks (Lacroix et al. 2003). The potential effect of the key interaction between lights associated with Project vessels and the Roseate Tern is assessed in the following section. Light Attraction The attraction of migratory birds to light from vessels and the potential effects are reviewed in Section 6.1.2.2. Birds (primarily petrels) that are attracted to lights of Project vessels may become stranded on a vessel due to their inability to take off from the deck. Stranding may result in bird mortality, usually due to dehydration, starvation, exhaustion, or hypothermia or drowning in fluid-filled cavities on deck. This risk is reduced for Roseate Terns given that they are only expected to occur in small numbers in the Project Area and that they are able to readily take off from the deck of a vessel. In addition, MMOs on the seismic vessels and crew on picket vessels will conduct daily searches for stranded birds. If a stranded bird is found, SARA-listed or otherwise, the Canadian Wildlife Service (CWS) protocols for stranded seabirds (Chardine and Williams n.d.) will be followed. A CWS-issued permit for handling of migratory birds will be in place. Shell will notify the CNSOPB once this permit has been obtained.

Shelburne Basin 3-D Seismic Survey LGL Limited Environmental Assessment Page 59
Based on these considerations, light attraction effects on the Roseate Tern are judged to have negligible to minor effects over a short-term duration of 1-12 months and a geographic extent of 11-100 km2. Therefore, residual effects related to light attraction on Roseate Terns are judged to be not significant. The level of confidence associated with this judgement is high. 6.1.1.10 Red Knot Biological Background Summary The Red Knot is a medium-sized sandpiper, the rufa subspecies of which was designated as endangered on Schedule 1 of the Species at Risk Act in July 2012. This subspecies nests on the islands of the southern Arctic archipelago of Canada and the adjacent mainland (COSEWIC 2007). It winters primarily in Patagonia and Tierra del Fuego in South America. It is uncommon to rare in spring in Nova Scotia, passing through from mid-April to early June (McLaren 2012), most birds passing considerably west of Nova Scotia (COSEWIC 2007). However, during southward migration it is common in coastal areas with extensive intertidal sand-flats along the Gulf of St. Lawrence and the Maritime Provinces (COSEWIC 2007). In these areas it feeds on benthic invertebrates including bivalves. In Nova Scotia it first appears in July, peaking in August and again in September-October (McLaren 2012). Important areas for this subspecies in Nova Scotia are southern Cape Breton Island and Cape Sable (COSEWIC 2007). In August, this subspecies departs eastern Canada and the U.S. southeastwards on a trans-oceanic flight to South America (Harrington 2001), which likely takes some individuals over the Scotian Shelf and potentially over the Study Area. Effects Assessment The potential effects of the key interaction between lights associated with Project vessels and the Red Knot are assessed in the following section. Light Attraction The attraction of migratory birds to light from vessels and the potential effects are reviewed in Section 6.1.2.2. Birds (primarily petrels) that are attracted to lights of Project vessels may fly into and strand in partially enclosed spaces on a vessel due to their inability to find their way out of these spaces. Stranding may result in bird mortality, usually due to dehydration, starvation, exhaustion, or hypothermia or drowning in fluid-filled cavities on deck. This risk is much reduced for Red Knots given that they are only expected to occur in small numbers in the Project Area and that they are able to readily take off from the deck of a vessel. In addition, MMOs on the seismic vessels and crew on picket vessels will conduct daily searches for stranded birds. If a stranded bird is found, SARA-listed or otherwise, the Canadian Wildlife Service (CWS) protocols for stranded seabirds (Chardine and Williams n.d.) will be followed. A CWS-issued permit for handling of migratory birds will be in place. Shell will notify the CNSOPB once this permit has been obtained. Based on these considerations, light attraction effects on Red Knots are judged to have negligible to minor effects over a short-term duration of 1-12 months and a geographic extent of 11-100 km2. Therefore, residual effects related to light attraction on Red Knots are judged to be not significant. The level of confidence associated with this judgement is high.

Shelburne Basin 3-D Seismic Survey LGL Limited Environmental Assessment Page 60
6.1.2 Migratory Birds 6.1.2.1 Temporal and Spatial Distributions The following section details the various species protected by the Migratory Birds Convention Act (i.e., species included in bird families named in Article I of the Convention itself) that have a reasonable likelihood of occurrence in the Study Area of the Project based on their spatial and temporal distribution relative to the SW Scotian Shelf. Table 6.2 details the individual species identified to have a reasonable likelihood of occurrence in the Study Area. Procellariidae (fulmars and shearwaters) Northern Fulmars (Fulmarus glacialis) migrate over the Scotian Shelf, many of which remain for the winter or summer (Lock et al. 1994). The majority of birds are of the light-phase colour morph, which nests in Greenland and Europe. Fall migration begins in September and fulmars remain common until the end of spring migration in May. Recoveries of banded birds confirm that birds wintering in Atlantic Canada waters come from nesting colonies in west Greenland and the British Isles (Tuck 1971). Shearwaters of three species migrate over the Scotian Shelf during the summer months. Great Shearwater (Puffinus gravis) and Sooty Shearwater (P. griseus) migrate in large numbers from South Atlantic nesting islands to circumnavigate the North Atlantic in a clockwise direction. They first appear on the Scotian Shelf in April and are most abundant in early July (Lock et al. 1994). Most have departed northeastward by late summer, although large numbers have been seen in nearby Gulf of Maine and Georges Bank as late as December, suggesting that they may also be present on the Scotian Shelf at that time (reviewed in Huettmann and Diamond 2000). Immature Cory’s Shearwaters (Calonectris [diomedea] borealis) migrate to the Scotian Shelf from East Atlantic nesting colonies (Lock et al. 1994). LGL (2009) seabird surveys at the Laurentian Channel showed that this species arrives in early July and departs by October. Hydrobatidae (storm-petrels) The Wilson’s Storm-Petrel (Oceanites oceanicus) also migrates from South Atlantic breeding colonies and reaches the northern end of this migration at the edges of the Grand Banks (Lock et al. 1994). This species arrives on the Scotian Shelf in May and departs in October (LGL Limited 2009). Leach’s Storm-Petrels (Oceanodroma leucorhoa) migrating along the Scotian Shelf to and from nesting colonies on Sable Island, the Bird Islands and Newfoundland probably show their greatest densities along the shelf break. Charadriidae and Scolopacidae (shorebirds) During fall, large numbers of shorebirds depart Nova Scotia southeastward on a broad front to begin an offshore migration. Radar studies show that the direction of this migration varies from 110° to 170°, with an average of approximately 134° (Richardson 1979). Most of these flights begin with the arrival of northwest or west winds that follow the passage of a cold front lying north or northeast of a high pressure area. This heading takes the migrating shorebirds to the Sargasso Sea, where the northeast Trade Winds direct them to South America (Williams and Williams 1978). Most of these flights originate northwest of the Study Area, such as at the Bay of Fundy, a critical shorebird stopover site (Richardson 1979). The average altitude of this migration is 2,000 m but 75% of flocks fly above 1,000 m. Minimum

Shelburne Basin 3-D Seismic Survey LGL Limited Environmental Assessment Page 61
altitudes have not been reported. Altitudes are similar whether during night or day, and whether over land or ocean. Migration occurs intermittently during both day and night. The species tracked in these studies cannot be identified by radar, but may include American Golden-Plover (Pluvialis dominica), Hudsonian Godwit (Limosa haemastica), and White-rumped Sandpiper (C. fuscicollis) (Williams and Williams 1978). There is no reciprocal northward migration in spring over waters off the south coast of Nova Scotia (Richardson 1971). Consequently, shorebirds are unlikely to occur in the Study Area during spring migration. Laridae (gulls and terns) Offshore migration of gulls on the Scotian Shelf is poorly known (Huettmann and Diamond 2000). This knowledge is confounded by the presence of non-migratory Herring Gulls (Larus argentatus) and Great Black-backed Gulls (L. marinus). However, Black-legged Kittiwake (Rissa tridactyla) appears to migrate primarily along the shelf edge (Baird 1994). Fall migration begins in September and gulls remain common until the end of spring migration in April. Arctic Terns (Sterna paradisaea) migrate over the Scotian Shelf in May and September (LGL 2009). Alcidae (murres, and puffins) Dovekie (Alle alle) migrate from Arctic nesting colonies, arriving on the Scotian Shelf in late October and departing in April (Tufts 1986). It is most abundant on the shelf break and the shallow banks (Lock et al. 1994). Common Murre (Uria aalge) migrates to and from nesting grounds in Newfoundland and Labrador across the Scotian Shelf, many stopping to winter, from October to April (Lock et al. 1994; LGL Limited 2009). Razorbill (Alca torda) migrate over the Scotian Shelf to and from Quebec and Labrador nesting colonies (Clarke et al. 2010). Timing and routes of migration for this species are not well known, but there appears to be a rapid migration to the Gulf of Maine during mid- to late-November and return migration during mid-April to May (Lavers et al. 2009). The Atlantic Puffin (Fratercula arctica) is an uncommon migrant to the Scotian Shelf; migration takes place in April and from September to December (Tufts 1986). Passeriformes (songbirds) A substantial portion of songbirds tracked on radar migrating over Nova Scotia in the fall fly offshore over the open Atlantic Ocean. Songbirds departing for offshore migration fly south-southeast, south or occasionally southwest (Richardson 1972). The modal direction on a given night ranges from 155° to 175° (Richardson 1980). Most of these flights originate well away from the coast. The modal height is 600 m and most individuals migrate below 1,200 m. Songbirds using this route migrate only at night (Richardson 1972). Most offshore departures of songbirds take place with west, northwest or north winds behind a cold front. Although the birds cannot be identified to species by radar, a majority of these songbirds are thought to be warblers (Parulidae) such as Blackpoll Warbler (Setophaga striata), whose transoceanic migration to South America is well documented. During spring, songbirds arriving in Nova Scotia after overwater flights are first detected over the Gulf of Maine, suggesting that they follow the coastline rather than crossing the western Atlantic from South America (Richardson 1971). Therefore, songbirds are unlikely to pass through the Study Area during spring migration.

Shelburne Basin 3-D Seismic Survey LGL Limited Environmental Assessment Page 62
6.1.2.2 Effects Assessment The effects of airgun sound on migratory birds was not assessed because previous EAs of offshore seismic exploration in Atlantic Canada have shown that the CWS considers light attraction to be the major effect of seismic exploration on migratory birds (reflected in the Scoping Document, Appendix B). The CWS position is consistent with the current opinion among scientists that hearing in seabirds is less vulnerable to damage from underwater sound than in marine mammals. This opinion is based on: 1) lack of contact between seawater and the auditory meatus (Dooling and Therrien 2012); 2) shallower, shorter duration dives; and 3) a field study that found no behavioural effect of a seismic survey on Long-tailed Ducks (Lacroix et al. 2003). In addition, many of the migratory birds profiled above either feed on the surface or in the case of songbirds fly over offshore waters with no contact with the sea surface. The only notable potential interaction between routine Project activities and migratory birds is attraction of birds to lights on Project vessels which is assessed in the following section. Light Attraction Artificial lighting on ships at sea, offshore oil/gas drilling or production structures, coastal communities and oceanic island communities regularly attracts nocturnally-active seabirds and nocturnally-migrating land- and water-birds, sometimes in large numbers (Montevecchi et al. 1999; Gauthreaux and Belser 2006; Montevecchi 2006). The reasons that such species are attracted to artificial lighting have not been elucidated. Light-attracted seabirds such as storm-petrels often fly into partially enclosed spaces, such as streamer and airgun decks that are open at the stern, and cannot find their way out. This may result in bird mortality, usually due to dehydration, starvation, exhaustion, or hypothermia or falling into and drowning in water-filled cavities on deck. Birds may be attracted to artificial lighting from a distance of up to 5 km in the case of offshore oil/gas installations with 30 kW of lighting (Poot et al. 2008). Light attraction among seabirds also seems to peak when moonlight levels are lowest, especially with fog, rain or low cloud ceiling (Montevecchi 2006; Rodríguez and Rodríguez 2009; Miles et al. 2010). The attraction of seabirds to artificial lighting occurs at all times of the year, but tends to be more common at the end of the nesting season (i.e., late summer-fall) at which time juveniles account for the majority of stranded birds (Telfer et al. 1987; Le Corre et al. 2002; Rodríguez and Rodríguez 2009; Miles et al. 2010; LGL Limited unpubl. data). Attraction to artificial lighting and attendant grounding appears to be widespread among procellariiform seabird species (e.g., petrels, shearwaters and storm-petrels), having been observed worldwide in more than 20 species (e.g., Imber 1975; Black 2005; Montevecchi 2006). Light attraction has also been noted in Atlantic Puffin near a nesting colony (Miles et al. 2010). There is also a single anecdotal report of Dovekies circling the Hibernia platform for hours (Wiese et al. 2001). Light attraction has been reported for sandpipers (Scolopacidae) but does not appear to lead to mortality (Russell 2005). Although diurnal collisions of terns with wind turbines have been reported (e.g., Common Tern Sterna hirundo, Everaert and Stienen 2007), nocturnal attraction to artificial lighting has not been described for this group (Gochfeld et al. 1998; Hatch 2002; Montevecchi 2006). During migration small songbirds (Passeriformes) are commonly attracted to artificial lighting on offshore ships and oil installations under the same conditions of moonlight and weather as seabirds, and may suffer mortality as a result (Gauthreaux and Belser 2006; Poot et al. 2008).

Shelburne Basin 3-D Seismic Survey LGL Limited Environmental Assessment Page 63
In Nova Scotia waters, the species most prone to stranding on vessels are Leach’s Storm-Petrel and Wilson’s Storm-Petrel. For example, 764 of 768 seabirds stranded on seismic vessels in Newfoundland waters (including the mouth of the Laurentian Channel) over 753 nights of monitoring have been storm-petrels (LGL Limited unpubl. data). The remaining were several individuals of Great Shearwater and Sooty Shearwater. Bird attraction to artificial lighting at sea may be mitigated in a variety of ways. Recovering grounded seabirds and returning them to sea when their plumage has dried greatly reduces mortality (Telfer et al. 1987; Le Corre et al. 2002; Rodríguez and Rodríguez 2009; Williams and Chardine n.d.; Abgrall et al. 2008). For example, in offshore Newfoundland the mitigation of releasing birds by experienced environmental observers, according to CWS protocols established by CWS and offshore operators (Williams and Chardine n.d.), appears to typically reduce mortality to a few birds per seismic vessel per season. Reducing, shielding or eliminating skyward radiation from artificial lighting also can achieve great reductions in the numbers of birds stranded (Reed et al. 1985; Rodríguez and Rodríguez 2009; Miles et al. 2010). It is likely that some storm petrels will be attracted to vessel lights especially during times of low visibility. Some of these may become stranded, and some may collide with the vessel superstructure or become fouled on deck. A few may suffer mortality but the majority should be able to be released alive following the CWS protocols for stranded seabirds (Chardine and Williams n.d.). Effects on the population size are expected to be negligible given that storm petrels are likely the most numerous seabird in the northwest Atlantic (Montevecchi et al. 1992). The SEA for the Southwest Scotian Shelf has also concluded no significant effects on seabirds from offshore oil and gas activities. Based on these considerations, light attraction effects on migratory birds are judged to have negligible to minor effects (i.e., strandings represent a very small percentage of the overall population and most birds are likely to be released alive) over a short-term duration of 1-12 months and a geographic extent of 11-100 km2. Therefore, residual effects related to light attraction on migratory birds are judged to be not significant. The level of confidence associated with this judgement is high given the relatively large volume of observational data on bird strandings on seismic vessels off the east coast of Canada.
6.2 Special Areas A number of Special Areas that occur in the vicinity of the Study Area have been considered during the preparation of this EA (Figure 6.3). These Special Areas include:
Haddock Box (i.e., Haddock Nursery Closure Area); Ecologically and Biologically Significant Areas (EBSA);
o Scotian Slope/Shelf Break EBSA; o Northeast Channel EBSA; and o Canadian Portion of Georges Bank EBSA
Haddock Spawning Closure Area; LFA 40 Lobster Closure Area; Georges Bank Moratorium Area;

Shelburne Basin 3-D Seismic Survey LGL Limited Environmental Assessment Page 64
Roseway Basin Right Whale Critical Habitat; Northeast Channel Coral Conservation Area; Hell Hole; and Redfish Nursery Closure Area.
Figure 6.3 Locations of Special Areas in and Near the Project Area. The Project Area and the 2013 Seismic Activity Area overlap only one of these Special Areas, the Scotian Slope/Shelf Break EBSA (Figure 6.3). The Study Area slightly overlaps with five other Special Areas, including the Haddock Spawning Closure Area, the LFA 40 Lobster Closure Area, the Georges Bank Moratorium Area, the Northeast Channel EBSA and the Canadian Portion of the Georges Bank EBSA (Figure 6.3). Since the latter two EBSAs are overlapped entirely by other Special Areas, (Northeast Channel Coral Conservation Area and Georges Banks Moratorium Area, respectively), they are considered to be redundant and will not be discussed further. Although the Roseway Basin Right Whale Critical Habitat area and the Haddock Box do not actually overlap the Study Area, the Scoping Document for this Project (Appendix B) specified that assessment of potential effects of Project activities on both areas was required. Therefore, the interactions of six Special Areas with Project activities will be assessed.

Shelburne Basin 3-D Seismic Survey LGL Limited Environmental Assessment Page 65
The remaining three Special Areas (i.e., Northeast Channel Coral Conservation Area, Hell Hole and Redfish Nursery Closure Area) which are proximate to the Study Area but do not overlap it, are briefly profiled below. Effects assessments were not completed for these three Special Areas as interactions from Project activities are not anticipated based on these areas occurring outside the Study Area. 6.2.1 Special Areas Proximate to Study Area 6.2.1.1 Northeast Channel Coral Conservation Area The Northeast Channel Coral Conservation Area was established in 2002 and covers an area of 424 km2 (Figure 6.3). It is located entirely within the Georges Bank Moratorium Area discussed below in Section 6.2.2.6, about 5 km west of the Study Area and 40 km west of the Project Area. This area is characterized by a high density of large branching gorgonian corals (e.g., Paragorgia arborea, Primnoa resedaeformis). Evidence of damage due to fishing activity helped to motivate the closure. About 90% of the Northeast Channel Coral Conservation Area (i.e., restricted bottom fisheries zone) is closed to all bottom fishing gear types used in groundfish and invertebrate fisheries (e.g., longline, otter trawl, gillnet, trap). The remaining 10% of the area (i.e., limited bottom fisheries zone) is open to limited authorized fishing. The Project will not come into physical contact with the sea bottom or any fauna occurring on the sea bottom. 6.2.1.2 Hell Hole The Hell Hole occurs in the Northeast Channel between Georges Bank and Browns Bank (Figure 6.3), about 5 km west of the Study Area and 40 km west of the Project Area. It is located entirely within the Georges Bank Moratorium Area discussed below in Section 6.2.2.6. This area is well known for the significant aggregations of bluefin tuna that occur during summer and early fall. The Hell Hole is a management area used to minimize interaction between the bluefin tuna tended line and rod and reel fleets and the pelagic longline fleets. Since 2004, the Hell Hole is closed annually to pelagic longline gear from 1 July to 30 November (K. Curran, DFO, pers. comm.). 6.2.1.3 Redfish Nursery Closure Area The Redfish Nursery Closure Area is located on Browns Bank (Figure 6.3), about 35 km northwest of the Study Area and 65 km northwest of the Project Area. It is closed each year between 1 January to 30 June to small mesh (<130 mm) fishing gear in order to protect juvenile redfish. 6.2.2 Special Areas that “Overlap” the Study Area 6.2.2.1 Roseway Basin Right Whale Critical Habitat Background Summary Roseway Basin is designated Critical Habitat for right whale pursuant to the Species at Risk Act (Brown et al. 2009). In summer and autumn, North Atlantic right whales feed and socialize in the Roseway Basin between Browns and Baccaro banks on the western Scotian Shelf about 50 km south of Nova Scotia (Stone et al. 1988; Kraus and Brown 1992; Brown et al. 1995). The Roseway Basin critical

Shelburne Basin 3-D Seismic Survey LGL Limited Environmental Assessment Page 66
habitat is at its closest point ~80 km, 41 km, and 15 km from the 2013 Seismic Activity, Project, and Study areas, respectively (Figure 6.3). The Roseway Basin critical habitat has a deep basin (approximately 150 m deep) flanked by relatively shallow water, which through convergences and upwellings driven by tidal and other currents produces dense concentrations of copepods (COSEWIC 2003a). There is, however, a substantial annual variability in copepod production, and thus right whale abundance (Brown et al. 2001; Kenney 2001; Patrician and Kenney 2010). Surveys in the 1980s and early 1990s of Roseway Basin often yielded more observations of North Atlantic right whales in a given year (17-118 confirmed photo-identified right whales per year) than the Bay of Fundy (Grand Manan Basin); however, from 1993 through 1999 right whales were absent or extremely rare on Roseway Basin (see Table I in Patrician and Kenney 2010). This seven-year period corresponds to the years with near-absence of their primary prey (C. finmarchicus) and greatest right whale use of the Bay of Fundy. Right whale use of the Roseway Basin increased again after 1999. Similar shifts in habitat use and abundance of right whales have also been observed in the Great South Channel off Cape Cod (Kenney et al. 2001). Autonomous recording devices have recorded right whale vocalizations at both Roseway Basin and Emerald Bank from the beginning of July until the end of December, peaking from August through October (Mellinger et al. 2007). Effects Assessment Based on identified sensitivities associated with the Roseway Basin and right whales, the original Project Area identified in the Project Description submitted on 29 June 2012 was modified to minimize the proximity to this Sensitive Area (i.e., the northwest corner of the Project Area was reduced to follow the 500 m bathymetric contour). This modification moved the Project Area approximately 35 km away from the Roseway Basin (originally within 6 km of the Project Area and now 41 km at its closest point) to reduce the potential effects from sound and vessel presence on this location. The following assessment focuses on right whales that occur in the Roseway Basin critical habitat and it considers the newly established Project Area. The effects of the Project on right whales that may occur in the Study Area are assessed in Section 6.1.1.1. Airgun Array Noise As overviewed previously in Section 4.2.1, the key types of airgun array noise effects on marine mammals considered in detail in this assessment are hearing impairment and behavioural effects (i.e., disturbance). Hearing Impairment: Based on precautionary acoustic modelling results, it is estimated that right whales (and other baleen whales) would have to occur about <30 m from the airgun array to be exposed to sound levels from a single airgun pulse exceeding the 198 dB SEL criterion for PTS (see Section 4.2 in Appendix A). Given the distance of the Roseway Basin critical habitat from the Project Area (minimum of 41 km), hearing impairment effects on right whales in this area are not a concern. The area where seismic data will be acquired in 2013 is much farther away (over 80 km) from this critical habitat—even further minimizing the likelihood of hearing impairment during seismic activities.
Shelburne Basin 3-D Seismic Survey LGL Limited Environmental Assessment Page 67
Based on these considerations, airgun array noise is judged to have negligible hearing impairment effects on right whales in the Roseway Basin critical habitat. Therefore, residual hearing impairment effects on right whales are judged to be not significant. The level of confidence associated with this judgement is high. Disturbance Effects: Based on the review provided in Appendix D and the results of acoustic modelling (Section 4.2 of Appendix A), it is unlikely that right whales in the Roseway Basin critical habitat will exhibit disturbance or avoidance effects. Using the 160 dB rms sound level as a guide for avoidance response and based on the precautionary acoustic modelling results for Site 01, i.e., the closest point of the Project Area to the right whale critical habitat, the area where avoidance would most likely occur would have a maximum radius of 5.2–11.6 km from the airgun array (see Table 6 in Appendix A). These sound levels are not predicted to occur within the Roseway Basin critical habitat, given the distances of the Project Area and 2013 Seismic Activity Area. Additionally, sound levels from the 5,085 in3 airgun array in the Roseway Basin critical habitat vary seasonally (sound propagation decreases later in the seasonal window [i.e. April to September]) as shown in Figures 6.4 and 6.5. Maximum sound levels (primarily 130-150 dB rms) from the airgun array at Site 01 are predicted to occur in April (Figure 6.4) whereas minimum sound levels (120-130 dB rms) from Site 01 are predicted to occur during September. Acoustic modelling indicates that in April airgun noise is trapped in the upper 100 m of the water column (upward refracting) which in turn reduces interaction with the bottom and sound attenuation. Over time (i.e., May to September), the upper water column becomes downward refracting, thereby increasing bottom interactions and sound attenuation. This explains why the higher SPLs of the airgun noise travel farthest in the early spring, with distances decreasing throughout the summer and into September. As an extra precaution, Shell will delay seismic acquisition within the extension of the 2013 Seismic Activity Area into EL 2429 until later in the seasonal window (July to September) when sound propagation into the Roseway Basin is reduced. If seismic data are acquired in later years outside of the 2013 Seismic Activity Area outlined in the original EA (LGL 2012) and in proximity to the Roseway Basin critical habitat, Shell will consider implementation of additional mitigation measures to address specific sensitivities associated with this area. These additional measures may include utilizing an array with a smaller source level and/or limiting acquisition to later in the seasonal window (i.e., July to September) when sound propagation into shallower shelf waters is reduced. These additional measures will further minimize the potential for disturbance effects on right whales. Caution is warranted regarding the Roseway Basin given that a large proportion of the endangered North Atlantic right whale population can occur in the Roseway Basin critical habitat during summer and early fall and the lack of specific data on right whale response to airgun array noise. Additionally, displacement of right whales from this critical feeding and socializing area could have detrimental effects on the population. This effect is not anticipated (based on information for other baleen whale species response to airgun noise) given the distance of the Project Area from the Roseway Basin and the additional mitigation measures that would be implemented if seismic surveys occurred in 2014 or later and in closer proximity to the Roseway Basin critical habitat.

Shelburne Basin 3-D Seismic Survey LGL Limited Environmental Assessment Page 68
Figure 6.4 Predicted SPLs (rms) from the 5,085 in3 Airgun Array at the Closest Point of the Project
Area to the Right Whale Critical Habitat (modelling Site 01 in Appendix A) During April. SPLs are Maximum-over-depth Sound Levels (i.e., maximum estimates).
Figure 6.5 Predicted SPLs (rms) from the 5,085 in3 Airgun Array at the Closest Point of the Project Area to the Right Whale Critical Habitat (modelling Site 01 in Appendix A) During September. SPLs are Maximum-over-depth Sound Levels (i.e., maximum estimates).

Shelburne Basin 3-D Seismic Survey LGL Limited Environmental Assessment Page 69
Based on modelling of the 5,085 in3 array at sites in the northeast (Site 02) and southwest (Site 03) corners of the 2013 Seismic Activity Area, sound levels in the Roseway Basin critical habitat are reduced relative to those from Site 01 (see Section 4.2 of Appendix A). Although the accuracy of the acoustic modelling estimates decreases at these large distances from the array, precautionary acoustic modelling results predict maximum sound levels of ~120-130 dB rms in the Roseway Basin critical habitat based on the airgun array located in the 2013 Seismic Activity Area (see Section 4.2 of Appendix A) . Based on these considerations, it is possible that right whales may exhibit minor behavioural response to airgun pulses at these sound levels. It is possible that a large portion of the endangered North Atlantic right whale population may occur in the Roseway Basin critical habitat during the summer and early fall when seismic surveying will occur. The Roseway Basin is considered an important and unique feeding and socializing area for right whales. Shell will delay seismic acquisition within the extension of the 2013 Seismic Activity Area into EL 2429 until later in the seasonal window (July to September) when sound propagation into the Roseway Basin (approximately 80 km away from the 2013 Seismic Activity Area) is reduced. If seismic data are acquired in future years outside the 2013 Seismic Activity Area outlined in the original EA (LGL 2012) and in proximity to the Roseway Basin critical habitat, Shell will consider implementation of additional mitigation measures to minimize the potential for disturbance effects on this area. Additional mitigation measures may include utilizing an array with a smaller source level and/or limiting acquisition close to this area to later in the seasonal window (i.e., July to September) when sound propagation into shallower shelf waters is reduced. Based on these considerations, airgun array noise is judged to have minor to moderate disturbance effects on the Roseway Basin critical habitat, over a short-term duration of 1-12 months and a geographic extent ranging from 101-1,000 km2. Therefore, residual effects related to disturbance, are judged to be not significant for the Roseway Basin critical habitat. The level of confidence associated with this judgement is low to medium. Presence of Vessels Project vessels will avoid the Roseway Basin critical habitat, thereby negating the risk for collision between right whales in this area and Project vessels. Though there is some risk for collision between right whales and Project vessels, the slow surveying speed (4.5 to 5 kt; 8.3 to 9.3 km/h) of the seismic vessels and their picket vessels minimizes this risk (Laist et al. 2001; NOAA Fisheries 2004; Vanderlaan and Taggart 2007). The 2013 Seismic Activity Area is more than 80 km from the Roseway Basin right whale critical habitat area (see Figure 6.3) and 25 km from the Scotian Shelf. Passive acoustic monitoring (PAM) will also be conducted at nighttime and during periods of poor visibility. Effects of the presence of vessels on right whales in the Roseway Basin critical habitat, i.e., the risk of collisions, are judged to be negligible. Therefore, residual effects related to the presence of vessels on right whales are judged to be not significant. The level of confidence associated with this judgement is high. 6.2.2.2 Haddock Box Background Summary The Haddock Box was established in 1987 with the intention of protecting incoming haddock recruits and assisting the rebuilding of the stock. This 4,000 nm2 conservation area occurs over the western portion of Western Bank, Western Gully and most of Emerald Bank (Figure 6.3) and is closed year-round to groundfish fishing gear (Hurley 2011). The Haddock Box is at its closest point about 40 km, 30 km, and <5 km from the 2013 Seismic Activity, Project, and Study areas, respectively (Figure 6.3). In their assessment of the Haddock Box, Frank et al. (2000) concluded that this closure area was only
Shelburne Basin 3-D Seismic Survey LGL Limited Environmental Assessment Page 70
partially effective as protection for juvenile haddock. Frank et al. (2000) also indicated that the Haddock Box appeared to have some benefit to other groundfish species’ abundances, most notably American plaice (Hippoglossoides americanus) and winter flounder (Pleuronectes americanus). Hurley (2011) noted that the Haddock Box serves as a spawning area for groundfish and is characterized by high benthic species richness and fish diversity, and high numbers of cetaceans and seabirds. Effects Assessment Airgun Array Noise A comprehensive literature review related to auditory capabilities of fishes and the potential effects of exposure to seismic airgun noise on fishes is contained in Appendix F. According to conservative sound modelling carried out for the Project (Appendix A), the highest sound pressure level that would reach the Haddock Box as a result of a single shot from a 5,085 in3 airgun array would be about 150-160 dB re 1 µPa (rms) in April. The maximum SPL reaching the Haddock Box would be lower during the May to September period. Based on the modelling, only a very small portion of the Haddock Box would be exposed to the maximum SPL indicated above. Most of this area would receive SPLs <140 dB re 1 µPa (rms). These received sound levels would only occur during periods when the airgun arrays are active and operating in the northeastern portion of the Project Area. While these sound pressure levels exceed the hearing threshold for haddock (Nedwell et al. 2004) and could possibly elicit some behavioural responses from the fish, it is unlikely that physical or physiological effects would occur given the distance between sound source and the Haddock Box. Based on these considerations, airgun array noise is judged to have negligible to minor disturbance effects on haddock and other fish in the Haddock Box, over a short-term duration of <1 month and a geographic extent ranging from 101–1,000 km2. Therefore, residual effects related to disturbance, are judged to be not significant for the Haddock Box. The level of confidence associated with this judgement is high. 6.2.2.3 Scotian Slope/Shelf Break EBSA Background Summary Over half of the Study Area and Project Area are overlapped by the Scotian Slope/Shelf Break EBSA Almost all of the 2013 Seismic Activity Area overlaps with this EBSA (Figure 6.3). Attributes of the area that justified its selection as an EBSA are presented below (Doherty and Horsman 2007):
Unique geology (iceberg furroughs, pits, complex/irregular bottom); Slopes are areas of high finfish diversity due to habitat heterogeneity provided by depth; High fish diversity, including demersal, mesopelagic and large pelagic fishes; Inhabited by corals, whales, porbeagle shark, tuna, swordfish; Primary migratory route for large pelagic fishes (e.g., sharks, swordfish, tuna); Whale migration route; Migratory route for endangered leatherback turtles, likely because the area supports
concentrations of salps on which leatherback turtles feed;
Shelburne Basin 3-D Seismic Survey LGL Limited Environmental Assessment Page 71
High diversity of squid; Overwintering area for a number of shelf fish species, including Atlantic halibut and lobster; Feeding/overwintering area for seabirds; and Occurrence of Greenland sharks.
Effects Assessment Airgun Array Noise According to underwater sound modelling carried out for the Project (Appendix A), the highest sound pressure level that would occur in the EBSA as a result of a single shot from a 5,085 in3 airgun array would be >190 dB re 1 µPa (rms) in April. Based on the modelling, only a very small portion of the EBSA would be exposed to SPLs >160 dB re 1 µPa (rms) at any one time. Most of this area would receive SPLs <150 dB re 1 µPa (rms). These received sound levels would only occur during periods when the airgun arrays are active and operating in the northern and western portions of the Project Area. Effects from airgun array noise on relevant individual attributes (marine mammals, turtles, seabirds and fish) of the EBSA have already been assessed separately in the EA with consideration given to proposed mitigation measures. Remaining attributes (unique geology, corals) are not anticipated to be adversely affected by Project activities. Based on these considerations, the effects of airgun array noise on the Scotian Slope/Shelf Break EBSA is judged to be minor to moderate over a short-term duration of 1-12 months and a geographic extent ranging from 1,001-10,000 km2. Therefore, residual effects related to exposure to airgun noise associated with the proposed Project on the Scotian Slope/Shelf Break EBSA are judged to be not significant. The level of confidence associated with this judgement is high. Presence of Vessels There is some risk for collision between whales/sea turtles and Project vessels during seismic operations in the Scotia Slope/Shelf Break EBSA, but given the slow surveying speed (4.5 to 5 kt; 8.3 to 9.3 km/h) of the seismic vessels and their picket vessels, this risk is considered minimal (Laist et al. 2001; Vanderlaan and Taggart 2007). As indicated in Section 6.1.1.6, the risk of sea turtle entanglement in seismic gear is also minimal, especially with the implementation of mitigations (e.g., turtle guards).The residual effects of the presence of vessels on this Special Area (i.e., the risk of collisions and entanglements), are therefore judged to be negligible, over a short-term duration of <1 month, in an area 1-10 km2. Therefore, residual effects related to the presence of vessels, are judged to be not significant for the Scotian Slope/Shelf Break EBSA. The level of confidence associated with this judgement is high. Light Attraction As indicated in Sections 6.1.1.9, 6.1.1.10 and 6.1.2, light attraction effects on birds are judged to have negligible effects (i.e., strandings represent a very small percentage of the overall population and most birds are likely to be released alive) over a short-term duration of 1-12 months and a geographic extent of 11-100 km2. Therefore, residual effects related to light attraction on the Scotia Slope/Shelf Break EBSA are judged to be not significant. The level of confidence associated with this judgement is high given the relatively large volume of observational data on bird strandings on seismic vessels off the east coast of Canada.
Shelburne Basin 3-D Seismic Survey LGL Limited Environmental Assessment Page 72
6.2.2.4 Haddock Spawning Closure Area Background Summary The Haddock Spawning Closure Area is located primarily over Brown’s Bank with some overlap over the Northeast Channel and the Canadian portion of Georges Bank (Figure 6.3). While the Study Area overlaps a portion of the southeast edge of this closure area, the closure area is, at its closest point, about 10 km and 45 km from the Project Area and 2013 Seismic Activity Area, respectively. The portion on Browns Bank is closed to all directed groundfish fisheries each year between 1 February and 15 June, and the portion on Georges Bank is closed to all directed groundfish fisheries each year between 1 March and 31 May. Effects Assessment Airgun Array Noise According to underwater sound modelling carried out for the Shell Project (see Section 4.2 in Appendix A), the highest sound pressure level that would reach the Haddock Spawning Closure Area as a result of a single shot from a 5,085 in3 airgun array would be about 150-160 dB re 1 µPa (rms) in April. The maximum SPL reaching this Special Area would be lower during the May to September period. Based on the modelling, only a very small portion of the Haddock Spawning Closure Area would be exposed to the maximum SPL indicated above. Most of this area would receive SPLs <150 dB re 1 µPa (rms). These received sound levels would only occur during periods when the airgun arrays are active and operating in the northwestern portion of the Project Area. While these sound pressure levels exceed the hearing threshold for haddock (Nedwell et al. 2004) and could elicit behavioural responses from the fish, it is unlikely that physical or physiological effects would occur given the distance between the sound source and the Haddock Spawning Closure Area. In terms of effects on eggs and larvae, exposure to noise from the array would not result in physical and/or physiological harm to these life stages as eggs and larvae will only be harmed if they are within a few metres of the array (Appendix F). Based on these considerations, airgun array noise is judged to have negligible to minor effects on the Haddock Spawning Closure Area, over a short-term duration of <1 month and a geographic extent ranging from 101–1,000 km2. Therefore, residual effects related to exposure to airgun noise are judged to be not significant for the Haddock Spawning Closure Area. The level of confidence associated with this judgement is high. 6.2.2.5 LFA 40 Lobster Closure Area Background Summary The Lobster Closure Area, located on Brown’s Bank, was established in 1979. The year-round closure to lobster and crab fisheries was intended to protect lobster broodstock. The Study Area only overlaps the southeastern corner of the Lobster Closure Area (Figure 6.3). At its closest point, the lobster closure area is about 20 km from the Project Area and 85 km from the 2013 Seismic Activity Area.
Shelburne Basin 3-D Seismic Survey LGL Limited Environmental Assessment Page 73
Effects Assessment The potential impacts of underwater sound on invertebrates are discussed in Appendix G. Since the dominant Project activity to which lobster would be exposed is noise produced by discharging airguns, the assessment focuses on airgun noise. Airgun Array Noise Based on available scientific evidence, exposure to the noise produced by seismic airgun arrays associated with the Project will not affect lobsters in the Lobster Closure Area. Lobsters in the area will be at least 500 m away from the operating array and thus will not be affected by particle motion resulting from the airgun discharge. Based on these considerations, airgun array noise is judged to have negligible effects on the LFA 40 Lobster Closure Area, over a short-term duration of <1 month and a geographic extent judged to be <1 km2. Therefore, residual effects related to disturbance, are judged to be not significant for the LFA 40 Lobster Closure Area. The level of confidence associated with this judgement is high. 6.2.2.6 Georges Bank Moratorium Area (GBMA) Background Summary In 1988, a moratorium on oil and gas activities in the Canadian portion of Georges Bank was instituted, intended to continue until, at least, 1 January 2000. In 1999, the moratorium was extended until 31 December 2012. In May 2010, the moratorium was again extended, this time to 31 December 2015 (DFO 2011b). The Georges Bank Moratorium Area includes the Canadian portion of Georges Bank and much of Northeast Channel. The Study Area overlaps only the very eastern extreme of the Georges Bank Moratorium Area (Figure 6.3). The Georges Bank Moratorium Area is at least 30 km from the Project Area and 115 km from the 2013 Seismic Activity Area. Very strong tidal currents over steep topography lead to a tidal mixing front along the northern flank of Georges Bank. This tidal mixing front is likely the largest in Canada and one of the largest in the world. As a result of the frontal dynamics, nutrients are upwelled into the frontal zone. This nutrient pump feeds a very productive ecosystem which continues to support active fisheries. The primary production has been estimated to be about 40% greater than the surrounding shelf regions and the fish production is twice that of the surrounding areas. In addition to being identified as an area of plankton retention, this area also serves as the northern limit of distribution of many warm water species, and the southern limit of distribution for many cold water species. It contains distinctive populations of benthos, dominated by large filter feeders such as scallops. It is a spawning, breeding and feeding area for a myriad of species and a migration route for many more. The area provides spawning and nursery grounds for cod and haddock, spawning and settling area for scallops, and spawning and summer residence for deep water lobster. The Georges Bank Moratorium Area also includes the Northeast Channel Coral Conservation Area and the Hell Hole described above.

Shelburne Basin 3-D Seismic Survey LGL Limited Environmental Assessment Page 74
The predominant user of the GBMA is the commercial fishery. This includes 16 First Nations and the Native Council of Nova Scotia who are fishery licence holders which may afford rights to fish on Georges Bank. Fisheries of the area include sea scallop, lobster, crab, cod, haddock, yellowtail flounder, swordfish, tuna, herring, mahi mahi and shark. Effects Assessment Airgun Array Noise According to underwater sound modelling carried out for the Project (see Section 4.2 in Appendix A), the highest sound pressure level that would occur in the Georges Bank Moratorium Area as a result of a single shot from a 5,085 in3 airgun array would be 150-160 dB re 1 µPa (rms). These received sound levels would only occur during periods when the airgun arrays are active and operating in the western portion of the Project Area in April. Most of this Special Area would receive SPLs <150 dB re 1 µPa (rms). Based on these considerations, airgun array noise is judged to have negligible to minor effects on the marine invertebrates and fishes in the Georges Bank Moratorium area, over a short-term duration of <1 month and a geographic extent judged to be 101-1,000 km2. Therefore, residual effects related to exposure to seismic sound, are judged to be not significant for the Georges Bank Moratorium Area. The level of confidence associated with this judgement is high.
6.3 Other Ocean Users The “Other Ocean Users” VEC that is discussed in this EA includes the following components:
Commercial fisheries; Marine shipping; Research vessel surveys; and Department of National Defence (DND) Operations.
Each of the four VEC components is assessed individually in terms of interaction with routine activities of the Project. 6.3.1 Commercial Fisheries For the purposes of this Environmental Assessment, fish includes commercial fishery-targeted and incidental fishery bycatch macroinvertebrate and fish species in the Study, Project, and 2013 Seismic Activity Areas. This section provides commercial fisheries data (2005 to 2010) occurring in these Areas. The Project and 2013 Seismic Activity Areas are within Fishery Unit Areas 4Wl, 4Wj, 4Xl, 4Xn, and 4Wm; the Study Area also encompasses portions of Unit Areas 4Ww and 4Xx (Figure 6.6). The Areas are well within Canada’s 200-mile Exclusive Economic Zone (EEZ); therefore fisheries would be expected to be primarily domestic. Shell’s Project Area follows the 500 m water depth contour of the Scotian Shelf avoiding the majority of the area where much of the fishing activity occurs (Figure 6.6).

Shelburne Basin 3-D Seismic Survey LGL Limited Environmental Assessment Page 75
Source: DFO Commercial Fishery Landings Database, 2005 to 2010
Figure 6.6 All species Domestic Commercial Harvesting Locations, April to September 2005 to 2010
Combined. 6.3.1.1 Commercial Fisheries (2005 to 2010) This section describes the current and anticipated commercial fisheries in the 2013 Seismic Activity and Project Areas and adjacent waters (i.e., Study Area) in recent years (2005 to 2010). The biological characteristics and status of the main commercial species were previously described in DFO (2002), LGL (2005, 2012), Hurley (2011), and O’Boyle (2012). Data Sources The fisheries analysis in this section is based on data derived from a DFO multi-region and multi-year catch and effort dataset (DFO 2005 to 2010). Although the updated 2010 and additional 2011 dataset were not publicly available at the time of submission of this document (these data are still classified as preliminary by DFO), the harvest trends presented in this EA are unlikely to change significantly once the dataset is eventually updated. The data used to characterize the fisheries is the quantity of the harvest rather than its value, since quantities are directly comparable from year to year, whereas values (for the same quantity of harvest) may vary annually with species, negotiated prices, changes in exchange rates, and fluctuating market conditions.

Shelburne Basin 3-D Seismic Survey LGL Limited Environmental Assessment Page 76
Past harvesting locations can be plotted in relation to the Project and Study areas since many of the DFO catch data in these Areas are georeferenced. Many figures in this section display harvesting locations as represented by dark points not “weighted” by quantity of harvest but merely showing where fishing effort was recorded. Fisheries engagement included representatives of fisheries organizations and DFO. The engagements were undertaken to inform stakeholders about the proposed Project and 2013 seismic program, to gather information about expected future fishing activities, and to determine any issues or concerns. Those fisheries-related groups engaged and the issues and comments arising from the engagements are included in Appendix C. Fisheries-related information provided, and the issues raised during the consultations are discussed in their respective sections. Ongoing communication will occur between Shell and fisheries representatives to ensure coordination between seismic and fisheries activities. Other sources consulted for this section include fisheries management plans, CSAS status reports and other DFO documents. Domestic Fisheries in the Study Area
The average annual species harvests from the Study Area, 2005 to 2010, based on the georeferenced DFO datasets are shown in Table 6.3. The total domestic harvest in the Study Area during April to September 2005 to 2010 averaged 1,319 mt, and was dominated by swordfish, silver hake, and haddock in terms of average catch weight. Atlantic (striped) wolffish contributed <0.1% of the average harvest weight. The following also contributed <1.0% each to the average catch weight and are not featured in the table below: mako shark, bluefin tuna, hagfish, mahi mahi (dolphinfish), red crab, jonah crab, mackerel, Greenland halibut, albacore tuna, witch flounder, red hake, squid sp., skate sp., sea scallops, dogfish, white marlin, sea urchins, catfish, argentine, Illex squid sp., shark sp., winter flounder, snow crab, alewife, tilefish, white squid, sculpin sp., flounder sp., thresher shark, American plaice, tuna sp., groundfish sp., yellowtail flounder, pelagic fish sp., dusky shark, blue shark, roundnose grenadier, sand tiger shark, fish sp., American shad, and blue marlin. In terms of average value (total average $4,594,895), swordfish and lobster dominated harvests in the Study Area from 2005 to 2010. Atlantic (striped) wolffish contributed <0.1% to the average harvest value. With the exception of bluefin tuna (2.6%), the species which contributed <1.0% of the average harvest weight also contributed <1.0% each of the average catch value. The average annual species harvests from the Project Area, April to September 2005 to 2010 are shown in Table 6.4. Commercial fisheries in the Project Area had an average total of 150 mt in this time period, and consisted primarily of swordfish in average catch weight, and of swordfish and bigeye tuna in average catch value. As in the Study Area, Atlantic (striped) wolffish contributed <0.1% to the average catch weight and value in the Project Area. Species which contributed <1.0% each to both the average catch weight and value include: Greenland halibut, witch flounder, dogfish, skate sp., white marlin, sea urchins, lobster, snow crab, jonah crab, tilefish, red hake, argentine, shark sp., sea scallops, herring, catfish, squid sp., tuna sp., American plaice, sculpin sp., flounder sp., thresher shark, dusky shark, winter flounder, alewife, roundnose grenadier, yellowtail flounder, mackerel, white squid, Illex squid sp., and fish sp.

Shelburne Basin 3-D Seismic Survey LGL Limited Environmental Assessment Page 77
Table 6.3 Average Domestic Harvest by Species within the Study Area, April to September 2005 to 2010.
Species Quantity (mt) % of Total Value ($) % of Total
Swordfish 291 22.1 2,047,317 44.6 Silver Hake 243 18.5 171,855 3.7 Haddock 148 11.2 208,768 4.5 Redfish 122 9.2 86,642 1.9 Lobster 98 7.4 755,419 16.4 Pollock 53 4.0 44,205 1.0 Monkfish 48 3.6 67,989 1.5 Herring 45 3.4 8,535 0.2 Atlantic Cod 43 3.3 86,372 1.9 Porbeagle Shark 34 2.6 36,576 0.8 Bigeye Tuna 31 2.3 339,671 7.4 Atlantic Halibut 30 2.2 301,181 6.6 White Hake 23 1.8 23,306 0.5 Yellowfin Tuna 21 1.6 161,353 3.5 Cusk 20 1.5 17,891 0.4 Atlantic (Striped) Wolffish 0.3 <0.1 132 <0.1 Totals 1,248 94.6 4,357,212 94.8 Source: DFO Commercial Fishery Landings Database, 2005 to 2010
Table 6.4 Average Domestic Harvest by Species within the Project Area, April to September 2005 to
2010.
Species Quantity (mt) % of Total Value ($) % of Total Swordfish 41 27.7 287,429 39.9 Bigeye Tuna 12 8.3 145,184 20.1 Redfish 11 7.2 7,918 1.1 Monkfish 10 6.9 14,968 2.1 Yellowfin Tuna 9 5.7 67,629 9.4 Porbeagle Shark 7 4.9 8,190 1.1 Haddock 6 4.3 9,193 1.3 Atlantic Halibut 6 3.7 56,682 7.9 Atlantic Cod 5 3.6 11,391 1.6 White Hake 5 3.5 5,051 0.7 Pollock 5 3.2 4,060 0.6 Cusk 5 3.1 4,462 0.6 Red Crab 4 2.6 10,479 1.5 Bluefin Tuna 4 2.5 53,369 7.4 Silver Hake 3 2.2 2,249 0.3 Mahi Mahi (Dolphinfish) 3 2.1 9,031 1.3 Hagfish 3 2.0 1,123 0.2 Mako Shark 3 1.9 4,234 0.6 Albacore Tuna 1 1.0 9,740 1.4 Atlantic (Striped) Wolffish <0.1 <0.1 17 <0.1 Totals 144 96.4 712,399 98.8 Source: DFO Commercial Fishery Landings Database, 2005 to 2010 The average annual species harvests between April and September during 2005 to 2010 in the 2013 Seismic Activity Area are shown in Table 6.5. Commercial harvests (total average 18 mt) consisted

Shelburne Basin 3-D Seismic Survey LGL Limited Environmental Assessment Page 78
primarily of swordfish, porbeagle shark, and silver hake in average catch weight and of bluefin tuna, swordfish, and bigeye tuna in average catch value. Atlantic (striped) wolffish contributed ≤0.1% in average catch weight and value in the 2013 Seismic Activity Area from 2005 to 2010. Harvests in the 2013 Seismic Activity Area from April to September during 2005 to 2010 represented 12.0% of the harvest in the Project Area, and 1.4% of the harvest in the Study Area. The Project Area was also considerably lower in average catch weight relative to the Study Area as a whole, representing only 11.4% of the harvest. By far, the vast majority of harvest occurred in the area between the Study and Project Area bounds, particularly on the upper slope in depths <1,000 m. Table 6.5 Average Domestic Harvest by Species within the 2013 Seismic Activity Area, April to
September 2005 to 2010.
Species Quantity (mt) % of Total Value ($) % of Total Swordfish 2.5 14.0 18,616 21.5 Porbeagle Shark 2.2 12.3 2,082 2.4 Silver Hake 1.8 10.1 1,306 1.5 Bluefin Tuna 1.4 7.8 22,795 26.3 Atlantic Cod 1.3 7.3 3,043 3.5 Cusk 1.3 7.3 1,248 1.4 Bigeye Tuna 1.2 6.7 15,946 18.4 Haddock 1.1 6.1 1,556 1.8 Yellowfin Tuna 0.8 4.5 6,890 8.0 White Hake 0.7 3.9 704 0.8 Atlantic Halibut 0.7 3.9 7,230 8.4 Mako Shark 0.5 2.8 772 0.9 Dogfish 0.4 2.2 173 0.2 Mahi Mahi (Dolphinfish) 0.3 1.7 1,162 1.3 Hagfish 0.3 1.7 299 0.3 Sea Urchins 0.3 1.7 593 0.7 Pollock 0.3 1.7 228 0.3 Greenland Halibut 0.2 1.1 269 0.3 Albacore Tuna 0.1 0.6 481 0.6 Totals 17.9 97.4 86,524 98.6 Source: DFO Commercial Fishery Landings Database, 2005 to 2010
The aggregated catch weights of all species in the 2013 Seismic Activity Area, April to September 2005 to 2010, are shown in Figure 6.7. Overall, groundfish and pelagics comprised approximately equal portions of the aggregated catch weight in the 2013 Seismic Activity Area during this six-year period, with groundfish catch weight predominant during 2005 to 2006, both essentially equal in 2007, and pelagic catch weight predominant from 2008 to 2010. Aggregated catch weights were considerably lower in 2009 and 2010 compared to 2005 to 2008 levels. Domestic Harvesting Locations Domestic fishing locations (all species) in relation to the Study, Project, and 2013 Seismic Activity Areas for 2005 to 2010 (April to September aggregated) are shown in Figure 6.6. Most of the domestic fish harvesting in the general area of the Project occurred inshore of the 1,000 m contour of the Scotian Shelf, particularly in the northwestern portion of the Study Area. There was relatively little fishing

Shelburne Basin 3-D Seismic Survey LGL Limited Environmental Assessment Page 79
recorded within the 2013 Seismic Activity Area and the Project Area with the majority of the proximal fishing activity occurring north and west of the Project Area along the continental shelf. Shell’s Project Area follows the 500 m contour of the Scotian Shelf in order to avoid the majority of the area where much of the fishing activity occurs. Domestic harvesting locations for groundfish and pelagic species, swordfish, silver hake, haddock, bigeye tuna, and Atlantic (striped) wolffish are shown in Figures 6.8 to 6.14.
Source: DFO Commercial Fishery Landings Database, 2005 to 2010
Figure 6.7 Aggregated Catch Weight of all Groundfish and Pelagic Species in the 2013 Seismic
Activity Area, April to September 2005 to 2010. Domestic Harvesting Locations Domestic fishing locations (all species) in relation to the Study, Project, and 2013 Seismic Activity Areas for 2005 to 2010 (April to September aggregated) are shown in Figure 6.6. Most of the domestic fish harvesting in the general area of the Project occurred inshore of the 1,000 m contour of the Scotian Shelf, particularly in the northwestern portion of the Study Area. There was relatively little fishing recorded within the 2013 Seismic Activity Area and the Project Area with the majority of the proximal fishing activity occurring north and west of the Project Area along the continental shelf. Shell’s Project Area follows the 500 m contour of the Scotian Shelf in order to avoid the majority of the area where much of the fishing activity occurs. Domestic harvesting locations for groundfish and pelagic species, swordfish, silver hake, haddock, bigeye tuna, and Atlantic (striped) wolffish are shown in Figures 6.8 to 6.14.

Shelburne Basin 3-D Seismic Survey LGL Limited Environmental Assessment Page 80
Source: DFO Commercial Fishery Landings Database, 2005 to 2010
Figure 6.8 Groundfish Domestic Commercial Harvesting Locations, April to September 2005 to 2010
Combined.
Source: DFO Commercial Fishery Landings Database, 2005 to 2010
Figure 6.9 Pelagic Domestic Commercial Harvesting Locations, April to September 2005 to 2010
Combined.

Shelburne Basin 3-D Seismic Survey LGL Limited Environmental Assessment Page 81
Source: DFO Commercial Fishery Landings Database, 2005 to 2010
Figure 6.10 Swordfish Domestic Commercial Harvesting Locations, April to September 2005 to 2010
Combined.
Source: DFO Commercial Fishery Landings Database, 2005 to 2010
Figure 6.11 Silver Hake Domestic Commercial Harvesting Locations, April to September 2005 to 2010
Combined.

Shelburne Basin 3-D Seismic Survey LGL Limited Environmental Assessment Page 82
Source: DFO Commercial Fishery Landings Database, 2005 to 2010
Figure 6.12 Haddock Domestic Commercial Harvesting Locations, April to September 2005 to 2010
Combined.
Source: DFO Commercial Fishery Landings Database, 2005 to 2010
Figure 6.13 Bigeye Tuna Domestic Commercial Harvesting Locations, April to September 2005 to 2010
Combined.

Shelburne Basin 3-D Seismic Survey LGL Limited Environmental Assessment Page 83
Source: DFO Commercial Fishery Landings Database, 2005 to 2010
Figure 6.14 Atlantic (striped) Wolffish Domestic Commercial Harvesting Locations, April to September
2005 to 2010 Combined.
Timing of the Fisheries
The timing of commercial harvesting for any particular species can vary, depending on seasons and regulations set by DFO, the harvesting strategies of fishing enterprises, and on the availability of the resource itself. The greatest part of the average harvest (by quantity) in the Study Area occurred in February to April from 2005 to 2010, accounting for 55.2% of the average harvest catch weight by month (Figure 6.15), and in February to April (40.2%) and July to September (36.1%) in the Project Area (Figure 6.16). The majority of the average harvest by month in the 2013 Seismic Activity Area occurred from May to October (74.6%), with a lesser component in February to March (Figure 6.17).
Source: DFO Commercial Fishery Landings Database, 2005 to 2010
Figure 6.15 Average Monthly Catch Weight of all Species in the Study Area, 2005 to 2010.
01020304050607080
Jan Feb March April May June July Aug Sept Oct Nov Dec
AverageCatchWeight
(mT)
Month

Shelburne Basin 3-D Seismic Survey LGL Limited Environmental Assessment Page 84
Source: DFO Commercial Fishery Landings Database, 2005 to 2010
Figure 6.16 Average monthly Catch Weight of all Species in the Project Area, 2005 to 2010.
Source: DFO Commercial Fishery Landings Database, 2005 to 2010
Figure 6.17 Average Monthly Catch Weight of all Species in the 2013 Seismic Activity Area, 2005 to
2010. Fishing Gear Fisheries within the Project and 2013 Seismic Activity Areas are conducted using both fixed (e.g., longline for swordfish) and mobile gear (e.g., bottom otter trawls for haddock). Longline (fixed gear) accounted for the majority of the average annual catch weight of commercial harvests in both Areas, accounting for approximately 70% of the total average catch weight from April to September 2005 to 2010 (Tables 6.6 and 6.7). This was followed by bottom otter trawl (stern) (mobile gear); accounting for approximately 20% of the total average catch weight in the Project Area and approximately 10% in the 2013 Seismic Activity Area during this time. Swordfish and porbeagle shark accounted for the greatest proportion of the fixed gear average catch weight for the Study, Project and 2013 Seismic Activity Areas, while silver hake accounted for the majority of the mobile gear average catch weight in the Study and 2013 Seismic Activity Areas, and redfish and monkfish for the Project Area (Appendix H). There are directed fisheries for swordfish, silver hake and redfish; however, monkfish are managed as a bycatch species (DFO 2002, 2010, 2011; Hanke et al. 2012).
0
1
2
3
4
5
6
Jan Feb March April May June July Aug Sept Oct Nov Dec
AverageCatchWeight
(mT)
Month

Shelburne Basin 3-D Seismic Survey LGL Limited Environmental Assessment Page 85
Table 6.6 Average Annual Project Area Catch Weight by Gear Type, April to September 2005 to 2010.
Gear Type Quantity (mt) % of Total Gear Class Longline 101 67.3 Fixed Bottom Otter Trawl (stern) 33 21.9 Mobile Pot (unspecified) 5 3.0 Fixed Gillnet (set of fixed) 4 2.4 Fixed Trap Net 3 2.0 Fixed Harpoon 3 1.9 Mobile Rod and Reel (trolling) 1 0.8 Mobile Electric Harpoon 0.4 0.3 Mobile Rope 0.3 0.2 Fixed Troller Lines 0.1 0.1 Mobile Dredge (boat) <0.1 <0.1 Mobile Totals 150 100.0
Source: DFO Commercial Fishery Landings Database, 2005 to 2010 Table 6.7 Average Annual 2013 Seismic Activity Area Catch Weight by Gear Type, April to
September 2005 to 2010.
Gear Type Quantity (mt) % of Total Gear Class
Longline 12.9 72.1 Fixed Bottom Otter Trawl (stern) 1.9 10.6 Mobile Gillnet (set of fixed) 1.0 5.6 Fixed Rod and Reel (Trolling) 0.9 5.0 Mobile Electric Harpoon 0.4 2.2 Mobile Trap Net 0.3 1.7 Fixed Rope 0.3 1.7 Mobile Troller Lines <0.1 <0.6 Mobile Harpoon <0.1 <0.6 Mobile Totals 17.9 100.0
Source: DFO Commercial Fishery Landings Database, 2005 to 2010 Effects Assessment Airgun Array Noise The hearing thresholds of the commercial fisheries target species, like most marine invertebrates and fishes studied, are most sensitive to low frequency sound (i.e., <1,500 Hz) (Appendices F and G). Some fishes lack a swim bladder and are therefore not sensitive to the sound pressure component of sound, only the particle motion component. Other fishes do have a swim bladder and are sensitive, at varying degrees, to the sound pressure component as well as the particle motion component of sound. All marine invertebrates are sensitive to only the particle motion component. Although exposure to airgun noise can cause physical and physiological effects on fishes, studies that conclude that there are such effects typically involve captive subjects that are unable to move away from the sound source and are therefore exposed to higher sound levels than they would be under natural conditions. Any physical/physiological effects of exposure to seismic noise can be confidently dismissed (Appendices F and G). However, it is possible that seismic noise may result in behavioural effects. As indicated in Section 4.2 on Noise Criteria for Assessing Effects, subtle behavioural responses by fishes to airgun
Shelburne Basin 3-D Seismic Survey LGL Limited Environmental Assessment Page 86
sound may occur once received sound pressure levels are >160 dB re 1 µPa (0-p) and more explicit behavioural responses (e.g., swimming activity) by fishes likely occur once received SPLs are > 180 dB re 1 µPa (0-p). Underwater sound modelling (Appendix A) was conducted at three locations in the Project area, including two in the 2013 Seismic Activity Area. The modelling location with the shallowest water (500 m) was outside the 2013 Seismic Activity Area in the northwestern edge of the Project Area. This location had the highest horizontal distance for SPLs ≥180 dB re 1 µPa (0-p) (1.037 km; assuming constant radius, area = 3.4 km2) but the lowest horizontal distance for SPLs ≥160 dB re 1 µPa (0-p) (11.6 km; assuming constant radius, area = 426 km2). Conversely, the modelling location with the deepest water (>3,000 m) (southwestern corner of 2013 Seismic Activity Area) had the lowest horizontal distance for SPLs ≥180 dB re 1 µPa (0-p) (776 m; assuming constant radius, area = 1.9 km2) but the highest horizontal distance for SPLs ≥160 dB re 1 µPa (0-p) (26.2 km; assuming constant radius, area = 2,149 km2). The modelling location nearest the Haddock Box at the northeastern corner of the 2013 Seismic Activity Area is characterized by intermediate horizontal distances and areas for both SPL ranges. The modelling also indicted that in April airgun noise is trapped in the upper 100 m of the water column (upward refracting) which in turn reduces interaction with the bottom and sound attenuation. Over time (i.e., May to September), the upper column becomes downward refracting, thereby increasing bottom interactions and sound attenuation. This explains why the higher SPLs of the airgun noise travel furthest in the early spring, with distances decreasing throughout the summer and into September. With the implementation of mitigations such as good communication between the commercial fishers and the seismic vessels, and any temporal and/or spatial avoidance agreed to as a result of this communication, airgun array noise is judged to have minor effects on commercial fisheries, over a short-term duration of <1 month and a geographic extent judged to be 101-1,000 km2. Therefore, residual effects related to exposure to seismic sound on commercial fisheries, are judged to be not significant. The level of confidence associated with this judgement is medium to high. Presence of Seismic Vessel/Streamer Configuration The proposed WAZ configuration will be almost 5 km wide, substantially larger than the typical 3D single seismic vessel/streamer configuration (i.e. approx. 1.2 km wide). The fishing gear with the most potential to be physically contacted by the seismic configuration is longline used in the large pelagic fishery. This gear is considered to be fixed gear. Shell has and will continue to engage with the pelagic fisheries or their representatives in advance of commencement of the seismic program. Swordfish and tuna fishery representatives have identified that their priority regions overlap the mid and northern sections of Shell’s proposed 2013 seismic area. Shell representatives will incorporate this information into seismic program planning as applicable and feasible. The other dominant gear type used in the Project Area is trawl, a mobile gear. The latter can be more easily moved to avoid the seismic configuration than the fixed gear. As discussed in relation to the potential effects of exposure of target species to airgun noise, good communication between fishers and seismic surveyors can mitigate the potential conflict. Once the timing and seismic survey pattern are determined (i.e., either anti-parallel or racetrack), both fishers and the seismic contractor can plan their operations to avoid conflicts at sea In addition, multiple guard vessels will be sailing in front of the seismic configuration to identify any potential for conflict between fisheries activities and seismic activities. Streamer deployment will likely be conducted on the Scotian Shelf en route to the Project Area (Figure 6.18).

Shelburne Basin 3-D Seismic Survey LGL Limited Environmental Assessment Page 87
Figure 6.18 Approximate Locations of Seismic Streamer Deployment on the Scotian Shelf. Streamer deployment logistics will be effectively communicated by Shell to those associated with fisheries on the Scotian Shelf, including fisheries outside the Project Area within the potential deployment zone. Identified fisheries contacts were informed of Shell’s proposed seismic deployment plan as part of the information package distributed in February 2013 (see Section 3.4). Follow up was conducted with those fisheries that had not responded to ensure that any concerns were addressed. Additionally during streamer deployment and seismic activites two Fisheries Liaison Officers (FLOs) will be supporting the seismic fleet, one on each outside streamer vessel, to ensure that both seismic and fisheries activities are coordinated and conflict is avoided. Both FLOs will be active during daylight hours and available (i.e., on call) during nighttime hours. The key responsibilities of the FLOs are (1) to act as liason(s) between seismic operations and fisheries; and (2) to provide advice on any potential interactions with fisheries activities (e.g., gear, fishing vessels) and/or other ocean users, and to help to either avoid or resolve conflict. Fisheries were informed that Shell does not plan to conduct airgun firing outside of the proposed Seismic Activity Area for the 2013 Program (i.e. the red box in Figure 6.18). The seismic ships will likely only require the use of areas outside of the Seismic Activity Area to come about during line changes. In the event that gear is damaged or lost due to contact with the seismic configuration, the compensation claims process will be activated as per the Compensation

Shelburne Basin 3-D Seismic Survey LGL Limited Environmental Assessment Page 88
Guidelines Respecting Damages Relating to Offshore Petroleum Activity (C-NLOPB/CNSOPB 2002) and the Guideline for the Reporting and Investigation of Incidents (C-NLOPB/CNSOPB 2009). With mitigations in place and the fact that most of the Project Area is outside the most heavily fished areas, the presence of the seismic vessel/streamer configuration is judged to have minor effects on commercial fisheries, over a short-term duration of <1 month and a geographic extent judged to be 11-100 km2. Therefore, residual effects related to the presence of WAZ seismic vessel/streamer configuration on commercial fisheries, are judged to be not significant. The level of confidence associated with this judgement is medium to high. 6.3.2 Marine Shipping 6.3.2.1 Background Nova Scotia’s strategic location close to the Great Circle Route (i.e., shortest distance over the earth’s surface) between eastern North America and Europe makes this region important for international shipping. Commercial shipping is generally in the form of tankers, general bulk and containerized cargo carriers (DFO 2011c). Merchant traffic in the area remains relatively constant over the course of the year but cruise ships are heavily seasonal (summer and fall) (Pelot and Wootton 2004, cited in Walmsley and Theriault 2011). The primary commodities being moved include crude oil and gas, minerals and chemicals, paper and forest products, coal and coke, gypsum, automobiles and various containerized goods (DFO 2011c). There is no single shipping corridor through the Study Area. Commercial shipping follows dedicated vessel traffic separation lanes upon nearing Halifax, Saint John and the Strait of Canso. Outside of these controlled areas, mariners tend to decide on their preferred routing (Hurley 2011). Figure 6.19 provides a snapshot of vessel traffic density off Nova Scotia. Shipping traffic within the Study Area is greatest running parallel to the shelf edge. There is no published information on the exact number of vessels traversing the Scotian Shelf, but figures for international ships making use of Nova Scotian ports show a regular pattern of between 1,600 and 2,000 large vessels per annum (Walmsley and Theriault 2011). Halifax is the largest port in Nova Scotia with the most diverse cargo base. In 2010 it handled 9.5 million tonnes of cargo. It is the largest short sea shipping port in the country, the second largest cruise port in Canada after Vancouver and the third largest container port in Canada (DFO 2011c). The Strait of Canso Superport, located approximately 450 km northeast of the Project Area, consists of the Mulgrave Marine Terminal and the Port Hawkesbury Pier. In 2009, the Strait Superport handled 33.5 million tonnes of cargo and had 1,380 vessel movements. Most of the volume was accounted for by a petroleum facility operated by Statia Terminals. Bulk exports of gypsum, paper products, aggregate and imports of coal made up the remainder (DFO 2011c). In addition to Halifax and Port Hawkesbury there are a number of smaller ports along the Scotian Shelf including Sydney, Liverpool, Shelburne and Sheet Harbour. These ports deal with cargo such as fish, lumber, oil and newsprint (DFO 2011c).

Shelburne Basin 3-D Seismic Survey LGL Limited Environmental Assessment Page 89
The Port of Saint John, New Brunswick is also important due to the movement of traffic through the Study Area to and from the Bay of Fundy (Figure 6.19). In 2011, the Port of Saint John handled 31.76 million metric tonnes of cargo, the large majority being crude oil destined for the Irving oil refinery and refined petroleum products delivered from the refinery. Over 45,000 sea containers (twenty foot equivalent units – TEUs) are also typically handled per year (Port of Saint John, 2012). The main ports of call for cruise ships near the Study Area are Halifax, Saint John and Sydney, the closest being Halifax approximately 200 km north of the Study Area. The number of vessels has been increasing steadily in the last few years, with 127 vessels and 261,000 passengers to Halifax in 2010, up from 89 vessels and 170 000 passengers in 2006 (DFO 2011c). Saint John, located over 500 km from the Project Area, is the second largest cruise port in eastern Canada, and was visited by 76 vessels and 205 000 passengers in 2010 (Port of Saint John 2012). The same vessels often visit the three ports in a single trip. Atlantic Canadian ports have benefited from the growing trend towards four- to five-day cruises along the eastern seaboard (DFO 2011c). The shipping industry is regulated internationally by the International Maritime Organization (IMO). Much of Canada’s legal framework is from the implementation of international agreements like the International Convention for the Prevention of Pollution from Ships and the International Convention for the Safety of Life at Sea. National governments are required to implement and enforce international regulations through their domestic legislation such as the Canada Shipping Act (DFO 2011c). Vessels must comply with the provisions of the Canada Shipping Act and related regulations. The Act addresses pollution prevention such as national standards for oil concentrations in discharged water (DFO 2008). Koropatnick et al. (2012) compare Figure 6.19 which was generated from year-round 2000 Canadian Coast Guard’s Eastern Canada Vessel Traffic Services Zone (ECAREG) data and Figure 8 in Koropatnick et al. (2012) which was generated from year-round 2010-2011 (Long Range Identification and Tracking (LRIT) data. Some of the routings in Figure 6.19 are no longer valid while the LRIT-generated figure includes some routings through Canadian waters without a Canadian port of call (e.g., track lines between Europe and the eastern seaboard of the United States) that are not presented in Figure 6.19. Overall, the pattern of track lines through the Study Area is similar for both figures.

Shelburne Basin 3-D Seismic Survey LGL Limited Environmental Assessment Page 90
Figure 6.19 Commercial Shipping Traffic Density in and Near the Project Area in 2000. 6.3.2.2 Effects Assessment It is possible that increased vessel presence as a result of the proposed Project may interact with commercial shipping on the Scotian Shelf and Slope although this risk is considered minimal as the main ports of call are substantially distanced from the Project Area and, as shown in Figure 6.18, a relatively low density of shipping traffic is identified in the Project Area and 2013 Seismic Activity Area. Additionally, a Notice to Mariners will be published to advise shipping interests that seismic operations will be conducted over a specific timeframe in the Project Area. Commercial vessels will likely be seen on radar, and chase or picket vessels will be used to scout for other vessels in the area in order to avoid any potential collision or entanglement of the towed seismic gear. There has not been any documented conflict between seismic operations and commercial vessels off Nova Scotia. Therefore, any potential residual effects on marine shipping from the Project are judged to be not significant. The level of confidence associated with this judgement is high. 6.3.3. DFO Scientific Research 6.3.3.1 Background The primary DFO research activity that has potential to interact with the Project is the annual Research Vessel (RV) multi-species trawl survey. Typically DFO requires a certain temporal and spatial buffer between seismic surveying and trawl surveying to ensure that the underwater noise caused by airgun discharge does not affect survey results. Final scheduling of the DFO RV surveys for 2013 is not yet available (D. Clark, DFO, pers. comm.). Two other DFO research programs, RAPID (part of UK RAPID

Shelburne Basin 3-D Seismic Survey LGL Limited Environmental Assessment Page 91
Climate Change Program) and Atlantic Zone Monitoring Program (AZMP), are scheduled to occur in April and May 2013, respectively. The RAPID program involves recovery of bottom moorings and deployment of replacement moorings, while AZMP involves measurement of oceanographic parameters from the vessel deck (K. Curran, DFO, pers. comm.). While underwater sound is not an issue with the RAPID and AZMP programs, physical presence of the seismic survey vessel/streamer configuration could be. The locations of RAPID moorings and AZMP activities are shown in Figure 6.20. Most locations occur to the east and southeast of the Project Area. No locations are identified within the 2013 Seismic Activity Area.
Figure 6.20 Locations of DFO’s RAPID Moorings and AZMP Activities for 2013. 6.3.3.2 Effects Assessment Conflict between proposed seismic surveying and the DFO research programs can be mitigated through communication between Shell and DFO. Although the footprints of the DFO research programs will overlap with the 2013 Seismic Activity Area, DFO will be contacted in advance of seismic activities to acquire clarity on the 2013 RV survey program and to ensure that coordination between both activities is achieved. Based on these mitigations measures, the residual effect of Project activities on DFO scientific research in the area is judged to be not significant. The level of confidence associated with this judgement is high.

Shelburne Basin 3-D Seismic Survey LGL Limited Environmental Assessment Page 92
6.3.4 Department of National Defence (DND) Operations 6.3.4.1 Background Canada’s naval presence on the east coast is provided through Maritime Forces Atlantic (MARLANT) from its headquarters in Halifax. Canada’s maritime forces engage in a range of operations including sovereignty patrols, maritime surveillance, naval training and combat readiness, search and rescue, humanitarian relief and aid to civil authorities, and operational support to other government departments, including fisheries and environmental protection. To carry out its missions, MARLANT uses a range of platforms, including patrol frigates, coastal defence vessels, destroyers, submarines, ship-borne helicopters and long-range patrol aircraft (MARLANT 2012). DND conducts training and other operations in designated ‘Operations Areas’ off the south coast of Nova Scotia (Figure 6.21). The Project Area overlaps with areas L1, L2, M1, M2, N1 and N2. There are also several offshore sites where munitions have been dumped in the past. Proponents are required to consult with DND to determine potential interactions with unexploded munitions prior to activity commencement (Hurley 2011). The proposed Project will not come into contact with the sea bottom therefore disturbance of unexploded munitions and shipwrecks are not expected to occur.
Figure 6.21 Designated DND Operations Areas in and Near the Project Area.

Shelburne Basin 3-D Seismic Survey LGL Limited Environmental Assessment Page 93
6.3.4.2 Effects Assessment DND operations may include underwater noise monitoring. Therefore, noise produced by the Project, primarily from the discharge of the airguns has the potential to interfere with DND underwater noise monitoring operations. Communication between DND and Shell should minimize any potential for interference. To date, there have not been any adverse interactions between seismic activities and DND operations off Nova Scotia. Again, this is due to the requirement for oil and gas proponents to consult with DND (Hurley 2011). DND has been made aware of the Project and the location of the proposed 2013 seismic survey as part of the environmental assessment process (Appendix C). As the location of future military training operations are still being determined, DND will be consulted prior to the commencement of seismic operations. In addition, Notices to Mariners will be issued prior to commencement of seismic surveys. Given that Shell will continue to engage with DND regarding its proposed activities, the potential residual effects from Project activities on DND training and other operations are judged to be not significant. The level of confidence associated with this judgement is high.
Shelburne Basin 3-D Seismic Survey LGL Limited Environmental Assessment Page 94
7.0 Malfunctions and Accidental Events
7.1 Scenarios This section provides an assessment of the potential effects on the VECs of a malfunction or accidental event resulting in the release of hydrocarbons to the marine environment during the Project. The Scoping Document (CNSOPB 2012) required consideration of a hydrocarbon release from seismic streamers and a “light” fuel spill from seismic vessels. The 2013 seismic survey program as well as any seismic conducted in 2014 will utilize solid streamers, therefore accidental discharges of streamer fluid will not occur. In the event that future surveys (i.e., after 2014) use fluid filled streamers, the fluid used to control buoyancy is called Isopar-M, predominantly consisting of isoparaffinic hydrocarbons (C12-C15). In a typical Isopar-filled streamer, each 100 m hydrophone section contains 11.7 L of Isopar divided amongst 78 hydrophone pockets (i.e., 0.15 L per pocket). Each hydrophone pocket is completely sealed from all other pockets. This isolation of pockets greatly reduces the chances of releasing large amounts of fluid even in the event of a major streamer accident. Since the streamers will be approximately 10 m below surface during operations, it is unlikely that damage to streamers would occur even in the event of another vessel passing over them or during poor weather. The most reasonable explanation for damage to streamers would be a bite or attack of some sort (e.g., shark) but this too is very unlikely. It is assumed that no more than 1 L of Isopar will be released into the water as a result of a shark bite. All Project vessels will use either marine gas oil (MGO) or marine diesel oil (MDO). It is possible that there could be small spills of fuel or other fluids (e.g., hydraulic fluid) during the Project. The chances of a large fuel spill are considered extremely remote; particularly considering mitigation measures in place (see Sections 7.2 and 11.8). For the purposes of this EA, a scenario for an accidental release of fuel during routine bunkering of a seismic vessel was considered. This scenario was chosen, on the basis that in the unlikely event that an accidental release were to occur, this would be the most probable cause. It is assumed that side by side bunkering for the seismic vessels will be used during the Project. This will allow for almost complete visual monitoring of the transfer hose during bunkering meaning that a leak would likely not go unnoticed for more than a few seconds and that full shutdown of the fuel pumps would be initiated within ten seconds of leak occurrence. However, assuming a fuel transfer rate of ~100 m3/hour and that the leak was stopped after 30-40 seconds, about 1,000 L of fuel could be accidentally released with all or some entering the marine environment. Both MGO and MDO would persist in the environment for much shorter periods than would crude oil or heavy fuel oils such as Bunker C. In cold water, only about 50% of spilled MGO or MDO would remain on the water surface after 12 hours (Smith and McIntyre 1971). Thus, a spill of these fuels would not persist for long periods on the water surface. About half of the oil lost from the surface is dispersed in the water column and the other half is lost to evaporation (Birchard and Nancarrow 1986). Once in the water column, the half-life of diesel at 0º to 2ºC may be more than 10 days (Gearing and Gearing 1982).

Shelburne Basin 3-D Seismic Survey LGL Limited Environmental Assessment Page 95
In summary, assuming the scenarios discussed above, the volumes of hydrocarbons that would be released to the marine environment in the event of either a streamer or refueling leak during the Project would be <1 L and about 1,000 L, respectively.
7.2 Mitigations Preventative measures and plans will be in place to avoid any fuel spillage or other accidental events during the seismic program. Plans and measures include:
spill prevention plans; ship-board pollution prevention plans; crew training; and adherence to the safety management procedures including proper bunkering procedures
(see Section 11).
Additionally, Project vessels will be equipped with spill kits as appropriate.
7.3 Effects Assessment 7.3.1 Marine Mammals and Sea Turtles The known effects of oil on marine mammals have been reviewed by Engelhardt (1983, 1985), Geraci and St. Aubin (1990), and Richardson et al. (1989) and marine mammals and sea turtles are also reviewed (and assessed) in recent drilling EAs for Newfoundland (e.g., Hebron 2011). It should be noted that most studies of oiling effects on marine animals have considered much heavier fuel than MGO or MDO. In general, the main effect of oil on marine mammals is to destroy the insulating capability of the fur of mammals that rely on fur for insulation. In the Study Area, whales and seals rely on a layer of blubber, rather than fur, for insulation making them less susceptible to negative effects. The exception is seal pups that have not yet developed insulating blubber. Additionally, whales and seals do not exhibit large behavioural or physiological responses to limited surface oiling, incidental exposure to contaminated food, or ingestion of oil (St. Aubin 1990; Williams et al. 1994). Sea turtles are thought to be more susceptible to the effects of exposure to hydrocarbons than marine mammals (Husky 2000). The release of a small volume of Isopar is unlikely to interact with marine mammals or sea turtles. Considering the mitigation measures in place for spill prevention and cleanup, the rapid degeneration of MGO or MDO, the location of refuelling in offshore areas within the Project Area, and that the marine mammals expected to be most vulnerable to exposure to hydrocarbons are expected to occur in very low numbers, the residual effects of malfunctions and accidental events is judged to have negligible to minor effects on marine mammals and sea turtles, over a short-term duration of <1 month and a geographic extent judged to be <1 km2 to 1-10 km2. Therefore, residual effects related to malfunctions and accidental events on marine mammals and sea turtles in the Study Area, are judged to be not significant. The level of confidence in this judgement for either a release of Isopar from the streamers or a small volume fuel spill is high.

Shelburne Basin 3-D Seismic Survey LGL Limited Environmental Assessment Page 96
7.3.2 Migratory Birds The main concern about a fuel spill is the resulting surface slick that could contaminate birds that either land on it or swim through it. Even very small amounts of fuel are enough to break down the insulation capability of the feathers and cause the bird to die in cold waters (O’Hara and Morandin 2010). Spills can cause large bird mortalities if they occur near large concentrations of birds or near large nesting colonies (e.g., Joensen 1972; Campbell et al. 1978). See Hebron (2011) for a review of hydrocarbon exposure effects on birds. The release of a small volume of Isopar is unlikely to interact with large numbers of birds. Considering the mitigation measures in place for spill prevention and cleanup, the location of refuelling in offshore areas away from coastal concentrations of birds and the rapid degeneration of MGO and MDO, the residual effects of malfunctions and accidental events is judged to have minor effects on migratory birds, over a short-term duration of <1 month to 1-12 months and a geographic extent judged to be <1 km2
to 1-10 km2. Therefore, residual effects related to malfunctions and accidental events on migratory birds in the Study Area, are judged to be not significant. The level of confidence in this judgement for either a release of Isopar from the streamers or a small volume fuel spill is high. 7.3.3 Invertebrates and Fishes There is a considerable body of literature related to the effects of exposure to hydrocarbons on marine invertebrates and fishes-- see LGL (2011) for a review of hydrocarbon exposure effects. Under natural conditions, most juvenile and adult fish can actively avoid contaminated water (e.g., Hjermann et al. 2007). Pelagic marine invertebrates can also avoid contaminated water while the benthic invertebrates would not come into contact with the hydrocarbons in water depths that characterize the Study Area. Considering the relatively small amount of hydrocarbons that would be released to the marine environment during a malfunction and accidental event, and the application of appropriate mitigation measures, a small volume release of either Isopar, MGO or MDO is judged to have negligible to minor magnitude residual effects on marine invertebrates and fishes (including eggs and larvae) for a short-term duration of <1 month and over a geographic extent <1 km2 to 1-10 km2. Therefore, the residual effects of malfunctions and accidental events on marine invertebrates and fishes in the Study Area are judged to be not significant. The level of confidence in this judgement for a small volume release of either Isopar or fuel oil is high. 7.3.4 Special Areas The Special Area that would most likely be affected by the accidental release of a small amount of hydrocarbons during the Project is the Scotia Slope/Shelf Break EBSA because of the large degree of overlap between the EBSA and the Project and 2013 Seismic Activity Areas. However, as described in Sections 7.3.1-7.3.3, the characteristics of Isopar and MGO/MDO as well as the low volumes that would be released would result in minimal effects on the EBSA. In addition, the application of appropriate mitigations measures will further reduce the residual effect. Therefore, the residual effects of a malfunction or accidental event resulting in the release of a small volume of hydrocarbons on Special Areas are judged to be not significant. The level of confidence in this judgement for a small volume release of either Isopar or fuel oil is high.

Shelburne Basin 3-D Seismic Survey LGL Limited Environmental Assessment Page 97
7.3.5 Commercial Fisheries The primary effects of hydrocarbon releases on fisheries pertain to physical effects on target species, actual and perceived tainting of target species, and fouling of gear. As noted above, physical effects on marine invertebrates and fishes from a small volume hydrocarbon release are expected to be negligible to minor in magnitude. However, if the release were of sufficient magnitude, it could prevent or impede a harvester’s ability to access fishing grounds because of temporary exclusion areas during the release and/or subsequent clean-up, caused damage to fishing gear or resulted in a negative effect on the marketability of fish products due to actual or perceived tainting. Considering the relatively small amount of hydrocarbons that would be released to the marine environment during the malfunction and accidental event scenarios, the low level of fishing activity in the Project Area (Figure 6.6) and the application of appropriate mitigation measures, a small volume release of hydrocarbons is judged to have negligible to minor residual effects on the commercial fisheries for a short-term duration of <1 month, and over a geographic extent of <1 km2 to 1-10 km2. Therefore, the residual effects of a malfunction and/or accidental event resulting in a small volume release of hydrocarbons on the commercial fisheries are judged to be not significant. The level of confidence in this judgement for a small volume release of either Isopar, MDO or MGO is high.

Shelburne Basin 3-D Seismic Survey LGL Limited Environmental Assessment Page 98
8.0 Effects of the Environment on the Project The SEA for the Southwest Scotian Slope provides a synopsis of the physical environmental conditions in this region. The Project Area is expected to be within the range of the conditions described in the SEA and summarized in Table 8-1 (Hurley 2001). During May to September, wind direction is most frequently southwest with an average wind speed in July of 4.8 m/s. Weather conditions during the summer typically result in waves under 2 m, but have exceeded 5 m in June (Hurley 2011). Arctic air masses and tropical air masses from the Gulf of Mexico converge over the offshore area of Atlantic Canada. The surface climate of the Project Area depends on these airstreams and their fronts. Fog with visibility <1 km is reported on 35% of days on an average annual basis. July is the month with the most fog, typically reporting fog on 65% of days. Fog can affect seismic operations by limiting helicopter operations, visual monitoring for marine mammals and sea turtles and also small boat operations that may be required for repairing streamers. Icebergs typically decay on the Grand Banks of Newfoundland before reaching the Scotian Shelf. Historically, maximum sea ice conditions do not extend as far south as the Southwest Scotian Slope area (typically about 300 km to the north). In the unlikely event of an iceberg being present, it would be detected in advance of the survey vessel(s) via radar and the chase vessels. As a result, survey vessel(s) will be able to maneuver to avoid any possible collision. The Atlantic hurricane season runs from June through November, which coincides with the timing of the Project. A total of 89 tropical storms entered the Maritimes marine area between 1951 and 2000. Forty- one of these storms were at hurricane strength (Environment Canada 2012a). Up to four tropical storms, hurricanes or post tropical storms can be expected to reach Canadian waters in a given year (Environment Canada 2012b). Environmental constraints on seismic surveys are those imposed by winds, waves, currents and differences in water temperatures. Currents and differences in water temperatures may affect the optimal positioning of the streamers but this is a potential data collection or quality issue versus an environmental issue. Typically, seismic vessels can continue operating in conditions up to Sea State 5 with wave heights 3 m or greater. Seismic (and geohazard) vessels typically suspend surveys once wind and wave conditions reach specified levels because the ambient noise affects the data. Seismic operators also do not want to damage towed gear which would cause costly delays. Furthermore, potential safety issues associated with poor weather conditions will be assessed in detail through the review of Shell’s Safety Plan and Emergency Response Plan as part of the geophysical authorization process established by the CNSOPB. The Project scheduling of April to September avoids more frequent extreme weather conditions typically encountered over the winter. The Project will however be executed during the Atlantic hurricane season. Shell’s geophysical contractors will be familiar with east coast operating conditions and written procedures will be in place under the Emergency Response Plan for the continuous monitoring of actual and predicted weather conditions. The Emergency Response Plan will also identify specific actions to be taken in the event of extreme weather. These actions may include the suspension of operations, lowering the seismic gear to a deeper depth to avoid potential impacts or

Shelburne Basin 3-D Seismic Survey LGL Limited Environmental Assessment Page 99
damage by wave action, retrieval of gear and/or moving the vessels in advance of a storm’s approach to a safe location either within or outside of the Project Area. Effects of the biological environment on the Project are unlikely although there are anecdotal accounts of sharks damaging streamers. As discussed in Section 7.1, because of the isolation of small pockets of hydrophone fluids within the streamers, it is assumed that no more than 1 L of hydrocarbons will be released into the water as a result of a shark bite. In summary, with appropriate monitoring and mitigation measures, the residual effects of the environment on the Project are judged to be not significant. Table 8.1 Annual Summary of Climatological and Oceanographic Features of the Project Area.
Physical and Climatological Summary Climatology Daily mean air temperatures: from -1.3C in Feb to 17.6C in Aug
Extreme minimum air temperatures: from -19.4C in Jan to 4.4C in Jul / Aug Extreme maximum air temperatures: from 12.8C in Feb to 29.6C in Jul Average days of fog: from 4 days in Dec to 22 days in July
Wind Average wind speed: from 4.8 m/s (9.3 knots) in Jul to 9.8 m/s (19.0 knots) in Jan
Most frequent wind direction: SW from May-Sep & W and NW from Oct-Mar Max. hourly speed: from 17.3 m/s (33.6 knots) in Jun/Jul (SW) to 28.5 m/s
(55.4 knots) in Dec (NW) Waves Monthly mean Hsig (m): from 1.4 in Jul/Aug to 3.0 in Jan
Monthly maximum Hsig (m): from 5.3 in June to 14.3 in Mar 5-year return Hmax (m): 17.5 100-year return Hmax (m): 23.7
Ocean Currents Shelf break current (>1,000 m isobath): seasonally varying SW flow along the Shelf edge of water derived from the Labrador Current; acts as a barrier to onshore transport.
Ocean circulation patterns can vary over short time scales due to rapid changes in physical forcing variables (e.g., winds, warm core rings, and slope water intrusions)
Typical current speeds: 5–15 cm/s (0.1–0.3 knots) Peak current: near-surface flow of 50–60 cm/s (0.97–1.2 knots) in the winter
season Sea Ice / Icebergs <1% frequency of sea ice
Icebergs very uncommon Summarized in Section 2.4.1 of Hurley (2011). Notes: Hsig = significant wave height or average height of the waves which comprise the highest 33% of waves in a given sample period (typically 20-30 min). Hmax = maximum wave height in a recorded burst of raw data.

Shelburne Basin 3-D Seismic Survey LGL Limited Environmental Assessment Page 100
9.0 Cumulative Effects Cumulative environmental effects assessments address potential adverse effects from past, present and reasonably foreseeable projects (Hegmann et al. 1999). A cumulative effects assessment attempts to ensure that the sum of potential effects from multiple sources or stressors on a VEC or group of VECs is evaluated. It is entirely possible that a number of individually assessed insignificant effects may additively become significant. The residual effects described in the preceding sections include potential cumulative effects from the different phases of the proposed Project activities in the Study Area. This section will assess cumulative effects from the Project in combination with other users and activities. Other ocean users are described in Section 6.3 of this EA. Hurley (2011) also provides a summary of other ocean users in the southwest Scotian slope area. These may include:
Commercial fishing; Vessel traffic (e.g., commercial shipping, cruise ships, research surveys); Military operations; Offshore oil and gas; Offshore mining; Offshore renewable energy projects; and Subsea pipelines and cables.
At the time of submission of this environmental assessment, there are no existing or planned marine mining operations in the east coast offshore and no marine mining management regime. There are no reasonably foreseeable cable placement projects planned for the Study Area. The Maritime Link transmission project between Cape Breton and Newfoundland is over 400 km away. Similarly, there are no existing proposals for offshore renewable energy projects (such as wave, wind and tidal) in the Study Area. Marine mining, offshore energy and underwater cables will therefore not be considered further. Commercial fishing has been assessed in detail in Section 6.3.1. Commercial fishing activities, by their nature, cause mortality and disturbance to fish populations and may cause incidental mortalities or disturbance to seabirds, marine mammals, and sea turtles. With mitigation measures in place, it is judged that the Project is unlikely to cause mortality to these VECs (with the potential exception of small numbers of petrels) and thus, there will be no or negligible cumulative effects from mortalities. There is some potential for cumulative effects from disturbance (e.g., fishing vessel noise) but in order to avoid collisions or gear entanglements there will be directed attempts by both industries to avoid each other’s active areas and times. As a result of these coordination measures, any residual effects are judged to be not significant. Marine Shipping is described in Section 6.3.2. Shipping traffic is considered to be one of the main anthropogenic drivers of marine ecosystem change (Walmsley and Theriault 2011). The primary ecological interactions related to marine navigation are the potential release of ship-source pollutants and discharges (including oil and ballast water), noise caused by vessels, and vessel interactions with cetaceans (DFO 2008). The Scoping Document required assessment of the cumulative effects of increased vessel presence. Marine Shipping may cause marine mammal or sea turtle mortality, particularly for vessels exceeding 14 knots travel speed. Birds may also strand on ocean-going vessels.

Shelburne Basin 3-D Seismic Survey LGL Limited Environmental Assessment Page 101
With mitigation measures in place, it is judged that the Project is unlikely to cause mortality to these VECs (with the potential exception of small numbers of petrels). Given that volumes of commercial marine traffic through the Project and Study Area are low (Figure 6.18), it is judged that cumulative effects on Species of Special Status from increased vessel traffic as a result of the Project will be negligible.
Military operations are described in Section 6.3.4. The proposed Project will not come into contact with the sea bottom therefore disturbance of unexploded munitions and shipwrecks are not expected to occur. DND will be consulted prior to the commencement of seismic operations to keep seismic operations away from military operations. In addition, there are no reasonably foreseeable DND operations in the Project Area which may include the use of military sonar therefore significant cumulative effects are not anticipated. Offshore oil and gas industry projects listed on the CNSOPB public registry (www.CNSOPB.ns.ca as viewed February 2013) include:
Deep Panuke Gas Development on the Scotian Shelf (EnCana) Husky Energy 2009-2018 Seismic Survey Program for the Sydney Basin Offshore Area
The Deep Panuke Gas Development project is located over 200 km from the Project Area, and the Sydney Basin is located over 400 km from the Project Area. The Project will add to the underwater noise from the offshore petroleum industry over the wider east coast offshore. However, the potential adverse additive effects from additional noise reaching the Study Area (and beyond) from the above projects will be negligible due to their distance and the temporary nature of Project activities. The CNSOPB released the results of Call for Bids NS12-1 on November 16, 2012. The addition of eight new exploration licenses in the Nova Scotia offshore may result in one to three additional seismic programs per year, and one or more exploration wells per year, the latter only likely commencing in 2015. The timing and location of these activities is uncertain although each project will require an environmental assessment, including an assessment of cumulative effects. Seismic programs will require mitigation such as safety zones and ramp-up as set out in the Statement of Canadian Practice with respect to the Mitigation of Seismic Sound in the Marine Environment. Hurley (2011) provides a summary of cumulative effects on various VECs from oil and gas operations and other users off the southwest Scotian Slope. The Project Area is outside any Special Area with existing management designation therefore increased vessel presence from the Project is not expected. As discussed in this EA, negative effects on key sensitive VECs such as marine mammal and turtle Species of Special Status appear unlikely beyond a localized area from the sound source. In addition, all geophysical programs will use mitigation measures such as ramp-ups, delayed startups, and shutdowns of the airgun arrays. Thus, while some animals may receive sound from one or more geophysical programs and possibly from commercial or military vessels transiting through the Project Area, the current judgement is it that any cumulative disturbance will be over a short-term duration of 1-12 months and a geographic extent ranging from 101-1,000 km2 to 1,001-10,000 km2 and that residual effects will be not significant.

Shelburne Basin 3-D Seismic Survey LGL Limited Environmental Assessment Page 102
10.0 Follow-up Program This section describes the monitoring and observation procedures for marine mammals, sea turtles and seabirds as requested in Section 8 of the Scoping Document (Appendix B). An observer report detailing these observations will be submitted to the CNSOPB following completion of each phase of the Project and posted on the CNSOPB public registry. This section also addresses the issue of sharing data collected during monitoring of marine biota.
10.1 Marine Mammals and Sea Turtles 10.1.1 Visual and Acoustic (PAM) Monitoring As noted earlier, two MMOs will be aboard each seismic vessel for the entire duration of the survey. MMOs will visually monitor and advise the appropriate personnel of any occurrences of marine mammals and sea turtles observed within the designated safety zones (i.e. 500 m and 180 dB) of each seismic vessel during all daytime periods when the airgun array is active and during most daylight periods when it is not operating, including the 60-minute pre-ramp up watch. MMO duties will include watching for and identifying marine mammals and sea turtles; recording their numbers, distances and reactions (behaviour) to the seismic operations; initiating mitigation measures when appropriate (see Section 11); and reporting the results. Following the program, copies of the marine mammal, seabird and sea turtle observer reports as well as data collected on stranded birds and during bird surveys will be provided to DFO and Environment Canada. PAM will be used to detect marine mammals during periods of poor visibility (e.g., darkness, fog) and during the 60-minute pre-ramp up watch. One to two dedicated PAM operators will be aboard each seismic vessel that is equipped with PAM and will be tasked with acoustic monitoring. If marine mammal species on Schedule 1 of SARA, as well as all other baleen whales, are detected acoustically during the pre-ramp up watch, ramp up will be delayed (see Section 11). Further details will be provided to the CNSOPB on the PAM system(s) following award of the seismic contract. Following the program, access to PAM data recorded during the survey will be provided to DFO, as long as an archived record is maintained. These data are intended to be used by DFO Science to better inform knowledge of marine mammals in the area.
10.2 Seabirds 10.2.1 Standardized Counts Seabird surveys, i.e., standardized counts, will be conducted throughout the seismic program from the seismic vessels by MMOs/SBOs experienced in the identification of seabirds at sea and in the use of Environment Canada seabird survey protocols. Protocols modified and approved for use from ships at sea by Environment Canada as outlined in the Eastern Canada Seabirds at Sea (ECSAS) Standardized Protocol for Pelagic Seabird Surveys from Moving and Stationary Platforms will be utilized for all seabird counts (Gjerdrum et al. 2012). These protocols will be included as part of observer orientation/training. A schedule of conducting seabird surveys (likely three times per day) at widely spaced intervals will be followed. Surveys can only be conducted when visibility is >300 m and adequate light conditions permit positive species identification.

Shelburne Basin 3-D Seismic Survey LGL Limited Environmental Assessment Page 103
Using the moving platform survey method, each survey will be 10 minutes in length along a transect area 300 m wide. The transect length depends on the speed the vessel maintains during the 10-minute survey period. Note that in previous discussions with CWS, a 10-minute count duration was deemed appropriate for surveying from seismic vessels given the periodic versus continuous nature of the seabird counts (B. Mactavish, LGL Limited, pers. comm., March 2013). Within the 300 m band, all birds on the water will be counted but only flying birds observed during snapshot counts will be included in the count. An instantaneous snapshot count will be taken every time the vessel travels 300 m. From these counts, bird densities can be derived for various species. These densities along with other general observations about seabirds will be included in the monitoring report submitted to the CNSOPB and Environment Canada. In addition, Environment Canada will be provided with “raw” seabird count data. 10.2.2 Monitoring for Stranded Birds A MMO aboard each seismic vessel will routinely patrol the ship for stranded birds each day, typically Leach’s Storm-Petrel, a species prone to stranding on ships operating at night in northwest Atlantic waters. Similarly, designated and trained ship crew, will conduct daily searches for stranded birds aboard the picket and supply vessels. Any stranded birds will be handled and released under a CWS Migratory Bird Handling Permit using protocols developed by the CWS and Petro-Canada (Williams and Chardine, n.d.).
10.3 Benthic Environment Following the program, access to any benthic information collected by Remote Operating Vehicles (ROV) during geotechnical hazard surveying will be provided to DFO. The video information is intended to be used by DFO Science to better inform knowledge of corals, sponges and general benthic characterization.

Shelburne Basin 3-D Seismic Survey LGL Limited Environmental Assessment Page 104
11.0 Assessment Summary As required in Section 11 of the Scoping Document (Appendix B), this section includes a detailed summary of all mitigation measures, commitments and/or follow-up monitoring. Also, included is a summary of effects judgements for Project activities made for each VEC. A tabular summary is presented in Table 11.1 at the end of this section.
11.1 Marine Mammals/Sea Turtles and Airgun Array Noise Shell is committed to the mitigation measures and monitoring requirements as outlined in the Statement of Canadian Practice with Respect to the Mitigation of Seismic Noise in the Marine Environment (i.e., Statement), and in many instances exceeds the minimum requirements outlined in the Statement. The proposed mitigation measures and monitoring commitments are reviewed below. 11.1.1 Ramp Up Prior to the onset of seismic surveying, the airgun array will be gradually ramped up. The smallest airgun will be activated first with the gradual increase of the volume of the array over a minimum 30-minute period. 11.1.2 Line Changes As a result of long line turns (i.e., 5 to 7 hours), all airgun arrays will be shut down during line changes to minimize the amount of noise introduced into the water column. 11.1.3 Selection of a Safety Zone for Shut Downs To minimize the potential for hearing or other damage to marine mammals and sea turtles, seismic operations will be shut down (Section 11.1.5) temporarily if certain species are sighted within a pre-determined “safety” or shutdown zone around each seismic array. The Statement (Section 6a) requires that a proponent “establish a safety zone which is a circle with a radius of at least 500 m as measured from the centre of the air source array(s)”. However, Shell has undertaken an acoustic modelling study of a 5,085 in3 array to assess sound levels from the proposed airgun array and to derive appropriate shutdown zones. The proposed array parameters of the 2013 seismic survey are not anticipated to differ from those described in this EA and as such the 180dB safety zone prescribed as 1,000 m remains valid for the 2013 survey. If array parameters change for the 2013 seismic survey or any future seismic surveys to an extent that requires re-modelling, Shell will update the associated modelling and subsequently modify the safety zone. An expert committee convened by the U.S. National Marine Fisheries Service (NMFS) has studied the issue of marine mammal noise exposure criteria and made some initial scientific recommendations for criteria to be used (Southall et al. 2007). The committee recommended that cetaceans should not be exposed to RLs of 198 dB re 1 μPa2 · s (SEL) or 230 dB re 1 μPa (peak SPL) from pulsed sound in order to avoid PTS. Prior to Southall et al. (2007), the NMFS recommendation was that cetaceans should not be exposed to RLs from pulsed sounds of 180 dB rms in order to avoid TTS. Since the Southall et al. (2007) approach varies from the approach used previously offshore Nova Scotia (and in other Canadian waters), Shell has opted to use the 180 dB rms criterion for defining safety zones for

Shelburne Basin 3-D Seismic Survey LGL Limited Environmental Assessment Page 105
cetaceans and sea turtles listed on Schedule 1 of SARA as well as all other baleen whales and sea turtles. The implementation of a 180 dB rms safety zone for the Project is considered conservative and more protective of cetaceans than the 198 dB re 1 μPa2 · s or 230 dB re 1 μPa (peak) criteria. 11.1.4 Delay of Ramp Up A pre-ramp up visual watch of 30 minutes will be conducted before the start of any airgun operations. If a beaked whale is detected within the safety zone, the duration of the pre-ramp up watch will be increased to 60 minutes. In addition, PAM will be used to monitor for vocalizing marine mammals within the safety zone during this pre-ramp up period. [As noted in Section 10.1.1, PAM will also be used during periods when the full safety zone is not visible and also during other periods the airguns are active to supplement visual observations.] Two safety zones will be used for the Project. Ramp up will be delayed if a marine mammal or sea turtle is detected inside the specified “safety zone” during the monitoring period prior to ramp up. As detailed above, for marine mammal and sea turtle species listed on Schedule 1 of SARA, as well as all other baleen whales and sea turtles, a safety zone based on an area where sound levels from the airgun array are predicted to exceed 180 dB rms will be used. Based on precautionary acoustic modelling of the 5,085 in3 array, this 180 dB rms distance is 1,000 m. For all other marine mammals (cetaceans and pinnipeds), a 500 m safety zone will be implemented for delay of ramp up. If any marine mammal is visually or acoustically detected within the respective safety zone during the pre-ramp up watch period, the ramp-up will be delayed until the animal has been observed outside of the safety zone or 30 has passed since the animal was last detected inside the safety zone. If a beaked whale species is detected within the safety zone during the pre-ramp up watch period, the ramp up will be delayed for 60 minutes or until the animal has been detected outside the safety zone. 11.1.5 Shut Downs Airguns will be shut down if a marine mammal or sea turtle species listed on Schedule 1 of SARA, as well as all other baleen whales and sea turtles, is observed within the 180 dB rms safety zone (1,000 m). Airgun activity will not resume unless the marine mammal or sea turtle has been observed to leave the safety zone or 30 minutes (60 minutes if a Schedule 1 beaked whale is detected within the safety zone) has passed since initial detection. If the species observed within the safety zone is a Schedule 1 beaked whale, airgun activity will not resume unless the animal is observed to leave the safety zone or 60 minutes has passed since initial detection.
11.2 Special Areas and Airgun Array Noise The primary mitigation measure to minimize effects on Special Areas assessed in the EA is spatial avoidance. Although the Roseway Basin Critical Habitat for right whales is located over 41 km and 80 km from the Project Area and 2013 Seismic Activity Area, respectively, there is still potential for disturbance effects on right whales in the Roseway Basin from seismic sound. As an extra precaution, Shell will only acquire data from the extension of the 2013 Seismic Activity Area into EL 2429 within the July to September seasonal window when sound propagation into the Roseway Basin is reduced. As a result of these recognized sensitivities, if seismic data are acquired in later years outside of the 2013 Seismic Activity Area in proximity to the Roseway Basin critical habitat additional mitigation measures will be

Shelburne Basin 3-D Seismic Survey LGL Limited Environmental Assessment Page 106
implemented. These additional measures may include decreasing the airgun array volume (i.e. <5,085 in3) and/or limiting acquisition to later in the seasonal window (i.e., July to September) when sound propagation into shallower shelf waters is reduced.
11.3 Lighting and Stranded Birds Deck lighting will be minimized (especially upward and horizontal-projecting light) to the extent that it is safe and practical to reduce the likelihood of birds stranding on Project vessels. Daily searches of Project vessels will be conducted by trained personnel for stranded birds (as described in Section 10.2.2). Project personnel will be made aware of bird attraction to the lights on offshore structures. However, some degree of lighting is required for safe work practices as seismic surveying is conducted around the clock. Any seabirds (most likely Leach’s Storm-Petrel) that become stranded on a Project vessel will be released using the mitigation methods consistent with The Leach’s Storm-Petrel: General Information and Handling Instructions by U. Williams (Petro-Canada) and J. Chardine (CWS) (n.d.). It is understood by Shell that a CWS Migratory Bird Handling Permit will be required and this will be obtained prior to survey start.
11.4 Fisheries Interactions Shell has initiated engagement with potentially impacted fisheries (see Appendix C) and will continue to share project details as they become available to ensure coordination of activities. Good communication between fishers and seismic surveyors can mitigate the potential for conflict by enabling adjustment (temporal and spatial) of operational activities as appropriate. In addition, multiple (maximum of 5) picket vessels will be sailing in front of the seismic configuration and seismic vessels will be equipped with radar to ensure early identification of any potential conflict during operations. As well, one or more FLO(s) will be supporting the seismic fleet. The FLO(s) will provide dedicated marine radio contact for all fishing vessels in the vicinity of seismic operations to discuss interactions and resolve any problems that may arise at sea. The FLO(s) will inform the vessel's bridge personnel about local fishing activities. In the event that gear is damaged or lost due to contact with the seismic configuration, the compensation claims process will be activated as per the Compensation Guidelines Respecting Damages Relating to Offshore Petroleum Activity (C-NLOPB/CNSOPB 2002) and the Guideline for the Reporting and Investigation of Incidents (C-NLOPB/CNSOPB 2009).
11.5 Interactions with Other Ocean Users To minimize potential effects on other ocean users (i.e., DFO research surveys and DND offshore exercise), the key mitigation is spatial and temporal avoidance which can be achieved with good communication. Both DFO and DND has been made aware of the Project and the location of the proposed 2013 seismic survey by the CNSOPB and Shell’s consultants as part of the environmental assessment process. As the location of future military training operations and details of DFO’s research activities are still being determined, DND and DFO will be consulted prior to the commencement of seismic operations to identify and address potential issues. A Notices to Mariners will also be issued prior to commencement of seismic surveys to advise of the timing and location of survey activities. In addition,

Shelburne Basin 3-D Seismic Survey LGL Limited Environmental Assessment Page 107
multiple (maximum of 5) picket vessels will be sailing in front of the seismic configuration and seismic vessels will be equipped with radar to enable early identification of potential conflict during operations.
11.6 General Ship Operations and Seismic Gear Project vessels will steer a straight course and maintain constant and typically low speed (4.5-5 knots) whenever possible. This minimizes the risk of vessel collisions with marine mammals and sea turtles. In addition, picket vessels sailing ahead of the seismic fleet will watch for marine mammals and sea turtles. Passive acoustic monitoring (PAM) will also be conducted at nighttime and during periods of poor visibility to further minimize the risk of vessel collisions with marine mammals. To reduce the potential of sea turtles becoming entangled in towed seismic gear, turtle guards (Ketos Ecology 2009) will be deployed on tail buoys. Tail buoys will also be equipped with radar reflectors to permit easier detection by marine traffic. In response to a vessel collision with a marine mammal or sea turtle, as requested by DFO, Shell will contact the Marine Animal Response Society (MARS) hotline or the Coast Guard to relay the information. Vessel staff will provide any photographs or documentation in regards to the noted incident. Shell also commits to reporting any observed entanglements or dead marine species noted during the survey (H. Moors-Murphy, DFO, pers. comm., 2013).
11.7 Vessel Wastes and Air Emissions Grey and black water, bilge water, deck drainage, discharges from machinery spaces and hazardous and non-hazardous waste material will be managed in accordance with MARPOL and Shell’s waste management plan. The contracted vessels’ policies and procedures will be reviewed against the Shell Plan. A licensed waste contractor will be used for any waste returned to shore. Vessels will adhere to MARPOL Annex VI, Regulations for the Prevention of Air Pollution from Ships.
11.8 Malfunctions and Accidental Events Preventative measures and plans will be in place to avoid any fuel spillage or other accidental events during the seismic program. Plans and measures include: spill prevention plans and ship-board pollution prevention plans, crew training, proper handling and storage requirements, secondary containment and adherence to the safety management procedures including proper bunkering procedures. Project vessels will be equipped with spill kits as appropriate. In the unlikely event of the accidental release of hydrocarbons during the Project, Shell and its seismic and geohazard survey contractor(s) will implement the measures outlined in its spill response plan which will be filed with the CNSOPB in support of the Geophysical Work Authorization application. In addition, Shell will have emergency response plans in place for the Project and these will be bridged with the seismic (and geohazard) contractor’s response plans prior to commencement of the seismic program. In the event, project equipment or accidental spills of fuel or streamer flotation fluid occur, a report will immediately be filed with CNSOPB and the need for follow-up monitoring assessed.

Shelburne Basin 3-D Seismic Survey LGL Limited Environmental Assessment Page 108
11.9 Residual Effects of the Project A summary of the residual effects of Project activities on the environment are shown in Table 11.1. With mitigation measures in place, Project activities are judged to have no significant residual effects on VECs.

Shelburne Basin 3-D Seismic Survey LGL Limited Environmental Assessment Page 109
Table 11.1 Summary of Potential Interactions, Mitigations, Significance Criteria Ratings, Significance Ratings and Levels of Confidence Associated with the Proposed Project.
VEC/Interaction Potential Effects Primary Mitigations Effect Criteria and Ratings Judged
Significance Rating
Level of Confidence in
Judgement Magnitude Duration Geographic
Extent Species of Special Status
Whales/Sea Turtles x Airgun Noise Hearing impairment Disturbance
Delay start-up if marine mammals or sea turtles are detected within specified safety zone (500 m and 180 dB modeled zone) Ramp-up of airguns over 30 min-period Shut down airguns during line changes(line turns) Shutdown of airgun arrays for SARA listed marine mammals and sea turtles as well as all baleen whales and sea turtles within 180 dB modeled shut-down zone Use of qualified MMO(s) on each seismic vessel to monitor for marine mammals and sea turtles during daylight seismic operations Use of PAM during periods of poor visibility Avoid spatial overlap with critical habitat Further noise modelling on chosen seismic airgun array, if required. Acquire data from the extension of the 2013 Seismic Activity Area into EL 2429 during the July to September seasonal window when sound propagation into the Roseway Basin is reduced.
Negligible to Minor
Minor to Moderate
<1 month to 1-12 months
<1 month to 1-12 months
<1 km2 to 1-10 km2
101-1,000 km2 to 1,001-
10,000 km2
NS
NS
High
Medium

Shelburne Basin 3-D Seismic Survey LGL Limited Environmental Assessment Page 110
VEC/Interaction Potential Effects Primary Mitigations Effect Criteria and Ratings Judged
Significance Rating
Level of Confidence in
Judgement Magnitude Duration Geographic
Extent Additional mitigation in the event seismic is acquired in proximity to the Roseway Basin in future years. Compliance with Statement of Canadian Practice with Respect to the Mitigation of Seismic Noise in the Marine Environment Further Noise Modelling Modification of Project Area in consideration of the Roseway Basin Critical Habitat.
Wolffishes/White Shark x Airgun Noise Subtle behavioural effects
Ramp-up of airguns over 30 min-period
Negligible <1 month <1 km2 NS High
Whales/Sea Turtles x Vessel Presence Injury or mortality due to collision
Vessels to maintain constant course and speed Monitoring by MMOs and picket vessel crew Use of PAM during periods of poor visibility
Negligible to Minor
<1 month to 1-12 months
1-10 km2 NS High
Sea turtles x Seismic Gear Injury or mortality due to entanglement
Use of turtle guards on buoys Negligible To Minor
<1 month to 1-12 months
1-10 km2 NS High
Roseate Tern/Red Knot x Vessel Lights Injury or mortality due to stranding
Daily monitoring of vessels by trained personnel Handling and release protocols and permit Minimize lighting if safe
Negligible to Minor
1-12 months
11-100 km2 NS High
Migratory Birds x Vessel Lights Injury or mortality due to stranding
Daily monitoring of vessels by trained personnel Handling and release protocols and permit Minimize lighting if safe
Negligible to Minor
1-12 months
11-100 km2 NS High
Special Areas Roseway Basin Right Whale Critical
Habitat x Airgun Noise Hearing impairment
Delay start-up if marine mammals are detected within specified safety zone (500 m
Negligible
<1 month to 1-12 months
<1 km2 to 1-10 km2
NS
High
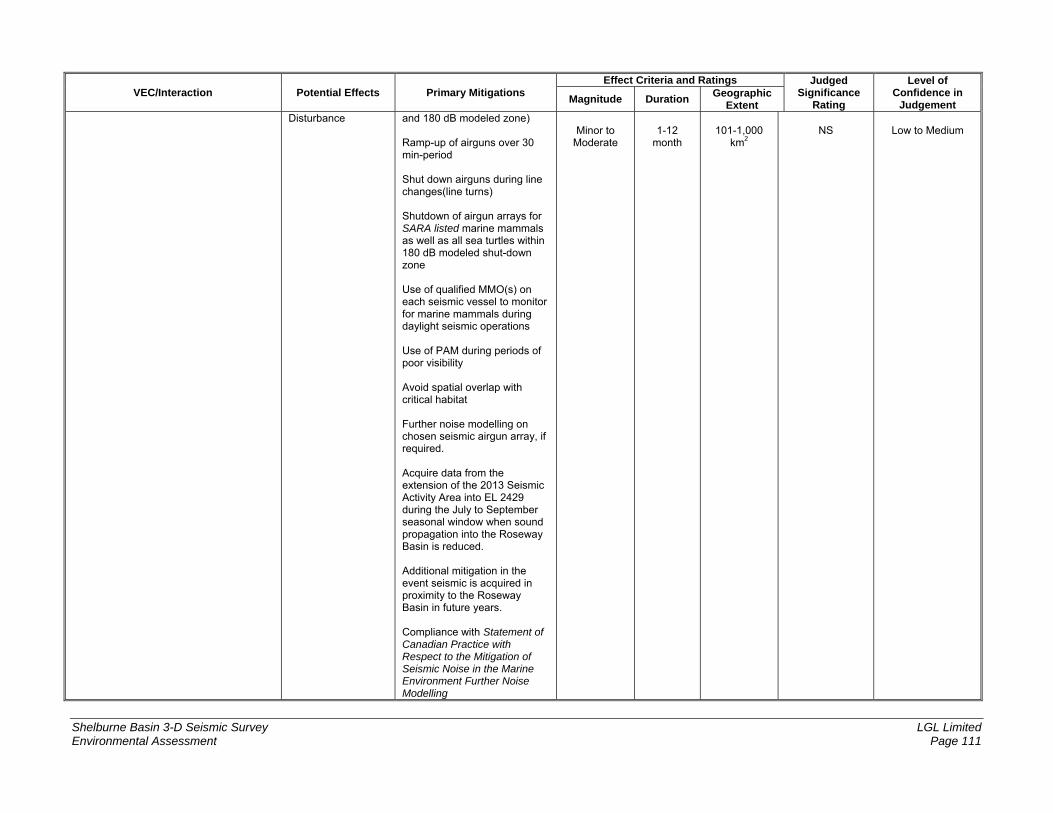
Shelburne Basin 3-D Seismic Survey LGL Limited Environmental Assessment Page 111
VEC/Interaction Potential Effects Primary Mitigations Effect Criteria and Ratings Judged
Significance Rating
Level of Confidence in
Judgement Magnitude Duration Geographic
Extent Disturbance and 180 dB modeled zone)
Ramp-up of airguns over 30 min-period Shut down airguns during line changes(line turns) Shutdown of airgun arrays for SARA listed marine mammals as well as all sea turtles within 180 dB modeled shut-down zone Use of qualified MMO(s) on each seismic vessel to monitor for marine mammals during daylight seismic operations Use of PAM during periods of poor visibility Avoid spatial overlap with critical habitat Further noise modelling on chosen seismic airgun array, if required. Acquire data from the extension of the 2013 Seismic Activity Area into EL 2429 during the July to September seasonal window when sound propagation into the Roseway Basin is reduced. Additional mitigation in the event seismic is acquired in proximity to the Roseway Basin in future years. Compliance with Statement of Canadian Practice with Respect to the Mitigation of Seismic Noise in the Marine Environment Further Noise Modelling
Minor to
Moderate
1-12
month
101-1,000
km2
NS
Low to Medium

Shelburne Basin 3-D Seismic Survey LGL Limited Environmental Assessment Page 112
VEC/Interaction Potential Effects Primary Mitigations Effect Criteria and Ratings Judged
Significance Rating
Level of Confidence in
Judgement Magnitude Duration Geographic
Extent Modification of Project Area in consideration of the Roseway Basin Critical Habitat.
Roseway Basin Right Whale Critical Habitat x Vessel Presence
Injury or mortality due to collision
Vessels to maintain constant course and speed Monitoring by MMOs and picket vessel crew Use of PAM during periods of poor visibility
Negligible <1 month 1-10 km2 NS High
Haddock Box x Airgun Noise Subtle behavioural effects
Ramp-up of airguns over 30 min-period
Negligible to Minor
<1 month 101-1,000 km2
NS High
Scotian Slope/Shelf Break EBSA x Airgun Noise
Marine mammal and sea turtle hearing impairment and/or disturbance Subtle invertebrate and fish behavioural effects
Delay start-up if marine mammals or sea turtles are detected within specified safety zone (500 m and 180 dB modeled zone) Ramp-up of airguns over 30 min-period Shut down airguns during line changes(line turns) Shutdown of airgun arrays for SARA listed marine mammals and sea turtles as well as all baleen whales and sea turtles within 180 dB modeled shut-down zone Use of qualified MMO(s) on each seismic vessel to monitor for marine mammals and sea turtles during daylight seismic operations Use of PAM during periods of poor visibility Avoid spatial overlap with critical habitat Further noise modelling on chosen seismic airgun array, if required.
Minor to Moderate
1-12 months
1,001-10,000 km2
NS High
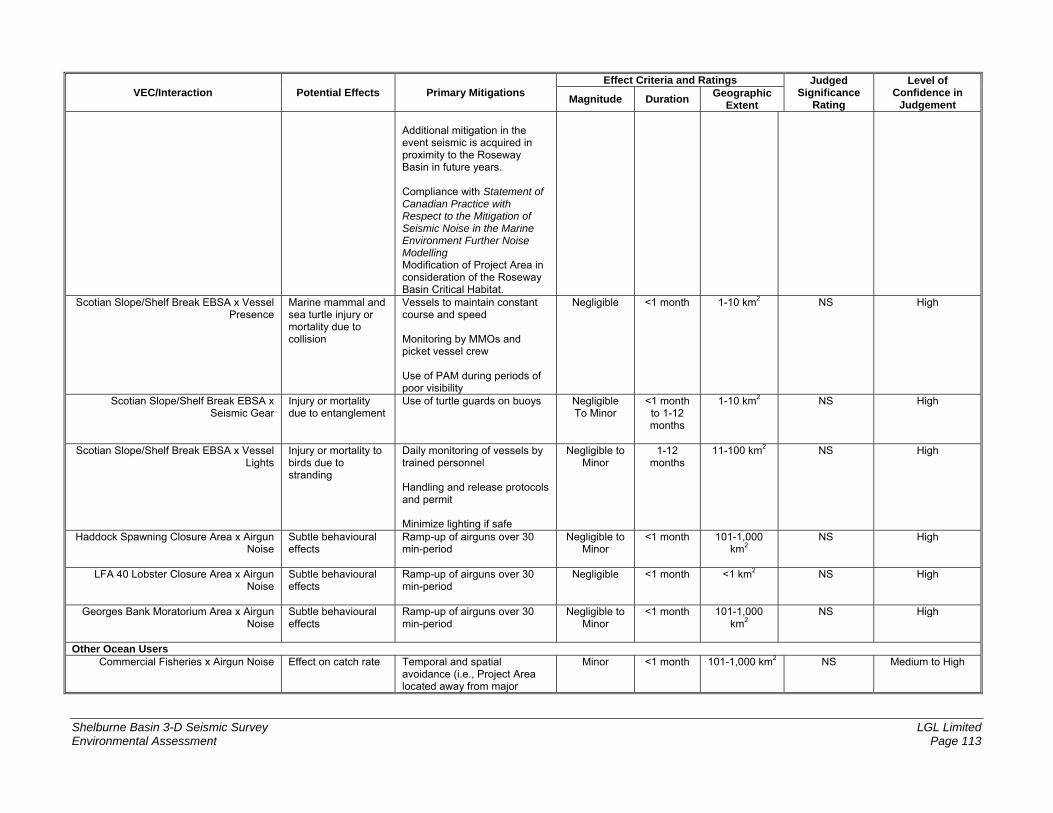
Shelburne Basin 3-D Seismic Survey LGL Limited Environmental Assessment Page 113
VEC/Interaction Potential Effects Primary Mitigations Effect Criteria and Ratings Judged
Significance Rating
Level of Confidence in
Judgement Magnitude Duration Geographic
Extent Additional mitigation in the event seismic is acquired in proximity to the Roseway Basin in future years. Compliance with Statement of Canadian Practice with Respect to the Mitigation of Seismic Noise in the Marine Environment Further Noise Modelling Modification of Project Area in consideration of the Roseway Basin Critical Habitat.
Scotian Slope/Shelf Break EBSA x Vessel Presence
Marine mammal and sea turtle injury or mortality due to collision
Vessels to maintain constant course and speed Monitoring by MMOs and picket vessel crew Use of PAM during periods of poor visibility
Negligible <1 month 1-10 km2 NS High
Scotian Slope/Shelf Break EBSA x Seismic Gear
Injury or mortality due to entanglement
Use of turtle guards on buoys Negligible To Minor
<1 month to 1-12 months
1-10 km2 NS High
Scotian Slope/Shelf Break EBSA x Vessel Lights
Injury or mortality to birds due to stranding
Daily monitoring of vessels by trained personnel Handling and release protocols and permit Minimize lighting if safe
Negligible to Minor
1-12 months
11-100 km2 NS High
Haddock Spawning Closure Area x Airgun Noise
Subtle behavioural effects
Ramp-up of airguns over 30 min-period
Negligible to Minor
<1 month 101-1,000 km2
NS High
LFA 40 Lobster Closure Area x Airgun Noise
Subtle behavioural effects
Ramp-up of airguns over 30 min-period
Negligible <1 month <1 km2 NS High
Georges Bank Moratorium Area x Airgun Noise
Subtle behavioural effects
Ramp-up of airguns over 30 min-period
Negligible to Minor
<1 month 101-1,000 km2
NS High
Other Ocean Users Commercial Fisheries x Airgun Noise Effect on catch rate Temporal and spatial
avoidance (i.e., Project Area located away from major
Minor <1 month 101-1,000 km2 NS Medium to High
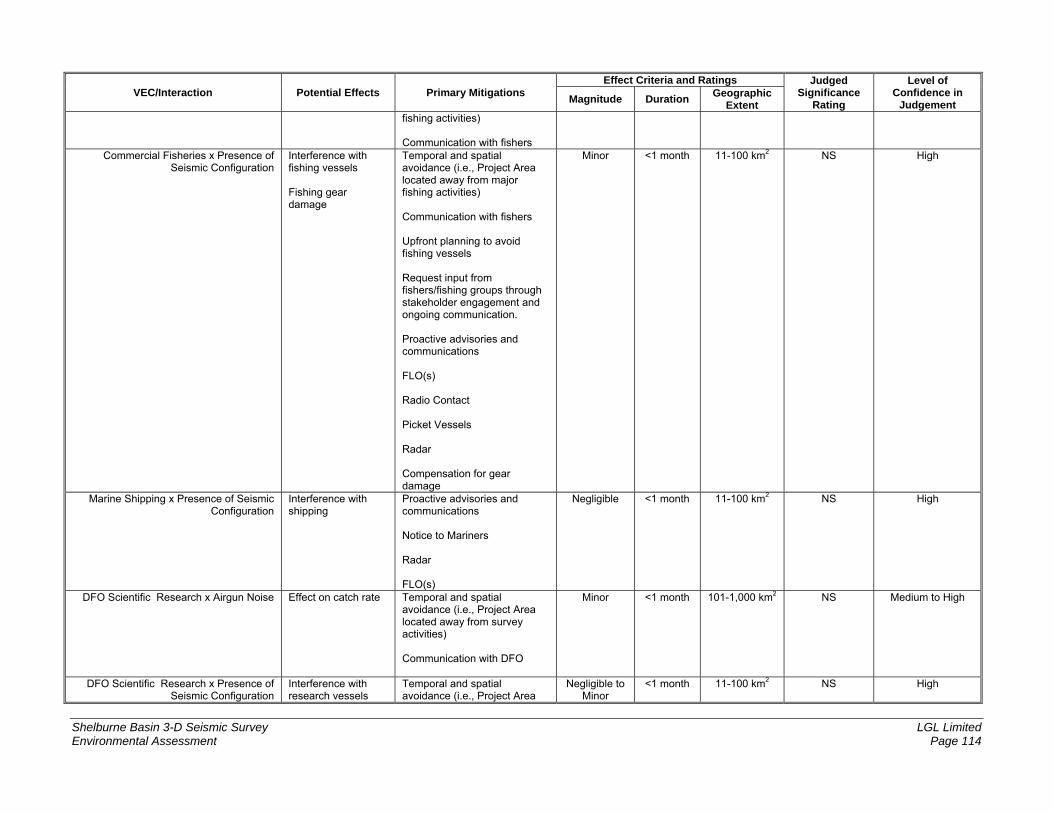
Shelburne Basin 3-D Seismic Survey LGL Limited Environmental Assessment Page 114
VEC/Interaction Potential Effects Primary Mitigations Effect Criteria and Ratings Judged
Significance Rating
Level of Confidence in
Judgement Magnitude Duration Geographic
Extent fishing activities) Communication with fishers
Commercial Fisheries x Presence of Seismic Configuration
Interference with fishing vessels Fishing gear damage
Temporal and spatial avoidance (i.e., Project Area located away from major fishing activities) Communication with fishers Upfront planning to avoid fishing vessels Request input from fishers/fishing groups through stakeholder engagement and ongoing communication. Proactive advisories and communications FLO(s) Radio Contact Picket Vessels Radar Compensation for gear damage
Minor <1 month 11-100 km2 NS High
Marine Shipping x Presence of Seismic Configuration
Interference with shipping
Proactive advisories and communications Notice to Mariners Radar FLO(s)
Negligible <1 month 11-100 km2 NS High
DFO Scientific Research x Airgun Noise Effect on catch rate Temporal and spatial avoidance (i.e., Project Area located away from survey activities) Communication with DFO
Minor <1 month 101-1,000 km2 NS Medium to High
DFO Scientific Research x Presence of Seismic Configuration
Interference with research vessels
Temporal and spatial avoidance (i.e., Project Area
Negligible to Minor
<1 month 11-100 km2 NS High

Shelburne Basin 3-D Seismic Survey LGL Limited Environmental Assessment Page 115
VEC/Interaction Potential Effects Primary Mitigations Effect Criteria and Ratings Judged
Significance Rating
Level of Confidence in
Judgement Magnitude Duration Geographic
Extent and equipment located away from
survey/research activities) Communications and scheduling Notice to Mariners Upfront planning to avoid research vessels Proactive advisories and communications Radio Contact Picket Vessels Radar
DND Operations x Presence of Seismic Configuration
Interference with DND operations
Communications and scheduling Notice to Mariners
Negligible <1 month 11-100 km2 NS High
All VECs x Atmospheric Emissions Contamination Adhere to MARPOL Annex VI, Regulations for the Prevention of Air Pollution from Ships
Negligible <1 month to 1-12 months
<1 km2 NS High
All VECs x Malfunctions and Accidental Events
Contamination Preventative Measures and Plans Adherence to MARPOLVisual monitoring while bunkering Spill contingency plans Emergency response plans Use of solid streamer when feasible
Negligible to Minor
<1 month to 1-12 months
<1 km2 to 1-10 km2
NS High
All VECs x Waste Contamination Adherence to MARPOL Negligible <1 month to 1-12 months
<1 km2 NS High
Cumulative Effects
Injury or mortality to Species of Special Status and Special Areas due to hearing impairment, disturbance,
All mitigation measures listed in this table
Minor to Moderate
1 month to 1-12
months
101-1,000 km2 to 1,001-
10,000 km2
NS Medium to High

Shelburne Basin 3-D Seismic Survey LGL Limited Environmental Assessment Page 116
VEC/Interaction Potential Effects Primary Mitigations Effect Criteria and Ratings Judged
Significance Rating
Level of Confidence in
Judgement Magnitude Duration Geographic
Extent stranding or collision Interference with Other Users Fishing gear damage Contamination

Shelburne Basin 3-D Seismic Survey LGL Limited Environmental Assessment Page 117
12.0 Literature Cited
Abgrall, P., B.D. Mactavish, and V.D. Moulton. 2008. Marine Mammal and Seabird Monitoring of Orphan Basin Controlled Source Electromagnetic Survey Program, 2006-2007. LGL Rep. SA904/939. Rep. by LGL Limited, St. John's, NL, for ExxonMobil Canada Ltd., St. John's, NL. 96 p. + appendices.
Aerts, L., M. Blees, S. Blackwell, C. Greene, K. Kim, D. Hannay, and M. Austin. 2008. Marine Mammal Monitoring and Mitigation during BP Liberty OBC Seismic Survey in Foggy Island Bay, Beaufort Sea, July-August 2008: 90-Day Report. LGL Rep. P1011-1. Rep. by LGL Alaska Research Associates Inc., LGL Limited, Greeneridge Sciences Inc., and JASCO Applied Sciences, for BP Exploration Alaska.
Allen, K.R. 1971. A preliminary assessment of Fin Whale stocks off the Canadian Atlantic coast. Report of the International Whaling Commission, 21: 64-66.
ALTRT (Atlantic Leatherback Turtle Recovery Team). 2006. Recovery Strategy for Leatherback Turtle (Dermochelys coriacea) in Atlantic Canada. Species at Risk Act Recovery Strategy Series. Fisheries and Oceans Canada, Ottawa. vi + 45 p.
Amoser, S. and F. Ladich. 2005. Are hearing sensitivities of freshwater fish adapted to the ambient noise in their habitats? J. Exp. Biol., 208: 3533-3542.
Baird, P.H. 1994. Black-legged Kittiwake (Rissa tridactyla). In: A Poole and F. Gill (eds.). The birds of North America, No. 92. National Academy of Sciences, Philadelphia, PA. 28 p.
Baumgartner, M.F. and B.R. Mate. 2003. Summertime foraging ecology of North Atlantic Right Whales. Marine Ecological Progress Series, 264: 123-135.
Baumgartner, M.F., T.V.N. Cole, P.J. Clapham, and B.R. Mate. 2003. North Atlantic Right Whale habitat in the lower Bay of Fundy and on the SW Scotian Shelf during 1999–2001. Marine Ecology Progress Series, 264: 137-154.
Birchard, E. and R. Nancarrow. 1986. The Minuk I-53 Artificial Island oil spill. Pp. 375-378 In: Proceedings of the ninth Arctic marine oil spill program technical seminar, June 10-12, 1986, Edmonton, AB. Environment Canada, Conservation and Protection, Ottawa, ON.
Black, A. 2005. Light induced seabird mortality on vessels operating in the Southern Ocean: Incidents and mitigation measures. Antarctic Science, 17: 67-68.
Breeze, H., D.G. Fenton, R.J. Rutherford, and M.S. Silva. 2002. The Scotian Shelf: an ecological overview for ocean planning. Can. Tech. Rep. Fish. Aquat. Sci., 2293. 259 p.
Brown M.W., S. Brault, P.K. Hamilton, R.D. Kenney, A.R. Knowlton, M.K. Marx, C.A. Mayo, C.K. Slay, and S.D. Kraus. 2001. Sighting heterogeneity of Right Whales in the western North Atlantic: 1980-1992. Journal of Cetacean Research and Management, (Special Issue 2): 245-250.
Brown, M.W., D. Fenton, K. Smedbol, C. Merriman, K. Robichaud-Leblanc, and J.D. Conway. 2009. Recovery Strategy for the North Atlantic Right Whale (Eubalaena glacialis) in Atlantic Canadian Waters [Final]. Species at Risk Act Recovery Strategy Series, Fisheries and Oceans Canada. vi + 66 p.
Brown, M.W., J.M. Allen, and S.D. Kraus. 1995. The designation of seasonal Right Whale North Atlantic Right Whale conservation areas in the waters of Atlantic Canada. Pp. 90–98 In: N.L. Shackell and J.H.M. Willison (eds.). Marine protected areas and sustainable fisheries. Proceedings of the symposium on marine protected areas and sustainable fisheries conducted at the Second International Conference on Science and the Management of Protected Areas, held at Dalhousie University, Halifax, Nova Scotia, Canada, 16–20 May 1994. Science and Management of Protected Areas Association, Wolfville, Nova Scotia.
Brown, R.G.B. 1986. Revised atlas of Eastern Canadian seabirds. 1. Shipboard surveys. Bedford Institute of Oceanography and Canadian Wildlife Service, Dartmouth, NS, and Ottawa, ON.
Caldwell, J. and W. Dragoset. 2000. A brief overview of seismic air-gun arrays. Leading Edge, 19(8): 898-902.
Campbell, L.H., K.T. Standring, and C.J. Cadbury. 1978. Firth of Forth oil pollution incident, February 1978. Mar. Poll. Bull., 9: 335-339.

Shelburne Basin 3-D Seismic Survey LGL Limited Environmental Assessment Page 118
Campbell-Malone, R., S.G. Barco, P.-Y. Daoust, A.R. Knowlton, W.A. McLellan, D.S. Rotstein, and M.J. Moore. 2008. Gross and histologic evidence of sharp and blunt trauma in North Atlantic Right Whales (Eubalaena glacialis) killed by vessels. J. Zoo Wild. Med., 39(1): 37-55.
CEA Agency. 2000. Preparing project descriptions under the Canadian Environmental Assessment Act. Canadian Environmental Assessment Agency Operational Policy Statement OPS-EPO/5-2000. 6p.
CETAP. 1982. A characterization of marine mammals and turtles in the mid- and North Atlantic areas of the U.S. outer continental shelf, final report, Cetacean and Turtle Assessment Program, University of Rhode Island.
Clark, C.W., W.T. Ellison, B.L. Southall, L. Hatch, S.M. Van Parijs, A. Frankel, and D. Ponirakis. 2009. Acoustic masking in marine ecosystems: intuitions, analysis, and implication. Mar. Ecol. Prog. Ser., 395: 201-222.
Clarke, T.C.R., A.W. Diamond, and J.W. Chardine. 2010. Origin of Canadian Razobills (Alca torda) wintering in the outer Bay of Fundy confirmed by radio-tracking. Waterbirds, 33(4): 541-545.
C-NLOPB/CNSOPB. 2002. Compensation guidelines respecting damages relating to offshore petroleum activity. 15 p.
C-NLOPB/CNSOPB. 2009. Guideline for the reporting and investigation of incidents. 27 p.
CNSOPB. 2011. Canada-Nova Scotia Benefits Plan Guidelines. Halifax, N.S.
CNSOPB. 2012. Shell Canada Ltd. Shelburne Basin 3-D seismic survey for exploration licences 2423, 2424, 2425, and 2426 – Scoping document for the environmental assessment. 8 p.
Collins, M.D., R.J. Cederberg, D.B. King, and S.A. Chin-Bing. 1996. Comparison of algorithms for solving parabolic wave equations. J. Acoust. Soc. Am., 100: 178-182.
COSEWIC (Committee on the Status of Endangered Wildlife in Canada). 2002a. COSEWIC assessment and update status report on the Blue Whale Balaenoptera musculus in Canada. Committee on the Status of Endangered Wildlife in Canada, Ottawa, ON. vi + 32 p.
COSEWIC. 2002b. Canadian Species at Risk, May 2002. Committee on the status of endangered wildlife in Canada. 23 p.
COSEWIC. 2003. COSEWIC assessment and update status report on the North Atlantic Right Whale Eubalaena glacialis in Canada. Committee on the Status of Endangered Wildlife in Canada. Ottawa. vii + 28 p.
COSEWIC. 2005. COSEWIC assessment and update status report on the Fin Whale Balaenoptera physalus in Canada. Committee on the Status of Endangered Wildlife in Canada. Ottawa. ix + 37 p.
COSEWIC. 2006a. COSEWIC assessment and update status report on the Sowerby's Beaked Whale Mesoplodon bidens in Canada. Committee on the Status of Endangered Wildlife in Canada. Ottawa. vi + 20 p.
COSEWIC. 2006b. COSEWIC assessment and status report on the White Shark Carcharodon carcharias (Atlantic and Pacific populations) in Canada. Committee on the Status of Endangered Wildlife in Canada. Ottawa. vii + 31 p. Available at http://www.sararegistry.gc.ca/status/status_e.cfm.
COSEWIC. 2007. COSEWIC assessment and status report on the Red Knot Calidris canutus in Canada. Committee on the Status of Endangered Wildlife in Canada. vii + 58 p. Available at http://www.sararegistry.gc.ca/status/status_e.cfm.
COSEWIC. 2011. COSEWIC assessment and status report on the Northern Bottlenose Whale Hyperoodon ampullatus in Canada. Committee on the Status of Endangered Wildlife in Canada. xii + 31 p.
COSEWIC. 2012. COSEWIC annual report, 2011-2012. 39 p. Available at http://www.sararegistry.gc.ca/virtual_sara/files/cosewic/car_rapport_cos_report_1012_e.pdf.
Davis, R.A., D. Thomson, and C.I. Malme. 1998. Environmental assessment of seismic exploration of the Scotian Shelf. Rep. by LGL Ltd., King City, ON, and Charles I. Malme, Engineering and Scientific Services, Hingham, MA, for Mobil Oil Canada Properties Ltd., Shell Canada Ltd., and Imperial Oil Ltd.
DFO (Department of Fisheries and Oceans Canada). 2002. Monkfish on the Scotian Shelf and Northeast Georges Bank (4VWX and 5Zc). DFO Sci. Stock Status Report A3-30(2002).
DFO. 2008. The Gully marine protected area management plan. Oceans and Habitat Branch, DFO, Maritimes Region. Dartmouth, NS.

Shelburne Basin 3-D Seismic Survey LGL Limited Environmental Assessment Page 119
DFO. 2009. Recovery Strategy for the Blue Whale (Balaenoptera musculus), Northwest Atlantic population, in Canada [PROPOSED]. Ottawa. Species at Risk Act Recovery Strategy Series. Fisheries and Oceans Canada. 62 p.
DFO. 2010. Silver Hake on the Scotian Shelf (Divisions 4VWX). DFO Can. Sci. Advis. Sec. Sci. Advis. Rep. 2010/007.
DFO. 2011a. Zonal advisory process for the pre-COSEWIC assessment of Atlantic, Northern and Spotted Wolffish; September 14-15, 2010. DFO Can. Sci. Advis. Sec. Proceed. Ser. 2011/032.
DFO. 2011b. The marine environment and fisheries of Georges Bank, Nova Scotia: Consideration of the potential interactions associated with offshore petroleum activities. Can. Tech. Rep. Fish. Aquat. Sci., 2945: xxxv + 492p.
DFO. 2011c. The Scotian Shelf in context: The state of the Scotian Shelf report. Oceans and Coastal Management Division, DFO, Maritimes Region. Dartmouth NS.
DFO. 2011d. UnderwaterWorld: Redfish (Ocean Perch). Available at: http://www.dfo-mpo.gc.ca/Science/publications/uww-msm/articles/redfish-sebaste-eng.htm.
Dodge, K.L., Logan, J.M., and M.E. Lutcavage. 2011. Foraging ecology of leatherback sea turtles in the Western North Atlantic determined through multi-tissue stable isotope analyses. Marine Biology 158:2813-2824.
Doherty, P. and T. Horsman. 2007. Ecologically and biologically significant areas of the Scotian Shelf and environs: A compilation of scientific expert opinion. Can. Tech. Rep. Fish. Aquat. Sci., 2774: xii + 57 p.
Dooling, R.J. and S.C. Therrien. 2012. Hearing in birds: What changes from air to water. Pp. 77-82 In: A.N. Popper and A. Hawkins (eds.). The effects of noise on aquatic life. Springer, NY.
Dutton, P.H., B.W. Bowen, D.W. Owens, A. Barragan, and S.K. Davis. 1999. Global phylogeography of the Leatherback Turtle (Dermochelys coriacea). J. Zool. 248: 397-409.
Engelhardt, F.R. 1983. Petroleum effects on marine mammals. Aquatic Toxicology, 4: 199-217.
Engelhardt, F.R. (ed.). 1985. Petroleum effects in the Arctic environment. Elsevier, London. 281 p.
Environment Canada. 2010. Amended Recovery Strategy for the Roseate Tern (Sterna dougallii) in Canada. Species at Risk Act Recovery Strategy Series. Environment Canada. Ottawa. vii + 36 p.
Environment Canada. 2012a. Canadian marine forecast area statistics. Canadian Hurricane Centre. Available at http://www.ec.gc.ca/Hurricane.
Environment Canada. 2012b. Yearly storm frequency. Canadian Hurricane Centre. Available at http://www.ec.gc.ca/Hurricane.
Everaert, J. and E.W.M. Stienen. 2007. Impact of wind turbines on birds in Zeebrugge, Belgium: Significant effect on breeding tern colony due to collisions. Biodiveristy and Conservation, 16: 3345-3359.
Frank, K.T., N.L. Shackell, and J.E. Simon. 2000. An evaluation of the Emerald/Western Bank juvenile haddock closed area. Ices J. Mar. Sci., 57, 1023-1034.
Funk, D., D. Hannay, D. Ireland, R. Rodrigues, and W. Koski (eds.). 2008. Marine Mammal Monitoring and Mitigation during Open Water Seismic Exploration by Shell Offshore Inc. in the Chukchi and Beaufort Seas, July–November 2007: 90-Day Report. LGL Rep. P969-1. Rep. LGL Alaska Research Associates Inc., LGL Limited, and JASCO Research Limited, for Shell Offshore Inc., National Marine Fisheries Service (US), and US Fish and Wildlife Service. Available at http://www-static.shell.com/static/usa/downloads/alaska/shell2007_90-d_final.pdf.
Gauthreaux, S.A., Jr. and C.G. Belser. 2006. Effects of artificial night lighting on migrating birds. Pp. 67-93 In: C. Rich and T. Longcore (eds.). Ecological Consequences of Artificial Night Lighting. Island Press, Washington, D.C. 478 p.
Gearing, P.J. and J.N. Gearing. 1982. Behaviour and fate of No. 2 fuel oil in the water column of controlled ecosystems. Mar. Envir. Res., 6: 115-132.
Gjerdrum, C., D.A. Fifield, and S.I. Wilhelm. 2012. Eastern Canadian Seabirds at Sea (ECSAS) standardized protocol for pelagic seabird surveys from moving and stationary platforms. Canadian Wildlife Service Technical Report Series No. 515, Atlantic Region. vi + 38 p.

Shelburne Basin 3-D Seismic Survey LGL Limited Environmental Assessment Page 120
Glass, A.H., T.V.N. Cole, M. Garron, R.L. Merrick, and R.M. Pace III. 2008. Mortality and serious injury determinations for baleen whale stocks along the United States eastern seaboard and adjacent Canadian Maritimes, 2002-2006. Northeast Fisheries Science Center Reference Document 08-04. US Department of Commerce, NOAA Technical Memorandum. 18 p.
Gochfeld, M., J. Burger, and I.C.T. Nisbet. 1998. Roseate Tern (Sterna dougallii). In: A. Poole and F. Gill (eds.). The Birds of North America, No. 370. The Birds of North America, Inc. Philadelphia, PA.
Goold, J.C. and P.J. Fish. 1998. Broadband spectra of seismic survey air-gun emissions, with reference to dolphin auditory thresholds. J. Acoust. Soc. Am., 103(4): 2177-2184.
Gowans, S.H. Whitehead, J.K. Arch, and S. Hooker. 2000. Population size and residency patterns of Northern Bottlenose Whales (Hyperoodon ampullatus) using The Gully, Nova Scotia. J. Cetacean Res. Manage., 2(3): 201-210.
Galuardi, B., F. Royer, W. Golet, J. Logan, J. Neilson and M. Lutcavage. 2010. Complex migrations routes of Atlantic bluefin tuna (Thunnus thynnus) question current population structure paradigm. Can. J. Fish. Aquat. Sci. 67: 966-976.
Hammond, P.S., R. Sears, and M. Bérubé. 1990. A note on problems in estimating the number of Blue Whales in the Gulf of St Lawrence from photo-identification data. Rep. Int. Whal. Comm., Special Issue 12: 141-142.
Hanke, A.R., I. Andrushchenko, and G. Croft. 2012. Observer coverage of the Atlantic Canadian Swordfish and other Tuna longline fishery: An assessment of current practices and alternative methods. DFO Can. Sci. Advis. Sec. Res. Doc. 2012/049. iii + 84 p.
Harrington, B.A. 2001. Red Knot. In: A. Poole and F. Gill (eds.). The birds of North America, No. 367. National Academy of Sciences, Philadelphia, PA. 32 p.
Hatch, J.J. 2002. Arctic Tern (Sterna paradise). In: A. Poole and F. Gill (eds.). The birds of North America, No. 707. The Birds of North America Inc., Philadelphia, PA.
Hauser, D.D.W., M Holst, and V.M. Moulton. 2008. Marine mammal and sea turtle monitoring during Lamont-Doherty Earth Observatory’s marine seismic program in the Eastern Tropical Pacific, April – August 2008. LGL Rep. TA4656/7-1. Rep. by LGL Ltd., St. John’s, NL, for Lamont-Doherty Earth Observatory of Columbia Univ., Palisades, NY, and Nat. Mar. Fish. Serv., Silver Spring, MD. 98 p.
Hazel, J., I.R. Lawler, H. Marsh, and S. Robson. 2007. Vessel speed increases collision risk for the green turtle Chelonia mydas. Endang. Species Res., 3: 105-113.
Hebron. 2011. Hebron project, comprehensive study report, September 2011. Available at http://www.cnlopb.nl.ca/environment/hebroncsren.shtml.
Hegmann, G., C. Cocklin, R. Creasey, S. Dupuis, A. Kennedy, L. Kingsley, W. Ross, H. Spaling, and D. Stalker. 1999. Cumulative effects assessment practitioners guide. Prepared by AXYS Environmental Consulting Ltd. and the CEA Working Group for the Canadian Environmental Assessment Agency, Hull, Quebec.
Hjermann, D.Ø., A. Melsom, G.E. Dingsør, J.M. Durant, A.M. Eikeset, L.P. Røed, G. Ottersen, G. Storvik, and N.C. Stenseth. 2007. Fish and oil in the Lofoten-Barents sea system: Synoptic review of the effet of oil spills on fish populations. Mar. Ecol. Prog. Ser., 339: 283-299.
Holst, M. and M.A. Smultea. 2008. Marine mammal and sea turtle monitoring during Lamont-Doherty Earth Observatory’s marine seismic program off Central America, February – April 2008. LGL Rep. TA4342-3. Rep. by LGL Ltd., King City, ON, for Lamont-Doherty Earth Observatory of Columbia Univ., Palisades, NY, and Nat. Mar. Fish. Serv., Silver Spring, MD. 133 p.
Holst, M., M.A. Smultea, W.R. Koski, and B. Haley. 2005a. Marine mammal and sea turtle monitoring during Lamont-Doherty Earth Observatory’s marine seismic program off the Northern Yucatán Peninsula in the Southern Gulf of Mexico, January–February 2005. LGL Rep. TA2822-31. Rep. by LGL Ltd., King City, ON, for Lamont-Doherty Earth Observatory, Columbia Univ., Palisades, NY, and NMFS, Silver Spring, MD.
Holst, M., M.A. Smultea, W.R. Koski, and B. Haley. 2005b. Marine mammal and sea turtle monitoring during Lamont-Doherty Earth Observatory’s marine seismic program in the Eastern Tropical Pacific Ocean off

Shelburne Basin 3-D Seismic Survey LGL Limited Environmental Assessment Page 121
Central America, November–December 2004. LGL Rep. TA2822-30. Rep. by LGL Ltd., King City, ON, for Lamont-Doherty Earth Observatory, Columbia Univ., Palisades, NY, and NMFS, Silver Spring, MD.
Hooker, S.K. 1999. Resource and habitat use of Northern Bottlenose whales in the Gully: Ecology, diving and ranging behaviour. Ph.D. dissertation, Dalhousie University, Halifax, Canada.
Hooker, S.K., and R.W. Baird. 1999. Observations of Sowerby's Beaked Whales (Mesoplodon bidens) in the Gully, Nova Scotia. Canadian Field-Naturalist, 113: 273-277.
Hooker, S.K., H. Whitehead, S. Gowans, and R.W Baird. 2002. Fluctuations in distribution and patterns of individual range use of Northern Bottlenose Whales. Mar. Ecol. Prog. Ser., 225: 287-297.
Hooker, S.K., S.H. Iverson, P. Ostrom, and S.C. Smith. 2001. Diet of Northern Bottlenose Whales inferred from fatty-acid and stable-isotope analyses of biopsy samples. Can. J. Zool., 79: 1442-1454.
Huettmann, F. and A.W. Diamond. 2000. Seabird migration in the Canadian North Atlantic: Moulting locations and movement patterns of immatures. Can. J. Zool., 78: 624-647.
Hurley, G.V. 2011. Strategic environmental assessment – Petroleum exploration activities on the southwestern Scotian Shelf. Consultant rep. by Hurley Environmental Ltd. for the Canada-Nova Scotia Offshore Petroleum Board, November 2011. 94 p. + appendices.
Husky. 2000. White Rose oilfield comprehensive study. Rep. for Husky Oil Operations Ltd., St. John's, NL. 1011 p.
Imber, M.J. 1975. Behaviour of petrels in relation to the moon and artificial lights. Notornis, 22: 302-306.
Ireland, D.S., R. Rodrigues, D. Funk, W. Koski, and D. Hannay. 2009. Marine Mammal Monitoring and Mitigation during Open Water Seismic Exploration by Shell Offshore Inc. in the Chukchi and Beaufort Seas, July–October 2008: 90-Day Report. LGL Rep. P1049-1. Rep. by LGL Alaska Research Associates Inc., LGL Limited, and JASCO Applied Sciences, for Shell Offshore Inc., National Marine Fisheries Service (US), and US Fish and Wildlife Service. 277 p.
James, M.C. 2000. Distribution of the Leatherback Turtle (Dermochelys coriacea) in Atlantic Canada: Evidence from an observer program, aerial surveys, and a volunteer network of fish harvesters. M.Sc. Thesis. Biology Department. Acadia University, Wolfville, Nova Scotia. 71 p.
James, M. 2001. Primer in turtle biology. In: Meeting on turtle by-catch in Canadian Atlantic fisheries. Proceeding Series 2001/17. Canadian Science Advisory Secretariat. Darmouth, Nova Scotia.
James, M.C., C. Andrea Ottensmeyer, and R.A. Myers. 2005. Identification of high-use habitat and threats to Leatherback Sea Turtles in northern waters: New directions for conservation. Ecology Letters, 8: 195-201.
James, M.C., S.A. Sherrill-Mix, K. Martin, and R.A. Myers. 2006. Canadian waters provide critical foraging habitat for Leatherback Sea Turtles. Biological Conservation, 133: 347-357.
James, M.C., S.A. Sherrill-Mix, and R.A. Myers. 2007. Population characteristics and seasonal migrations of Leatherback Sea Turtles at high latitudes. Mar. Ecol. Prog. Ser., 337: 245-254.
Jefferson, T.A., M.A. Webber, and R. Pitman. 2008. Marine Mammals of the World: A Comprehensive Guide to their Identification. Academic Press, London. 573 p.
Jensen, A.S. and G.K. Silber. 2003. Large whale ship strike database. US Department of Commerce, NOAA Technical Memorandum, NMFSOPR-25. 37 p.
Joensen, A.H. 1972. Studies on oil pollution and seabirds in Denmark, 1968-1971. Danish Review of Game Biology, 6: 1-32.
Kellogg, R. 1929. What is known of the migrations of some of the whale bone whales. Reports of the Smithsonian Institution, 1928: 467-494.
Kenney, R.D. 1994. Appendix 2: Distribution charts of marine mammals on the Scotian Shelf, 1966 through 1992. Pp. 45-46 and passim In: R.R. Reeves and M.W. Brown. 1994. Marine mammals and the Canadian patrol frigate shock trials: A literature review and recommendations for mitigating impacts. East Coast Ecosystems Research Organization. Prepared for National Defence Headquarters, Ottawa.
Kenney, R.D. 2001. Anomalous 1992 spring and summer Right Whale (Eubalaena glacialis) distribution in the Gulf of Maine. Journal of Cetacean Research and Management, (Special Issue 2): 209-223.

Shelburne Basin 3-D Seismic Survey LGL Limited Environmental Assessment Page 122
Ketos Ecology. 2007. Reducing the fatal entrapment of marine turtles in towed seismic survey equipment. Ketos Ecology Report. 11 p.
Ketos Ecology. 2009. ‘Turtle guards’: A method to reduce the marine turtle mortality occurring in certain seismic survey equipment. Ketos Ecology Report. 14 p.
Ketten, D.R. 2000. Cetacean ears. In W.W.L. Au, A.N. Popper, and R.R. Fay (eds.). Hearing by whales and dolphins. Springer-Verlag. New York, NY. 485 p.
Knowlton, A.R. 1997. The regulation of shipping to protect North Atlantic Right Whales: Need and feasibility. M.M.A. thesis. University of Rhode Island.
Koropatnick, T., S.K. Johnston, S. Coffen-Smout, P. McNab and A. Szeto. 2012. Development and applications of vessel traffic maps based on Long Range Identification and Tracking (LRIT) data in Atlantic Canada. Can. Tech. Rep. Fish. Aquat. Sci. 2966. 27 p.
Kraus, S.D. and M.W. Brown. 1992. A Right Whale conservation plan for the waters of Atlantic Canada. Pp. 79–85 In: J.H.M. Willison, C. Drysdale, T.B. Herman, N.W.P. Munro, and T.L. Pollock, (eds.). Science and management of protected areas – Developments in Landscape Management and Urban Planning, Vol. 7. Elsevier, Amsterdam. 548 p.
Kulka, D., C. Hood, and J. Huntington. 2008. Recovery strategy for Northern Wolffish (Anarhichas denticulatus) and Spotted Wolffish (Anarhichas minor), and management plan for Atlantic Wolffish (Anarhichas lupus) in Canada. Fisheries and Oceans Canada: Newfoundland and Labrador Region. St. John’s, NL. x + 103 p.
Lacroix, D.L., R.B. Lancot, J.A. Reed, and T.L. McDonald. 2003. Effect of underwater seismic surveys on molting male Long-tailed Ducks in the Beaufort Sea, Alaska. Canadian Journal of Zoology, 81: 1862-1875.
Laist, D.W., A.R. Knowlton, J.G. Mead, A.S. Collet, and M. Podesta. 2001. Collisions between ships and whales. Marine Mammal Science, 17(1): 35-75.
Lavers, J., M. Hipfner, and G. Chapdelaine. 2009. Razorbill (Alca torda). In: A. Poole (ed.). The birds of North America Online, No. 635. Cornell Lab of Ornithology, Ithaca, NY. Available at http://bna.birds.cornell.edu.bnaproxy.birds.cornell.edu/bna/species/635 doi:10.2173/bna.635.
Lawson, J.W. and J.F. Gosselin. 2009. Distribution and preliminary abundance estimates for cetaceans seen during Canada’s Marine Megafauna Survey – A component of the 2007 TNASS. DFOCan. Sci. Advis. Sec. Res. Doc. 2009/031. 28 p.
Le Corre, M., A. Ollivier, S. Ribes, and P. Jouventin. 2002. Light-induced mortality of petrels: A 4-year study from Réunion Island (Indian Ocean). Biological Conservation, 105: 93-102.
LGL (Limited). 2005. Orphan Basin exploration drilling program environmental assessment. LGL Rep. SA825. Rep. by LGL Limited, St. John’s, NL, Canning & Pitt Associates, Inc., St. John’s, NL, SL Ross Environmental Research Limited, Ottawa, ON, Oceans Limited, St. John’s, NL, Lorax Environmental, Vancouver, BC, and PAL Environmental Services, St. John’s, NL, for Chevron Canada Limited, Calgary, AB, ExxonMobil Canada Ltd., St. John’s, NL, Imperial Oil Resources Ventures Limited, Calgary, AB and Shell Canada Limited. 353 p.
LGL. 2007. Project description for the proposed GX Technology Beaufort Span 2-D Marine Seismic Program, Open-water Season 2007. LGL Rep. TA4460-1. Rep. by LGL Limited, King City, ON, and Canning and Pitt Associates, St. John’s, NL, for GXT, Houston, TX. 154 p + appendices.
LGL. 2008. Project description for the proposed GX Technology Beaufort Span 2-D Marine Seismic Program, Open-water Season 2008. LGL Rep. TA4460-2. Rep. by LGL Limited, St. John’s, NL, and King City, ON, for GXT, Calgary, AB. 165 p + appendices.
LGL. 2009. Environmental assessment of ConocoPhillips Canada Laurentian Sub-basin Seismic Program, 2010-2013. LGL Rep. SA1047. Rep. by LGL Limited, St. John's, NL, in association with Canning & Pitt Associates Inc. and Oceans Ltd., St. John's, NL, for ConocoPhillips, Calgary, AB. 307 p. + appendices.
LGL. 2012. Environmental assessment of WesternGeco’s Seismic Program for Jeanne d’Arc Basin, 2012-2015. LGL Rep. SA1150. Rep. by LGL Limited, St. John’s, NL, in association with Canning & Pitt Associates Inc., St. John’s, NL, and Oceans Limited, St. John’s, NL, for WesternGeco Canada, Calgary, AB. 227 p. + appendices.

Shelburne Basin 3-D Seismic Survey LGL Limited Environmental Assessment Page 123
LGL Limited. 2013. Addendum to Environmental Assessment of Shell Canada Ltd.’s Shelburne Basin 3-D Seismic Survey. LGL Rep. SA1175. Rep. by LGL Limited, St. John’s, NL and Mahone Bay, NS for Shell Canada Limited, Calgary, AB. 12 p.
LGL, Inuvialuit Environmental & Geotechnical Inc., and Canning and Pitt Associates. 2006. Project description for the proposed GX Technology Beaufort Span 2-D Marine Seismic Program. Open Water Season 2006/2007. Rep. by LGL Limited, King City, ON, Inuvialuit Environmental & Geotechnical Inc., Inuvik, Northwest Territories, and Canning and Pitt Associates, St. John’s, NL, for GX Technology, Houston, TX. 150 p. + appendices.
Lock, A.R., R.G.B. Brown, and S.H. Gerriets. 1994. Gazetteer of marine birds in Atlantic Canada. An atlas of seabird vulnerability to oil pollution. Canadian Wildlife Service, Environmental Conservation Branch, Environment Canada, Atlantic Region. 137 p.
LPRC (Large Pelagics Research Center). Unpubl. data.
Lucas, Z.L. and S.K. Hooker. 2000. Cetacean strandings on Sable Island, Nova Scotia, 1970-1998. Canadian Field-Naturalist, 114: 45-61.
Lutcavage, M.E., P. Plotkin, B. Witherington, and P.L. Lutz. 1997. Human impacts on sea turtle survival. Pp. 387-409 In: P.L. Lutz and J.A. Musick (eds.). The Biology of Sea Turtles. CRC Press, Boca Raton, FL. 432 p.
MacLeod, C.D., M.B. Santos, and G.J. Pierce. 2003. Review of data on diets of Beaked Whales: Evidence of niche separation and geographic segregation. J. Mar. Biol. Assoc. UK., 83(3): 651-665.
MacLeod, C.D., W.F. Perrin, R. Pitman, J. Barlow, L.T. Ballance, A. D'Amico, T. Gerrodette, G. Joyce, K.D. Mullin, D. Palka, and G.T. Waring. 2006. Known and inferred distributions of Beaked Whale species (Cetacea: Ziphiidae). J. Cetac. Res. Manage., 7(3): 271-286.
MacLeod, D. 2000. Review of the distribution of Mesoplodon species (order Cetacea, family Ziphiidae) in the North Atlantic. Mamm. Rev., 30(1): 1-8.
MacGillivray, A.O. 2006. An acoustic modeling study of seismic airgun noise in Queen Charlotte Basin. M.Sc. Thesis, University of Victoria. 98 p.
Maguire, J.-J. and B. Lester. 2012. Bluefin tuna (Thunnus thynnus) in Atlantic Canadian waters: biology, status, recovery potential, and measures for mitigation. DFO Can. Sci. Advis. Sec. Res. Doc. 2012/002: vi + 28 p.
Malme, C.I., P.R. Miles, C.W. Clark, P. Tyack, and J.E. Bird. 1983. Investigations of the potential effects of underwater noise from petroleum industry activities on migrating Gray Whale behavior. BBN Rep. 5366. Rep. by Bolt, Beranek and Newman, for Minerals Management Service, US Department of the Interior, Washington, DC.
Malme, C.I., P.R. Miles, C.W. Clark, P. Tyack, and J.E. Bird. 1984. Investigations of the potential effects of underwater noise from petroleum industry activities on migrating Gray Whale behavior/Phase II: January 1984 migration. BBN Rep.5586. Rep. by Bolt Beranek & Newman Inc., Cambridge, MA, for MMS, Alaska OCS Region, Anchorage, AK. NTIS PB86-218377.
Mansfield, A.W. 1985. Status of the Blue Whale, Balaenoptera musculus, in Canada. Canadian Field-Naturalist, 99(3): 417–420.
MARLANT. 2012. Maritime Forces Atlantic website. Available at http://www.navy.forces.gc.ca/marlant/0/0-e_eng.asp?category=4. Accessed October 2012.
Mayo, C.A. and M.K. Marx. 1990. Surface foraging behavior of the North Atlantic RIGHT WHALE, Eubalaena glacialis, and associated zooplankton characteristics. Canadian Journal of Zoology, 68: 2214–2220.
McLaren, I.A. 2012. All the birds of Nova Scotia: Status & critical identification. Gaspereau Press Limited and the Nova Scotia Bird Society, Kentville, NS. 247 p.
Mellinger, D.K., S.L. Nieukirk, H. Matsumoto, S.L. Heimlich, R.P. Dziak, J. Haxel, M. Fowler, C. Meinig, and H.V. Miller. 2007. Seasonal occurrence of North Atlantic Right Whale (Eubalaena glacialis) vocalizations at two sites on the Scotian Shelf. Marine Mammal Science, 23: 856-867.

Shelburne Basin 3-D Seismic Survey LGL Limited Environmental Assessment Page 124
Meredith, G.N. and R.R. Campbell. 1988. Status of the Fin Whale, Balaenoptera physalus, in Canada. Canadian Field-Naturalist, 102(2): 351–368.
Miles, W., S. Money, R. Luxmoore, and R.W. Furness. 2010. Effects of artificial lights and moonlight on petrels at St Kilda. Bird Study, 57: 244-251.
Mitchell, E. 1974. Present status of Northwest Atlantic Fin and other whale stocks. Pp. 108-169 In: W.E. Schevill (ed.). The whale problem: A status report. Harvard University Press, Cambridge, MA.
Montevecchi, W.A. 2006. Influences of artificial light on marine birds. Pp. 94-113 In: C. Rich and T. Longcore (eds.). Ecological Consequences of Artificial Night Lighting. Island Press, Washington, D.C. 478 p.
Montevecchi, W.A., B.L. Birt-Friesen, and D.K. Cairns. 1992. Reproductive energetic and prey harvest of Leach’s Storm-Petrel in the Northwest Atlantic. Ecology, 73: 823-832.
Montevecchi, W.A., F.K. Wiese, G.K. Davoren, A.W. Diamond, F. Huettmann, and J. Linke. 1999. Seabird attraction to offshore platforms and seabird monitoring from offshore support vessels and other ships: Literature review and monitoring designs. Prepared for the Canadian Association of Petroleum Producers. 56 p.
Moulton, V.D. and M. Holst. 2010. Effects of seismic survey sound on cetaceans in the Northwest Atlantic. Environmental Studies Research Funds Report No. 182. St. John’s, NL. 28 p.
Moulton, V.D., B.D. Mactavish, R.E. Harris and R.A. Buchanan. 2006. Marine mammal and seabird monitoring of Chevron Canada Limited’s 3-D seismic program on the Orphan Basin, 2005. LGL Rep. SA843. Rep. by LGL Limited, St. John’s, NL, for Chevron Canada Limited, Calgary, AB, ExxonMobil Canada Ltd., St. John’s, NL, Shell Canada Ltd. and Imperial Oil Resources Ventures Ltd., Calgary, AB. 109 p. + appendices.
Moulton, V.D., R.A. Davis, J.A. Cook, M. Austin, M.L. Reece, S.A. Martin, A. MacGillvray, D. Hannay, and M.W. Fitzgerald. 2003. Environmental assessment of Marathon Canada Limited’s 3-D seismic program on the Scotian Slope, 2003. LGL Rep. SA744-1. Rep. by LGL Limited, St. John’s, NL, for Marathon Canada Limited, Halifax, NS.
Nedwell, J.R., B. Edwards, A.W.H. Turnpenny, and J. Gordon. 2004. Fish and marine mammal audiograms: A summary of available information. Subacoustech report ref. 534R0214, submitted to Chevron Texaco Ltd. 278 p.
Nisbet, I.C.T. 1984. Migration and winter quarters of North American Roseate Terns as shown by banding recoveries. Journal of Field Ornithology, 55: 1-17
.NOAA Fisheries. 2004. Large whale ship strikes relative to vessel speed. White paper developed by NOAA Fisheries as supporting documentation for the development of the operational measures in the proposed ship strike strategy. Available at http://www.nmfs.noaa.gov/pr/PR2/Conservation_and_ Recovery_Program/msr/Documents/ss_speed.pdf.
NOAA (NOAA Fisheries, Southeast Fisheries Science Center). Unpubl. data
Nova Scotia Leatherback Turtle Working Group. 2002. Back on Track! No longer accessable online.
O’Boyle, R. 2001. Meeting on Turtle By-Catch in Canadian Atlantic Fisheries. CSAS Proc. Series Report 2001/17. 32 p.
O’Boyle, R. 2012. Fish stock status and commercial fisheries – State of the Scotian Shelf report. Rep. by Beta Scientific Consulting Inc., Bedford, NS, for Fisheries and Oceans Canada. 36 p.
O'Hara, P. D., and L. A. Morandin. 2010. Effects of sheens associated with offshore oil and gas development on the feather microstructure of pelagic seabirds. Marine Pollution Bulletin 60:672-678.
O’Neill, C., D. Leary, and A. McCrodan. 2010. Sound Source Verification. Pp. 3-1 to 3-34 In: M.K. Blees, K.G. Hartin, D.S. Ireland, and D. Hannay (eds.). Marine mammal monitoring and mitigation during open water seismic exploration by Statoil USA E&P Inc. in the Chukchi Sea, August-October 2010: 90-day report. LGL Rep. P1119. Rep. by LGL Alaska Research Associates Inc., LGL Limited, and JASCO Applied Sciences Limited, for Statoil USA E&P Inc., National Marine Fisheries Service (US), and US Fish and Wildlife Service.

Shelburne Basin 3-D Seismic Survey LGL Limited Environmental Assessment Page 125
Patrician, M.R. and R.D. Kenney. 2010. Using the continuous plankton recorder to investigate the absence of North Atlantic Right Whale (Eubalaena glacialis) from the Roseway Basin feeding ground. J. Plankton Res., 32: 1685-1695.
Pendoley, K. 1997. Sea turtles and management of marine seismic programs in western Australia. PESA Journal, 25: 8-16.
Poot, H., B.J. Ens, H. de Vries, M.A.H. Donners, M.R. Wernand, and J.M. Marquenie. 2008. Green light for nocturnally migrating birds. Ecology and Society, 113: 47. Available at http://www.ecologyandsociety.org/vol13/iss2/art47/.
Port of Saint John. 2012. Port of Saint John Community report. Spring 2012. Port of Saint John, Saint John, NB.
Potter, J.R., M. Thillet, C. Douglas, M.A. Chitre, Z. Doborzynski, and P.J. Seekings. 2007. Visual and passive acoustic marine mammal observations and high-frequency seismic source characteristics recorded during a seismic survey. IEEE J. Oceanic Eng., 32(2): 469-483.
Reed, J.R., J.L. Sincock, and J.P. Hailman. 1985. Light attraction in endangered Procellariiform birds: Reduction by shielding upward radiation. Auk, 102: 377-383.
Reeves, R.R. 2004. Historical observations of Humpback and Blue Whales in the North Atlantic ocean: Clues to migratory routes and possibly additional feeding grounds. Marine Mammal Science, 20: 774-776.
Reeves, R.R., E. Mitchell, and H. Whitehead. 1993. Status of the Northern Bottlenose Whale, Hyperoodon ampullatus. Can. Field-Nat., 107: 490-508.
Richardson, W.J. 1971. Weather and late spring migration of birds into southern Ontario. Wilson Bull., 78: 400-414.
Richardson, W.J. 1972. Autumn migration and weather in eastern Canada: A radar study. American Birds, 26: 10-16.
Richardson, W.J. 1979. Southeastward shorebird migration over Nova Scotia and New Brunswick in autumn: A radar study. Can. J. Zool., 57: 107-124.
Richardson, W.J. 1980. Autumn landbird migration over the western Atlantic Ocean as evident from radar. Pp. 501-506 In: R. Nöhring (ed.). Proceedings of the XVII International Ornithol Congress 1987. Berlin, Germany: Verlag der Deutschen Ornithologen-Gesselschaft.
Richardson, W.J., B. Würsig, and C.R. Greene. 1986. Reactions of Bowhead Whales, Balaena mysticetus, to seismic exploration in the Canadian Beaufort Sea. J. Acoust. Soc. Am., 79(4): 1117-1128.
Richardson, W.J., C.R. Greene, J.P. Hickie, R.A. Davis, and D.H. Thomson. 1989. Effects of offshore petroleum operations on cold water marine mammals: A literature review (2nd Edition). Rep. by LGL Limited, King City, ON, for the American Petroleum Institute, Washington, DC. 385 p.
Richardson, W.J., C.R.J. Greene, C.I. Malme, and D.H. Thomson. 1995. Marine mammals and noise. Academic Press, San Diego, CA. 576 p.
Rodríguez, A. and B. Rogríguez. 2009. Attraction of pretrels to artificial lights in the Canary Island: Effects of the moon phase and age class. Ibis, 151(2): 299-310.
Russell, R.W. 2005. Interactions between migrating birds and offshore oil and gas platforms in the northern Gulf of Mexico: Final Report. U.S. Department of the Interior, Minerals Management Service, Gulf of Mexico OCS Region, New Orleans, LA. OCS Study MMS 2005-009. 348 p.
Rutherford, R.J. and H. Breeze. 2002. The Gully Ecosystem. Can. Ms. Rep. Fish. Aquat. Sci., 2615. vi + 28 p.
Sarà, G., J.M. Dean, D. D’Amato, G. Buscaino, A. Oliveri, S. Genovese, S. Ferro, G. Buffa, M. Lo Martire and S. Mazzola. 2007. Effect of boat noise on the behaviour of bluefin tuna Thunnus thynnus in the Mediterranean Sea. Mar. Ecol. Prog. Ser. 331: 243-253
Sears, R. 1999. Blue Whale dispersal off Atlantic Canada. In: Rorqual 1999, v. 10. on-line edition. Available at http//www.rorqual.com/newslett.htm.
Sears, R. and F. Larsen. 2002. Long range movements of a Blue Whale (Balaenoptera musculus) between the Gulf of St. Lawrence and West Greenland. Mar. Mamm. Sci., 18(1): 281–285.

Shelburne Basin 3-D Seismic Survey LGL Limited Environmental Assessment Page 126
Sears, R. and J. Calambokidis. 2002. COSEWIC Assessment and update status report on the Blue Whale Balaenoptera musculus, Atlantic population and Pacific population, in Canada. Committee on the Status of Endangered Wildlife in Canada, Ottawa. 38 p.
Sears, R., F.W. Wenzel, and J.M. Williamson. 1987. The Blue Whale: A catalogue of individuals from the western North Atlantic (Gulf of St. Lawrence). Mingan Island Cetacean Study (MICS Inc.), St. Lambert, QC. 83 p.
Sears, R., J.M. Williamson, F.W. Wenzel, M. Berube, D. Gendron, and P. Jones. 1990. Photographic identification of the Blue Whale (Balaenoptera musculus) in the Gulf of St. Lawrence, Canada. International Whaling Commission Special Issue Report (SC/A88/ID23).
Sergeant, D.E. 1966. Populations of large whale species in the western North Atlantic with special reference to the Fin Whale. Fish. Res. Board. Canada. Circular No. 9. 30 p.
Shell (Canada Limited). 2012. Project description – Shelburne 3-D seismic survey exploration licences EL 2423; EL 2424; EL 2425; EL 2426. 20 p. + appendices.
Sherrill-Mix, S.A., M.C. James, and R.A. Myers. 2008. Migration cues and timing in Leatherback Sea Turtles. Behavioral Ecology, 19: 231-236.
Shoop, C.R. and R.D. Kenney. 1992. Seasonal distributions and abundances of Loggerhead and Leatherback Sea Turtles in waters of the north eastern United States. Herpetological Monographs, 6: 43–67.
Simon, J., S. Rowe, and A. Cook. 2011. Pre-COSEWIC review of Atlantic Wolffish (Anarhichas lupus), Northern Wolffish (A. denticulatus), and Spotted Wolffish (A. minor) in the Maritimes Region. DFO Can. Sci. Advis. Sec. Res. Doc. 2011/088. vi + 73 p.
Skeel, M.A. and E.P. Mallory. 1996. Whimbrel. In: A. Poole and F. Gill (eds.). The birds of North America, No. 219. National Academy of Sciences, Philadelphia, PA. 28 p.
Smith, C.L. and W.G. MacIntyre. 1971. Initial aging of fuel oil films on sea water. Pp. 457-461 In: Proc. of the Joint Conf. on Prevention and Control of Oil Spills. American Petroleum Institute, Washington, DC.
Southall, B.L., A.E. Bowles, W.T. Ellison, J.J. Finneran, R.L. Gentry, C.R. Greene, Jr., D. Kastak, D.R. Ketten, J.H. Miller, P.E. Nachtigall, W.J. Richardson, J.A. Thomas, and P.L. Tyack. 2007. Marine mammal noise exposure criteria: Initial scientific recommendations. Aquatic Mammals, 33: 411-521.
Spotila, J.R. 2004. Sea turtles: A complete guide to their biology, behavior, and conservation. The Johns Hopkins University Press, Baltimore, Maryland. 227 p.
St. Aubin, D.J. 1990. Physiologic and toxic effects on pinnipeds. Pp. 103-127 In: J.R. Geraci and D.J. St. Aubin (eds.). Sea mammals and oil: Confronting the risks. Academic Press, San Diego, CA.
Stantec (Consulting). 2012. Strategic environmental assessment for offshore petroleum exploration activities. Eastern Scotian Slope (Phase 1B). Prep. For the Canada-Nova Scotia Offshore Petroleum Board. Halifax, NS.
Stone, G.S., Kraus, S.D., Prescott, J.H., and Hazard, K.W. 1988. Significant aggregations of the endangered Right Whale, Eubalaena glacialis, on the continental shelf of Nova Scotia. Canadian Field Naturalist, 102: 471–474.
Sutcliffe, W.H. and P.F. Brodie. 1977. Whale distributions in Nova Scotia waters. Fisheries and Marine Service (Canada) Technical Report No. 722: 1-83.
Telfer, T.C., J.L. Sincock, G.V. Byrd, and J.R. Reed. 1987. Attraction of Hawaiian seabirds to lights: Conservation efforts and effects of moon phase. Wildlife Society Bulletin, 15: 406-413.
Turtle Expert Working Group (TEWG). 2007. An Assessment of the Leatherback Turtle Population in the Atlantic Ocean. NOAA Tech. Memo. NMFSSEFSC- 555. U.S. Dept. Commerce. 116 p.
Tuck, L.M. 1971. The occurrence of Greenland and European birds in Newfoundland. Bird-Banding, 42: 184-209.
Tufts, R.W. 1986. Birds of Nova Scotia, Third Edition. Nimbus Publishing Limited, The Nova Scotia Museum, Halifax, NS. 478 p.

Shelburne Basin 3-D Seismic Survey LGL Limited Environmental Assessment Page 127
Upun-LGL. 2010. Project description for the proposed GXT Technology Beaufort Span 2-D marine seismic program in 2010. LGL Rep. UA0001. Rep. by Upun-LGL Limited, Inuvik, NWT and King City, ON, for GXT, Calgary, AB. 183 p. + appendices.
Vanderlaan, A.S.M. and C.T. Taggart. 2007. Vessel collisions with whales: The probability of lethal injury based on vessel speed. Marine Mammal Science, 23(1): 144-156.
Vanderlaan, A.S.M., J.J. Corbett, S.L. Green, J.A. Callahan, C. Wang, R.D. Kenney, C.T. Taggart, and J. Firestone. 2009. Probability and mitigation of vessel encounters with North Atlantic Right Whales. Endanger. Species Res., 6: 273-285. doi: 10.3354/esr00176.
Walli, A., S.L.H. Teo, A. Boustany, C.J. Farewell, T. Williams, H. Dewar, E. Prince and B.A. Block. 2009. Seasonal movements, aggregations and diving behavior of Atlantic bluefin tuna (Thunnus thynnus) revealed with archival tags. PLos ONE/www.plosone.org. July 2009/Volume 4/Issue 7/e6151.
Walmsley, D. and J. Theriault. 2011. Ocean noise: The state of the Scotian Shelf report. Oceans and Coastal Management Division, DFO, Maritimes Region. Dartmouth, NS.
Waring, G.T., E. Josephson, C.P. Fairfield-Walsh, and K. Maze-Foley. 2009. US Atlantic and Gulf of Mexico marine mammal stock assessments -- 2008. NOAA Technical Memorandum, NMFS-NE 210. 440 p.
Waring, G.T., E. Josephson, K. Maze-Foley, and P.E. Rosel (eds.). 2011a. U.S. Atlantic and Gulf of Mexico Marine Mammal Stock Assessments -- 2011. NOAA Tech. Memo. NMFS-NE 221. 319 p.
Waring, G.T., E. Josephson, K. Maze-Foley, and P.E. Rosel (eds.). 2011b. U.S. Atlantic and Gulf of Mexico Marine Mammal Stock Assessments -- 2010. NOAA Tech Memo. NMFS-NE 219. 598 p.
Warner, G., C. Erbe, and D. Hannay. 2010. Underwater sound measurements. Pp. 3-1 to 3-34 In: C.M. Reiser, D.W. Funk, R. Rodrigues, and D. Hannay (eds.). Marine Mammal Monitoring and Mitigation during Open Water Shallow Hazards and Site Clearance Surveys by Shell Offshore Inc. in the Alaskan Chukchi Sea, July-October 2009: 90-Day Report. LGL Rep. P1112-1. Rep. by LGL Alaska Research Associates Inc. and JASCO Applied Sciences for Shell Offshore Inc., National Marine Fisheries Service (US), and US Fish and Wildlife Service. Available at http://www-static.shell.com/static/usa/downloads/alaska/report_2009_shell_90-d_report_plus_appendices.pdf.
Weir, C.R. 2007. Observations of marine turtles in relation to seismic airgun sound off Angola. Mar. Turtle. Newsl., 116: 17-20.
Whitehead, H. and T. Wimmer. 2002. Update to the status of the Northern Bottlenose Whale, Hyperoodon ampullatus, (Gully population). Submitted to COSEWIC Marine Mammal Specialist Committee. Department of Biology, Dalhousie University, Halifax, NS.
Whitehead, H. and T. Wimmer. 2005. Heterogeneity and the mark-recapture assessment of the Scotian Shelf population of Northern Bottlenose Whales (Hyperoodon ampullatus). Can. J. Fish. Aquat. Sci., 62: 2573-2585.
Whitehead, H., A. Faucher, S. Gowans, and S. McCarrey. 1997. Status of the Northern Bottlenose Whale, Hyperoodon ampullatus, in The Gully, Nova Scotia. Canadian Field-Naturalist, 111: 287-292.
Whitehead, H., W.D. Bowen, S.K. Hooker, and S. Gowans. 1998. Marine mammals. Pp. 186-221 In: W.G. Harrison and D.G. Fenton (eds.). The Gully: A scientific review of its environment and ecosystem. Department of Fisheries and Oceans, Ottawa. Canadian Stock Assessment Secretariat Research Document 98/83.
Wiese, F.K., W.A. Montevecchi, G.K. Davoren, F. Huettmann, A.W. Diamond, and J. Linke. 2001. Seabirds at risk around offshore oil platforms in the North-west Atlantic. Marine Pollution Bulletin, 42: 1285-1290.
Williams T.C. and J.M. Williams. 1978. Orientation of transatlantic migrants. Pp. 239-251 In: K. Schmidt-Koenig and W.T. Keeton (eds.). Animal migration, navigation, and homing. Berlin, Springer.
Williams, T.M., G.A. Antonelis, and J. Balke. 1994. Health, evaluation, rehabilitation, and release of oiled harbor seal pups. Pp. 227-241 In: T.R. Loughlin (ed.). Marine mammals and the Exxon Valdez. Academic Press, San Diego, CA.
Williams, U. and J. Chardine. n.d. The Leach's Storm-Petrel: General information and handling instruction. Petro-Canada, St. John's, NL. 3 p.

LIST OF APPENDICES
APPENDIX A: JASCO MODELLING REPORT
APPENDIX B: SCOPING DOCUMENT
APPENDIX C: SUMMARY OF CONSULTATIONS
APPENDIX D: REVIEW OF THE EFFECTS OF AIRGUN SOUNDS ON MARINE MAMMALS
APPENDIX E: REVIEW OF THE EFFECTS OF AIRGUN SOUNDS ON SEA TURTLES
APPENDIX F: REVIEW OF THE EFFECTS OF AIRGUN SOUNDS ON FISHES
APPENDIX G: REVIEW OF THE EFFECTS OF AIRGUN SOUNDS ON MARINE
INVERTEBRATES
APPENDIX H: SUPPLEMENTAL FISHERIES DATA


APPENDIX A:
JASCO MODELLING REPORT

Underwater Sound Modelling of Shell’s 2013 Shelburne Basin 3-D Seismic Survey
Submitted to:
LGL Limited, environmental research associates
St. John's, NL
Author:
Marie-Noël R. Matthews JASCO Applied Sciences
Suite 202, 32 Troop Ave.
Dartmouth, NS B3B 1Z1 Canada
Phone: +1-902-405-3336
Fax: +1-902-405-3337
www.jasco.com
4 April 2013
P001191-001
Document 00421
Version 5.0

Version 5.0 vi
Suggested citation:
Matthews, M.-N.R. 2012. Underwater Sound Modelling of Shell’s 2013 Shelburne Basin 3-D Seismic Survey. JASCO Document 00421, Version 5.0. Technical report by JASCO Applied Sciences for LGL Limited, environmental research associates.
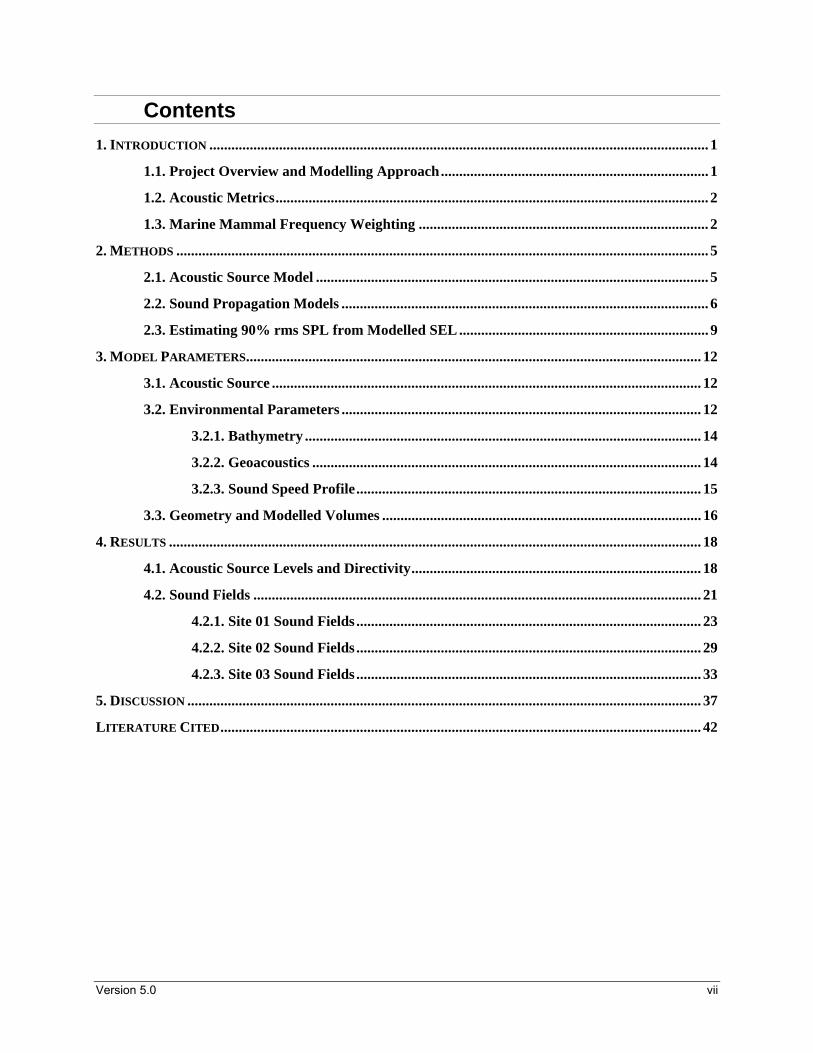
Version 5.0 vii
Contents
1. INTRODUCTION ........................................................................................................................................ 1
1.1. Project Overview and Modelling Approach ......................................................................... 1
1.2. Acoustic Metrics ...................................................................................................................... 2
1.3. Marine Mammal Frequency Weighting ............................................................................... 2
2. METHODS ................................................................................................................................................. 5
2.1. Acoustic Source Model ........................................................................................................... 5
2.2. Sound Propagation Models .................................................................................................... 6
2.3. Estimating 90% rms SPL from Modelled SEL .................................................................... 9
3. MODEL PARAMETERS ............................................................................................................................ 12
3.1. Acoustic Source ..................................................................................................................... 12
3.2. Environmental Parameters .................................................................................................. 12
3.2.1. Bathymetry ............................................................................................................ 14
3.2.2. Geoacoustics .......................................................................................................... 14
3.2.3. Sound Speed Profile .............................................................................................. 15
3.3. Geometry and Modelled Volumes ....................................................................................... 16
4. RESULTS ................................................................................................................................................. 18
4.1. Acoustic Source Levels and Directivity ............................................................................... 18
4.2. Sound Fields .......................................................................................................................... 21
4.2.1. Site 01 Sound Fields .............................................................................................. 23
4.2.2. Site 02 Sound Fields .............................................................................................. 29
4.2.3. Site 03 Sound Fields .............................................................................................. 33
5. DISCUSSION ............................................................................................................................................ 37
LITERATURE CITED ................................................................................................................................... 42

Version 5.0 viii
Figures
Figure 1. The standard M-weighting functions for the four underwater functional marine mammal hearing groups (Southall et al. 2007). ...................................................................................................... 3
Figure 2. Representation of N×2-D and maximum-over-depth approaches. ................................................ 7
Figure 3. Example of maximum-over-depth sound exposure levels (SELs) colour contours maps for two different sources. ............................................................................................................................... 8
Figure 4. Peak and root-mean-square (rms) sound pressure level (SPL) and sound exposure level (SEL) versus range from a 20 in3 airgun array. Solid line is the least squares best fit to rms SPL. Dashed line is the best fit line increased by 3.0 dB to exceed 90% of all rms SPL values (90th percentile fit) (Fig. 10 in Ireland et al. 2009). .......................................................................................... 8
Figure 5. Offset of sound exposure levels (SELs) to root-mean-square (rms) sound pressure levels (SPLs) modelled with Full Waveform Range-dependent Acoustic Model (FWRAM) (black dots) and the SEL to rms SPL conversion function (red line) for the Site 01 transect parallel to the tow direction. ................................................................................................................................................ 10
Figure 6. Sound exposure level (SEL) to root-mean-square (rms) sound pressure level (SPL) conversion functions for each modelled site. These range-dependent functions were used to convert the Marine Operations Noise Model (MONM) results from SEL to rms SPL. ........................ 11
Figure 7. Layout of the modelled airgun array composed of 24 active airguns (5085 in3 total volume, 10 m tow depth). Relative symbol sizes and labels indicate airgun volume. ........................................ 12
Figure 8. Location of the modelled sites within the Project Area, 350 km south of Halifax, NS. .............. 13
Figure 9. Monthly sound speed profiles in deep (> 200 m) and shallow (≤ 200 m) waters within the Project Area, derived from the GDEM ocean climatology of temperature and salinity (Teague et al. 1990; Carnes 2009). .......................................................................................................................... 16
Figure 10. Predicted (a) overpressure signature and (b) spectral density in the broadside and endfire (horizontal) directions for the modelled 5085 in3 airgun array, at 10 m tow depth. Surface ghosts (effects of the pulse reflection at the water surface) are not included in these signatures. .................... 18
Figure 11. Maximum directional source level (SL) in the horizontal plan, in each 1/3-octave band, for the 5085 in3 airgun array, at 10 m tow depth. .................................................................................. 19
Figure 12. Directionality of predicted horizontal source levels (SLs, dB re 1 µPa2·s) in 1/3-octave bands for the modelled 5085 in3 airgun array, at 10 m tow depth. The 1/3-octave band centre frequencies are indicated above each plot. ............................................................................................ 20
Figure 13. Maximum-over-depth sound exposure levels (SELs) at Site 01, April, along a bearing of 162˚, i.e., perpendicular to the tow direction, toward deep water. ......................................................... 22
Figure 14. Sound exposure levels (SELs) at Site 01, April: Received maximum-over-depth sound levels for a single pulse from the 5085 in3 airgun array. Blue contours indicate water depth in metres. .................................................................................................................................................... 23
Figure 15. Root-mean-square (rms) sound pressure levels (SPLs) at Site 01, April: Received maximum-over-depth sound levels for a single pulse from the 5085 in3 airgun array. Blue contours indicate water depth in metres. ............................................................................................... 23
Figure 16. Sound exposure levels (SELs) at Site 01, May: Received maximum-over-depth sound levels for a single pulse from the 5085 in3 airgun array. Blue contours indicate water depth in metres. .................................................................................................................................................... 24

Version 5.0 ix
Figure 17. Root-mean-square (rms) sound pressure levels (SPLs) at Site 01, May: Received maximum-over-depth sound levels for a single pulse from the 5085 in3 airgun array. Blue contours indicate water depth in metres. ............................................................................................... 24
Figure 18. Sound exposure levels (SELs) at Site 01, June: Received maximum-over-depth sound levels for a single pulse from the 5085 in3 airgun array. Blue contours indicate water depth in metres. .................................................................................................................................................... 25
Figure 19. Root-mean-square (rms) sound pressure levels (SPLs) at Site 01, June: Received maximum-over-depth sound levels for a single pulse from the 5085 in3 airgun array. Blue contours indicate water depth in metres. ............................................................................................... 25
Figure 20. Sound exposure levels (SELs) at Site 01, September: Received maximum-over-depth sound levels for a single pulse from the 5085 in3 airgun array. Blue contours indicate water depth in metres. ............................................................................................................................................... 26
Figure 21. Root-mean-square (rms) sound pressure levels (SPLs) at Site 01, September: Received maximum-over-depth sound levels for a single pulse from the 5085 in3 airgun array. Blue contours indicate water depth in metres. ............................................................................................... 26
Figure 22. Sound exposure levels (SELs) at Site 02, April: Received maximum-over-depth sound levels for a single pulse from the 5085 in3 airgun array. Blue contours indicate water depth in metres. .................................................................................................................................................... 29
Figure 23. Root-mean-square (rms) sound pressure levels (SPLs) at Site 02, April: Received maximum-over-depth sound levels for a single pulse from the 5085 in3 airgun array. Blue contours indicate water depth in metres. ............................................................................................... 29
Figure 24. Sound exposure levels (SELs) at Site 02, September: Received maximum-over-depth sound levels for a single pulse from the 5085 in3 airgun array. Blue contours indicate water depth in metres. ............................................................................................................................................... 30
Figure 25. Root-mean-square (rms) sound pressure levels (SPLs) at Site 02, September: Received maximum-over-depth sound levels for a single pulse from the 5085 in3 airgun array. Blue contours indicate water depth in metres. ............................................................................................... 30
Figure 26. Sound exposure levels (SELs) at Site 03, April: Received maximum-over-depth sound levels for a single pulse from the 5085 in3 airgun array. Blue contours indicate water depth in metres. .................................................................................................................................................... 33
Figure 27. Root-mean-square (rms) sound pressure levels (SPLs) at Site 03, April: Received maximum-over-depth sound levels for a single pulse from the 5085 in3 airgun array. Blue contours indicate water depth in metres. ............................................................................................... 33
Figure 28. Sound exposure levels (SELs) at Site 03, September: Received maximum-over-depth sound levels for a single pulse from the 5085 in3 airgun array. Blue contours indicate water depth in metres. ............................................................................................................................................... 34
Figure 29. Root-mean-square (rms) sound pressure levels (SPLs) at Site 03, September: Received maximum-over-depth sound levels for a single pulse from the 5085 in3 airgun array. Blue contours indicate water depth in metres. ............................................................................................... 34
Figure 30. Comparison between root-mean-square (rms) sound pressure levels (SPLs) at Site 01 and 03: Received maximum-over-depth sound levels for a single pulse from the 5085 in3 airgun array. Blue contours indicate water depth in metres. ....................................................................................... 38
Version 5.0 x
Figure 31. Comparison between root-mean-square (rms) sound pressure levels (SPLs) at Site 01 in April and September: Received maximum-over-depth sound levels for a single pulse from the 5085 in3 airgun array. Blue contours indicate water depth in metres. ................................................... 39
Figure 32. April: root-mean-square (rms) sound pressure levels (SPLs; dB re 1 μPa) as a function of range and depth from the airgun array at Site 02. Negative distances extend from the airgun array along a true bearing of 162°. Positive distances extend from the airgun array along a true bearing of 342°. .................................................................................................................................................. 40
Figure 33. September: root-mean-square (rms) sound pressure levels (SPLs; dB re 1 μPa) as a function of range and depth from the airgun array at Site 02. Negative distances extend from the airgun array along a true bearing of 162°. Positive distances extend from the airgun array along a true bearing of 342°. .............................................................................................................................. 40

Version 5.0 xi
Tables
Table 1. The low (flo) and high (fhi) frequency cut-off parameters of the standard M-weighting functions for the four underwater functional marine mammal hearing groups (Southall et al. 2007). ....................................................................................................................................................... 4
Table 2. Locations and water depths of the modelled sites within the Project Area................................... 14
Table 3. Estimated geoacoustic profile for Sites 01–03 representing a multi-layered sandy bottom. Within each sediment layer, parameters vary linearly within the stated range. ..................................... 15
Table 4. Horizontal source level specifications (10–2000 Hz) for the modelled 5085 in3 airgun array, at 10 m tow depth, computed with Airgun Array Source Model (AASM) in the broadside and endfire directions. Surface ghost effects are not included as they are accounted for by the Marine Operations Noise Model (MONM) propagation model. ........................................................................ 19
Table 5. Site 01: Maximum (Rmax, m) and 95% (R95%, m) horizontal distances from the source to modelled maximum-over-depth sound exposure levels (SELs; 10 Hz to 2 kHz). ................................. 27
Table 6. Site 01: Maximum (Rmax, m) and 95% (R95%, m) horizontal distances from the source to modelled maximum-over-depth root-mean-square (rms) sound pressure levels (SPLs; 10 Hz to 2 kHz). ................................................................................................................................................... 27
Table 7. Site 01, April: Maximum (Rmax, m) and 95% (R95%, m) horizontal distances from the source to modelled maximum-over-depth sound exposure levels (SELs; 10 Hz to 2 kHz), with and without M-weighting applied................................................................................................................. 27
Table 8. Site 01, September: Maximum (Rmax, m) and 95% (R95%, m) horizontal distances from the source to modelled maximum-over-depth sound exposure levels (SELs; 10 Hz to 2 kHz), with and without M-weighting applied. ......................................................................................................... 28
Table 9. Site 02: Maximum (Rmax, m) and 95% (R95%, m) horizontal distances from the source to modelled maximum-over-depth sound exposure levels (SELs; 10 Hz to 2 kHz). ................................. 31
Table 10. Site 02: Maximum (Rmax, m) and 95% (R95%, m) horizontal distances from the source to modelled maximum-over-depth root-mean-square (rms) sound pressure levels (SPLs; 10 Hz to 2 kHz). ................................................................................................................................................... 31
Table 11. Site 02, April: Maximum (Rmax, m) and 95% (R95%, m) horizontal distances from the source to modelled maximum-over-depth sound exposure levels (SELs; 10 Hz to 2 kHz), with and without M-weighting applied................................................................................................................. 31
Table 12. Site 02, September: Maximum (Rmax, m) and 95% (R95%, m) horizontal distances from the source to modelled maximum-over-depth sound exposure levels (SELs; 10 Hz to 2 kHz), with and without M-weighting applied. ......................................................................................................... 32
Table 13. Site 03: Maximum (Rmax, m) and 95% (R95%, m) horizontal distances from the source to modelled maximum-over-depth sound exposure levels (SELs; 10 Hz to 2 kHz). ................................. 35
Table 14. Site 03: Maximum (Rmax, m) and 95% (R95%, m) horizontal distances from the source to modelled maximum-over-depth root-mean-square (rms) sound pressure levels (SPLs; 10 Hz to 2 kHz). ................................................................................................................................................... 35
Table 15. Site 03, April: Maximum (Rmax, m) and 95% (R95%, m) horizontal distances from the source to modelled maximum-over-depth sound exposure levels (SELs; 10 Hz to 2 kHz), with and without M-weighting applied................................................................................................................. 35

Version 5.0 xii
Table 16. Site 03, September: Maximum (Rmax, m) and 95% (R95%, m) horizontal distances from the source to modelled maximum-over-depth sound exposure levels (SELs; 10 Hz to 2 kHz), with and without M-weighting applied. ......................................................................................................... 36
Table 17. April: Maximum (Rmax, m) and 95% (R95%, m) horizontal distances from the source to modelled maximum-over-depth root-mean-square (rms) sound pressure levels (SPLs; 10 Hz to 2 kHz). ................................................................................................................................................... 37
Table 18. September: Maximum (Rmax, m) and 95% (R95%, m) horizontal distances from the source to modelled maximum-over-depth root-mean-square (rms) sound pressure levels (SPLs; 10 Hz to 2 kHz). ................................................................................................................................................... 37

Version 5.0 1
1. Introduction
1.1. Project Overview and Modelling Approach JASCO Applied Sciences (JASCO) conducted a modelling study for LGL Limited (LGL) to predict the underwater sound levels propagating from a seismic airgun array during Shell Canada Limited (Shell) 3-D seismic survey operations. Shell’s Shelburne Basin 3-D Seismic Survey will be conducted within and near Exploration Licenses 2423, 2424, 2425, and 2426, located approximately 350 km south of Halifax, Nova Scotia.
Shell plans to conduct this seismic survey using a Wide Azimuth (WAZ) configuration. This configuration includes multiple vessels (four are proposed for the 2013 survey) towing identical airgun arrays that are activated sequentially, i.e., only one airgun array at a time is activated across all vessels. For purposes of the environmental assessment (EA), JASCO modelled a 24-airgun array with a total volume of 5085 in3. This array was selected to represent the upper end of the proposed array volume range for the 2013 WAZ survey. This modelling study is intended to provide reasonable scenarios illustrating the (per pulse) sound levels potentially reached during the survey.
The underwater acoustic signature of the array was predicted with a specialized computer model that accounts for individual airgun volumes and the array geometry. Sound levels at distances from the airgun array were predicted with two underwater acoustic propagation models in conjunction with the modelled source levels. These predictions were made for at least two water temperature profiles representative of the operational months (April to September), accounting for range-dependent environmental properties in the area.
This report presents the modelled results as per-pulse (i.e., “single-shot”) sound fields; each sound field represents a single pulse from a single airgun array. Sections 0 and 1.3 explain the different metrics commonly used to represent underwater acoustic fields. Section 2 discusses the methodology for predicting the source levels and modelling sound propagation. Section 3 describes the specifications of the source, the modelled source locations, and all environmental parameters used in the propagation model. Section 4 presents the model results in two formats: tables of maximum and 95% distances to sound levels and sound field contour maps that show the directivity and range to various sound levels. The distances from the airgun array to specific levels are provided (in 10 dB increments) for:
un-weighted sound exposure levels (SELs) of 200 to at least 150 dB re 1 µPa2·s, M-weighted SELs of 200 to at least 150 dB re 1 µPa2·s for each marine mammal functional hearing
group (in water), and root-mean-square (rms) sound pressure levels (SPLs) of 200 to at least 150 dB re 1 µPa.
These results include (but are not restricted to) the estimates most relevant to the EA.

Version 5.0 2
1.2. Acoustic Metrics Underwater sound amplitude is measured in decibels (dB), relative to a standard reference pressure of pο = 1 µPa. Several sound level metrics are commonly used to describe impulsive noise. The primary sound level metrics of relevance to this report (and the EA) are 90% root-mean-square (rms) sound pressure level (SPL), and sound exposure level (SEL). The 90% energy rms SPL (dB re 1 µPa, symbol Lp90) is the rms pressure level over the time window T90:
22
901090
90
)(1
log10 pdttpT
LT
p (1)
where T90 is the time interval containing the central 90% (from 5% to 95% of the total) of the pulse energy. The 90% rms SPL can be thought as a measure of the average pressure or as the “effective” pressure over the duration of an acoustic event, such as the emission of one acoustic pulse. Because the window length, T90, is used as a divisor, pulses that are more spread out in time have a lower rms SPL for the same total acoustic energy.
The SEL (dB re 1 µPa2·s, ANSI symbol LE) is the time integral of the squared pressure over a fixed time window containing the entire pulse, T100:
22
10
100
)(log10 pTdttpLT
E
(2)
where To is a reference time interval of 1 s. The per-pulse SEL is measured in units of dB re 1 µPa·√s or equivalently dB re 1 μPa2·s. This measure represents the total energy delivered over the duration of an acoustic event at a receiver location. It is related to sound energy (or exposure) rather than sound pressure. SEL can be a metric that describes the sound level for a single sound pulse, or a cumulative metric if applied over time periods containing multiple pulses.
Because the 90% rms SPL and SEL are both computed from the integral of square pressure, these metrics are related numerically by an expression (Equation 3), which depends on the duration of the 90% integration time window, T90:
458.0log10 9090 TTLL Ep (3)
where the 0.458 dB factor accounts for the rms SPL containing 90% of the total energy from the per-pulse SEL (Malme et al. 1986; Greene 1997; McCauley et al. 1998). T90 is, however, sensitive to the specific multipath arrival pattern and can vary greatly with distance from the source or with depth of the receiver. Thus the 90% rms SPL metric is generally difficult to model because of the adaptive integration period implicit in the definition of the 90% rms SPL (see Section 2.3).
1.3. Marine Mammal Frequency Weighting The potential for anthropogenic noise to impact marine animals depends in large part on how well the species can hear the noise (Southall et al. 2007). Noise is less likely to disturb or result in hearing impairment to animals if it is at frequencies that the animals cannot hear well. A suspected exception is when the sound pressure is so high that it can cause physical injury. For non-injurious sound levels, frequency weighting based on audiograms may be applied to weight the importance of sound levels at

Version 5.0 3
particular frequencies in a manner reflective of the receiver’s sensitivity to those frequencies (Nedwell and Turnpenny 1998; Nedwell et al. 2007).
Based on a literature review of marine mammal hearing and on physiological and behavioural responses to anthropogenic sound, Southall et al. (2007) proposed standard frequency weighting functions—referred to as M-weighting functions—for five functional hearing groups of marine mammals:
Low-frequency cetaceans (LFCs)—mysticetes (baleen whales); Mid-frequency cetaceans (MFCs)—some odontocetes (toothed whales); High-frequency cetaceans (HFCs)—odontocetes specialized for using high-frequencies; Pinnipeds in water (Pw)—seals, sea lions, and walrus; and Pinnipeds in air (not addressed in this report).
The discount applied by M-weighting functions for less-audible frequencies is less than that indicated by the corresponding audiograms (where available) for member species of these hearing groups. The rationale for applying a smaller discount than suggested by audiograms is due in part to an observed characteristic of mammalian hearing that perceived equal loudness curves increasingly have less rapid roll-off outside the most sensitive hearing frequency range as sound levels increase (Southall et al. 2007). This is why, for example, C-weighting curves for humans, used for assessing loud sounds such as blasts, are flatter than A-weighting curves, used for quiet to mid-level sounds. Additionally, out-of-band frequencies, though less audible, can still cause physical injury if pressure levels are sufficiently high. The M-weighting functions therefore are primarily intended to be applied at high sound levels where impacts such as temporary or permanent hearing threshold shifts may occur. The shapes of the audiogram curves overemphasize auditory acuity outside the most sensitive hearing range. Therefore, the use of M-weighting is considered precautionary (in the sense of overestimating the potential for impact) when applied to lower level impacts such as onset of behavioural response. Figure 1 shows the decibel frequency weighting of the four underwater M-weighting functions.
Figure 1. The standard M-weighting functions for the four underwater functional marine mammal hearing groups (Southall et al. 2007).
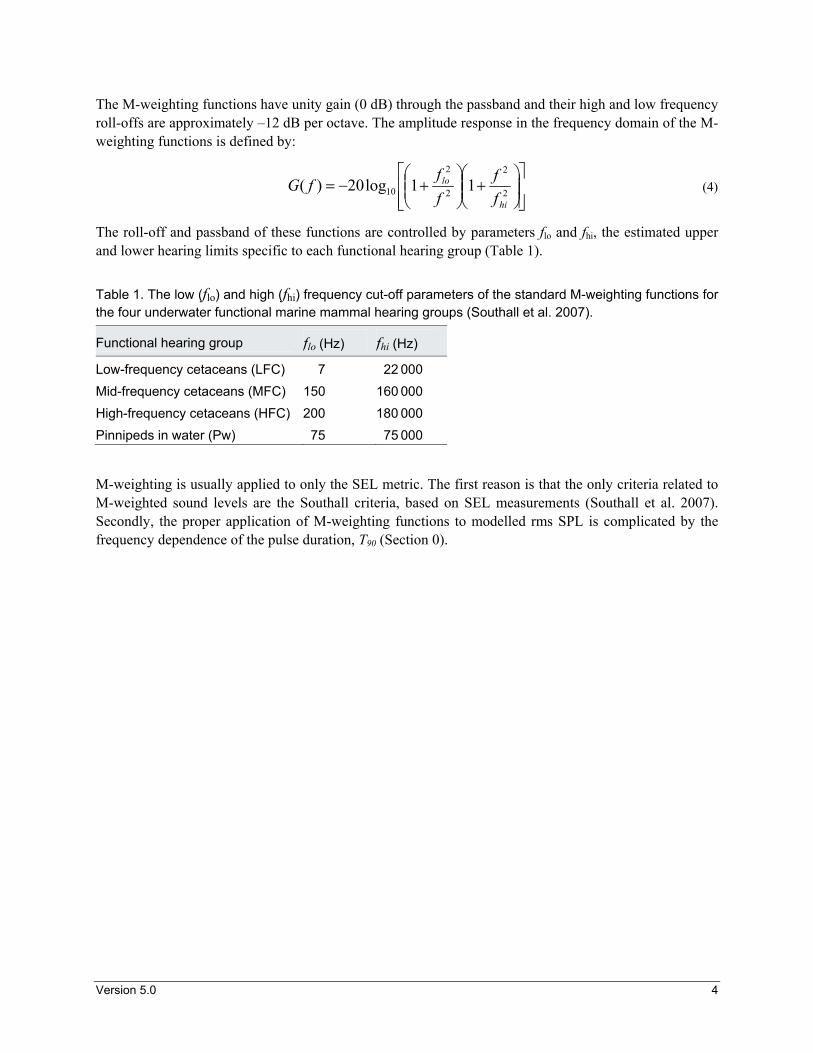
Version 5.0 4
The M-weighting functions have unity gain (0 dB) through the passband and their high and low frequency roll-offs are approximately –12 dB per octave. The amplitude response in the frequency domain of the M-weighting functions is defined by:
2
2
2
2
10 11log20)(hi
lo
f
f
f
ffG (4)
The roll-off and passband of these functions are controlled by parameters flo and fhi, the estimated upper and lower hearing limits specific to each functional hearing group (Table 1).
Table 1. The low (flo) and high (fhi) frequency cut-off parameters of the standard M-weighting functions for the four underwater functional marine mammal hearing groups (Southall et al. 2007).
Functional hearing group flo (Hz) fhi (Hz)
Low-frequency cetaceans (LFC) 7 22 000
Mid-frequency cetaceans (MFC) 150 160 000
High-frequency cetaceans (HFC) 200 180 000
Pinnipeds in water (Pw) 75 75 000
M-weighting is usually applied to only the SEL metric. The first reason is that the only criteria related to M-weighted sound levels are the Southall criteria, based on SEL measurements (Southall et al. 2007). Secondly, the proper application of M-weighting functions to modelled rms SPL is complicated by the frequency dependence of the pulse duration, T90 (Section 0).

Version 5.0 5
2. Methods
2.1. Acoustic Source Model The source levels and directivity of the airgun array were predicted with JASCO’s Airgun Array Source Model (AASM; MacGillivray 2006). This model is based on the physics of oscillation and radiation of airgun bubbles described by Ziolkowski (1970). The model solves the set of parallel differential equations governing bubble oscillations. AASM also accounts for nonlinear pressure interactions among airguns, port throttling, bubble damping, and generator-injector (GI) airgun behaviour that are discussed by Dragoset (1984), Laws et al. (1990), and Landro (1992). AASM includes four empirical parameters that were tuned so model output matches observed airgun behaviour. The model parameters fit to a large library of empirical airgun data using a “simulated annealing” global optimization algorithm. These airgun data are measurements of the signatures of Bolt 600/B airguns ranging in volume from 5 to 185 in3 (Racca and Scrimger 1986).
AASM produces a set of “notional” signatures for each array element based on:
Array layout, Volume, tow depth, and firing pressure of each airgun, and Interactions between airguns in the array.
These notional signatures are the pressure waveforms of the individual airguns at a standard reference distance of 1 m, and they account for the interactions with the other airguns in the array. The signatures are summed with the appropriate phase delays to obtain the far-field1 source signature of the entire array in all directions. This far-field array signature is filtered into 1/3-octave passbands to compute the source levels of the array as a function of frequency band and azimuthal angle in the horizontal plane (at the source depth). It can then be treated as a directional point source in the far field.
A seismic array consists of many sources and the point-source assumption is not valid in the near field where the array elements add incoherently. The maximum extent of the near field of an array (Rnf) is:
4
2lRnf (5)
where λ is the sound wavelength and l is the longest dimension of the array (Lurton 2002, §5.2.4). For example, for the airgun array described in Section 3.1, l ≈ 32 m so the maximum near-field range is 1.7 m at 10 Hz and 341 m at 2 000 Hz. Beyond these ranges the array is assumed to radiate like a directional point source and is treated as such for propagation modelling.
The interactions between individual elements of the array create directionality in the overall acoustic emission. Generally, this directionality is prominent mainly at frequencies in the mid-range of several tens to several hundred hertz; at lower frequencies, with acoustic wavelengths much larger than the inter-airgun separation distances, directivity is small. At higher frequencies the pattern of lobes is too finely spaced to be resolved and the effective directivity is less.
1 The far field is the zone where, to an observer, sound originating from a spatially-distributed source
appears to radiate from a single point. The distance to the acoustic far field increases with frequency.

Version 5.0 6
The pressure signatures of the individual airguns and the composite 1/3-octave band source levels of the array, as functions of azimuthal angle (in the horizontal plane), were computed with AASM as described in Section 2.1. While effects of source depth on bubble interactions is accounted for in the AASM source model, the surface-reflected signal (i.e., surface ghost) is not included in the far-field source signatures. The surface reflections, a property of the medium rather than the source, are accounted for by the acoustic propagation models.
2.2. Sound Propagation Models Underwater sound propagation (i.e., transmission loss) at frequencies of 10 Hz to 2 kHz was predicted with JASCO’s Marine Operations Noise Model (MONM) and Full Waveform Range Dependent Acoustic Model (FWRAM). Although received rms SPLs are easily measured in situ, modelling them requires a full-waveform model (like FWRAM), which would be prohibitively time consuming for this study; therefore, received per-pulse SELs in all directions were modelled with MONM, and both the received per-pulse SELs and rms SPLs were modelled with FWRAM along only a select few transects. The FWRAM results were then used to convert the MONM results from SELs to rms SPLs (see Section 2.3 for details).
MONM computes acoustic propagation via a wide-angle parabolic equation solution to the acoustic wave equation (Collins 1993) based on a version of the U.S. Naval Research Laboratory’s Range-dependent Acoustic Model (RAM), which has been modified to account for an elastic seabed. The parabolic equation method has been extensively benchmarked and is widely employed in the underwater acoustics community (Collins et al. 1996). MONM accounts for the additional reflection loss at the seabed due to partial conversion of incident compressional waves to shear waves at the seabed and sub-bottom interfaces, and it includes wave attenuations in all layers. MONM incorporates the following site-specific environmental properties: a bathymetric grid of the modelled area, underwater sound speed as a function of depth, and a geoacoustic profile based on the overall stratified composition of the seafloor.
MONM computes acoustic fields in three dimensions by modelling transmission loss within two-dimensional (2-D) vertical planes aligned along radials covering a 360° swath from the source, an approach commonly referred to as N×2-D. These vertical radial planes are separated by an angular step size of , yielding N = 360°/ number of planes (Figure 2).
MONM treats frequency dependence by computing acoustic transmission loss at the centre frequencies of 1/3-octave bands. Sufficiently many 1/3-octave bands, starting at 10 Hz, are modelled to include the majority of acoustic energy emitted by the source. At each centre frequency, the transmission loss is modelled within each vertical plane (N×2-D) as a function of depth and range from the source. The 1/3-octave band received (per-pulse) SELs are computed by subtracting the band transmission loss values from the directional SL in that frequency band. Composite broadband received SELs are then computed by summing the received 1/3-octave band levels.
The received SEL sound field within each vertical radial plane is sampled at various ranges from the source, generally with a fixed radial step size. At each sampling range along the surface, the sound field is sampled at various depths, with the step size between samples increasing with depth below the surface. The step sizes are chosen to provide increased coverage near the depth of the source and at depths of interest in terms of the sound speed profile. For areas with deep water (> 2 000 m), sampling may not be performed at depths beyond the diving capabilities of marine mammals in the area of interest. For this study, the entire water column was sampled. The received SEL at a sampling location is taken as the

Version 5.0 7
maximum value that occurs over all samples within the water column below, i.e., the maximum-over-depth received SEL (Figure 2). These maximum-over-depth SELs are presented as colour contours around the source (e.g., Figure 3).
Figure 2. Representation of N×2-D and maximum-over-depth approaches.

Version 5.0 8
Figure 3. Example of maximum-over-depth sound exposure levels (SELs) colour contours maps for two different sources.
MONM’s predictions have been validated against experimental data from several sound source verification programs conducted by JASCO (Hannay and Racca 2005; Aerts et al. 2008; Funk et al. 2008; Ireland et al. 2009; O’Neill et al. 2010; Warner et al. 2010). An inherent variability in measured sound levels is caused by temporal variability in the environment and the variability in the signature of repeated acoustic impulses (sample sound source verification results are presented in Figure 4). While MONM’s predictions correspond to the averaged received levels, cautionary estimates of the threshold radii are obtained by shifting the best fit line (solid line, Figure 4) upward so that the trend line encompasses 90% of all the data (dashed line, Figure 4).
Figure 4. Peak and root-mean-square (rms) sound pressure level (SPL) and sound exposure level (SEL) versus range from a 20 in3 airgun array. Solid line is the least squares best fit to rms SPL. Dashed line is the best fit line increased by 3.0 dB to exceed 90% of all rms SPL values (90th percentile fit) (Fig. 10 in Ireland et al. 2009).
In the regions of the Beaufort and Chukchi Seas, sound source verification results show that this 90th percentile best-fit is, on average, 3 dB higher than the original best fit line for sources in water depths
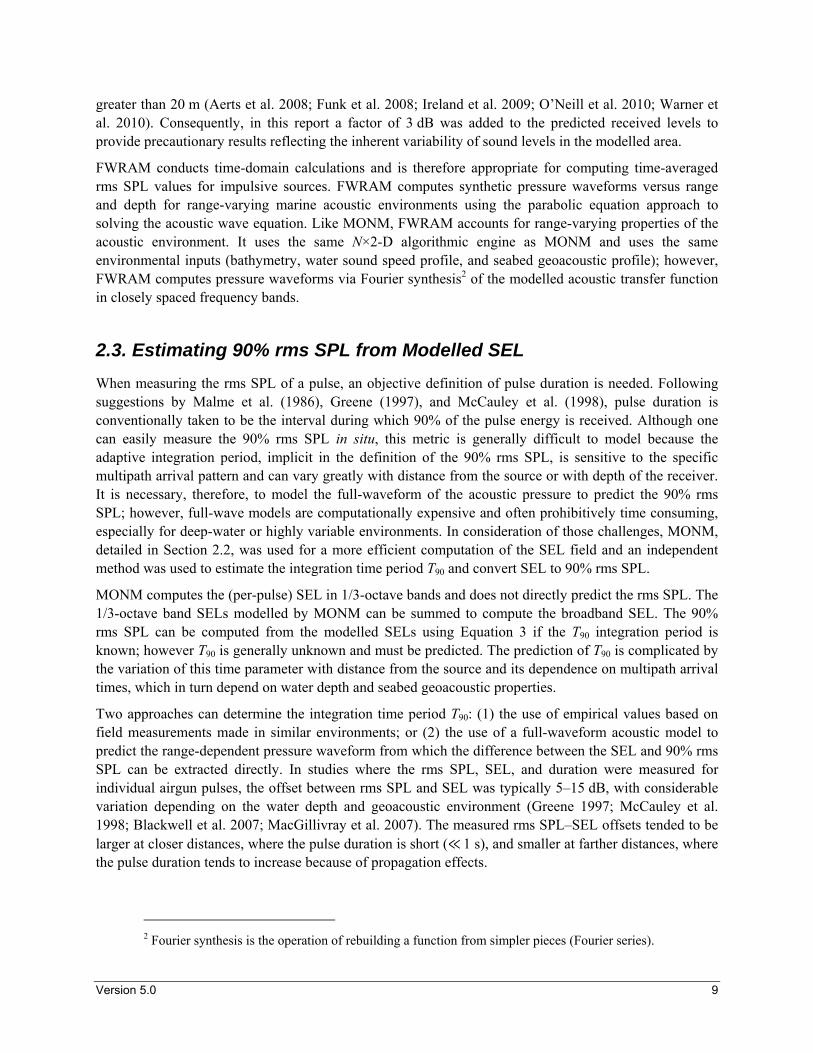
Version 5.0 9
greater than 20 m (Aerts et al. 2008; Funk et al. 2008; Ireland et al. 2009; O’Neill et al. 2010; Warner et al. 2010). Consequently, in this report a factor of 3 dB was added to the predicted received levels to provide precautionary results reflecting the inherent variability of sound levels in the modelled area.
FWRAM conducts time-domain calculations and is therefore appropriate for computing time-averaged rms SPL values for impulsive sources. FWRAM computes synthetic pressure waveforms versus range and depth for range-varying marine acoustic environments using the parabolic equation approach to solving the acoustic wave equation. Like MONM, FWRAM accounts for range-varying properties of the acoustic environment. It uses the same N×2-D algorithmic engine as MONM and uses the same environmental inputs (bathymetry, water sound speed profile, and seabed geoacoustic profile); however, FWRAM computes pressure waveforms via Fourier synthesis2 of the modelled acoustic transfer function in closely spaced frequency bands.
2.3. Estimating 90% rms SPL from Modelled SEL When measuring the rms SPL of a pulse, an objective definition of pulse duration is needed. Following suggestions by Malme et al. (1986), Greene (1997), and McCauley et al. (1998), pulse duration is conventionally taken to be the interval during which 90% of the pulse energy is received. Although one can easily measure the 90% rms SPL in situ, this metric is generally difficult to model because the adaptive integration period, implicit in the definition of the 90% rms SPL, is sensitive to the specific multipath arrival pattern and can vary greatly with distance from the source or with depth of the receiver. It is necessary, therefore, to model the full-waveform of the acoustic pressure to predict the 90% rms SPL; however, full-wave models are computationally expensive and often prohibitively time consuming, especially for deep-water or highly variable environments. In consideration of those challenges, MONM, detailed in Section 2.2, was used for a more efficient computation of the SEL field and an independent method was used to estimate the integration time period T90 and convert SEL to 90% rms SPL.
MONM computes the (per-pulse) SEL in 1/3-octave bands and does not directly predict the rms SPL. The 1/3-octave band SELs modelled by MONM can be summed to compute the broadband SEL. The 90% rms SPL can be computed from the modelled SELs using Equation 3 if the T90 integration period is known; however T90 is generally unknown and must be predicted. The prediction of T90 is complicated by the variation of this time parameter with distance from the source and its dependence on multipath arrival times, which in turn depend on water depth and seabed geoacoustic properties.
Two approaches can determine the integration time period T90: (1) the use of empirical values based on field measurements made in similar environments; or (2) the use of a full-waveform acoustic model to predict the range-dependent pressure waveform from which the difference between the SEL and 90% rms SPL can be extracted directly. In studies where the rms SPL, SEL, and duration were measured for individual airgun pulses, the offset between rms SPL and SEL was typically 5–15 dB, with considerable variation depending on the water depth and geoacoustic environment (Greene 1997; McCauley et al. 1998; Blackwell et al. 2007; MacGillivray et al. 2007). The measured rms SPL–SEL offsets tended to be larger at closer distances, where the pulse duration is short (≪ 1 s), and smaller at farther distances, where the pulse duration tends to increase because of propagation effects.
2 Fourier synthesis is the operation of rebuilding a function from simpler pieces (Fourier series).

Version 5.0 10
A full-waveform acoustic propagation model, such as JASCO’s FWRAM, can be used to estimate both rms SPL and SEL as functions of range for a small set of representative transects. The offset between them can then be interpolated between transects and applied to the SELs predicted by MONM. This approach combines the precise pulse length provided by FWRAM with the greater computational efficiency of MONM. For the conversion of the acoustic field in SEL units to rms SPL units, appropriate rms SPL–SEL range dependent functions are selected from the set of representative transects based on the water depth and bottom type.
For this study, the second approach, predictive full-waveform acoustic modelling, was chosen, because of the lack of empirical values for environments similar to the deep waters off the Scotian Shelf. The full-waveform sound propagation was modelled with FWRAM along one transect at each site. These transects are parallel to the tow direction, extending 50 km from the source. For each modelled site, the offsets between the FWRAM-modelled SELs and rms SPLs (example in Figure 5) yielded the range-dependent SEL to rms SPL offset functions (Figure 6) that were used to convert the MONM-modelled sound fields from SELs to rms SPLs.
Figure 5. Offset of sound exposure levels (SELs) to root-mean-square (rms) sound pressure levels (SPLs) modelled with Full Waveform Range-dependent Acoustic Model (FWRAM) (black dots) and the SEL to rms SPL conversion function (red line) for the Site 01 transect parallel to the tow direction.

Version 5.0 11
Figure 6. Sound exposure level (SEL) to root-mean-square (rms) sound pressure level (SPL) conversion functions for each modelled site. These range-dependent functions were used to convert the Marine Operations Noise Model (MONM) results from SEL to rms SPL.

Version 5.0 12
3. Model Parameters
3.1. Acoustic Source Shell’s seismic survey will utilize a Wide Azimuth (WAZ) configuration involving multiple vessels (four are proposed for the 2013 survey) towing identical airgun arrays that are activated sequentially, i.e., only one airgun array at a time is activated across all vessels. For the purposes of the EA, sound modelling was completed for one array. This array was selected to represent the upper end of the proposed array volume range for the 2013 WAZ survey. It represents a reasonable scenario for illustrating the (per pulse) sound levels potentially reached during the survey.
The modelled seismic array consists of 24 active airguns, all at a tow depth of 10 m. It is divided into three identical sub-arrays (or strings) each separated by 8 m. Each sub-array is 15 m long and contains 8 airguns. The airguns are activated simultaneously at 2000 psi air pressure, for a total volume of 5085 in3 (Figure 7).
Figure 7. Layout of the modelled airgun array composed of 24 active airguns (5085 in3 total volume, 10 m tow depth). Relative symbol sizes and labels indicate airgun volume.
3.2. Environmental Parameters The Shelburne Basin Project Area is located approximately 350 km south of Halifax, NS. Figure 8 presents an overview of the region. Three sites, shown in Figure 8 and

Version 5.0 13
Table 2, were chosen to sample the sound propagation properties within the Project Area:
Site 01 is closest to the North Atlantic Right Whale Critical Habitat (NARWCH). This critical habitat located in the Roseway Basin is, at its closest point, ~105 km from the 2013 Proposed Seismic Area and ~41 km from the Project Area (Figure 8);
Site 02 is the northern-most point of the 2013 Proposed Seismic Area and the closest to the Haddock Box; and
Site 03 is the southern-most point of the 2013 Proposed Seismic Area. It is also the farthest point from the continental shelf break, located in the deepest water within the 2013 Proposed Seismic Area.
In the EA, the Roseway Basin NARWCH and the Haddock Box are considered Special Areas and required detailed assessment. In summer and autumn, a large portion of the endangered North Atlantic right whale population feed and socializes in Roseway Basin. The Haddock Box was established with the intention of protecting incoming haddock recruits and assisting the rebuilding of the stock. These two Special Areas are noted on all sound field contour maps presented in this report.
Figure 8. Location of the modelled sites within the Project Area, 350 km south of Halifax, NS.
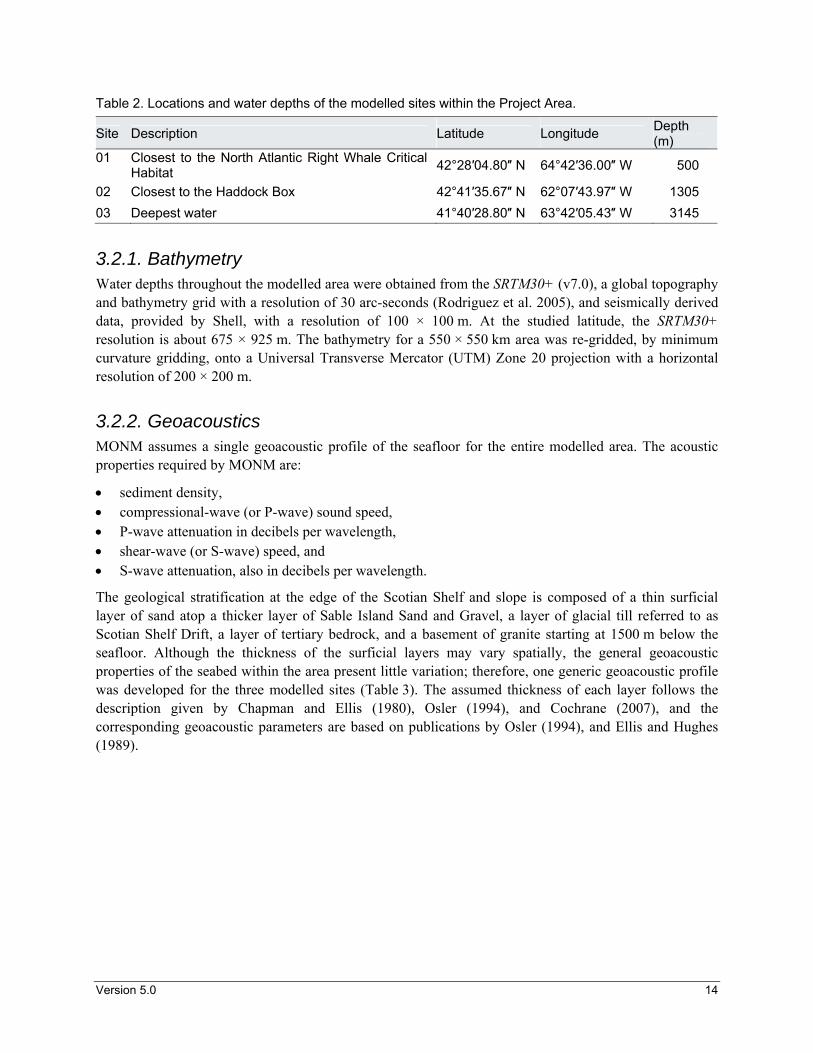
Version 5.0 14
Table 2. Locations and water depths of the modelled sites within the Project Area.
Site Description Latitude Longitude Depth (m)
01 Closest to the North Atlantic Right Whale Critical Habitat
42°28′04.80″ N 64°42′36.00″ W 500
02 Closest to the Haddock Box 42°41′35.67″ N 62°07′43.97″ W 1305
03 Deepest water 41°40′28.80″ N 63°42′05.43″ W 3145
3.2.1. Bathymetry Water depths throughout the modelled area were obtained from the SRTM30+ (v7.0), a global topography and bathymetry grid with a resolution of 30 arc-seconds (Rodriguez et al. 2005), and seismically derived data, provided by Shell, with a resolution of 100 × 100 m. At the studied latitude, the SRTM30+ resolution is about 675 × 925 m. The bathymetry for a 550 × 550 km area was re-gridded, by minimum curvature gridding, onto a Universal Transverse Mercator (UTM) Zone 20 projection with a horizontal resolution of 200 × 200 m.
3.2.2. Geoacoustics MONM assumes a single geoacoustic profile of the seafloor for the entire modelled area. The acoustic properties required by MONM are:
sediment density, compressional-wave (or P-wave) sound speed, P-wave attenuation in decibels per wavelength, shear-wave (or S-wave) speed, and S-wave attenuation, also in decibels per wavelength.
The geological stratification at the edge of the Scotian Shelf and slope is composed of a thin surficial layer of sand atop a thicker layer of Sable Island Sand and Gravel, a layer of glacial till referred to as Scotian Shelf Drift, a layer of tertiary bedrock, and a basement of granite starting at 1500 m below the seafloor. Although the thickness of the surficial layers may vary spatially, the general geoacoustic properties of the seabed within the area present little variation; therefore, one generic geoacoustic profile was developed for the three modelled sites (Table 3). The assumed thickness of each layer follows the description given by Chapman and Ellis (1980), Osler (1994), and Cochrane (2007), and the corresponding geoacoustic parameters are based on publications by Osler (1994), and Ellis and Hughes (1989).

Version 5.0 15
Table 3. Estimated geoacoustic profile for Sites 01–03 representing a multi-layered sandy bottom. Within each sediment layer, parameters vary linearly within the stated range.
Depth below seafloor (m)
Material Density (g/cm3)
P-wave speed (m/s)
P-wave attenuation (dB/λ)
S-wave speed (m/s)
S-wave attenuation (dB/λ)
0–2 Sand 1.9–2.0 1700–1800 0.85–0.36
200 2.0 2–50
Sable Island Sand and Gravel
2.0–2.1 1800–2000 0.36–1.00
50–100 Scotian Shelf Drift 2.0–2.2 1900–2100 0.47–0.21 100–1500 Tertiary bedrock 2.2–2.6 2100–5500 0.21–0.28 > 1500 Granite 2.6 5500 0.28
3.2.3. Sound Speed Profile The sound speed profiles for the modelled sites were derived from temperature and salinity profiles from the US Naval Oceanographic Office’s Generalized Digital Environmental Model V 3.0 (GDEM; Teague et al. 1990; Carnes 2009). GDEM provides an ocean climatology of temperature and salinity for the world’s oceans on a latitude-longitude grid with 0.25° resolution, with a temporal resolution of one month, based on global historical observations from the US Navy’s Master Oceanographic Observation Data Set (MOODS). The climatology profiles include 78 fixed depth points, up to a maximum depth of 6800 m (where the ocean is that deep), including 55 standard depths between 0 and 2000 m. The GDEM temperature-salinity profiles were converted to sound speed profiles (c) according to the equations of Coppens (1981):
10
2cos0026.011000
18.03.16
35009.0126.0333.1
23.021.57.4505.1449),,,(
2
2
32
Tt
zZ
ZZ
Stt
tttSTzc
(6)
where z is water depth (m), T is temperature (°C), S is salinity (psu), and ϕ is latitude (radians).
The seismic survey is planned for April through September 2013. Sound speed profiles were derived from GDEM temperature and salinity profiles for each of these months within the Project Area (Figure 9).

Version 5.0 16
Deep water Shallow water
Figure 9. Monthly sound speed profiles in deep (> 200 m) and shallow (≤ 200 m) waters within the Project Area, derived from the GDEM ocean climatology of temperature and salinity (Teague et al. 1990; Carnes 2009).
In both deep and shallow waters, the monthly variation occurs mainly in the upper 100 m of the profile. From April to September, this upper section of the profile varies from upward refracting (sound speed increases with depth) to downward refracting (sound speed decreases with depth). Sound speed profiles in the mid-latitude regions of the globe tend to develop a surface duct or a sound channel (a well-defined minimum in the sound speed) in the spring to summer months. In the modelled area, the sound speed profile for April is most conducive to sound propagation because the sound tends to be refracted within the upper 100 m. This feature implies lower transmission loss over shallow areas (less than 200 m) because of fewer bottom interactions over range.
Small differences in sound propagation are expected between the months of July and September when the profile is mainly downward refracting in the upper water layer. This feature implies greater transmission loss over shallow areas because of significant bottom interactions over range.
Sound propagation was modelled for the months of April to June, and September at Site 01 to provide an example of the variation in the distances to sound levels over the shallower continental shelf. Since April is the most conducive to sound propagation toward shallower water, and September the least, sound levels for these two months were also modelled at Sites 02 and 03 to show the maximum variation of sound propagation in these two areas.
3.3. Geometry and Modelled Volumes For each of the three sites, sound fields from single seismic pulses were modelled over two areas at different resolutions, fine resolution close to the source and coarser resolution farther from the source. The first area was 10 × 10 km centred on the source, with a horizontal separation of 5 m between receiver points along the modelled radials. This area was modelled to resolve the detailed features of the sound

Version 5.0 17
footprint, close to the source. The second area was limited to 200 × 200 km centred on the source, with a horizontal separation of 50 m between receiver points. This resolution is detailed enough to model the significant features of the sound footprint without loss of accuracy. Within the 200 × 200 km area, distance to sound levels as low as 140 dB re 1 µPa2·s can be estimated. In each area, sound fields were modelled with a horizontal angular resolution of = 2.5° for a total of N = 144 radial planes.
The receiver depths span the entire water column over the modelled areas, from 1 to 4000 m, with step sizes that increase with depth. For all sites, the vertical step size increased from 1.5 to 500 m, with increasing depth.
The array tow direction was set to 252° east of UTM north, i.e., parallel to the 2013 Proposed Seismic Area boundary and to the continental slope. By orientating the array’s broadside perpendicular to the continental slope, the angles of high source levels (Section 4.1) are oriented towards deep water. Sound generally propagates farther in deep water because of fewer bottom interactions and, therefore, a lower attenuation rate. Thus, a tow direction of 252° is estimated to produce precautionary (longer) distances to specific sound levels. The array was modelled at a tow depth of 10.0 m.

Version 5.0 18
4. Results
4.1. Acoustic Source Levels and Directivity In this study, the source levels and signatures for the 5085 in3 airgun array acted, respectively, as the acoustic source for the MONM and FWRAM sound propagation models.
The horizontal overpressure signatures and corresponding power spectrum levels for the array, at a tow depth of 10 m, were computed at frequencies between 10 Hz and 2 kHz. They are shown in Figure 10 for the broadside (perpendicular to the tow direction) and endfire (parallel to the tow direction) directions. The signatures consist of a strong primary peak related to the initial firing of the airguns, followed by a series of pulses associated with bubble oscillations. Most energy is produced at frequencies below 200 Hz (Figure 10b). The spectrum contains peaks and nulls resulting from interference among airguns in the array, where the frequencies at which they occur depend on the volumes of the airguns and their locations within the array.
(a) (b)
Figure 10. Predicted (a) overpressure signature and (b) spectral density in the broadside and endfire (horizontal) directions for the modelled 5085 in3 airgun array, at 10 m tow depth. Surface ghosts (effects of the pulse reflection at the water surface) are not included in these signatures.
Horizontal zero-to-peak SPL and SEL levels also show the source level difference between the broadside and endfire directions. In the broadside direction, levels were estimated to be 246.8 dB re 1 µPa and 230.2 dB re 1 µPa2·s, respectively, and in the endfire direction they were estimated to be slightly higher at 248.2 dB re 1 µPa and 230.9 dB re 1 µPa2·s, respectively, (Table 4).

Version 5.0 19
Table 4. Horizontal source level specifications (10–2000 Hz) for the modelled 5085 in3 airgun array, at 10 m tow depth, computed with Airgun Array Source Model (AASM) in the broadside and endfire directions. Surface ghost effects are not included as they are accounted for by the Marine Operations Noise Model (MONM) propagation model.
Figure 11. Maximum directional source level (SL) in the horizontal plan, in each 1/3-octave band, for the 5085 in3 airgun array, at 10 m tow depth.
The maximum (horizontal) 1/3-octave band sound levels over all directions are plotted in Figure 11. The horizontal 1/3-octave band directivities are shown in Figure 12. In these plots the arrow indicates the tow direction of the array and the solid black curves indicate source levels in dB re 1 µPa2·s, as a function of angle in the horizontal plane, referenced to a fixed radial dB level scale (dashed circles).
The general trend for the spectral levels is to decrease with increasing frequency. The source directivity becomes significant above 100 Hz while most of the array energy is contained in frequencies up to 500 Hz, implying that a significant amount of energy does not equally propagate in all directions. Most of the energy propagates within narrow angles in the endfire and broadband directions. Consequently, the array tow direction, in relation to the local bathymetry, may significantly influence distances to sound levels. For example, in this study, sound is expected to propagate farther in a direction perpendicular to the continental slope. Therefore, based on the source directivity, modelled distances to sound levels are expected to be longer for an array tow direction parallel or perpendicular to the continental slope than those expected for a tow direction a few degrees (e.g., ~30°) off the general slope direction.
Direction Zero-to-peak SPL (dB re 1 µPa @ 1 m)
SEL (dB re 1 µPa2 @ 1 m)
0.01–2 kHz 0.01–1 kHz 1–2 kHz
Broadside 246.8 230.2 230.2 172.0
Endfire 248.2 230.9 230.9 182.0

Version 5.0 20
Figure 12. Directionality of predicted horizontal source levels (SLs, dB re 1 µPa2·s) in 1/3-octave bands for the modelled 5085 in3 airgun array, at 10 m tow depth. The 1/3-octave band centre frequencies are indicated above each plot.

Version 5.0 21
4.2. Sound Fields The underwater sound fields predicted by the propagation model were sampled such that the received sound level at each point in the horizontal plane was taken to be the maximum value over all modelled depths for that point (see Section 2.2). The resultant maximum-over-depth sound fields for each site are presented below in two formats: as tables of distances to sound levels and as contour maps that show the directivity and range to various sound levels.
The predicted distances to specific SELs and rms SPLs were computed from the maximum-over-depth sound fields. Two distances, relative to the source, are reported for each sound level: (1) Rmax, the maximum range at which the given sound level was encountered in the modelled maximum-over-depth sound field; and (2) R95%, the maximum range at which the given sound level was encountered after exclusion of the 5% farthest such points. R95% is provided since the maximum-over-depth sound field footprint may not be circular and along a few azimuths may extend far beyond the main ensonification zone. Regardless of the geometric shape of the maximum-over-depth footprint, R95% is the predicted range encompassing at least 95% of the area (in the horizontal plane) that would be exposed to sound at or above that level. The difference between Rmax and R95% depends on the source directivity and the heterogeneity of the acoustic environment, i.e., the variability of the bathymetry, sound speed profile, and geoacoustics. The R95% excludes the ends of protruding areas that are not representative of the nominal ensonification zone.
Rmax and R95% may vary depending on the orientation of the source and its location within the modelled area. By considering the distances to the sound levels in combination with the maps of the propagated sound field, one can better evaluate the variations in the sound field that occur in the field, when the source tow direction and location vary from those modelled.
Since sound is attenuated on a logarithmic scale, distances to decreasing sound levels increase exponentially. Figure 13 depicts how (maximum-over-depth) SEL decreases with range from the airgun array, and the substantial difference in distances to the 160 and 150 dB levels along one azimuth.
The modelled area was limited to 200 × 200 km, centred on the source. Based on the directivity of the array source levels and the array tow azimuth, some sound contour lines on the maps are cut off at the 120 km limit. This area was not large enough to model the horizontal extent of ≤ 140 dB re 1 µPa2·s levels; however, it allows estimates of maximum distances to sound levels that are most relevant to the environmental assessment. Modelling over a greater area to estimate distances to ≤ 140 dB re 1 µPa2·s would require a model area extending ≥ 500 km south of the Project Area, which would take significant computational resources and produce results with lower accuracy. Section 5 discusses the results that are presented Sections 4.2.1 to 4.2.3.

Version 5.0 22
Figure 13. Maximum-over-depth sound exposure levels (SELs) at Site 01, April, along a bearing of 162˚, i.e., perpendicular to the tow direction, toward deep water.

Version 5.0 23
4.2.1. Site 01 Sound Fields
Figure 14. Sound exposure levels (SELs) at Site 01, April: Received maximum-over-depth sound levels for a single pulse from the 5085 in3 airgun array. Blue contours indicate water depth in metres.
Figure 15. Root-mean-square (rms) sound pressure levels (SPLs) at Site 01, April: Received maximum-over-depth sound levels for a single pulse from the 5085 in3 airgun array. Blue contours indicate water depth in metres.

Version 5.0 24
Figure 16. Sound exposure levels (SELs) at Site 01, May: Received maximum-over-depth sound levels for a single pulse from the 5085 in3 airgun array. Blue contours indicate water depth in metres.
Figure 17. Root-mean-square (rms) sound pressure levels (SPLs) at Site 01, May: Received maximum-over-depth sound levels for a single pulse from the 5085 in3 airgun array. Blue contours indicate water depth in metres.

Version 5.0 25
Figure 18. Sound exposure levels (SELs) at Site 01, June: Received maximum-over-depth sound levels for a single pulse from the 5085 in3 airgun array. Blue contours indicate water depth in metres.
Figure 19. Root-mean-square (rms) sound pressure levels (SPLs) at Site 01, June: Received maximum-over-depth sound levels for a single pulse from the 5085 in3 airgun array. Blue contours indicate water depth in metres.

Version 5.0 26
Figure 20. Sound exposure levels (SELs) at Site 01, September: Received maximum-over-depth sound levels for a single pulse from the 5085 in3 airgun array. Blue contours indicate water depth in metres.
Figure 21. Root-mean-square (rms) sound pressure levels (SPLs) at Site 01, September: Received maximum-over-depth sound levels for a single pulse from the 5085 in3 airgun array. Blue contours indicate water depth in metres.

Version 5.0 27
Table 5. Site 01: Maximum (Rmax, m) and 95% (R95%, m) horizontal distances from the source to modelled maximum-over-depth sound exposure levels (SELs; 10 Hz to 2 kHz).
SEL (dB re 1 µPa2∙s)
April May June September
Rmax
R95%
Rmax
R95%
Rmax
R95%
Rmax
R95%
200 29 25 27 25 27 25 27 25
190 92 80 90 79 90 79 89 78
180 450 372 445 370 445 368 442 363
170 2 808 2 072 2 808 2 049 2 803 2 019 2 801 1 930
160 8 700 6 943 8 700 6 772 8 406 6 580 7 970 6 351
150 58 903 35 489 50 796 24 865 44 974 24 507 36 466 23 982
140 > 120 000 > 120 000 > 120 000 > 120 000
Table 6. Site 01: Maximum (Rmax, m) and 95% (R95%, m) horizontal distances from the source to modelled maximum-over-depth root-mean-square (rms) sound pressure levels (SPLs; 10 Hz to 2 kHz).
rms SPL (dB re 1 µPa)
April May June September
Rmax
R95%
Rmax
R95%
Rmax
R95%
Rmax
R95%
200 58 50 58 50 57 50 56 50
190 204 181 204 181 202 179 200 178
180 1 037 839 1 022 835 1 001 830 994 819
170 5 242 3 462 5 249 3 432 5 249 3 413 5 048 3 358
160 11 647 8 171 11 647 8 023 11 647 7 940 10 868 7 824
150 72 945 44 361 50 856 29 638 47 408 29 677 46 776 28 738
140 > 120 000 > 120 000 > 120 000 > 120 000
Table 7. Site 01, April: Maximum (Rmax, m) and 95% (R95%, m) horizontal distances from the source to modelled maximum-over-depth sound exposure levels (SELs; 10 Hz to 2 kHz), with and without M-weighting applied.
SEL (dB re 1 µPa2∙s)
No Weighting LFC MFC HFC Pw
Rmax 95%
Rmax R95% Rm
ax R
95% R
max R
95% R
max R
95%
200 29 25 27 25 < 5 < 5 < 5 < 5 5 5
190 92 80 87 76 27 27 21 21 43 38
180 450 372 430 347 100 89 74 68 144 125
170 2 808 2 072 2 767 1 804 351 299 271 231 657 531
160 8 700 6 943 8 271 6 574 4 664 2 687 3 208 2 330 5 852 4 238
150 58 903 35 489 58 903 35 580 23 409 15 883 15 989 11 418 40 146 31 939
140 > 120 000 > 120 000 > 120 000 107 823 88 987 > 120 000
130 > 120 000

Version 5.0 28
Table 8. Site 01, September: Maximum (Rmax, m) and 95% (R95%, m) horizontal distances from the source to modelled maximum-over-depth sound exposure levels (SELs; 10 Hz to 2 kHz), with and without M-weighting applied.
SEL (dB re 1 µPa2·s)
No Weighting LFC MFC HFC Pw
Rmax
R95%
Rmax
R95%
Rmax 95%
Rmax
R95%
Rmax
R95%
200 27 25 25 22 < 5 < 5 < 5 < 5 5 5
190 89 78 84 74 27 27 21 21 43 38
180 442 363 423 341 97 87 74 68 142 123
170 2 801 1 930 2 785 1 688 337 291 241 215 941 645
160 7 970 6 351 7 963 5 749 2 694 2 092 2 257 1 484 4 273 2 642
150 36 466 23 982 30 859 21 397 8 746 5 239 5 442 4 368 17 541 8 868
140 > 120 000 > 120 000 82 610 42 591 52 449 21 932 109 586 76 002
130 > 120 000 > 120 000 > 120 000

Version 5.0 29
4.2.2. Site 02 Sound Fields
Figure 22. Sound exposure levels (SELs) at Site 02, April: Received maximum-over-depth sound levels for a single pulse from the 5085 in3 airgun array. Blue contours indicate water depth in metres.
Figure 23. Root-mean-square (rms) sound pressure levels (SPLs) at Site 02, April: Received maximum-over-depth sound levels for a single pulse from the 5085 in3 airgun array. Blue contours indicate water depth in metres.
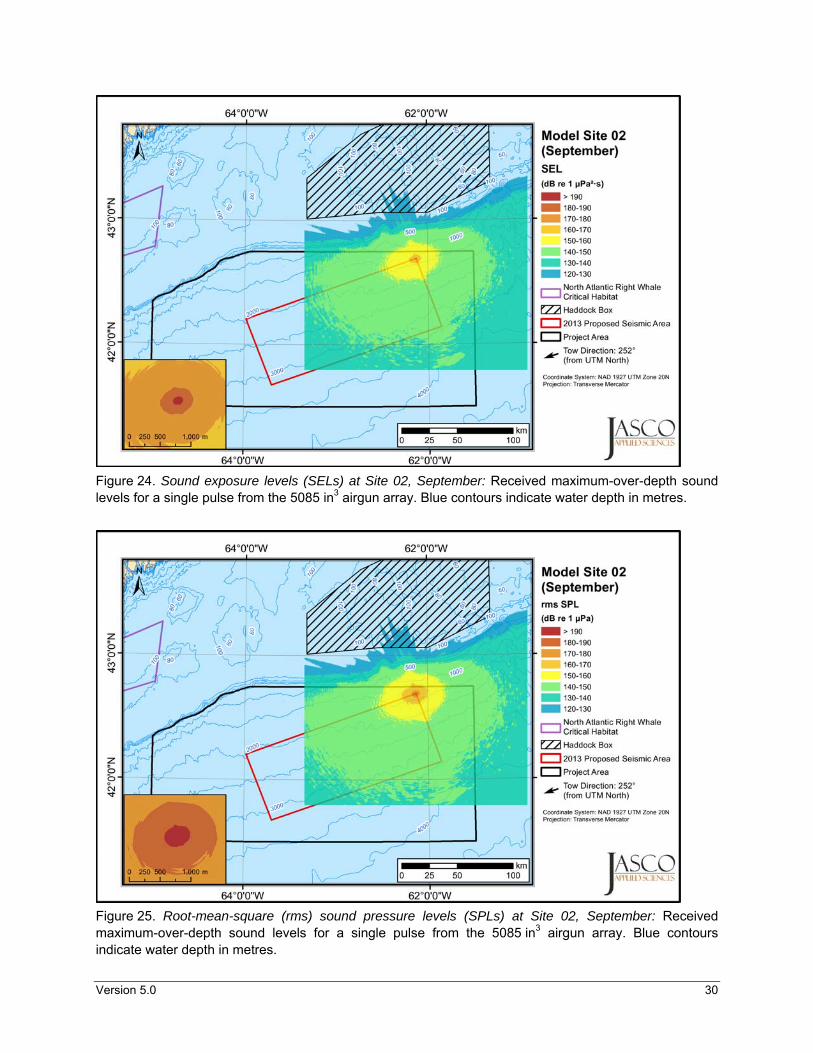
Version 5.0 30
Figure 24. Sound exposure levels (SELs) at Site 02, September: Received maximum-over-depth sound levels for a single pulse from the 5085 in3 airgun array. Blue contours indicate water depth in metres.
Figure 25. Root-mean-square (rms) sound pressure levels (SPLs) at Site 02, September: Received maximum-over-depth sound levels for a single pulse from the 5085 in3 airgun array. Blue contours indicate water depth in metres.

Version 5.0 31
Table 9. Site 02: Maximum (Rmax, m) and 95% (R95%, m) horizontal distances from the source to modelled maximum-over-depth sound exposure levels (SELs; 10 Hz to 2 kHz).
SEL (dB re 1 µPa2∙s)
April September
Rmax
R95%
Rmax
R95%
200 29 25 29 25
190 97 85 93 83
180 312 270 310 262
170 2 112 2 027 2 109 2 012
160 9 937 6 084 9 937 5 673
150 70 860 35 001 41 781 27 413
140 > 120 000 > 120 000
Table 10. Site 02: Maximum (Rmax, m) and 95% (R95%, m) horizontal distances from the source to modelled maximum-over-depth root-mean-square (rms) sound pressure levels (SPLs; 10 Hz to 2 kHz).
rms SPL (dB re 1 µPa)
April September
Rmax
R95%
Rmax
R95%
200 78 66 74 64
190 244 211 239 208
180 864 679 861 674
170 4 705 3 657 4 411 3 560
160 18 756 12 719 15 948 11 585
150 74 957 41 363 47 139 30 520
140 > 120 000 > 120 000
Table 11. Site 02, April: Maximum (Rmax, m) and 95% (R95%, m) horizontal distances from the source to modelled maximum-over-depth sound exposure levels (SELs; 10 Hz to 2 kHz), with and without M-weighting applied.
SEL (dB re1 µPa2∙s)
No Weighting LFC MFC HFC Pw
Rmax
R95%
Rmax
R95%
Rmax
R95%
Rmax
R95%
Rmax
R95%
200 29 25 27 25 < 5 < 5 < 5 < 5 5 5
190 97 85 90 80 27 27 21 21 43 41
180 312 270 287 248 97 87 74 68 142 124
170 2 112 2 027 2 096 964 321 288 247 221 485 410
160 9 937 6 084 9 902 5 636 4 011 2 105 870 734 4 921 4 379
150 70 860 35 001 70 841 34 448 26 135 16 621 18 756 11 681 41 471 32 820
140 > 120 000 > 120 000 > 120 000 107 731 90 992 > 120 000
130 > 120 000

Version 5.0 32
Table 12. Site 02, September: Maximum (Rmax, m) and 95% (R95%, m) horizontal distances from the source to modelled maximum-over-depth sound exposure levels (SELs; 10 Hz to 2 kHz), with and without M-weighting applied.
SEL (dB re1 µPa2∙s)
No Weighting LFC MFC HFC Pw
Rmax
R95%
Rmax
R95%
Rmax
R95%
Rmax
R95%
Rmax 95%
200 29 25 27 25 < 5 < 5 < 5 < 5 5 5
190 93 83 90 78 27 27 21 21 43 38
180 310 262 282 242 97 87 74 68 139 122
170 2 109 2 012 2 094 942 306 272 229 206 479 406
160 9 937 5 673 9 902 5 292 1 150 953 875 731 2 870 1 356
150 41 781 27 413 41 759 25 744 13 708 8 472 8 710 4 754 18 608 13 686
140 > 120 000 > 120 000 71 783 26 834 45 416 19 684 99 946 46 735
130 > 120 000 > 120 000 > 120 000
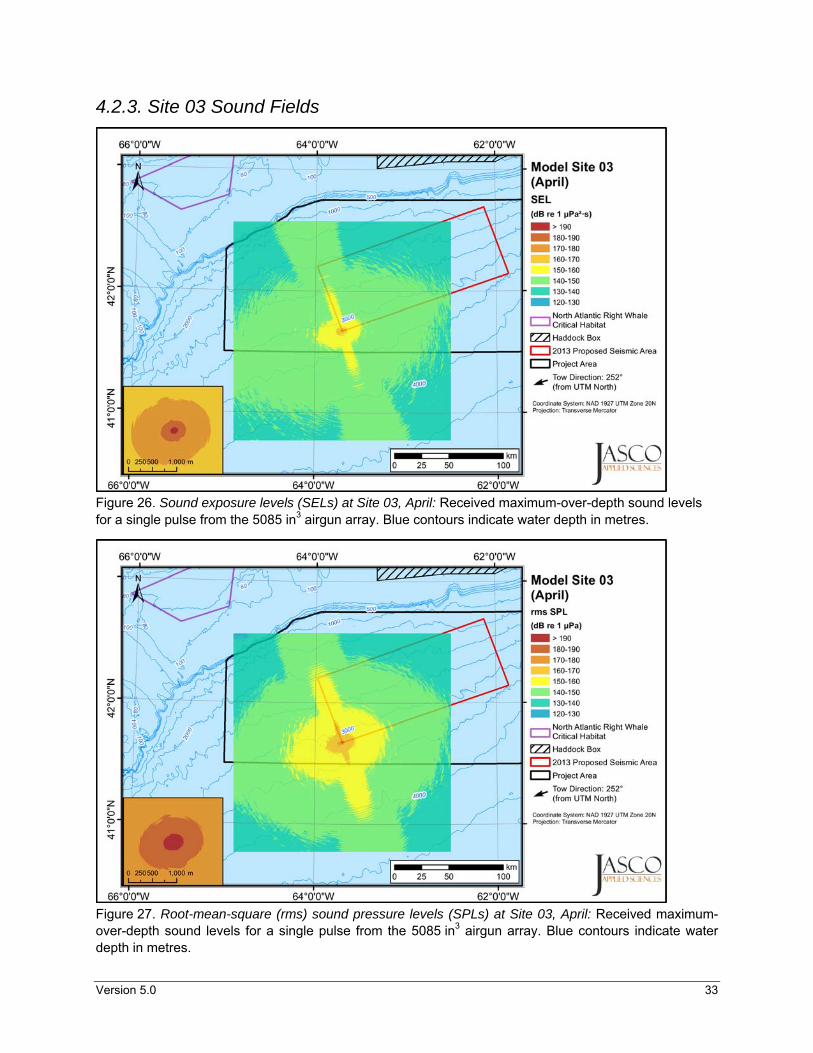
Version 5.0 33
4.2.3. Site 03 Sound Fields
Figure 26. Sound exposure levels (SELs) at Site 03, April: Received maximum-over-depth sound levels for a single pulse from the 5085 in3 airgun array. Blue contours indicate water depth in metres.
Figure 27. Root-mean-square (rms) sound pressure levels (SPLs) at Site 03, April: Received maximum-over-depth sound levels for a single pulse from the 5085 in3 airgun array. Blue contours indicate water depth in metres.

Version 5.0 34
Figure 28. Sound exposure levels (SELs) at Site 03, September: Received maximum-over-depth sound levels for a single pulse from the 5085 in3 airgun array. Blue contours indicate water depth in metres.
Figure 29. Root-mean-square (rms) sound pressure levels (SPLs) at Site 03, September: Received maximum-over-depth sound levels for a single pulse from the 5085 in3 airgun array. Blue contours indicate water depth in metres.
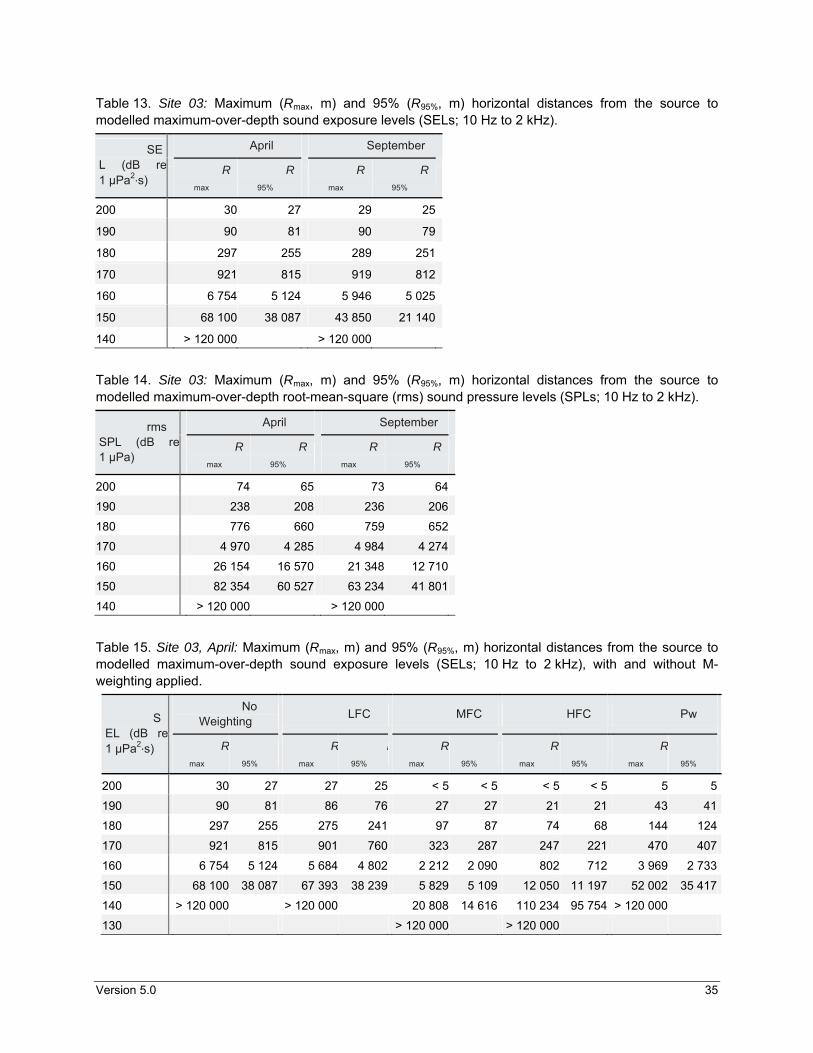
Version 5.0 35
Table 13. Site 03: Maximum (Rmax, m) and 95% (R95%, m) horizontal distances from the source to modelled maximum-over-depth sound exposure levels (SELs; 10 Hz to 2 kHz).
SEL (dB re 1 µPa2∙s)
April September
Rmax
R95%
Rmax
R95%
200 30 27 29 25
190 90 81 90 79
180 297 255 289 251
170 921 815 919 812
160 6 754 5 124 5 946 5 025
150 68 100 38 087 43 850 21 140
140 > 120 000 > 120 000
Table 14. Site 03: Maximum (Rmax, m) and 95% (R95%, m) horizontal distances from the source to modelled maximum-over-depth root-mean-square (rms) sound pressure levels (SPLs; 10 Hz to 2 kHz).
rms SPL (dB re 1 µPa)
April September
Rmax
R95%
Rmax
R95%
200 74 65 73 64
190 238 208 236 206
180 776 660 759 652
170 4 970 4 285 4 984 4 274
160 26 154 16 570 21 348 12 710
150 82 354 60 527 63 234 41 801
140 > 120 000 > 120 000
Table 15. Site 03, April: Maximum (Rmax, m) and 95% (R95%, m) horizontal distances from the source to modelled maximum-over-depth sound exposure levels (SELs; 10 Hz to 2 kHz), with and without M-weighting applied.
SEL (dB re 1 µPa2∙s)
No Weighting
LFC MFC HFC Pw
Rmax 95%
Rmax
R95%
Rmax 95%
Rmax 95%
Rmax
R95%
200 30 27 27 25 < 5 < 5 < 5 < 5 5 5
190 90 81 86 76 27 27 21 21 43 41
180 297 255 275 241 97 87 74 68 144 124
170 921 815 901 760 323 287 247 221 470 407
160 6 754 5 124 5 684 4 802 2 212 2 090 802 712 3 969 2 733
150 68 100 38 087 67 393 38 239 5 829 5 109 12 050 11 197 52 002 35 417
140 > 120 000 > 120 000 20 808 14 616 110 234 95 754 > 120 000
130 > 120 000 > 120 000

Version 5.0 36
Table 16. Site 03, September: Maximum (Rmax, m) and 95% (R95%, m) horizontal distances from the source to modelled maximum-over-depth sound exposure levels (SELs; 10 Hz to 2 kHz), with and without M-weighting applied.
SEL (dB re 1 µPa2∙s)
No Weighting
LFC MFC HFC Pw
Rmax
R95%
Rmax
R95%
Rmax 95%
Rmax
R95%
Rmax
R95%
200 29 25 27 25 < 5 < 5 < 5 < 5 5 5
190 90 79 85 75 27 27 21 21 43 38
180 289 251 274 238 97 87 74 68 139 122
170 919 812 900 756 304 271 229 206 467 403
160 5 946 5 025 5 658 4 787 1 041 924 810 722 1 580 1 291
150 43 850 21 140 43 475 20 220 4 075 3 248 2 990 2 395 10 085 5 503
140 > 120 000 > 120 000 49 938 25 349 36 451 15 905 77 249 39 558
130 > 120 000 109 232 78 631 > 120 000

Version 5.0 37
5. Discussion
The modelled scenarios provide a good estimate of the variation in sound propagation around the airgun array within the Project Area. The three site locations provide examples of sound propagation when the array is close (Sites 01 and 02) and far (Site 03) from the continental shelf, when the water depth at the array location varies from shallow (500 m at Site 01), to intermediate (1305 m at Site 02), and to deep (3145 m at Site 03).
Distances to sound levels are dependent on the water depth at the source location and along the propagation path. The dependence, however, differs at close and far ranges from the source. In the Project Area, ensonification level extends farther in a shallower than in a deeper environment at < 10 km from the airgun array, representing rms SPLs ≥ 170 dB re 1 µPa. The opposite is true at longer propagation ranges (Tables 17 to 18). The distances at which this relation changes depends on the water depth at the modelled site, the bathymetry of the modelled area, and the characteristics of the sound speed profile.
Table 17. April: Maximum (Rmax, m) and 95% (R95%, m) horizontal distances from the source to modelled maximum-over-depth root-mean-square (rms) sound pressure levels (SPLs; 10 Hz to 2 kHz).
rms SPL (dB re 1 µPa)
Site 01 Site 02 Site 03
Rmax
R95%
Rmax
R95%
Rmax
R95%
200 58 50 78 66 74 65
190 204 181 244 211 238 208
180 1 037 839 864 679 776 660
170 5 242 3 462 4 705 3 657 4 970 4 285
160 11 647 8 171 18 756 12 719 26 154 16 570
150 72 945 44 361 74 957 41 363 82 354 60 527
140 > 120 000 > 120 000 > 120 000
Table 18. September: Maximum (Rmax, m) and 95% (R95%, m) horizontal distances from the source to modelled maximum-over-depth root-mean-square (rms) sound pressure levels (SPLs; 10 Hz to 2 kHz).
rms SPL (dB re 1 µPa)
Site 01 Site 02 Site 03
Rmax
R95%
Rmax
R95%
Rmax
R95%
200 56 50 74 64 73 64
190 200 178 239 208 236 206
180 994 819 861 674 759 652
170 5 048 3 358 4 411 3 560 4 984 4 274
160 10 868 7 824 15 948 11 585 21 348 12 710
150 46 776 28 738 47 139 30 520 63 234 41 801
140 > 120 000 > 120 000 > 120 000

Version 5.0 38
Sound levels within specific areas on the continental shelf, e.g., within the North Atlantic Right Whale Critical Habitat, vary with the airgun array’s distance from the continental slope and with time of year. As the distance between the airgun array and the continental shelf increase, the sound levels received within a specific area on the shelf decrease (Figure 30). Sound levels within a specific area on the shelf are also estimated to decrease during the operational period, from April to September (Figure 31), as the surface duct layer gradually becomes a downward refractive layer.
Figure 30. Comparison between root-mean-square (rms) sound pressure levels (SPLs) at Site 01 and 03: Received maximum-over-depth sound levels for a single pulse from the 5085 in3 airgun array. Blue contours indicate water depth in metres.

Version 5.0 39
Figure 31. Comparison between root-mean-square (rms) sound pressure levels (SPLs) at Site 01 in April and September: Received maximum-over-depth sound levels for a single pulse from the 5085 in3 airgun array. Blue contours indicate water depth in metres.
The surface duct (upward refracting) layer in April traps sound in the top 100 m of the water column. This ducting of sound reduces bottom interactions over shallow water (≤ 200 m), thus reducing the attenuation of sound as it propagates over the continental shelf. In September, the upper section of the sound speed profile has become downward refracting, thus increasing bottom interactions and, consequently, attenuation. The temporal variation in sound propagation (Figure 31), which is more significant over the shallow continental shelf, can also be seen by comparing vertical slices of the sound fields, i.e., contour plot of sound levels propagating in range and depth from the source. Figures 32 and 33 present vertical slices oriented perpendicular to the tow direction.

Version 5.0 40
Figure 32. April: root-mean-square (rms) sound pressure levels (SPLs; dB re 1 μPa) as a function of range and depth from the airgun array at Site 02. Negative distances extend from the airgun array along a true bearing of 162°. Positive distances extend from the airgun array along a true bearing of 342°.
Figure 33. September: root-mean-square (rms) sound pressure levels (SPLs; dB re 1 μPa) as a function of range and depth from the airgun array at Site 02. Negative distances extend from the airgun array along a true bearing of 162°. Positive distances extend from the airgun array along a true bearing of 342°.
Because of the source level directivity, the array tow direction was set to an angle subparallel to the continental slope. This tow direction results in precautionary distances to modelled sound levels, since the broadside of the array points toward deep water where bottom interactions are reduced and sound propagates to longer ranges. It is expected that tow directions set a few degrees (e.g., ~30°) off the general slope direction would decrease distances to the ≤ 150 dB re 1 µPa rms SPLs (levels that propagate far enough to be substantially influenced by the bathymetry).

Version 5.0 41
The application of M-weighting for low-frequency cetaceans results in almost no reduction in the sound level distances, since the main frequency content of the airgun arrays lays within the passband of that filter. The most significant reduction in sound level distances (up to ~90% at 170 dB re 1 µPa2·s; Tables 7, 8, 11, and 12) is observed for the high-frequency cetaceans filter, as its passband excludes much of the spectral content of airgun noise.

Version 5.0 42
Literature Cited
Aerts, L., M. Blees, S. Blackwell, C. Greene, K. Kim, D. Hannay, and M. Austin. 2008. Marine Mammal Monitoring and Mitigation during BP Liberty OBC Seismic Survey in Foggy Island Bay, Beaufort Sea, July-August 2008: 90-Day Report. LGL Report P1011-1. Prepared by LGL Alaska Research Associates Inc., LGL Ltd., Greeneridge Sciences Inc., and JASCO Applied Sciences for BP Exploration Alaska.
Blackwell, S.B., R.G. Norman, C.R. Greene Jr., and W.J. Richardson. 2007. Acoustic measurements. (4) In: Marine Mammal Monitoring and Mitigation during Open Water Seismic Exploration by Shell Offshore Inc. in the Chukchi and Beaufort Seas, July-September 2006: 90-Day Report. LGL Report P891-1. Report by LGL Alaska Research Associates Inc. and Greeneridge Sciences Inc. for Shell Offshore Inc., Nat. Mar. Fish. Serv. (US), and US Fish & Wildl. Serv. pp 4-1 to 4-52.
Carnes, M.R. 2009. Description and Evaluation of GDEM-V 3.0. NRL Memorandum Report 7330-09-9165. US Naval Research Laboratory, Stennis Space Center, MS. 21 p.
Chapman, D.M.F. and D. Ellis. 1980. Propagation Loss Modelling on the Scotian Shelf: The Geo-Acoustic Model. In: Kuperman, W.A. and F.B. Jensen (eds.). Bottom Interacting Ocean Acoustics. New York. pp 525-539.
Cochrane, N.A. 2007. Ocean Bottom Acoustic Observations In The Scotian Shelf Gully During An Exploration Seismic Survey–A Detailed Study. Can. Tech. Rep. Fish. Aquat. Sci. 2747: viii +. 73 p.
Collins, M.D. 1993. The split-step Padé solution for the parabolic equation method. J. Acoust. Soc. Am. 93:1736-1742.
Collins, M.D., R.J. Cederberg, D.B. King, and S.A. Chin-bing. 1996. Comparison of algorithms for solving parabolic wave equations. J. Acoust. Soc. Am. 100:178-182.
Coppens, A.B. 1981. Simple equations for the speed of sound in Neptunian waters. J. Acoust. Soc. Am. 69:862-863.
Dragoset, W.H. 1984. A comprehensive method for evaluating the design of airguns and airgun arrays. In: 16th Annual Proc. Offshore Tech. Conf. Volume 3. pp 75–84.
Ellis, D. and S. Hughes. 1989. Estimates of sediment properties for ARPS. Dartmouth, NS, Canada, 12 July 1989.
Funk, D., D. Hannay, D. Ireland, R. Rodrigues, and W. Koski (eds.). 2008. Marine Mammal Monitoring and Mitigation during Open Water Seismic Exploration by Shell Offshore Inc. in the Chukchi and Beaufort Seas, July–November 2007: 90-Day Report. LGL Report P969-1. Prepared by LGL Alaska Research Associates Inc., LGL Ltd., and JASCO Research Ltd. for Shell Offshore Inc., National Marine Fisheries Service (US), and US Fish and Wildlife Service. http://www-static.shell.com/static/usa/downloads/alaska/shell2007_90-d_final.pdf.
Greene, C.R., Jr. 1997. Physical acoustics measurements. (3) In: Richardson, W.J. (ed.). Northstar Marine Mammal Monitoring Program, 1996: Marine Mammal and Acoustical Monitoring of a Seismic Program in the Alaskan Beaufort Sea. LGL Report 2121-2. Report from LGL Ltd. and Greeneridge Sciences Inc. for BP Exploration (Alaska) Inc. and the National Marine Fisheries Service (US).

Version 5.0 43
Hannay, D.E. and R.G. Racca. 2005. Acoustic Model Validation. Document 0000-S-90-04-T-7006-00-E, Revision 02. Technical report for Sakhalin Energy Investment Company Ltd. by JASCO Research Ltd. 34 p. http://www.sakhalinenergy.com/en/documents/doc_33_jasco.pdf.
Ireland, D.S., R. Rodrigues, D. Funk, W. Koski, and D. Hannay. 2009. Marine Mammal Monitoring and Mitigation during Open Water Seismic Exploration by Shell Offshore Inc. in the Chukchi and Beaufort Seas, July–October 2008: 90-Day Report. LGL Report P1049-1. Prepared by LGL Alaska Research Associates Inc., LGL Ltd., and JASCO Applied Sciences for Shell Offshore Inc., National Marine Fisheries Service (US), and US Fish and Wildlife Service. 277 p.
Landro, M. 1992. Modelling of GI gun signatures. Geophysical Prospecting 40:721–747.
Laws, M., L. Hatton, and M. Haartsen. 1990. Computer modelling of clustered airguns. First Break 8:331–338.
Lurton, X. 2002. An Introduction to Underwater Acoustics: Principles and Applications. Springer, Chichester, U.K. pp 347.
MacGillivray, A.O. 2006. Acoustic Modelling Study of Seismic Airgun Noise in Queen Charlotte Basin. MSc Thesis. University of Victoria, Victoria, BC. 98 p.
MacGillivray, A.O., M. Zykov, and D.E. Hannay. 2007. Summary of Noise Assessment. (3) In: Marine Mammal Monitoring and Mitigation During Open Water Seismic Exploration by ConocoPhillips Alaska, Inc. in the Chukchi Sea July-October 2006. Report by LGL Alaska Research Associates and JASCO Research Ltd. for ConocoPhillips Alaska, Inc.
Malme, C.I., P.W. Smith, and P.R. Miles. 1986. Characterisation of Geophysical Acoustic Survey Sounds. Report by BBN Laboratories Inc. for Battelle Memorial Institute to the Minerals Management Service, Pacific Outer Continental Shelf Region, Los Angeles, CA.
McCauley, R.D., M.-N. Jenner, C. Jenner, K.A. McCabe, and J. Murdoch. 1998. The response of humpback whales (Megaptera novaeangliae) to offshore seismic survey noise: preliminary results of observations about a working seismic vessel and experimental exposures. Austral. Petrol. Prod. & Explor. Assoc. J. 38:692-707.
[NMFS] National Marine Fisheries Service (US). 2005. Endangered Fish and Wildlife: Notice of Intent to Prepare an Environmental Impact Statement. US Federal Register 70:1871-1875.
Nedwell, J.R. and A.W. Turnpenny. 1998. The use of a generic frequency weighting scale in estimating environmental effect. Workshop on Seismics and Marine Mammals. 23–25th June, London, U.K.
Nedwell, J.R., A.W.H. Turnpenny, J. Lovell, S.J. Parvin, R. Workman, and J.A.L. Spinks. 2007. A validation of the dBht as a measure of the behavioural and auditory effects of underwater noise. Report No. 534R1231 prepared by Subacoustech Ltd. for the UK Department of Business, Enterprise and Regulatory Reform under Project No. RDCZ/011/0004. www.subacoustech.com/information/downloads/reports/534R1231.pdf.
O’Neill, C., D. Leary, and A. McCrodan. 2010. Sound Source Verification. (3) In: Blees, M.K., K.G. Hartin, D.S. Ireland, and D. Hannay (eds.). Marine mammal monitoring and mitigation during open water seismic exploration by Statoil USA E&P Inc. in the Chukchi Sea, August-October 2010: 90-day report. LGL Report P1119. Prepared by LGL Alaska Research Associates Inc., LGL Ltd., and JASCO Applied Sciences Ltd. for Statoil USA E&P Inc., National Marine Fisheries Service (US), and US Fish and Wildlife Service. pp 3-1 to 3-34.

Version 5.0 44
Osler, J.C. 1994. A geoacoustic and oceanographic description of several shallow water experimental sites on the Scotian Shelf. Technical Memorandum 94/216. Defence Research Establishment Atlantic, Dartmouth, NS. 42 p. http://www.dtic.mil/cgi-bin/GetTRDoc?Location=U2&doc=GetTRDoc.pdf&AD=ADA288300.
Racca, R.G. and J.A. Scrimger. 1986. Underwater Acoustic Source Characteristics of Air and Water Guns. DREP Tech. Rep. 06SB 97708-5-7055. Report by JASCO Research Ltd. for Defence Research Establishment Pacific (Canada).
Rodriguez, E., C.S. Morris, Y.J.E. Belz, E.C. Chapin, J.M. Martin, W. Daffer, and S. Hensley. 2005. An assessment of the SRTM topographic products. JPL D-31639. Jet Propulsion Laboratory Pasadena, CA.
Southall, B.L., A.E. Bowles, W.T. Ellison, J.J. Finneran, R.L. Gentry, C.R. Greene Jr., D. Kastak, D.R. Ketten, J.H. Miller, et al. 2007. Marine mammal noise exposure criteria: Initial scientific recommendations. Aquatic Mammals 33(4):411-521.
Teague, W.J., M.J. Carron, and P.J. Hogan. 1990. A comparison between the Generalized Digital Environmental Model and Levitus climatologies. J. Geophys. Res. 95(C5):7167-7183.
Warner, G., C. Erbe, and D. Hannay. 2010. Underwater sound measurements. (3) In: Reiser, C.M., D.W. Funk, R. Rodrigues, and D. Hannay (eds.). Marine Mammal Monitoring and Mitigation during Open Water Shallow Hazards and Site Clearance Surveys by Shell Offshore Inc. in the Alaskan Chukchi Sea, July-October 2009: 90-Day Report. LGL Report P1112-1. Report by LGL Alaska Research Associates Inc. and JASCO Applied Sciences for Shell Offshore Inc., National Marine Fisheries Service (US), and US Fish and Wildlife Service. pp 3-1 to 3-54. http://www-static.shell.com/static/usa/downloads/alaska/report_2009_shell_90-d_report_plus_appendices.pdf.
Ziolkowski, A. 1970. A method for calculating the output pressure waveform from an airgun. Geophysical Journal of the Royal Astronomical Society 21:137-161.

APPENDIX B:
SCOPING DOCUMENT


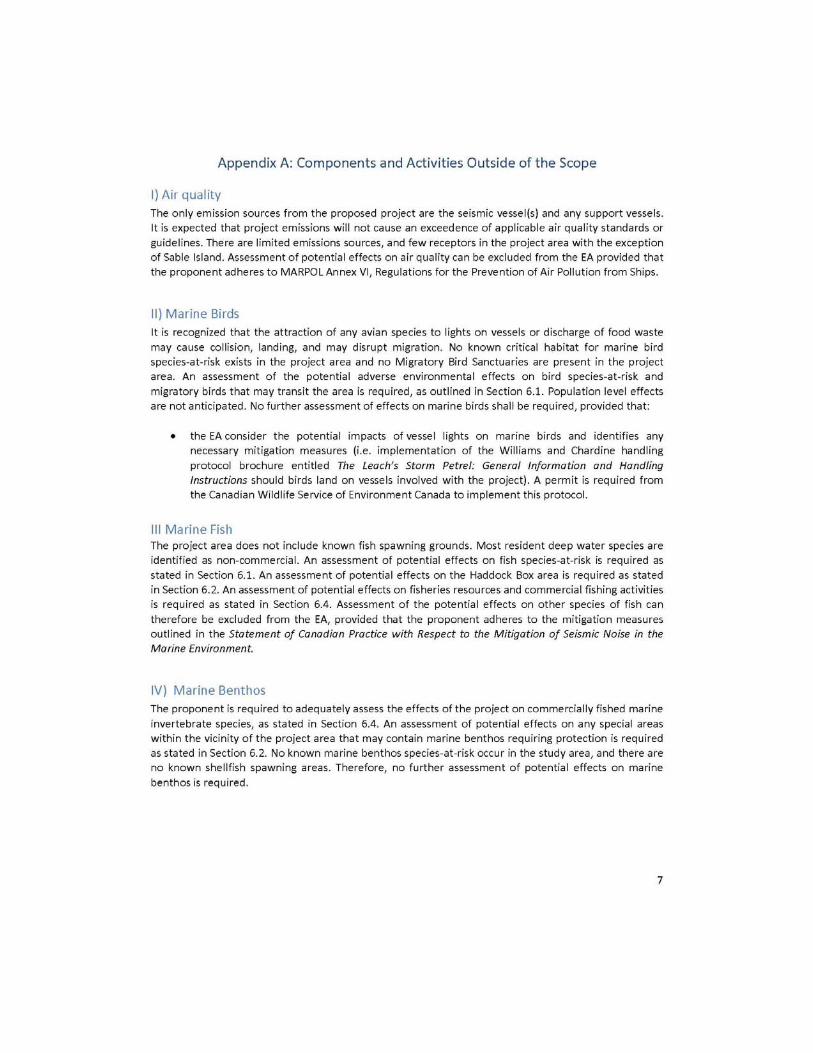


Shelburne Basin 3-D Seismic Survey Environmental Assessment 1
APPENDIX C: SUMMARY OF CONSULTATIONS
Agency/
Stakeholder Group Contact(s) Details of Engagement Comments/Concerns
EA Section where Comment/Concern Addressed/
Response
Fisheries Advisory Committee (FAC) –for more information, please see general fisheries information below.
Fisheries Interests Including:
Eastern Fisherman’s Federation
Eastern Shore Fish Packers Association
Maritime Aboriginal Peoples Council
Nova Scotia Fish Packers Association,
Seafood Producers Association of Nova Scotia
Nova Scotia Department of Fisheries and Aquaculture
On September 12, 2012, Shell provided a presentation detailing the proposed Shelburne Basin 3D seismic program. The proposed location and timing of the survey were discusses as well as some high level details of the Project. The Project Team also provided opportunity for Q &A with FAC attendees.
Shell should assure that appropriate fisheries are consulted in regards to the Project.
FAC Members were curious about timing and length of proposed survey as well as the “lead” time to be provided to fisheries when anticipated to be in same area as the proposed seismic survey.
FAC attendees recommended that Shell attend the next FAC meeting to be held in December 2012/January 2013 in order to facilitate a more detailed Q&A following selection of a seismic vendor.
Shell’s stakeholder engagement approach is provided in Section 3.4.
Fisheries engaged are detailed below under the fisheries stakeholder group.
Section 2.3.1 details timing and length of surveys.
Section 11.4 details fisheries mitigation proposed for the Project to ensure coordination of program with existing operations.
Shell representatives agreed to the request that they attend the next FAC meeting and indicated they would be in contact with the FAC.
On January 16, 2013 Shell along with representatives from LGL and Western Geco provided a presentation to FAC members regarding updated details associated with the 2013 Seismic program and the environmental assessment.
Discussions regarding proposed numbers of MMOs and FLOs, requirements for support vessels and clarification on the technical details of the program.
Shell committed to seeking feedback directly from the fisheries contacts regarding seismic acquisition options prior to finalizing the seismic program plan.
Section 2.3 provides more details on requirements for support vessels and technical aspects of the program.
Section 6.1 provides more details on numbers and responsibilities of MMOs/SSBOs.
Section 6.3.1.1 provides more details on FLOs and coomunication between Shell and fishers prior to finalization of seismic program plan.

Shelburne Basin 3-D Seismic Survey Environmental Assessment 2
Agency/
Stakeholder Group Contact(s) Details of Engagement Comments/Concerns
EA Section where Comment/Concern Addressed/
Response
Department of Fisheries and Oceans (DFO)
Kristian Curran, Oceans Planning and Management Coordinator
Hilary Moors-Murphy, Oceans Biologist –Marine Mammal Information.
Face-to-face discussion between DFO and Shell was conducted on September 13, 2012 regarding fisheries and ecological information that DFO could provide to assist in the compilation of the EA and the preferred engagement approach for requesting and acquiring information.
Email requests (various dates) from Shell and LGL were sent for DFO information inclusive of landings data, special areas shapefiles, military exercise area shapefile,and fisheries contact information.
A request by LGL was made on September 27, 2012 for information on the location of 2013 DFO research surveys to ensure coordination with the Project.
A request by LGL was made on October 18, 2012 for information regarding background biological information on identified marine mammal and sea turtle VECs.
Provision of information in relation to various requests (i.e. landings data, fishery licenses by fishery inclusive of Communal Commercial fishery licenses, shapefiles, locations of RAPID moorings and AZMP Activities via email (various dates).
Mr. Curran will remain the main contact throughout the EA process for information requests and questions.
DFO’s comments and interest for the EA will be captured in the Scoping Document.
DFO’s concerns and comments in regards to the proposed Project will be provided to the CNSOPB following the EA review period.
Shell should contact DFO in advance of its 2013 seismic program, including any subsequent programs beyond 2013, to ensure avoidance of potential conflicts with DFO research programs.
The recommendation was made to consider recently drafted SEA for the eastern Scotian shelf compiled by Stantec for any recent research or information associated with identified VECs.
Advisement that all Maritimes-based First Nations Bands, including the Native Council of Nova Scotia, hold communal commercial licenses that allow them to fish in the Shell license block areas and should be consulted.
Provision of DFO Letter of Advice (LOA) to the CNSOPB on February 1, 2013 detailing comments related to the Project following review of the EA.
Information provided by DFO has been used in the compilation of this EA and associated mitigation measures and can be found in the following sections:
Section 3.0 Section 6.1 Section 6.3 Section 11.5
Some of the comments on the EA and the EA addendum provided by DFO have been addressed in the compilation of the revised EA. These comments have been addressed in the following sections:
Section 6.1 Section 6.3.1.1 Section 6.3.2 Appendix C

Shelburne Basin 3-D Seismic Survey Environmental Assessment 3
Agency/
Stakeholder Group Contact(s) Details of Engagement Comments/Concerns
EA Section where Comment/Concern Addressed/
Response
Donald Humphrey, Senior Environmental Assessment Analyst
Hilary Moors-Murphy, Oceans Biologist
Follow up email on March 4, 2013 to aquire clarification on DFO requests detailed in DFO LOA.
Provision of requested information (vessel specification, number and location of MMOs/FLOs) via email on March 15, 2013
Phone discussion on March 19 between DFO and Shell regarding comments associated with the use of PAM detailed in DFO’s LOA.
Comments on PAM were provided as recommendations to ensure that the proposed mitigation is as effective as possible.
Details associated with the number and location of MMOs/FLOs have been incorporated into the EA. These details are included in the following EA sections:
Section 6.1 Section 6.3.1 Section 11.0
Section 6.1 and Section 11.0 outline the proposed use of PAM for the Project.
Department of National Defense (DND)
Kyle Penney, Formation Safety and Environment
A telephone conversation with LGL was conducted on October 23, 2012 regarding info DND provided to the C-NSOPB in their Record of Determination.
It was determined that unexploded ordinances and shipwrecks are not concern since Project will not contact the sea bottom.
There will be a focus on avoiding military training operations. DND would be contacted prior to the commencement of operations.
Both users would issue Notices to Mariners.
Shapefile provided by DFO will be used to illustrate location of military exercise areas.
Information provided by DND has been used in the compilation of Section 6.3.4 and associated mitigation measures.
Canada-Nova Scotia Offshore Petroleum Board (C-NSOPB)
Elizabeth MacDonald, Advisor, Environmental Affairs
Eric Theriault, Advisor, Environmental Affairs
A telephone discussion between CNSOPB, Shell and LGL was conducted on September 5, 2012 regarding the draft scoping document.
Face-to-face meetings between CNSOPB and Shell were
Clarification was provided on draft scoping document and included in the final version posted on registry on October 4, 2012.
Mrs. MacDonald will be the lead on EA review. Shell will maintain direct
Information and clarification provided by the C-NSOPB has been used in the compilation of this EA and associated mitigation measures.

Shelburne Basin 3-D Seismic Survey Environmental Assessment 4
Agency/
Stakeholder Group Contact(s) Details of Engagement Comments/Concerns
EA Section where Comment/Concern Addressed/
Response
conducted on September 13 and September 27, 2012 to discuss the EA process and associated requirements and expectations.
Email and phone conversations and requests were conducted (various dates) between Shell and CNSOPB regarding the EA process and requirements, Scoping Document requirements and associated mitigation measures.
Face-to-face meeting between Shell and CNSOPB was conducted on October 2, 2012 to discuss fisheries engagement.
contact with the C-NSOPB.
C-NSOPB is available for draft review of submissions.
Formal C-NSOPB guidance will be provided in the Scoping Document and EA comments (to be received).
Guidance was provided on role of the FLO in the event of an incident, and on vessel and fishing gear damage compensation guidelines.
Guidance was provided on fisheries engagement and key fisheries to be engaged.
Face to face meeting on January 18 and follow up phone call on January 28 between CNSOPB and Shell to discuss project details and proposed modifications to the 2013 Seismic Activity Area.
Phone conversation between CNSOPB and Shell on February 27, 2013 to aquire clarification on EA comments received on February 20, 2013.
Guidance provided that an addendum to the EA would be required to address the proposed changes to the 2013 Seismic Activity Area.
Clarification provided that CNSOPB comments require incorporation into final EA version and that prescribed beaked whale mitigation is anticipated to become a standard mitigation measure for this Project location.
Changes detailed in the addendum submitted to the CNSOPB on February 8, 2013 have been included in the finalized version of the EA.
Comments on the EA compiled by the CNSOPB have been addressed in the compilation of the revised EA. These comments have been addressed in the following sections:
Section 2.3.6 Section 6.1 Section 6.3.1 Section 9.0 Section 10.2.1 Section 11.1.3

Shelburne Basin 3-D Seismic Survey Environmental Assessment 5
Agency/
Stakeholder Group Contact(s) Details of Engagement Comments/Concerns
EA Section where Comment/Concern Addressed/
Response
Environment Canada (EC) Michael Hingston, Environmental Assessment Coordinator
A telephone discussion was held on October 11, 2012 between EC and Shell regarding available information and guidance from EC, and preferred method of engagement.
A follow up email on October 19, 2012 requested information regarding the permit required to implement the protocol outlined in The Leach’s Storm Petrel: General Information and Handling Instructions.
There are no concerns to date.
Mr. Hingston will remain the focal contact and identify appropriate internal experts for any EA information requests.
EC is available for information requests and draft review of the EA.
There is provision of information regarding CWS bird handling permit and guidance documents associated with migratory birds and environmental assessment on November 14, 2012.
Information provided by EC was used in the compilation of this EA and associated mitigation measures. See the following sections:
Section 10.5 Section 11.4
Face to face meeting with EC and Shell on January 16 to discuss the EA and any associated concerns/comments.
A follow up email on March 4, 2013 sent to EC to request clarification and information associated with the EA comments provided to the CNSOPB by EC in a letter dated January 31, 2013.
EC’s Compiled comments related to Shell’s Project EA provided to the CNSOPB on January 31, 2013 .
Some of the comments on the EA provided by EC have been addressed in the compilation of the revised EA. These comments have been addressed in the following sections:
Section 6.1.1.9 Section 6.1.1.10 Section 7.3.2 Section 10.2.
Nova Scotia Office of Aboriginal Affairs (NS OAA)
Justin Huston, Director of Consultation – NS OAA
A face-to-face meeting was held on October 2, 2012 between Shell personnel and NS OAA (Justin Huston, and Tom Soehl, Director of Negotiations).
A teleconference meeting was held on November 15, 2012, involving Justin Huston and Shell personnel.
The Project may trigger a NS Gov’t assessment relating to the duty to consult the Mi’kmaq/KMKNO.
There was a request that the Project be provided to the NS Department of Energy and to the Mi’kmaq/KMKNO after submission to the C-NSOPB.
Shell will continue to engage with NS OAA and Department of Energy to understand their process for consultation with the Mi’kmaq Nation.
Shell will forward the Project EA to the NS Department of Energy and the Mi’kmaq/KMKNO following posting by the C-NSOPB.
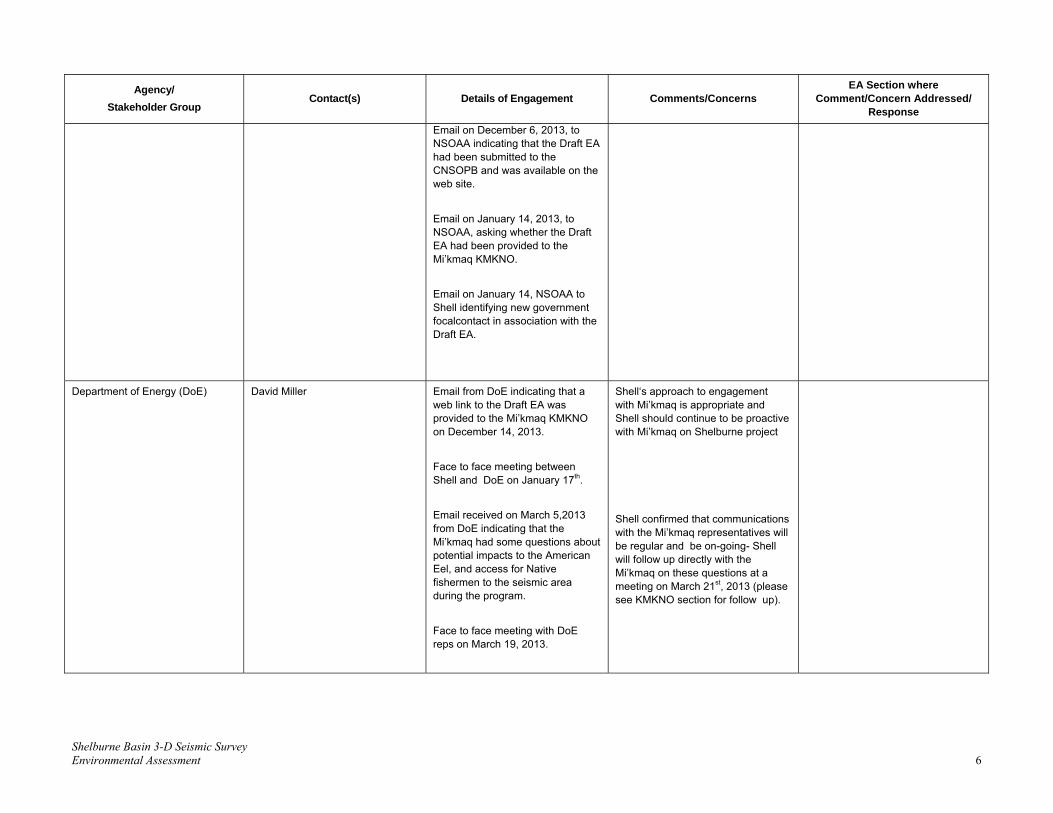
Shelburne Basin 3-D Seismic Survey Environmental Assessment 6
Agency/
Stakeholder Group Contact(s) Details of Engagement Comments/Concerns
EA Section where Comment/Concern Addressed/
Response
Email on December 6, 2013, to NSOAA indicating that the Draft EA had been submitted to the CNSOPB and was available on the web site.
Email on January 14, 2013, to NSOAA, asking whether the Draft EA had been provided to the Mi’kmaq KMKNO.
Email on January 14, NSOAA to Shell identifying new government focalcontact in association with the Draft EA.
Department of Energy (DoE) David Miller Email from DoE indicating that a web link to the Draft EA was provided to the Mi’kmaq KMKNO on December 14, 2013.
Face to face meeting between Shell and DoE on January 17th.
Email received on March 5,2013 from DoE indicating that the Mi’kmaq had some questions about potential impacts to the American Eel, and access for Native fishermen to the seismic area during the program.
Face to face meeting with DoE reps on March 19, 2013.
Shell‘s approach to engagement with Mi’kmaq is appropriate and Shell should continue to be proactive with Mi’kmaq on Shelburne project
Shell confirmed that communications with the Mi’kmaq representatives will be regular and be on-going- Shell will follow up directly with the Mi’kmaq on these questions at a meeting on March 21st, 2013 (please see KMKNO section for follow up).

Shelburne Basin 3-D Seismic Survey Environmental Assessment 7
Agency/
Stakeholder Group Contact(s) Details of Engagement Comments/Concerns
EA Section where Comment/Concern Addressed/
Response
Mi’kmaq Kwilmu’kw Maw-Klusuaqn Negotiation Office (KMKNO)
Twila Gaudet, KMKNO Consultation Liaison Officer
Jennifer MacGillivary, KMKNO Benefits Officer
Face-to-face meetings were held on August 22, October 3 and November 20, 2012 with the Mi’kmaq/KMKNO concerning the Project.
There was provision of Project-related information (Project Description, Information package) to Mi’kmaq/KMKNO personnel via email on October 24 and November 1, 2012.
Mi’kmaq/KMKNO requested that information be provided to them concerning the Project that was being made available to others.
Shell will continue to provide information to the Mi’kmaq and KMKNO that is provided to other stakeholders.
Project web link for Draft Shelburne Basin 3-D Seismic Survey Environmental Assessment (EA) emailed to Twila Gaudet KMKNO Consultation Liaison Officer, on December 6, 2012
Email on January 15, 2013, to Twila Gaudet, Mi’kmaq KMKNO, inviting them to a Project related update meeting on January 16, 2013, at the Offices of the CSNOPB.
Email providing link to EA addendum sent to KMKNO by Shell on February 13, 2013 with request for feedback.
Project update session planned for March 2013 between Shell and KMKNO
Shell and KMKNO had a follow up session on March 21st 2013 to discuss best methods for regular communications and continued relationship building. KMKNO invited Shell to present to the Mi’kmaq political leadership (Benefits Committee) in late April
Shell requested the feedback directly from the Mi’kmaq representatives at the KMKNO on March 21st, 2013 in order to better understand the nature of the questions. The KMKNO agreed to provide this information. via email. (Email still pending).
N/A

Shelburne Basin 3-D Seismic Survey Environmental Assessment 8
Agency/
Stakeholder Group Contact(s) Details of Engagement Comments/Concerns
EA Section where Comment/Concern Addressed/
Response
2013 – Shell has accepted this invitation.
Unama’ki Institute of Natural Resources (representing 5 Cape Breton Mi’kmaq Nations)
John Couture Introductions to the organizations and the seismic project with John and Shell occurred on Thurs April 21st, 2013
High-level discussion regarding the seismic project; Shell corporate values and Unama’ki interests in the project. Shell and Unama’ki agreed to keep in touch and share information moving forward.
Comments about how best to keep Mi’kmaq fishing community updated on Shell’s activity. John Couture will be included on future communications to fishery representatives (i.e. added to circulation list).
World Wildlife Federation (WWF) Robert Rangeley
An information package was sent by mail on November 6, 2012.
A total of two follow-up phone calls have been made to date.
N/A
Tonya Wimmer
A face-to-face meeting between CNSOPB, Shell, EACand WWF was held on March 7, 2013.
Email received from WWF on March 20, 2013 .
Response letter sent by Shell to WWF on March 28 , 2013 to address concerns raised in the March 7 meeting and March 20 email and previous comments provided to the CNSOPB.
Concerns were raised regarding the timing and location of Shell’s seismic survey.
Concerns regarding stakeholder engagement and the lack of engagement with WWF prior to March 7.
Concerns regarding increased potential for collision of seismic vessels with right whale in proximity to the Scotian Shelf during periods of poor visibility (night/fog).
Section 11 outlines the mitigation measures that will be in place for the Project.
The Project EA considers both the spatial and temporal parameters of the project in assessing whether effects are anticipated. With consideration given to the proposed timing and location of the 2013 program, the EA has concluded that with the implementation of the associated mitigation measures no significant residual environmental effects are anticipated. Section 11.0 outlines the mitigation measures associated with the project.

Shelburne Basin 3-D Seismic Survey Environmental Assessment 9
Agency/
Stakeholder Group Contact(s) Details of Engagement Comments/Concerns
EA Section where Comment/Concern Addressed/
Response
Section 3.0 of the EA outlines Shell’s stakeholder engagement approach.
Assessment of the effects of vessel presence on Right Whales and the Roseway Basin are provided in Section 6.1.1.1 and Section 6. 2.2.1 of the EA respectively. These assessments are inclusive of consideration given to the potential impacts of operations conducted during periods of poor visibility (night/fog).
Ecology Action Center (EAC) Mark Butler, Policy Director An information package was sent by mail on November 6, 2012.
A total of two follow-up phone calls have been made to date.
N/A
A face-to-face meeting between CNSOPB, Shell and EAC was held on March 7, 2013.
Response letter sent to EAC on March 28, 2013 to address concerns raised in the March 7 meeting and previous comments provided to the CNSOPB.
Concerns were raised regarding the timing and location of Shell’s seismic survey.
Concerns regarding stakeholder engagement and the lack of engagement with EAC prior to March 7.
Section 11 outlines the mitigation measures that will be in place for the Project.
The Project EA considers both the spatial and temporal parameters of the project in assessing whether significant residual environmental effects are anticipated. With consideration given to the proposed timing and location of the 2013 program, the EA has concluded that with the implementation of the associated mitigation measures no significant residual environmental effects are anticipated.
Section 3.0 of the EA outlines Shell’s stakeholder engagement approach. An overview of efforts to date in regards to engaging EAC is provided in this table. The correct contact was confirmed and suggestions for future engagements were provided by EAC.

Shelburne Basin 3-D Seismic Survey Environmental Assessment 10
Agency/
Stakeholder Group Contact(s) Details of Engagement Comments/Concerns
EA Section where Comment/Concern Addressed/
Response
Fisheries (both FAC and non- FAC groups)
Fisheries Interests Including:
Atlantic Herring and Full Bay Scallop Associations
Nova Scotia Sword Fisherman’s Association
Clearwater Fisheries Limited
Seafood Producers Association of Nova Scotia,
Eastern Shore Fish Packers Association,
Nova Scotia Fish Packers Association,
Scotia Harvest Seafoods
Southwest Nova Tuna Association
Halifax West Commercial Fisherman’s Association
Swordfish Harpoon Association
Nova Scotia Fixed Gear 45-65 Society
Lobster Area #34
Ground Fish Enterprise Allocation Council
Shelburne County Gillnet Fisherman’s Association
J Fraelic and Sons Fisheries
Maritime Aboriginal Peoples Council
Unama’ki Institute of Natural Resources
All fisheries representatives were provided an information package by either email or conventional mail (if requested). on Oct 25th and Oct 26th
Information packages included a cover letter stating intent of seeking feedback, Shell contact information, seismic program summary and map containing landings information pertaining to corresponding fishery recipient.
Follow up phone calls were made starting November 9, 2012 (total of three attempts for each fishery). Follow up emails were sent to those fishery representatives who could not be reached by phone, also starting November 9, 2012.
All fisheries representatives were informed that Shell would be inviting them to an information session with seismic contractor to discuss operation specifics in early 2013.
The majority of contacted fisheries expressly stated ‘no concerns or comments at this stage of project’.
All fisheries representatives were interested in attending any upcoming information sessions/Q&A opportunities once the seismic contractor is selected and the program unfolds.
Some Fisheries representatives questioned the variation between WAZ and NAZ and what mitigation measures would be put in place to ensure coordination with fisheries activities.
Two (2) fisheries representatives noted concerns regarding offshore drilling as a whole but not specific to seismic program or Shell.
Two (2) fisheries representatives requested maps with more detail for the outer edges of the Project Area, and had questions about the effects of a seismic program outside of EA scope Project Area.
One (1) fishery requested clarification on the minimum depths over which seismic would be conducted over the term of the ELs (i.e. how close to Scotia shelf will seismic program come?).
Shell will continue to engage with fisheries representatives to ensure coordination of seismic and fisheries activities.
Shell will invite fisheries representatives to an information session with the seismic contractor to discuss operational specifics prior to seismic activities.
Section 2.3.1 describes the variation between WAZ and NAZ.
Sections 2.3.3 through 2.3.6 describe operational parameters associated with the proposed WAZ survey.
Section 11.4 details the measures proposed to mitigate fisheries interactions.
Where specific requests for information were made, follow-up was made either by phone or email to address the concern or request.
Additionally, information associated with requests is also clarified in the EA. See the following sections:
Section 2.2 and Section 2.3.3 of the EA identifies water depths and spatial boundaries for the Project Area and Seismic Survey Area, respectively.
Section 5.0 and Appendix A describe acoustic modeling that was completed for the project to

Shelburne Basin 3-D Seismic Survey Environmental Assessment 11
Agency/
Stakeholder Group Contact(s) Details of Engagement Comments/Concerns
EA Section where Comment/Concern Addressed/
Response
assess sound propagation impacts.
For EA Addendum: An information package including project updates and the proposed streamer deployment plan was provided by email or mail (if requested) on February 7, 2013.
Follow up phone calls made starting February 25, 2013 to seek feedback.
Face to face meetings currently being organized for late March 2013 with interested / available fisheries representatives.
Face to Face meeting with several fisheries held the week of March 18th, 2013. Feedback provided on timings and locations of swordfish, tuna, gillnet, lobster and scallop activity near project area. Shell to consider and include this information into seismic program planning where appropriate and feasible..
Shell will consider an additional planning session prior to commencement of the seismic program with large pelagic fishery representatives.
No new questions or concerns shared at this time.
Those fisheries reps that have responded to date appreciated the project update and found the level of detail within said packages to be appropriate.
No responses to date indicating a preference for whether Shell should start its program in the North or South portions of the proposed area.
Concerns by large pelagic fisheries that poor coordination between fisheries and Shell seismic program could be disruptive to both parties. Shell and representatives agree that this can be mitigated through continued communication and forecasting by both Shell and fisheries of activity in seismic area during the 2013 program.


APPENDIX D: REVIEW OF THE EFFECTS OF AIRGUN SOUNDS ON MARINE MAMMALS
3
3 By W. John Richardson and Valerie D. Moulton, with subsequent updates (to Oct. 2012) by WJR, VDM, Meike
Holst and others, especially Patrick Abgrall, William E. Cross, and Mari A. Smultea, all of LGL Ltd., environmental research associates.

Table of Contents
Shelburne Basin 3-D Seismic Survey Environmental Assessment ii
TABLE OF CONTENTS
1. REVIEW OF THE EFFECTS OF AIRGUN SOUNDS ON MARINE MAMMALS ................................... 1
1.1 Categories of Noise Effects .............................................................................................. 1
1.2 Hearing Abilities of Marine Mammals ........................................................................... 1
1.2.1 Toothed Whales (Odontocetes) .......................................................................... 2
1.2.2 Baleen Whales (Mysticetes) ................................................................................ 3
1.2.3 Seals and Sea Lions (Pinnipeds) ......................................................................... 3
1.3 Characteristics of Airgun Sounds ................................................................................... 3
1.4 Masking Effects of Airgun Sounds ................................................................................. 6
1.5 Disturbance by Seismic Surveys...................................................................................... 7
1.5.1 Baleen Whales ...................................................................................................... 9
1.5.2 Toothed Whales ................................................................................................. 14
1.5.3 Pinnipeds ............................................................................................................ 20
1.6. Hearing Impairment and Other Physical Effects of Seismic Surveys ....................... 22
1.6.1 Temporary Threshold Shift (TTS) .................................................................. 24
1.6.2 Permanent Threshold Shift (PTS) ................................................................... 28
1.6.3 Strandings and Mortality ................................................................................. 30
1.6.4 Non-Auditory Physiological Effects ................................................................. 32
1.7 Literature Cited .............................................................................................................. 32

Appendix D: Airgun Sounds on Marine Mammals
Shelburne Basin 3-D Seismic Survey Environmental Assessment 1
1. Review of the Effects of Airgun Sounds on Marine Mammals
The following subsections review relevant information concerning the potential effects of airguns on marine mammals. Because this review is intended to be of general usefulness, it includes references to types of marine mammals that will not be found in some specific regions.
1.1 Categories of Noise Effects The effects of noise on marine mammals are highly variable, and can be categorized as follows (adapted
from Richardson et al. 1995):
1. The noise may be too weak to be heard at the location of the animal, i.e., lower than the prevailing ambient noise level, the hearing threshold of the animal at relevant frequencies, or both;
2. The noise may be audible but not strong enough to elicit any overt behavioural response, i.e., the mammal may tolerate it, either without or with some deleterious effects (e.g., masking, stress);
3. The noise may elicit behavioural reactions of variable conspicuousness and variable relevance to the well being of the animal; these can range from subtle effects on respiration or other behaviours (detectable only by statistical analysis) to active avoidance reactions;
4. Upon repeated exposure, animals may exhibit diminishing responsiveness (habituation), or disturbance effects may persist; the latter is most likely with sounds that are highly variable in characteristics, unpredictable in occurrence, and associated with situations that the animal perceives as a threat;
5. Any man-made noise that is strong enough to be heard has the potential to reduce (mask) the ability of marine mammals to hear natural sounds at similar frequencies, including calls from conspecifics, echolocation sounds of odontocetes, and environmental sounds such as surf noise or (at high latitudes) ice noise. Intermittent airgun or sonar pulses would cause strong masking for only a small proportion of the time, given the short duration of these pulses relative to the inter-pulse intervals. Mammal calls and other sounds are often audible during the intervals between pulses, but mild to moderate masking may occur during that time because of reverberation.
6. Very strong sounds have the potential to cause temporary or permanent reduction in hearing sensitivity, or other physical or physiological effects. Received sound levels must far exceed the animal’s hearing threshold for any temporary threshold shift to occur. Received levels must be even higher for a risk of permanent hearing impairment.
1.2 Hearing Abilities of Marine Mammals The hearing abilities of marine mammals are functions of the following (Richardson et al. 1995; Au et al. 2000):
1. Absolute hearing threshold at the frequency in question (the level of sound barely audible in the absence of ambient noise). The “best frequency” is the frequency with the lowest absolute threshold.
2. Critical ratio (the signal-to-noise ratio required to detect a sound at a specific frequency in the presence of background noise around that frequency).
3. The ability to determine sound direction at the frequencies under consideration.
4. The ability to discriminate among sounds of different frequencies and intensities.

Appendix D: Airgun Sounds on Marine Mammals
Shelburne Basin 3-D Seismic Survey Environmental Assessment 2
Marine mammals rely heavily on the use of underwater sounds to communicate and to gain information about their surroundings. Experiments and monitoring studies also show that they hear and may react to many man-made sounds including sounds made during seismic exploration (Richardson et al. 1995; Gordon et al. 2004; Nowacek et al. 2007; Tyack 2008).
1.2.1 Toothed Whales (Odontocetes)
Hearing abilities of some toothed whales (odontocetes) have been studied in detail (reviewed in Chapter 8 of Richardson et al. [1995] and in Au et al. [2000]). Hearing sensitivity of several species has been determined as a function of frequency. The small to moderate-sized toothed whales whose hearing has been studied have relatively poor hearing sensitivity at frequencies below 1 kHz, but extremely good sensitivity at, and above, several kHz. There are very few data on the absolute hearing thresholds of most of the larger, deep-diving toothed whales, such as the sperm and beaked whales. However, Cook et al. (2006) found that a stranded juvenile Gervais’ beaked whale showed evoked potentials from 5 kHz up to 80 kHz (the entire frequency range that was tested), with best sensitivity at 40–80 kHz. An adult Gervais’ beaked whale had a similar upper cutoff frequency (80–90 kHz; Finneran et al. 2009). For a sub-adult Blainville’s beaked whale, Pacini et al. (2011) reported the best hearing range to be 40 to 50 kHz.
Most of the odontocete species have been classified as belonging to the “mid-frequency” (MF) hearing group, and the MF odontocetes (collectively) have functional hearing from about 150 Hz to 160 kHz (Southall et al. 2007). However, individual species may not have quite so broad a functional frequency range. Very strong sounds at frequencies slightly outside the functional range may also be detectable. The remaining odontocetes―the porpoises, river dolphins, and members of the genera Cephalorhynchus and Kogia―are distinguished as the “high frequency” (HF) hearing group. They have functional hearing from about 200 Hz to 180 kHz (Southall et al. 2007).
Airguns produce a small proportion of their sound at mid- and high-frequencies, although at progressively lower levels with increasing frequency. In general, most of the energy in the sound pulses emitted by airgun arrays is at low frequencies; strongest spectrum levels are below 200 Hz, with considerably lower spectrum levels above 1000 Hz, and smaller amounts of energy emitted up to ~150 kHz (Goold and Fish 1998; Sodal 1999; Goold and Coates 2006; Potter et al. 2007).
Belugas hear best at frequencies of ~20–100 kHz. The hearing threshold increase progressively (poorer hearing) outside of this 20–100 kHz range. Belugas are capable of hearing seismic and vessel-generated sounds at lower frequencies, but those sounds are not within their best hearing range. Sounds need to be at or above the hearing threshold to be readily detectable. Sounds must also be at or greater than ambient noise levels in order to be detected. There are no specific hearing data for narwhals, but it is assumed that belugas and narwhals have similar hearing abilities because of their taxonomic similarity; the two are the only species in the family Monodontidae.
Despite the relatively poor sensitivity of small odontocetes at the low frequencies that contribute most of the energy in pulses of sound from airgun arrays, airgun sounds are sufficiently strong, and contain sufficient mid- and high-frequency energy, that their received levels sometimes remain above the hearing thresholds of odontocetes at distances out to several tens of kilometres (Richardson and Würsig 1997). There is no evidence that most small odontocetes react to airgun pulses at such long distances. However, beluga whales do seem quite responsive at intermediate distances (10–20 km) where sound levels are well above the ambient noise level (see below).
In summary, even though odontocete hearing is relatively insensitive to the predominant low frequencies produced by airguns, sounds from airgun arrays are audible to odontocetes, sometimes to distances of 10s of kilometres.
Appendix D: Airgun Sounds on Marine Mammals
Shelburne Basin 3-D Seismic Survey Environmental Assessment 3
1.2.2 Baleen Whales (Mysticetes)
The hearing abilities of baleen whales (mysticetes) have not been studied directly. Behavioral and anatomical evidence indicates that they hear well at frequencies below 1 kHz (Richardson et al. 1995; Ketten 2000). Frankel (2005) noted that gray whales reacted to a 21–25 kHz whale-finding sonar. Some baleen whales react to pinger sounds up to 28 kHz, but not to pingers or sonars emitting sounds at 36 kHz or above (Watkins 1986). In addition, baleen whales produce sounds at frequencies up to 8 kHz and, for humpbacks, with components to >24 kHz (Au et al. 2006). The anatomy of the baleen whale inner ear seems to be well adapted for detection of low-frequency sounds (Ketten 1991, 1992, 1994, 2000; Parks et al. 2007b). Although humpbacks and minke whales (Berta et al. 2009) may have some auditory sensitivity to frequencies above 22 kHz, for baleen whales as a group, the functional hearing range is thought to be about 7 Hz to 22 kHz or possibly 25 kHz; baleen whales are said to constitute the “low-frequency” (LF) hearing group (Southall et al. 2007; Scholik-Schlomer 2012). The absolute sound levels that they can detect below 1 kHz are probably limited by increasing levels of natural ambient noise at decreasing frequencies (Clark and Ellison 2004). Ambient noise levels are higher at low frequencies than at mid frequencies. At frequencies below 1 kHz, natural ambient levels tend to increase with decreasing frequency.
The hearing systems of baleen whales are undoubtedly more sensitive to low-frequency sounds than are the ears of the small toothed whales that have been studied directly. Thus, baleen whales are likely to hear airgun pulses farther away than can small toothed whales and, at closer distances, airgun sounds may seem more prominent to baleen than to toothed whales. However, baleen whales have commonly been seen well within the distances where seismic (or other source) sounds would be detectable and often show no overt reaction to those sounds. Behavioral responses by baleen whales to seismic pulses have been documented, but received levels of pulsed sounds necessary to elicit behavioural reactions are typically well above the minimum levels that the whales are assumed to detect (see below).
1.2.3 Seals and Sea Lions (Pinnipeds)
Underwater audiograms have been obtained using behavioural methods for three species of phocinid seals, two species of monachid seals, two species of otariids, and the walrus (reviewed in Richardson et al. 1995: 211ff; Kastak and Schusterman 1998, 1999; Kastelein et al. 2002, 2009). The functional hearing range for pinnipeds in water is considered to extend from 75 Hz to 75 kHz (Southall et al. 2007), although some individual species―especially the eared seals―do not have that broad an auditory range (Richardson et al. 1995). In comparison with odontocetes, pinnipeds tend to have lower best frequencies, lower high-frequency cutoffs, better auditory sensitivity at low frequencies, and poorer sensitivity at the best frequency.
At least some of the phocid seals have better sensitivity at low frequencies (1 kHz) than do odontocetes. Below 30–50 kHz, the hearing thresholds of most species tested are essentially flat down to ~1 kHz, and range between 60 and 85 dB re 1 µPa. Measurements for harbor seals indicate that, below 1 kHz, their thresholds under quiet background conditions deteriorate gradually with decreasing frequency to ~75 dB re 1 µPa at 125 Hz (Kastelein et al. 2009).
For the otariid (eared) seals, the high frequency cutoff is lower than for phocinids, and sensitivity at low frequencies (e.g., 100 Hz) is poorer than for seals (harbor seal).
1.3 Characteristics of Airgun Sounds Airguns function by venting high-pressure air into the water. The pressure signature of an individual
airgun consists of a sharp rise and then fall in pressure, followed by several positive and negative pressure

Appendix D: Airgun Sounds on Marine Mammals
Shelburne Basin 3-D Seismic Survey Environmental Assessment 4
excursions caused by oscillation of the resulting air bubble. The sizes, arrangement, and firing times of the individual airguns in an array are designed and synchronized to suppress the pressure oscillations subsequent to the first cycle. The resulting downward-directed pulse has a duration of only 10–20 ms, with only one strong positive and one strong negative peak pressure (Caldwell and Dragoset 2000). Most energy emitted from airguns is at relatively low frequencies. For example, typical high-energy airgun arrays emit most energy at 10–120 Hz. However, the pulses contain significant energy up to 500–1000 Hz and some energy at higher frequencies (Goold and Fish 1998; Potter et al. 2007). Studies in the Gulf of Mexico have shown that the horizontally-propagating sound can contain significant energy above the frequencies that airgun arrays are designed to emit (DeRuiter et al. 2006; Madsen et al. 2006; Tyack et al. 2006a). Energy at frequencies up to 150 kHz was found in tests of single 60-in3 and 250-in3 airguns (Goold and Coates 2006). Nonetheless, the predominant energy is at low frequencies.
The pulsed sounds associated with seismic exploration have higher peak levels than other industrial sounds (except those from explosions) to which whales and other marine mammals are routinely exposed. The nominal source levels of the 2- to 36-airgun arrays used by Lamont-Doherty Earth Observatory (L-DEO) from the R/V Maurice Ewing (now retired) and R/V Marcus G. Langseth (36 airguns) are 236–265 dB re 1 µPap–p. These are the nominal source levels applicable to downward propagation. The effective source levels for horizontal propagation are lower than those for downward propagation when the source consists of numerous airguns spaced apart from one another. Explosions are the only man-made sources with effective source levels as high as (or higher than) a large array of airguns. However, high-power sonars can have source pressure levels as high as a small array of airguns, and signal duration can be longer for a sonar than for an airgun array, making the source energy levels of some sonars more comparable to those of airgun arrays.
Several important mitigating factors need to be kept in mind. (1) Airgun arrays produce intermittent sounds, involving emission of a strong sound pulse for a small fraction of a second followed by several seconds of near silence. In contrast, some other sources produce sounds with lower peak levels, but their sounds are continuous or discontinuous but continuing for longer durations than seismic pulses. (2) Airgun arrays are designed to transmit strong sounds downward through the seafloor, and the amount of sound transmitted in near-horizontal directions is considerably reduced. Nonetheless, they also emit sounds that travel horizontally toward non-target areas. (3) An airgun array is a distributed source, not a point source. The nominal source level is an estimate of the sound that would be measured from a theoretical point source emitting the same total energy as the airgun array. That figure is useful in calculating the expected received levels in the far field, i.e., at moderate and long distances, but not in the near field. Because the airgun array is not a single point source, there is no one location within the near field (or anywhere else) where the received level is as high as the nominal source level.
The strengths of airgun pulses can be measured in different ways, and it is important to know which method is being used when interpreting quoted source or received levels. Geophysicists usually quote peak-to-peak (p-p) levels, in bar-metres or (less often) dB re 1 μPa · m. The peak (= zero-to-peak, or 0-p) level for the same pulse is typically ~6 dB less. In the biological literature, levels of received airgun pulses are often described based on the “average” or “root-mean-square” (rms) level, where the average is calculated over the duration of the pulse. The rms value for a given airgun pulse is typically ~10 dB lower than the peak level, and 16 dB lower than the peak-to-peak value (Greene 1997; McCauley et al. 1998, 2000a). A fourth measure that is increasingly used is the energy, or Sound Exposure Level (SEL), in dB re 1 μPa2 · s. Because the pulses, even when stretched by propagation effects (see below), are usually <1 s in duration, the numerical value of the energy is usually lower

Appendix D: Airgun Sounds on Marine Mammals
Shelburne Basin 3-D Seismic Survey Environmental Assessment 5
than the rms pressure level. However, the units are different.4 Because the level of a given pulse will differ substantially depending on which of these measures is being applied, it is important to be aware which measure is in use when interpreting any quoted pulse level. In the past, the U.S. National Marine Fisheries Service (NMFS) has commonly referred to rms levels when discussing levels of pulsed sounds that might “harass” marine mammals.
Seismic sound pulses received at any given point will arrive via a direct path, indirect paths that include reflection from the sea surface and bottom, and often indirect paths including segments through the bottom sediments. Sounds propagating via indirect paths travel longer distances and often arrive later than sounds arriving via a direct path. (However, sound traveling in the bottom may travel faster than that in the water, and thus may, in some situations, arrive slightly earlier than the direct arrival despite traveling a greater distance.) These variations in travel time have the effect of lengthening the duration of the received pulse, or may cause two or more received pulses from a single emitted pulse. Near the source, the predominant part of a seismic pulse is ~10–20 ms in duration. In comparison, the pulse duration as received at long horizontal distances can be much greater. For example, for one airgun array operating in the Beaufort Sea, pulse duration was ~300 ms at a distance of 8 km, 500 ms at 20 km, and 850 ms at 73 km (Greene and Richardson 1988).
The rms level for a given pulse (when measured over the duration of that pulse) depends on the extent to which propagation effects have “stretched” the duration of the pulse by the time it reaches the receiver (e.g., Madsen 2005). As a result, the rms values for various received pulses are not perfectly correlated with the SEL (energy) values for the same pulses. There is increasing evidence that biological effects are more directly related to the received energy (e.g., to SEL) than to the rms values averaged over pulse duration (Southall et al. 2007). However, there is also recent evidence that auditory effect in a given animal is not a simple function of received acoustic energy. Frequency, duration of the exposure, and occurrence of gaps within the exposure can also influence the auditory effect (Mooney et al. 2009a; Finneran and Schlundt 2010, 2011; Finneran et al. 2010a,b; Finneran 2012).
Another important aspect of sound propagation is that received levels of low-frequency underwater sounds diminish close to the surface because of pressure-release and interference phenomena that occur at and near the surface (Urick 1983; Richardson et al. 1995; Potter et al. 2007). Paired measurements of received airgun sounds at depths of 3 vs. 9 or 18 m have shown that received levels are typically several decibels lower at 3 m (Greene and Richardson 1988). For a mammal whose auditory organs are within 0.5 or 1 m of the surface, the received level of the predominant low-frequency components of the airgun pulses would be further reduced. In deep water, the received levels at deep depths can be considerably higher than those at relatively shallow (e.g., 18 m) depths and the same horizontal distance from the airguns (Tolstoy et al. 2004a,b).
Pulses of underwater sound from open-water seismic exploration are often detected 50–100 km from the source location, even during operations in nearshore waters (Greene and Richardson 1988; Burgess and Greene 1999). At those distances, the received levels are usually low, <120 dB re 1 Pa on an approximate rms basis. However, faint seismic pulses are sometimes detectable at even greater ranges (e.g., Bowles et al. 1994; Fox et al. 2002). In fact, low-frequency airgun signals sometimes can be detected thousands of kilometres from their source. For example, sound from seismic surveys conducted offshore of Nova Scotia, the coast of western Africa,
4 The rms value for a given airgun array pulse, as measured at a horizontal distance on the order of 0.1 km to
1-10 km in the units dB re 1 μPa, usually averages 10–15 dB higher than the SEL value for the same pulse measured in dB re 1 μPa2 · s (e.g., Greene 1997). However, there is considerable variation, and the difference tends to be larger close to the airgun array, and less at long distances (Blackwell et al. 2007; MacGillivray and Hannay 2007a,b). In some cases, generally at longer distances, pulses are “stretched” by propagation effects to the extent that the rms and SEL values (in the respective units mentioned above) become very similar (e.g., MacGillivray and Hannay 2007a,b).

Appendix D: Airgun Sounds on Marine Mammals
Shelburne Basin 3-D Seismic Survey Environmental Assessment 6
and northeast of Brazil were reported as a dominant feature of the underwater noise field recorded along the mid-Atlantic ridge (Nieukirk et al. 2004).
1.4 Masking Effects of Airgun Sounds Masking is the obscuring of sounds of interest by interfering sounds, generally at similar frequencies.
Introduced underwater sound will, through masking, reduce the effective communication distance of a marine mammal species • if the frequency of the source is close to that used as a signal by the marine mammal, and • if the anthropogenic sound is present for a significant fraction of the time (Richardson et al. 1995; Clark et al. 2009). Conversely, if little or no overlap occurs between the introduced sound and the frequencies used by the species, communication is not expected to be disrupted. Also, if the introduced sound is present only infrequently, communication is not expected to be disrupted much if at all. The biological repercussions of a loss of communication space, to the extent that this occurs, are unknown.
The duty cycle of airguns is low; the airgun sounds are pulsed, with relatively quiet periods between pulses. In most situations, strong airgun sound will only be received for a brief period (<1 s), with these sound pulses being separated by at least several seconds of relative silence, and longer in the case of deep-penetration surveys or refraction surveys. A single airgun array would cause strong masking in only one situation: When propagation conditions are such that sound from each airgun pulse reverberates strongly and persists for much or all of the interval up to the next airgun pulse (e.g., Simard et al. 2005; Clark and Gagnon 2006). Situations with prolonged strong reverberation are infrequent, in our experience. However, it is common for reverberation to cause some lesser degree of elevation of the background level between airgun pulses (e.g., Gedamke 2011; Guerra et al. 2011), and this weaker reverberation presumably reduces the detection range of calls and other natural sounds to some degree. Based on measurements in deep water of the Southern Ocean, Gedamke (2011) estimated that the slight elevation of background levels during intervals between pulses reduced blue and fin whale communication space by as much as 36 to 51% when a seismic survey was operating 450–2800 km away. Nieukirk et al. (2011), based on data from Fram Strait and the Greenland Sea, also found reverberation effects between airgun pulses and noted the potential for masking effects from seismic surveys on large whales. Similarly, Nieukirk et al. (2012) note the potential for masking effects on whales, based on an analysis of airgun sounds from distant seismic surveys and fin whale calls recorded in the Mid-Atlantic Ridge.
Although masking effects of pulsed sounds on marine mammal calls and other natural sounds are expected to be limited, there are few specific studies on this. Some whales continue calling in the presence of seismic pulses and whale calls often can be heard between the seismic pulses (e.g., Richardson et al. 1986; McDonald et al. 1995; Greene et al. 1999a,b; Nieukirk et al. 2004; Smultea et al. 2004; Holst et al. 2005a,b, 2006, 2011; Dunn and Hernandez 2009; Cerchio et al. 2011). However, some of these studies found evidence of reduced calling (or at least reduced call detection rates) in the presence of seismic pulses. One recent report indicates that calling fin whales distributed in a part of the North Atlantic went silent for an extended period starting soon after the onset of a seismic survey in the area (Clark and Gagnon 2006). It is not clear from that paper whether the whales ceased calling because of masking, or whether this was a behavioural response not directly involving masking. Also, bowhead whales in the Beaufort Sea apparently decrease their calling rates in response to seismic operations, although movement out of the area also contributes to the lower call detection rate (Blackwell et al. 2009a,b, 2010, 2011). In contrast, Di Iorio and Clark (2010) found that blue whales in the St. Lawrence Estuary increased their call rates during operations by a lower-energy seismic source. The sparker used during the study emitted frequencies of 30–450 Hz with a relatively low source level of 193 dB re 1 μPapk-pk. There is some evidence that fin whale song notes recorded in the Mediterranean had lower bandwidths during periods with versus without airgun sounds (Castellote et al. 2012).

Appendix D: Airgun Sounds on Marine Mammals
Shelburne Basin 3-D Seismic Survey Environmental Assessment 7
Among the odontocetes, there has been one report that sperm whales ceased calling when exposed to pulses from a very distant seismic ship (Bowles et al. 1994). However, more recent studies of sperm whales found that they continued calling in the presence of seismic pulses (Madsen et al. 2002; Tyack et al. 2003; Smultea et al. 2004; Holst et al. 2006, 2011; Jochens et al. 2008). Madsen et al. (2006) noted that airgun sounds would not be expected to cause significant masking of sperm whale calls given the intermittent nature of airgun pulses. (However, some limited masking would be expected due to reverberation effects, as noted above.) Dolphins and porpoises are also commonly heard calling while airguns are operating (Gordon et al. 2004; Smultea et al. 2004; Holst et al. 2005a,b, 2011; Potter et al. 2007). Masking effects of seismic pulses are expected to be negligible in the case of the smaller odontocetes, given the intermittent nature of seismic pulses plus the fact that sounds important to them are predominantly at much higher frequencies than are the dominant components of airgun sounds.
Pinnipeds, sirenians and sea otters have best hearing sensitivity and/or produce most of their sounds at frequencies higher than the dominant components of airgun sound, but there is some overlap in the frequencies of the airgun pulses and the calls. However, the intermittent nature of airgun pulses presumably reduces the potential for masking.
Some cetaceans are known to increase the source levels of their calls in the presence of elevated sound levels, shift their peak frequencies in response to strong sound signals, or otherwise modify their vocal behaviour in response to increased noise (Dahlheim 1987; Au 1993; reviewed in Richardson et al. 1995:233ff, 364ff; also Lesage et al. 1999; Terhune 1999; Nieukirk et al. 2005; Scheifele et al. 2005; Parks et al. 2007a, 2009, 2011; Hanser et al. 2009; Holt et al. 2009; Castellote et al. 2010a,b; Di Iorio and Clark 2010). It is not known how often these types of responses occur upon exposure to airgun sounds. If cetaceans exposed to airgun sounds sometimes respond by changing their vocal behaviour, this adaptation, along with directional hearing and preadaptation to tolerate some masking by natural sounds (Richardson et al. 1995), would all reduce the importance of masking by seismic pulses.
1.5 Disturbance by Seismic Surveys Disturbance includes a variety of effects, including subtle to conspicuous changes in behaviour,
movement, and displacement. In the terminology of the 1994 amendments to the U.S. Marine Mammal Protection Act (MMPA), seismic noise could cause “Level B” harassment of certain marine mammals. Level B harassment is defined as “...disruption of behavioural patterns, including, but not limited to, migration, breathing, nursing, breeding, feeding, or sheltering”.
There has been debate regarding how substantial a change in behaviour or mammal activity is required before the animal should be deemed to be “taken by Level B harassment”. NMFS has stated that
“…a simple change in a marine mammal’s actions does not always rise to the level of disruption of its behavioural patterns. … If the only reaction to the [human] activity on the part of the marine mammal is within the normal repertoire of actions that are required to carry out that behavioural pattern, NMFS considers [the human] activity not to have caused a disruption of the behavioural pattern, provided the animal’s reaction is not otherwise significant enough to be considered disruptive due to length or severity. Therefore, for example, a short-term change in breathing rates or a somewhat shortened or lengthened dive sequence that are within the animal’s normal range and that do not have any biological significance (i.e., do no disrupt the animal’s overall behavioural pattern of breathing under the circumstances), do not rise to a level requiring a small take authorization.” (NMFS 2001, p. 9293).

Appendix D: Airgun Sounds on Marine Mammals
Shelburne Basin 3-D Seismic Survey Environmental Assessment 8
Based on this guidance from NMFS, and on NRC (2005), simple exposure to sound, or brief reactions that do not disrupt behavioural patterns in a potentially significant manner, do not constitute harassment or “taking”. In this analysis, we interpret “potentially significant” to mean in a manner that might have deleterious effects on the well-being of individual marine mammals or their populations.
Even with this guidance, there are difficulties in defining what marine mammals should be counted as “taken by harassment”. Available detailed data on reactions of marine mammals to airgun sounds (and other anthropogenic sounds) are limited to relatively few species and situations (see Richardson et al. 1995; Gordon et al. 2004; Nowacek et al. 2007; Southall et al. 2007). Behavioral reactions of marine mammals to sound are difficult to predict in the absence of site- and context-specific data. Reactions to sound, if any, depend on species, state of maturity, experience, current activity, reproductive state, time of day, and many other factors (Richardson et al. 1995; Wartzok et al. 2004; Southall et al. 2007; Weilgart 2007; Ellison et al. 2012). If a marine mammal reacts to an underwater sound by changing its behaviour or moving a small distance, the impacts of the change are unlikely to be significant to the individual, let alone the stock or population. However, if a sound source displaces marine mammals from an important feeding or breeding area for a prolonged period, impacts on individuals and populations could be significant (e.g., Lusseau and Bejder 2007; Weilgart 2007). Also, various authors have noted that some marine mammals that show no obvious avoidance or behavioural changes may still be adversely affected by noise (Brodie 1981; Richardson et al. 1995:317ff; Romano et al. 2004; Weilgart 2007; Wright et al. 2009, 2011). For example, some research suggests that animals in poor condition or in an already stressed state may not react as strongly to human disturbance as would more robust animals (e.g., Beale and Monaghan 2004).
Studies of the effects of seismic surveys have focused almost exclusively on the effects on individual species or related groups of species, with little scientific or regulatory attention being given to broader community-level issues. Parente et al. (2007) suggested that the diversity of cetaceans near the Brazil coast was reduced during years with seismic surveys. However, a preliminary account of a more recent analysis suggests that the trend did not persist when additional years were considered (Britto and Silva Barreto 2009).
Given the many uncertainties in predicting the quantity and types of impacts of sound on marine mammals, it is common practice to estimate how many mammals would be present within a particular distance of human activities and/or exposed to a particular level of anthropogenic sound. In most cases, this approach likely overestimates the numbers of marine mammals that would be affected in some biologically important manner. One of the reasons for this is that the selected distances/isopleths are based on limited studies indicating that some animals exhibited short-term reactions at this distance or sound level, whereas the calculation assumes that all animals exposed to this level would react in a biologically significant manner.
The definitions of “taking” in the U.S. MMPA, and its applicability to various activities, were slightly altered in November 2003 for military and federal scientific research activities. Also, NMFS is proposing to replace current Level A and B harassment criteria with guidelines based on exposure characteristics that are specific to particular groups of mammal species and to particular sound types (NMFS 2005; Scholik-Schlomer 2012). Recently, a committee of specialists on noise impact issues has proposed new science-based impact criteria (Southall et al. 2007). Thus, for projects subject to U.S. jurisdiction, changes in procedures may be required in the near future.
The sound criteria used to estimate how many marine mammals might be disturbed to some biologically significant degree by seismic survey activities are primarily based on behavioural observations of a few species. Detailed studies have been done on humpback, gray, bowhead, and sperm whales, and on ringed seals. Less detailed data are available for some other species of baleen whales and small toothed whales, but for many species there are no data on responses to marine seismic surveys.

Appendix D: Airgun Sounds on Marine Mammals
Shelburne Basin 3-D Seismic Survey Environmental Assessment 9
1.5.1 Baleen Whales
Baleen whales generally tend to avoid operating airguns, but avoidance radii are quite variable among species, locations, whale activities, oceanographic conditions affecting sound propagation, etc. (reviewed in Richardson et al. 1995; Gordon et al. 2004). Whales are often reported to show no overt reactions to pulses from large arrays of airguns at distances beyond a few kilometres, even though the airgun pulses remain well above ambient noise levels out to much longer distances. However, baleen whales exposed to strong sound pulses from airguns often react by deviating from their normal migration route and/or interrupting their feeding and moving away. Some of the major studies and reviews on this topic are Malme et al. (1984, 1985, 1988); Richardson et al. (1986, 1995, 1999); Ljungblad et al. (1988); Richardson and Malme (1993); McCauley et al. (1998, 2000a,b); Miller et al. (1999, 2005); Gordon et al. (2004); Stone and Tasker (2006); Johnson et al. (2007); Nowacek et al. (2007); Weir (2008a); and Moulton and Holst (2010). Although baleen whales often show only slight overt responses to operating airgun arrays (Stone and Tasker 2006; Weir 2008a), strong avoidance reactions by several species of mysticetes have been observed at ranges up to 6–8 km and occasionally as far as 20–30 km from the source vessel when large arrays of airguns were used. Experiments with a single airgun showed that bowhead, humpback and gray whales all showed localized avoidance to a single airgun of 20–100 in3 (Malme et al. 1984, 1985, 1986, 1988; Richardson et al. 1986; McCauley et al. 1998, 2000a,b).
Studies of gray, bowhead, and humpback whales have shown that seismic pulses with received levels of 160–170 dB re 1 Parms seem to cause obvious avoidance behaviour in a substantial portion of the animals exposed (Richardson et al. 1995). In many areas, seismic pulses from large arrays of airguns diminish to those levels at distances ranging from 4–15 km from the source. More recent studies have shown that some species of baleen whales (bowheads and humpbacks in particular) at times show strong avoidance at received levels lower than 160–170 dB re 1 μParms. The largest avoidance radii involved migrating bowhead whales, which avoided an operating seismic vessel by 20–30 km (Miller et al. 1999; Richardson et al. 1999). In the cases of migrating bowhead (and gray) whales, the observed changes in behaviour appeared to be of little or no biological consequence to the animals—they simply avoided the sound source by displacing their migration route to varying degrees, but within the natural boundaries of the migration corridors (Malme et al. 1984; Malme and Miles 1985; Richardson et al. 1995). Feeding bowhead whales, in contrast to migrating whales, show much smaller avoidance distances (Miller et al. 2005; Harris et al. 2007), presumably because moving away from a food concentration has greater cost to the whales than does a course deviation during migration.
The following subsections provide more details on the documented responses of particular species and groups of baleen whales to marine seismic operations.
Humpback Whale
Responses of humpback whales to seismic surveys have been studied during migration, on the summer feeding grounds, and on Angolan winter breeding grounds; there has also been discussion of effects on the Brazilian wintering grounds. McCauley et al. (1998, 2000a) studied the responses of migrating humpback whales off Western Australia to a full-scale seismic survey with a 16-airgun 2678-in3 array, and to a single 20 in3 airgun with a (horizontal) source level of 227 dB re 1 Pa · mp-p. They found that the overall distribution of humpbacks migrating through their study area was unaffected by the full-scale seismic program, although localized displacement varied with pod composition, behaviour, and received sound levels. Observations were made from the seismic vessel, from which the maximum viewing distance was listed as 14 km. Avoidance reactions (course and speed changes) began at 4–5 km for traveling pods, with the closest point of approach (CPA) being 3–4 km at an estimated received level of 157–164 dB re 1 µParms (McCauley et al. 1998, 2000a). A greater stand-off range of 7–12 km was observed for more sensitive resting pods (cow-calf pairs; McCauley et al. 1998, 2000a). The mean received level for initial avoidance of an approaching airgun was 140 dB re 1 µParms for humpback pods

Appendix D: Airgun Sounds on Marine Mammals
Shelburne Basin 3-D Seismic Survey Environmental Assessment 10
containing females, and at the mean CPA distance the received level was 143 dB re 1 µParms. One startle response was reported at 112 dB re 1 µParms. The initial avoidance response generally occurred at distances of 5–8 km from the airgun array and 2 km from the single airgun. However, some individual humpback whales, especially males, approached within distances of 100–400 m, where the maximum received level was 179 dB re 1 Parms. The McCauley et al. (1998, 2000a,b) studies show evidence of greater avoidance of seismic airgun sounds by pods with females than by other pods during humpback migration off Western Australia. Studies examining the behavioural response of humpback whales off Eastern Australia to airguns are currently underway (Cato et al. 2011).
Humpback whales on their summer feeding grounds in southeast Alaska did not exhibit persistent avoidance when exposed to seismic pulses from a 1.64-L (100 in3) airgun (Malme et al. 1985). Some humpbacks seemed “startled” at received levels of 150–169 dB re 1 Pa. Malme et al. (1985) concluded that there was no clear evidence of avoidance, despite the possibility of subtle effects, at received levels up to 172 re 1 Pa on an approximate rms basis. However, Moulton and Holst (2010) reported that humpback whales monitored during seismic surveys in the Northwest Atlantic had significantly lower sighting rates and were most often seen swimming away from the vessel during seismic periods compared with periods when airguns were silent.
Among wintering humpback whales off Angola (n = 52 useable groups), there were no significant differences in encounter rates (sightings/hr) when a 24-airgun array (3147 in3 or 5085 in3) was operating vs. silent (Weir 2008a). There was also no significant difference in the mean CPA (closest observed point of approach) distance of the humpback sightings when airguns were on vs. off (3050 m vs. 2700 m, respectively). Cerchio et al. (2011) suggested that the breeding display of humpback whales off Angola may be disrupted by seismic sounds, as singing activity declined with increasing received levels.
It has been suggested that South Atlantic humpback whales wintering off Brazil may be displaced or even strand upon exposure to seismic surveys (Engel et al. 2004). The evidence for this was circumstantial and subject to alternative explanations (IAGC 2004). Also, the evidence was not consistent with subsequent results from the same area of Brazil (Parente et al. 2006), or with direct studies of humpbacks exposed to seismic surveys in other areas and seasons (see above). After allowance for data from subsequent years, there was “no observable direct correlation” between strandings and seismic surveys (IWC 2007, p. 236).
Bowhead Whale
Responsiveness of bowhead whales to seismic surveys can be quite variable depending on their activity (feeding vs. migrating). Bowhead whales on their summer feeding grounds in the Canadian Beaufort Sea showed no obvious reactions to pulses from seismic vessels at distances of 6–99 km and received sound levels of 107-158 dB on an approximate rms basis (Richardson et al. 1986); their general activities were indistinguishable from those of a control group. However, subtle but statistically significant changes in surfacing–respiration–dive cycles were evident upon statistical analysis (also see Robertson et al. 2011). Bowheads usually did show strong avoidance responses when seismic vessels approached within a few kilometres (~3–7 km) and when received levels of airgun sounds were 152–178 dB (Richardson et al. 1986, 1995; Ljungblad et al. 1988; Miller et al. 2005). They also moved away when a single airgun fired nearby (Richardson et al. 1986; Ljungblad et al. 1988). In one case, bowheads engaged in near-bottom feeding began to turn away from a 30-airgun array with a source level of 248 dB re 1 μPa ·
m at a distance of 7.5 km, and swam away when it came within ~2 km; some whales continued feeding until the vessel was 3 km away (Richardson et al. 1986). This work and subsequent summer studies in the same region by Miller et al. (2005) and Harris et al. (2007) showed that many feeding bowhead whales tend to tolerate higher sound levels than migrating bowhead whales (see below) before showing an overt change in behaviour. On the summer feeding grounds, bowhead whales are often seen from the operating seismic ship, though average sighting distances tend to be larger when the airguns are operating. Similarly, preliminary
Appendix D: Airgun Sounds on Marine Mammals
Shelburne Basin 3-D Seismic Survey Environmental Assessment 11
analyses of recent data from the Alaskan Beaufort Sea indicate that bowheads feeding there during late summer and autumn also did not display large-scale distributional changes in relation to seismic operations (Christie et al. 2009; Koski et al. 2009). However, some individual bowheads apparently begin to react at distances a few kilometres away, beyond the distance at which observers on the ship can sight bowheads (Richardson et al. 1986; Citta et al. 2007). The feeding whales may be affected by the sounds, but the need to feed may reduce the tendency to move away until the airguns are within a few kilometres.
Migrating bowhead whales in the Alaskan Beaufort Sea seem more responsive to noise pulses from a distant seismic vessel than are summering bowheads. Bowhead whales migrating west across the Alaskan Beaufort Sea in autumn are unusually responsive, with substantial avoidance occurring out to distances of 20-30 km from a medium-sized airgun source at received sound levels of around 120–130 dB re 1 µParms (Miller et al. 1999; Richardson et al. 1999; see also Manly et al. 2007). Those results came from 1996–98, when a partially-controlled study of the effect of Ocean Bottom Cable (OBC) seismic surveys on westward-migrating bowheads was conducted in late summer and autumn in the Alaskan Beaufort Sea. At times when the airguns were not active, many bowheads moved into the area close to the inactive seismic vessel. Avoidance of the area of seismic operations did not persist beyond 12–24 h after seismic shooting stopped. Preliminary analysis of recent data on traveling bowheads in the Alaskan Beaufort Sea also showed a stronger tendency to avoid operating airguns than was evident for feeding bowheads (Christie et al. 2009; Koski et al. 2009).
Bowhead whale calls detected in the presence and absence of airgun sounds have been studied extensively in the Beaufort Sea. Early work on the summering grounds in the Canadian Beaufort Sea showed that bowheads continue to produce calls of the usual types when exposed to airgun sounds, although numbers of calls detected may be somewhat lower in the presence of airgun pulses (Richardson et al. 1986). Studies during autumn in the Alaskan Beaufort Sea, one in 1996–1998 and another in 2007–2010, have shown that numbers of calls detected are significantly lower in the presence than in the absence of airgun pulses (Greene et al. 1999a,b; Blackwell et al. 2009a,b, 2010, 2011; Koski et al. 2009; see also Nations et al. 2009). Blackwell et al. (2011) reported that calling rates started to decline at a cumulative SEL, as summed over 15 min, of 120 dB re 1 µPa2 · s, or an SPL at the whale of at least 100 dB re 1 µParms. This decrease could have resulted from movement of the whales away from the area of the seismic survey or a reduction in calling behaviour, or a combination of the two. However, concurrent aerial surveys showed that there was strong avoidance of the operating airguns during the 1996–98 study, when most of the whales appeared to be migrating (Miller et al. 1999; Richardson et al. 1999). In contrast, aerial surveys during 2007–2010 showed less consistent avoidance by the bowheads, many of which appeared to be feeding (Christie et al. 2009; Koski et al. 2009, 2011). The reduction in call detection rates during periods of airgun operation may have been more dependent on actual avoidance during the 1996–98 study and more dependent on reduced calling behaviour during 2007–2010, but further analysis of the recent data is ongoing.
A recent multivariate analysis of factors affecting the distribution of calling bowhead whales during their fall migration in 2009 noted that the southern edge of the distribution of calling whales was significantly closer to shore with increasing levels of airgun sound from a seismic survey a few hundred kilometres to the east of the study area (i.e., behind the westward-migrating whales; McDonald et al. 2010, 2011). It was not known whether this statistical effect represented a stronger tendency for quieting of the whales farther offshore in deeper water upon exposure to airgun sound, or an actual inshore displacement of whales.
There are no data on reactions of bowhead whales to seismic surveys in winter or spring.
Gray Whale
Malme et al. (1986, 1988) studied the responses of feeding eastern gray whales to pulses from a single 100-in3 airgun off St. Lawrence Island in the northern Bering Sea. They estimated, based on small sample sizes, that 50% of feeding gray whales stopped feeding at an average received pressure level of 173 dB re 1 Pa on an
Appendix D: Airgun Sounds on Marine Mammals
Shelburne Basin 3-D Seismic Survey Environmental Assessment 12
(approximate) rms basis, and that 10% of feeding whales interrupted feeding at received levels of 163 dB re 1 Parms. Malme at al. (1986) estimated that an average pressure level of 173 dB occurred at a range of 2.6-2.8 km from an airgun array with a source level of 250 dB re 1 µPapeak in the northern Bering Sea. These findings were generally consistent with the results of studies conducted on larger numbers of gray whales migrating off California (Malme et al. 1984; Malme and Miles 1985) and western Pacific gray whales feeding off Sakhalin, Russia (Würsig et al. 1999; Gailey et al. 2007; Johnson et al. 2007; Yazvenko et al. 2007a,b), along with a few data on gray whales off British Columbia (Bain and Williams 2006).
Malme and Miles (1985) concluded that, during migration off California, gray whales showed changes in swimming pattern with received levels of ~160 dB re 1 Pa and higher, on an approximate rms basis. The 50% probability of avoidance was estimated to occur at a CPA distance of 2.5 km from a 4000-in³ airgun array operating off central California. This would occur at an average received sound level of ~170 dB re 1 µParms. Some slight behavioural changes were noted when approaching gray whales reached the distances where received sound levels were 140 to 160 dB re 1 µParms, but these whales generally continued to approach (at a slight angle) until they passed the sound source at distances where received levels averaged ~170 dB re 1 µParms (Malme et al. 1984; Malme and Miles 1985).
There was no indication that western gray whales exposed to seismic noise were displaced from their overall feeding grounds near Sakhalin Island during seismic programs in 1997 (Würsig et al. 1999) and in 2001 (Johnson et al. 2007; Meier et al. 2007; Yazvenko et al. 2007a). However, there were indications of subtle behavioural effects among whales that remained in the areas exposed to airgun sounds (Würsig et al. 1999; Gailey et al. 2007; Weller et al. 2006a). Also, there was evidence of localized redistribution of some individuals within the nearshore feeding ground so as to avoid close approaches by the seismic vessel (Weller et al. 2002, 2006b; Yazvenko et al. 2007a). Despite the evidence of subtle changes in some quantitative measures of behaviour and local redistribution of some individuals, there was no apparent change in the frequency of feeding, as evident from mud plumes visible at the surface (Yazvenko et al. 2007b). The 2001 seismic program involved an unusually comprehensive combination of real-time monitoring and mitigation measures designed to avoid exposing western gray whales to received levels of sound above about 163 dB re 1 μParms (Johnson et al. 2007). The lack of strong avoidance or other strong responses was presumably in part a result of the mitigation measures. Effects probably would have been more significant without such intensive mitigation efforts. Limited data obtained during a monitoring program in 2010 indicated that an increase in vessel traffic and seismic operations may have displaced gray whales from their preferred feeding area (WWF et al. 2010). However, this study also reports that the number of gray whales in the area increased several days after seismic acquisition ceased.
Gray whales in British Columbia exposed to seismic survey sound levels up to ~170 dB re 1 μPa did not appear to be strongly disturbed (Bain and Williams 2006). The few whales that were observed moved away from the airguns but toward deeper water where sound levels were said to be higher due to propagation effects (Bain and Williams 2006).
Rorquals
Blue, sei, fin, and minke whales (all of which are members of the genus Balaenoptera) often have been seen in areas ensonified by airgun pulses (Stone 2003; MacLean and Haley 2004; Stone and Tasker 2006), and calls from blue and fin whales have been localized in areas with airgun operations (e.g., McDonald et al. 1995; Dunn and Hernandez 2009; Castellote et al. 2010a,b). Sightings by observers on seismic vessels during 110 large-source seismic surveys off the U.K. from 1997 to 2000 suggest that, during times of good sightability, sighting rates for mysticetes (mainly fin and sei whales) were similar when large arrays of airguns were shooting vs. silent (Stone 2003; Stone and Tasker 2006). However, these whales tended to exhibit localized avoidance, remaining significantly further (on average) from the airgun array during seismic operations compared with non-seismic periods (P = 0.0057; Stone and Tasker 2006). The average CPA distances for baleen whales sighted

Appendix D: Airgun Sounds on Marine Mammals
Shelburne Basin 3-D Seismic Survey Environmental Assessment 13
when large airgun arrays were operating vs. silent were about 1.6 vs. 1.0 km. Baleen whales, as a group, were more often oriented away from the vessel while a large airgun array was shooting compared with periods of no shooting (P <0.05; Stone and Tasker 2006). Similarly, Castellote et al. (2009, 2010a,b; 2012) reported that singing fin whales in the Mediterranean moved away from an operating airgun array and avoided the area for days after airgun activity had ceased. In addition, Stone (2003) noted that fin/sei whales were less likely to remain submerged during periods of seismic shooting.
During seismic surveys in the Northwest Atlantic, baleen whales as a group showed localized avoidance of the operating array (Moulton and Holst 2010). Sighting rates were significantly lower during seismic operations compared with non-seismic periods, baleen whales were seen on average 200 m farther from the vessel during airgun activities vs. non-seismic periods, and these whales more often swam away from the vessel when seismic operations were underway compared with periods when no airguns were operating (Moulton and Holst 2010). Blue whales were seen significantly farther from the vessel during single airgun operations, ramp-up, and all other airgun operations compared with non-seismic periods (Moulton and Holst 2010). Similarly, the mean CPA distance for fin whales was significantly farther during ramp up than during periods without airgun operations; there was also a trend for fin whales to be sighted farther from the vessel during other airgun operations, but the difference was not significant (Moulton and Holst 2010). Minke whales were seen significantly farther from the vessel during periods with than without seismic operations (Moulton and Holst 2010). Minke whales were also more likely to swim away and less likely to approach during seismic operations compared to periods when airguns were not operating (Moulton and Holst 2010). However, MacLean and Haley (2004) reported that minke whales occasionally approached active airgun arrays where received sound levels were estimated to be near 170–180 dB re 1 µPa.
Discussion and Conclusions
Baleen whales generally tend to avoid operating airguns, but avoidance radii are quite variable. Whales are often reported to show no overt reactions to airgun pulses at distances beyond a few kilometers, even though the airgun pulses remain well above ambient noise levels out to much longer distances. However, studies done since the late 1990s of migrating humpback and migrating bowhead whales show reactions, including avoidance, that sometimes extend to greater distances than documented earlier. Avoidance distances often exceed the distances at which boat-based observers can see whales, so observations from the source vessel can be biased. Observations over broader areas may be needed to determine the range of potential effects of some large-source seismic surveys where effects on cetaceans may extend to considerable distances (Richardson et al. 1999; Bain and Williams 2006; Moore and Angliss 2006). Longer-range observations, when required, can sometimes be obtained via systematic aerial surveys or aircraft-based observations of 13behavior (e.g., Richardson et al. 1986, 1999; Miller et al. 1999, 2005; Yazvenko et al. 2007a,b) or by use of observers on one or more support vessels operating in coordination with the seismic vessel (e.g., Smultea et al. 2004; Johnson et al. 2007). However, the presence of other vessels near the source vessel can, at least at times, reduce sightability of cetaceans from the source vessel (Beland et al. 2009), thus complicating interpretation of sighting data.
Some baleen whales show considerable tolerance of seismic pulses. However, when the pulses are strong enough, avoidance or other behavioural changes become evident. Because responsiveness is variable and the responses become less obvious with diminishing received sound level, it has been difficult to determine the maximum distance (or minimum received sound level) at which reactions to seismic become evident and, hence, how many whales are affected. Responsiveness depends on the situation (Richardson et al. 1995; Ellison et al. 2012).
Studies of gray, bowhead, and humpback whales have determined that received levels of pulses in the 160–170 dB re 1 Parms range seem to cause obvious avoidance behavior in a substantial fraction of the animals exposed. In many areas, seismic pulses diminish to these levels at distances ranging from 4 to 15 km from the

Appendix D: Airgun Sounds on Marine Mammals
Shelburne Basin 3-D Seismic Survey Environmental Assessment 14
source. A substantial proportion of the baleen whales within such distances may show avoidance or other strong disturbance reactions to the operating airgun array. However, in other situations, various mysticetes tolerate exposure to full-scale airgun arrays operating at even closer distances, with only localized avoidance and minor changes in activities. At the other extreme, in migrating bowhead whales, avoidance often extends to considerably larger distances (20–30 km) and lower received sound levels (120–130 dB re 1 μParms). Also, even in cases where there is no conspicuous avoidance or change in activity upon exposure to sound pulses from distant seismic operations, there are sometimes subtle changes in behavior (e.g., surfacing–respiration–dive cycles) that are only evident through detailed statistical analysis (e.g., Richardson et al. 1986; Gailey et al. 2007).
Mitigation measures for seismic surveys, especially nighttime seismic surveys, typically assume that many marine mammals (at least baleen whales) tend to avoid approaching airguns, or the seismic vessel itself, before being exposed to levels high enough for there to be any possibility of injury. This assumes that the ramp-up (soft-start) procedure is used when commencing airgun operations, to give whales near the vessel the opportunity to move away before they are exposed to sound levels that might be strong enough to elicit TTS. As noted above, single-airgun experiments with three species of baleen whales show that those species typically do tend to move away when a single airgun starts firing nearby, which simulates the onset of a ramp up. The three species that showed avoidance when exposed to the onset of pulses from a single airgun were gray whales (Malme et al. 1984, 1986, 1988); bowhead whales (Richardson et al. 1986; Ljungblad et al. 1988); and humpback whales (Malme et al. 1985; McCauley et al. 1998, 2000a,b). In addition, results from Moulton and Holst (2010) showed that, during operations with a single airgun and during ramp-up, blue whales were seen significantly farther from the vessel compared with periods without airgun operations. Since startup of a single airgun is equivalent to the start of a ramp-up (=soft start), this strongly suggests that many baleen whales will begin to move away during the initial stages of a ramp-up.
Data on short-term reactions by cetaceans to impulsive noises are not necessarily indicative of long-term or biologically significant effects. It is not known whether impulsive sounds affect reproductive rate or distribution and habitat use in subsequent days or years. Castellote et al. (2009) reported that fin whales avoided their potential winter ground for an extended period of time (at least 10 days) after seismic operations in the Mediterranean Sea had ceased. However, gray whales have continued to migrate annually along the west coast of North America despite intermittent seismic exploration (and much ship traffic) in that area for decades (Appendix A in Malme et al. 1984; Richardson et al. 1995), and there has been a substantial increase in the population over recent decades (Allen and Angliss 2011). The western Pacific gray whale population did not seem affected by a seismic survey in its feeding ground during a prior year (Johnson et al. 2007). Similarly, bowhead whales have continued to travel to the eastern Beaufort Sea each summer despite seismic exploration in their summer and autumn range for many years (Richardson et al. 1987), and their numbers have increased notably (Allen and Angliss 2011). Bowheads also have been observed over periods of days or weeks in areas ensonified repeatedly by seismic pulses (Richardson et al. 1987; Harris et al. 2007). However, it is generally not known whether the same individual bowheads were involved in these repeated observations (within and between years) in strongly ensonified areas. In any event, in the absence of some unusual circumstances, the history of coexistence between seismic surveys and baleen whales suggests that brief exposures to sound pulses from any single seismic survey are unlikely to result in prolonged disturbance effects.
1.5.2 Toothed Whales
Little systematic information is available about reactions of toothed whales to noise pulses. Few studies similar to the more extensive baleen whale/seismic pulse work summarized above have been reported for toothed whales. However, there are recent systematic data on sperm whales (e.g., Gordon et al. 2006; Madsen et al. 2006; Winsor and Mate 2006; Jochens et al. 2008; Miller et al. 2009). There is also an increasing amount of information about responses of various odontocetes to seismic surveys based on monitoring studies (e.g., Stone

Appendix D: Airgun Sounds on Marine Mammals
Shelburne Basin 3-D Seismic Survey Environmental Assessment 15
2003; Smultea et al. 2004; Moulton and Miller 2005; Bain and Williams 2006; Holst et al. 2006; Stone and Tasker 2006; Potter et al. 2007; Hauser et al. 2008; Holst and Smultea 2008; Weir 2008a; Barkaszi et al. 2009; Richardson et al. 2009; Moulton and Holst 2010).
Delphinids (Dolphins and similar) and Monodontids (Beluga)
Seismic operators and marine mammal observers on seismic vessels regularly see dolphins and other small toothed whales near operating airgun arrays, but in general there is a tendency for most delphinids to show some avoidance of operating seismic vessels (e.g., Goold 1996a,b,c; Calambokidis and Osmek 1998; Stone 2003; Moulton and Miller 2005; Holst et al. 2006; Stone and Tasker 2006; Weir 2008a; Richardson et al. 2009; Moulton and Holst 2010; see also Barkaszi et al. 2009). In most cases, the avoidance radii for delphinids appear to be small, on the order of 1 km or less, and some individuals show no apparent avoidance. Studies that have reported cases of small toothed whales close to the operating airguns include Duncan (1985), Arnold (1996), Stone (2003), and Holst et al. (2006). When a 3959 in3, 18-airgun array was firing off California, toothed whales behaved in a manner similar to that observed when the airguns were silent (Arnold 1996). Some dolphins seem to be attracted to the seismic vessel and floats, and some ride the bow wave of the seismic vessel even when a large array of airguns is firing (e.g., Moulton and Miller 2005). Nonetheless, small toothed whales more often tend to head away, or to maintain a somewhat greater distance from the vessel, when a large array of airguns is operating than when it is silent (e.g., Stone and Tasker 2006; Weir 2008a; Barry et al. 2010; Moulton and Holst 2010).
Weir (2008b) noted that a group of short-finned pilot whales initially showed an avoidance response to ramp up of a large airgun array, but that this response was limited in time and space. Moulton and Holst (2010) did not find any indications that long-finned pilot whales, or delphinids as a group, responded to ramp-ups by moving away from the seismic vessel during surveys in the Northwest Atlantic (Moulton and Holst 2010). Although the ramp-up procedure is a widely-used mitigation measure, it remains uncertain how effective it is at alerting marine mammals (especially odontocetes) and causing them to move away from seismic operations (Weir 2008b).
Goold (1996a,b,c) studied the effects on common dolphins of 2D seismic surveys in the Irish Sea. Passive acoustic surveys were conducted from the “guard ship” that towed a hydrophone. The results indicated that there was a local displacement of dolphins around the seismic operation. However, observations indicated that the animals were tolerant of the sounds at distances outside a 1-km radius from the airguns (Goold 1996a). Initial reports of larger-scale displacement were later shown to represent a normal autumn migration of dolphins through the area, and were not attributable to seismic surveys (Goold 1996a,b,c).
The beluga is a species that (at least at times) shows long-distance avoidance of seismic vessels. Aerial surveys conducted in the southeastern Beaufort Sea in summer found that sighting rates of belugas were significantly lower at distances 10–20 km compared with 20–30 km from an operating airgun array (Miller et al. 2005). The low number of beluga sightings by marine mammal observers on the vessel seemed to confirm there was a strong avoidance response to the 2250 in3 airgun array. More recent seismic monitoring studies in the same area have confirmed that the apparent displacement effect on belugas extended farther than has been shown for other small odontocetes exposed to airgun pulses (e.g., Harris et al. 2007). There have been no studies changes in behaviour of narwhals attributable to airgun sounds.
Observers stationed on seismic vessels operating off the U.K. from 1997 to 2000 have provided data on the occurrence and behaviour of various toothed whales exposed to seismic pulses (Stone 2003; Gordon et al. 2004; Stone and Tasker 2006). Dolphins of various species often showed more evidence of avoidance of operating airgun arrays than has been reported previously for small odontocetes. Sighting rates of white-sided dolphins, white-beaked dolphins, Lagenorhynchus spp., and all small odontocetes combined were significantly

Appendix D: Airgun Sounds on Marine Mammals
Shelburne Basin 3-D Seismic Survey Environmental Assessment 16
lower during periods when large-volume5 airgun arrays were shooting. Except for the pilot whale and bottlenose dolphin, CPA distances for all of the small odontocete species tested, including killer whales, were significantly farther from large airgun arrays during periods of shooting compared with periods of no shooting. Pilot whales were less responsive than other small odontocetes in the presence of seismic surveys (Stone and Tasker 2006). For small odontocetes as a group, and most individual species, orientations differed between times when large airgun arrays were operating vs. silent, with significantly fewer animals traveling towards and/or more traveling away from the vessel during shooting (Stone and Tasker 2006). Observers’ records suggested that fewer cetaceans were feeding and fewer were interacting with the survey vessel (e.g., bow-riding) during periods with airguns operating, and small odontocetes tended to swim faster during periods of shooting (Stone and Tasker 2006). For most types of small odontocetes sighted by observers on seismic vessels, the median CPA distance was ≥0.5 km larger during airgun operations (Stone and Tasker 2006). Killer whales appeared to be more tolerant of seismic shooting in deeper waters.
Data collected during seismic operations in the Gulf of Mexico and off Central America show similar patterns. A summary of vessel-based monitoring data from the Gulf of Mexico during 2003–2008 showed that delphinids were generally seen farther from the vessel during seismic than during non-seismic periods (based on Barkaszi et al. 2009, excluding sperm whales). Similarly, during two NSF-funded L-DEO seismic surveys that used a large 20 airgun array (~7000 in3), sighting rates of delphinids were lower and initial sighting distances were farther away from the vessel during seismic than non-seismic periods (Smultea et al. 2004; Holst et al. 2005a, 2006; Richardson et al. 2009). Monitoring results during a seismic survey in the Southeast Caribbean showed that the mean CPA of delphinids was 991 m during seismic operations vs. 172 m when the airguns were not operational (Smultea et al. 2004). Surprisingly, nearly all acoustic detections via a towed passive acoustic monitoring (PAM) array, including both delphinids and sperm whales, were made when the airguns were operating (Smultea et al. 2004). Although the number of sightings during monitoring of a seismic survey off the Yucatán Peninsula, Mexico, was small (n = 19), the results showed that the mean CPA distance of delphinids there was 472 m during seismic operations vs. 178 m when the airguns were silent (Holst et al. 2005a). The acoustic detection rates were nearly 5 times higher without than with seismic operations (Holst et al. 2005a).
For two additional NSF-funded L-DEO seismic surveys in the Eastern Tropical Pacific, both using a large 36-airgun array (~6600 in3), the results are less easily interpreted (Richardson et al. 2009). During both surveys, the delphinid detection rate was lower during seismic than during non-seismic periods, as found in various other projects, but the mean CPA distance of delphinids was closer (not farther) during seismic periods (Hauser et al. 2008; Holst and Smultea 2008).
During seismic surveys in the Northwest Atlantic, delphinids as a group showed some localized avoidance of the operating array (Moulton and Holst 2010). The mean initial detection distance was significantly farther (by ca. 200 m) during seismic operations compared with non-seismic periods; however, there was no significant difference between sighting rates (Moulton and Holst 2010). The same results were evident when only long-finned pilot whales were considered.
Among Atlantic spotted dolphins off Angola (n = 16 useable groups), marked short-term and localized displacement was found in response to seismic operations conducted with a 24-airgun array (3147 in3 or 5085 in3) (Weir 2008a). Sample sizes were low, but CPA distances of dolphin groups were significantly larger when airguns were on (mean 1080 m) vs. off (mean 209 m). No Atlantic spotted dolphins were seen within 500 m of the airguns when they were operating, whereas all sightings when airguns were silent occurred within 500 m, including the only recorded “positive approach” behaviours.
5 Large volume means at least 1300 in3, with most (79%) at least 3000 in3.

Appendix D: Airgun Sounds on Marine Mammals
Shelburne Basin 3-D Seismic Survey Environmental Assessment 17
Reactions of toothed whales to a single airgun or other small airgun source are not well documented, but tend to be less substantial than reactions to large airgun arrays (e.g., Stone 2003; Stone and Tasker 2006). During 91 site surveys off the U.K. in 1997–2000, sighting rates of all small odontocetes combined were significantly lower during periods the low-volume6 airgun sources were operating, and effects on orientation were evident for all species and groups tested (Stone and Tasker 2006). Results from four NSF-funded L-DEO seismic surveys using small arrays (up to 3 GI guns and 315 in3) were inconclusive. During surveys in the Eastern Tropical Pacific (Holst et al. 2005b) and in the Northwest Atlantic (Haley and Koski 2004), detection rates were slightly lower during seismic compared to non-seismic periods. However, mean CPAs were closer during seismic operations during one cruise (Holst et al. 2005b), and greater during the other cruise (Haley and Koski 2004). Interpretation of the data was confounded by the fact that survey effort and/or number of sightings during non-seismic periods during both surveys was small. Results from another two small-array surveys were even more variable (MacLean and Koski 2005; Smultea and Holst 2008).
Captive bottlenose dolphins and beluga whales exhibited changes in behaviour when exposed to strong pulsed sounds similar in duration to those typically used in seismic surveys (Finneran et al. 2000, 2002, 2005). Finneran et al. (2002) exposed a captive bottlenose dolphin and beluga to single impulses from a water gun (80 in3). As compared with airgun pulses, water gun impulses were expected to contain proportionally more energy at higher frequencies because there is no significant gas-filled bubble, and thus little low-frequency bubble-pulse energy (Hutchinson and Detrick 1984). The captive animals sometimes vocalized after exposure and exhibited reluctance to station at the test site where subsequent exposure to impulses would be implemented (Finneran et al. 2002). Similar behaviours were exhibited by captive bottlenose dolphins and a beluga exposed to single underwater pulses designed to simulate those produced by distant underwater explosions (Finneran et al. 2000). It is uncertain what relevance these observed behaviours in captive, trained marine mammals exposed to single transient sounds may have to free-ranging animals exposed to multiple pulses. In any event, the animals tolerated rather high received levels of sound before exhibiting the aversive behaviours mentioned above.
Odontocete responses (or lack of responses) to noise pulses from underwater explosions (as opposed to airgun pulses) may be indicative of odontocete responses to very strong noise pulses. During the 1950s, small explosive charges were dropped into an Alaskan river in attempts to scare belugas away from salmon. Success was limited (Fish and Vania 1971; Frost et al. 1984). Small explosive charges were “not always effective” in moving bottlenose dolphins away from sites in the Gulf of Mexico where larger demolition blasts were about to occur (Klima et al. 1988). Odontocetes may be attracted to fish killed by explosions, and thus attracted rather than repelled by “scare” charges. Captive false killer whales showed no obvious reaction to single noise pulses from small (10 g) charges; the received level was ~185 dB re 1 Pa (Akamatsu et al. 1993). Jefferson and Curry (1994) reviewed several additional studies that found limited or no effects of noise pulses from small explosive charges on killer whales and other odontocetes. Aside from the potential for causing auditory impairment (see below), the tolerance to these charges may indicate a lack of effect, or the failure to move away may simply indicate a stronger desire to feed, regardless of circumstances.
Phocoenids (Porpoises)
Porpoises, like delphinids, show variable reactions to seismic operations, and reactions apparently depend on species. The limited available data suggest that harbor porpoises show stronger avoidance of seismic operations than do Dall’s porpoises (Stone 2003; MacLean and Koski 2005; Bain and Williams 2006). In Washington State waters, the harbor porpoise―despite being considered a high-frequency specialist―appeared to be the species affected by the lowest received level of airgun sound (<145 dB re 1 μParms at a distance >70 km;
6 For low volume arrays, maximum volume was 820 in3, with most (87%) ≤180 in3.

Appendix D: Airgun Sounds on Marine Mammals
Shelburne Basin 3-D Seismic Survey Environmental Assessment 18
Bain and Williams 2006). Similarly, during seismic surveys with large airgun arrays off the U.K. in 1997–2000, there were significant differences in directions of travel by harbor porpoises during periods when the airguns were shooting vs. silent (Stone 2003; Stone and Tasker 2006). A captive harbor porpoise exposed to single sound pulses from a small airgun showed aversive behaviour upon receipt of a pulse with received level above 174 dB re 1 μPapk-pk or SEL >145 dB re 1 μPa2 · s (Lucke et al. 2009). In contrast, Dall’s porpoises seem relatively tolerant of airgun operations (MacLean and Koski 2005; Bain and Williams 2006), although they too have been observed to avoid large arrays of operating airguns (Calambokidis and Osmek 1998; Bain and Williams 2006). The apparent tendency for greater responsiveness in the harbor porpoise is consistent with their relative respon-siveness to boat traffic and some other acoustic sources (Richardson et al. 1995; Southall et al. 2007).
Beaked Whales
There are almost no specific data on the behavioural reactions of beaked whales to seismic surveys. Most beaked whales tend to avoid approaching vessels of other types (e.g., Würsig et al. 1998). They may also dive for an extended period when approached by a vessel (e.g., Kasuya 1986), although it is uncertain how much longer such dives may be as compared to dives by undisturbed beaked whales, which also are often quite long (Baird et al. 2006; Tyack et al. 2006b). In any event, it is likely that most beaked whales would also show strong avoidance of an approaching seismic vessel, regardless of whether or not the airguns are operating. However, this has not been documented explicitly. Also, northern bottlenose whales sometimes are quite tolerant of slow-moving vessels not emitting airgun pulses (Reeves et al. 1993; Hooker et al. 2001). Detections (acoustic or visual) of northern bottlenose whales have been made from seismic vessels during recent seismic surveys in the Northwest Atlantic during periods with and without airgun operations (Potter et al. 2007; Moulton and Miller 2005). Similarly, other visual and acoustic studies indicated that some northern bottlenose whales remained in the general area and continued to produce high-frequency clicks when exposed to sound pulses from distant seismic surveys (Gosselin and Lawson 2004; Laurinolli and Cochrane 2005; Simard et al. 2005).
There are increasing indications that some beaked whales tend to strand when military exercises involving mid-frequency sonar operation are ongoing nearby (e.g., Simmonds and Lopez-Jurado 1991; Frantzis 1998; NOAA and USN 2001; Jepson et al. 2003; Barlow and Gisiner 2006; D’Amico et al. 2009; Filadelfo et al. 2009; see also the “Strandings and Mortality” subsection, later). These strandings are apparently at least in part a disturbance response, although auditory or other injuries or other physiological effects may also be a factor. Whether beaked whales would ever react similarly to seismic surveys is unknown. Seismic survey sounds are quite different from those of the sonars in operation during the above-cited incidents. No conclusive link has been established between seismic surveys and beaked whale strandings. There was a stranding of two Cuvier’s beaked whales in the Gulf of California (Mexico) in September 2002 when the R/V Maurice Ewing was conducting a seismic survey in the general area (e.g., Malakoff 2002; Hildebrand 2005). However, NMFS did not establish a cause and effect relationship between this stranding and the seismic survey activities (Hogarth 2002). Cox et al. (2006) noted the “lack of knowledge regarding the temporal and spatial correlation between the [stranding] and the sound source”. Hildebrand (2005) illustrated the approximate temporal-spatial relationships between the stranding and the Ewing’s tracks, but the time of the stranding was not known with sufficient precision for accurate determination of the CPA distance of the whales to the Ewing. Another stranding of Cuvier’s beaked whales in the Galápagos occurred during a seismic survey in April 2000; however “There is no obvious mechanism that bridges the distance between this source and the stranding site” (Gentry [ed.] 2002).
Sperm Whales
All three species of sperm whales have been reported to show avoidance reactions to standard vessels not emitting airgun sounds (e.g., Richardson et al. 1995; Würsig et al. 1998; McAlpine 2002; Baird 2005). However, most studies of the sperm whale Physeter macrocephalus exposed to airgun sounds indicate that this species

Appendix D: Airgun Sounds on Marine Mammals
Shelburne Basin 3-D Seismic Survey Environmental Assessment 19
shows considerable tolerance of airgun pulses. The whales usually do not show strong avoidance (i.e., they do not leave the area) and they continue to call.
There were some early and limited observations suggesting that sperm whales in the Southern Ocean ceased calling during some (but not all) times when exposed to weak noise pulses from extremely distant (>300 km) seismic exploration. However, other operations in the area could also have been a factor (Bowles et al. 1994). This “quieting” was suspected to represent a disturbance effect, in part because sperm whales exposed to pulsed man-made sounds at higher frequencies often cease calling (Watkins and Schevill 1975; Watkins et al. 1985). Also, there was an early preliminary account of possible long-range avoidance of seismic vessels by sperm whales in the Gulf of Mexico (Mate et al. 1994). However, this has not been substantiated by subsequent more detailed work in that area (Gordon et al. 2006; Winsor and Mate 2006; Jochens et al. 2008; Miller et al. 2009).
Recent and more extensive data from vessel-based monitoring programs in U.K. waters and off eastern Canada and Angola suggest that sperm whales in those areas show little evidence of avoidance or behavioural disruption in the presence of operating seismic vessels (Stone 2003; Stone and Tasker 2006; Weir 2008a; Moulton and Holst 2010). Among sperm whales off Angola (n = 96 useable groups), there were no significant differences in encounter rates (sightings/hr) when a 24-airgun array (3147 in3 or 5085 in3) was operating vs. silent (Weir 2008a). There was also no significant difference in the CPA distances of the sperm whale sightings when airguns were on vs. off (means 3039 m vs. 2594 m, respectively). Encounter rate tended to increase over the 10-month duration of the seismic survey. Similarly, in the Northwest Atlantic, sighting rates and distances of sperm whales did not differ between seismic and non-seismic periods (Moulton and Holst 2010). These types of observations are difficult to interpret because the observers are stationed on or near the seismic vessel, and may underestimate reactions by some of the more responsive animals, which may be beyond visual range. However, these results do seem to show considerable tolerance of seismic surveys by at least some sperm whales. Also, a study off northern Norway indicated that sperm whales continued to call when exposed to pulses from a distant seismic vessel. Received levels of the seismic pulses were up to 146 dB re 1 μPap-p (Madsen et al. 2002).
Similarly, a study conducted off Nova Scotia that analyzed recordings of sperm whale vocalizations at various distances from an active seismic program did not detect any obvious changes in the distribution or behaviour of sperm whales (McCall Howard 1999).
Sightings of sperm whales by observers on seismic vessels operating in the Gulf of Mexico during 2003–2008 were at very similar average distances regardless of the airgun operating conditions (Barkaszi et al. 2009). For example, the mean sighting distance was 1839 m when the airgun array was in full operation (n=612) vs. 1960 m when all airguns were off (n=66).
A controlled study of the reactions of tagged sperm whales to seismic surveys was done recently in the Gulf of Mexico ― the Sperm Whale Seismic Study or SWSS (Gordon et al. 2006; Madsen et al. 2006; Winsor and Mate 2006; Jochens et al. 2008; Miller et al. 2009). During SWSS, D-tags (Johnson and Tyack 2003) were used to record the movement and acoustic exposure of eight foraging sperm whales before, during, and after controlled exposures to sound from airgun arrays (Jochens et al. 2008; Miller et al. 2009). Whales were exposed to maximum received sound levels of 111–147 dB re 1 μParms (131–162 dB re 1 μPapk-pk) at ranges of ~1.4–12.8 km from the sound source (Miller et al. 2009). Although the tagged whales showed no discernible horizontal avoidance, some whales showed changes in diving and foraging behaviour during full-array exposure, possibly indicative of subtle negative effects on foraging (Jochens et al. 2008; Miller et al. 2009; Tyack 2009). Two indications of foraging that they studied were oscillations in pitch and occurrence of echolocation buzzes, both of which tend to occur when a sperm whale closes-in on prey. "Oscillations in pitch generated by swimming movements during foraging dives were on average 6% lower during exposure than during the immediately following post-exposure period, with all 7 foraging whales exhibiting less pitching (P = 0.014). Buzz rates, a

Appendix D: Airgun Sounds on Marine Mammals
Shelburne Basin 3-D Seismic Survey Environmental Assessment 20
proxy for attempts to capture prey, were 19% lower during exposure…" (Miller et al. 2009). Although the latter difference was not statistically significant (P = 0.141), the percentage difference in buzz rate during exposure vs. post-exposure conditions appeared to be strongly correlated with airgun-whale distance (Miller et al. 2009: Fig. 5; Tyack 2009).
Discussion and Conclusions
Dolphins and porpoises are often seen by observers on active seismic vessels, occasionally at close distances (e.g., bow riding). However, some studies near the U.K., Newfoundland and Angola, in the Gulf of Mexico, and off Central America have shown localized avoidance. Also, belugas summering in the Canadian Beaufort Sea showed larger-scale avoidance, tending to avoid waters out to 10–20 km from operating seismic vessels. In contrast, recent studies show little evidence of conspicuous reactions by sperm whales to airgun pulses, contrary to earlier indications.
There are almost no specific data on responses of beaked whales to seismic surveys, but it is likely that most if not all species show strong avoidance. There is increasing evidence that some beaked whales may strand after exposure to strong noise from sonars. Whether they ever do so in response to seismic survey noise is unknown. Northern bottlenose whales seem to continue to call when exposed to pulses from distant seismic vessels.
Overall, odontocete reactions to large arrays of airguns are variable and, at least for delphinids and some porpoises, seem to be confined to a smaller radius than has been observed for some mysticetes. However, other data suggest that some odontocetes species, including belugas and harbor porpoises, may be more responsive than might be expected given their poor low-frequency hearing. Reactions at longer distances may be particularly likely when sound propagation conditions are conducive to transmission of the higher-frequency components of airgun sound to the animals’ location (DeRuiter et al. 2006; Goold and Coates 2006; Tyack et al. 2006a; Potter et al. 2007).
For delphinids, and possibly the Dall’s porpoise, the available data suggest that a ≥170 dB re 1 µParms disturbance criterion (rather than ≥160 dB) would be appropriate. With a medium-to-large airgun array, received levels typically diminish to 170 dB within 1–4 km, whereas levels typically remain above 160 dB out to 4–15 km (e.g., Tolstoy et al. 2009). Reaction distances for delphinids are more consistent with the typical 170 dB re 1 μParms distances. The 160 dB (rms) criterion currently applied by NMFS was developed based primarily on data from gray and bowhead whales. Avoidance distances for delphinids and Dall’s porpoises tend to be shorter than for those two mysticete species. For delphinids and Dall’s porpoises, there is no indication of strong avoidance or other disruption of behaviour at distances beyond those where received levels would be ~170 dB re 1 μParms.
1.5.3 Pinnipeds
Few studies of the reactions of pinnipeds to noise from open-water seismic exploration have been published (for review of the early literature, see Richardson et al. 1995). However, pinnipeds have been observed during a number of seismic monitoring studies. Monitoring in the Beaufort Sea during 1996–2002 provided a substantial amount of information on avoidance responses (or lack thereof) and associated behaviour. Additional monitoring of that type has been done in the Beaufort and Chukchi Seas in 2006–2009. Pinnipeds exposed to seismic surveys have also been observed during seismic surveys along the U.S. west coast. Some limited data are available on physiological responses of pinnipeds exposed to seismic sound, as studied with the aid of radio telemetry. Also, there are data on the reactions of pinnipeds to various other related types of impulsive sounds.
Early observations provided considerable evidence that pinnipeds are often quite tolerant of strong pulsed sounds. During seismic exploration off Nova Scotia, gray seals exposed to noise from airguns and linear explosive charges reportedly did not react strongly (J. Parsons in Greene et al. 1985). An airgun caused an initial startle reaction among South African fur seals but was ineffective in scaring them away from fishing gear

Appendix D: Airgun Sounds on Marine Mammals
Shelburne Basin 3-D Seismic Survey Environmental Assessment 21
(Anonymous 1975). Pinnipeds in both water and air sometimes tolerate strong noise pulses from non-explosive and explosive scaring devices, especially if attracted to the area for feeding or reproduction (Mate and Harvey 1987; Reeves et al. 1996). Thus, pinnipeds are expected to be rather tolerant of, or to habituate to, repeated underwater sounds from distant seismic sources, at least when the animals are strongly attracted to the area.
In the U.K., a radio-telemetry study demonstrated short-term changes in the behaviour of harbor (=common) and gray seals exposed to airgun pulses (Thompson et al. 1998). Harbor seals were exposed to seismic pulses from a 90-in3 array (3 30 in3 airguns), and behavioural responses differed among individuals. One harbor seal avoided the array at distances up to 2.5 km from the source and only resumed foraging dives after seismic stopped. Another harbor seal exposed to the same small airgun array showed no detectable behavioural response, even when the array was within 500 m. Gray seals exposed to a single 10-in3 airgun showed an avoidance reaction: they moved away from the source, increased swim speed and/or dive duration, and switched from foraging dives to predominantly transit dives. These effects appeared to be short-term as gray seals either remained in, or returned at least once to, the foraging area where they had been exposed to seismic pulses. These results suggest that there are interspecific as well as individual differences in seal responses to seismic sounds.
Off California, visual observations from a seismic vessel showed that California sea lions “typically ignored the vessel and array. When [they] displayed behaviour modifications, they often appeared to be reacting visually to the sight of the towed array. At times, California sea lions were attracted to the array, even when it was on. At other times, these animals would appear to be actively avoiding the vessel and array” (Arnold 1996). In Puget Sound, sighting distances for harbor seals and California sea lions tended to be larger when airguns were operating; both species tended to orient away whether or not the airguns were firing (Calambokidis and Osmek 1998). Bain and Williams (2006) also stated that their small sample of harbor seals and sea lions tended to orient and/or move away upon exposure to sounds from a large airgun array.
Monitoring work in the Alaskan Beaufort Sea during 1996–2001 provided considerable information regarding the behaviour of seals exposed to seismic pulses (Harris et al. 2001; Moulton and Lawson 2002). Those seismic projects usually involved arrays of 6–16 airguns with total volumes 560–1500 in3. Subsequent monitoring work in the Canadian Beaufort Sea in 2001–2002, with a somewhat larger airgun system (24 airguns, 2250 in3), provided similar results (Miller et al. 2005). The combined results suggest that some seals avoid the immediate area around seismic vessels. In most survey years, ringed seal sightings averaged somewhat farther away from the seismic vessel when the airguns were operating than when they were not (Moulton and Lawson 2002). Also, seal sighting rates at the water surface were lower during airgun array operations than during no-airgun periods in each survey year except 1997. However, the avoidance movements were relatively small, on the order of 100 m to (at most) a few hundreds of metres, and many seals remained within 100–200 m of the trackline as the operating airgun array passed by.
The operation of the airgun array had minor and variable effects on the behaviour of seals visible at the surface within a few hundred metres of the airguns (Moulton and Lawson 2002). The behavioural data indicated that some seals were more likely to swim away from the source vessel during periods of airgun operations and more likely to swim towards or parallel to the vessel during non-seismic periods. No consistent relationship was observed between exposure to airgun noise and proportions of seals engaged in other recognizable behaviours, e.g., “looked” and “dove”. Such a relationship might have occurred if seals seek to reduce exposure to strong seismic pulses, given the reduced airgun noise levels close to the surface where “looking” occurs (Moulton and Lawson 2002).
Monitoring results from the Canadian Beaufort Sea during 2001–2002 were more variable (Miller et al. 2005). During 2001, sighting rates of seals (mostly ringed seals) were similar during all seismic states, including periods without airgun operations. However, seals tended to be seen closer to the vessel during non-seismic than seismic periods. In contrast, during 2002, sighting rates of seals were higher during non-seismic periods than

Appendix D: Airgun Sounds on Marine Mammals
Shelburne Basin 3-D Seismic Survey Environmental Assessment 22
seismic operations, and seals were seen farther from the vessel during non-seismic compared to seismic activity (a marginally significant result). The combined data for both years showed that sighting rates were higher during non-seismic periods compared to seismic periods, and that sighting distances were similar during both seismic states. Miller et al. (2005) concluded that seals showed very limited avoidance to the operating airgun array.
Vessel-based monitoring also took place in the Alaskan Chukchi and Beaufort seas during 2006–2008 (Funk et al. 2010). These observations indicate a tendency for phocid seals to exhibit localized avoidance of the seismic source vessel when airguns are firing (Funk et al. 2010). In the Chukchi Sea, seal sightings rates were greater without nearby seismic than from source vessels at locations with received sound levels (RLs) ≥160 and 159–120 dB re 1 μParms. Also, sighting rates were greater from source than monitoring vessels at locations with RLs <120 dB rms (Haley et al. 2010). In the Beaufort Sea, seal sighting rates in areas with RLs ≥160 dB rms were also significantly higher from monitoring than from seismic source vessels, and sighting rates were significantly higher from source vessels in areas exposed to <120 compared to ≥160 dB rms (Savarese et al. 2010). In addition, seals tended to stay farther away and swam away from source vessels more frequently than from monitoring vessels when RLs were ≥160 dB rms. Over the three years, seal sighting rates were greater from monitoring than source vessels at locations with received sound levels ≥160 and 159–120 dB rms, whereas seal sighting rates were greater from source than monitoring vessels at locations with RLs <120 dB rms, suggesting that seals may be reacting to active airguns by moving away from the source vessel.
Walruses near operating seismic surveys tend to swim away from the vessel (Hannay et al. 2011). Walrus calls were monitored during a low-energy shallow-hazards survey in 2009 and a 3-D seismic survey in 2010 (Hannay et al. 2010). During the shallow-hazard survey using a 40 in3 airgun, walrus call detections stopped at SPLs >130 dB re 1 µParms and declined at lower SPLs. During the large-array 3-D seismic survey, acoustic detections were negatively correlated with SPL at RLs of 110–140 dB, but no detections were made at SPLs >140 dB dB re 1 µParms. Hannay et al. (2011) suggested that walruses likely reduced calling rates upon exposure to higher SPLs without leaving the area.
In summary, visual monitoring from seismic vessels has shown only slight (if any) avoidance of airguns by pinnipeds, and only slight (if any) changes in behaviour. These studies show that many pinnipeds do not avoid the area within a few hundred metres of an operating airgun array. However, based on the studies with large sample size, or observations from a separate monitoring vessel, or radio telemetry, it is apparent that some phocid seals do show localized avoidance of operating airguns. The limited nature of this tendency for avoidance is a concern. It suggests that one cannot rely on pinnipeds to move away, or to move very far away, before received levels of sound from an approaching seismic survey vessel approach those that may cause hearing impairment (see below).
1.6. Hearing Impairment and Other Physical Effects of Seismic Surveys Temporary or permanent hearing impairment is a possibility when marine mammals are exposed to very
strong sounds. Temporary threshold shift (TTS) has been demonstrated and studied in certain captive odontocetes and pinnipeds exposed to strong sounds (reviewed in Southall et al. 2007). However, there has been no specific documentation of TTS let alone permanent hearing damage, i.e. permanent threshold shift (PTS), in free-ranging marine mammals exposed to sequences of airgun pulses during realistic field conditions. Current NMFS policy regarding exposure of marine mammals to high-level sounds is that cetaceans and pinnipeds should not be exposed to impulsive sounds ≥180 and 190 dB re 1 Parms, respectively (NMFS 2000). Those criteria have been used in establishing the safety (=shut-down) radii planned for numerous seismic surveys conducted under U.S. jurisdiction. However, those criteria were established before there was any information about the minimum received levels of sounds necessary to cause auditory impairment in marine mammals. As discussed below,

Appendix D: Airgun Sounds on Marine Mammals
Shelburne Basin 3-D Seismic Survey Environmental Assessment 23
the 180-dB criterion for cetaceans is probably precautionary for at least some species including bottlenose dolphin and beluga, i.e., lower than necessary to avoid temporary auditory impairment let alone permanent auditory injury.
the 180-dB criterion may not be precautionary with regard to TTS in some other cetacean species, including the harbor porpoise. Likewise, the 190-dB criterion for pinnipeds may not be precautionary for all pinnipeds, although for pinnipeds the underlying data are indirect and quite variable among species.
the likelihood of TTS (and probably also PTS) upon exposure to high-level sound appears to be better correlated with the amount of acoustic energy received by the animal, measured by the cumulative sound exposure level (SEL) in dB re 1 μPa2 · s, than it is with maximum received RMS pressure level in dB re 1 μParms.. SEL allows for exposure duration and/or number of exposures; the maximum rms level does not. Thus, the current U.S. criteria do not appear to be expressed in the most appropriate acoustic units.
low and moderate degrees of TTS, up to at least 30 dB of elevation of the threshold, are not injury and do not constitute “Level A harassment” in U.S. MMPA terminology. Beyond that level, TTS may grade into PTS (Le Prell 2012).
the minimum sound level necessary to cause permanent hearing impairment (“Level A harassment”) is higher, by a variable and generally unknown amount, than the level that induces barely-detectable TTS.
the level associated with the onset of TTS is often considered to be a level below which there is no danger of permanent damage. The actual PTS threshold is likely to be well above the level causing onset of TTS (Southall et al. 2007).
Recommendations for new science-based noise exposure criteria for marine mammals, frequency-weighting procedures, and related matters were published in early 2008 (Southall et al. 2007). Those recommendations have not, as of late 2012, been formally adopted by NMFS for use in regulatory processes and during mitigation programs associated with seismic surveys. However, some aspects of the recommendations have been taken into account in certain EISs and small-take authorizations, and NMFS is moving toward adoption of new procedures taking at least some of the Southall et al. recommendations into account (Scholik-Schlomer 2012). Preliminary information about possible changes in the regulatory and mitigation requirements, and about the possible structure of new criteria, was given by Wieting (2004) and NMFS (2005).
Several aspects of the monitoring and mitigation measures that are now often implemented during seismic survey projects are designed to detect marine mammals occurring near the airgun array, and to avoid exposing them to sound pulses that might, at least in theory, cause hearing impairment. In addition, many cetaceans and (to a limited degree) pinnipeds show some avoidance of the area where received levels of airgun sound are high enough such that hearing impairment could potentially occur. In those cases, the avoidance responses of the animals themselves will reduce or (most likely) avoid the possibility of hearing impairment.
Non-auditory physical effects may also occur in marine mammals exposed to strong underwater pulsed sound. Possible types of non-auditory physiological effects or injuries that might (in theory) occur include stress, neurological effects, bubble formation, and other types of organ or tissue damage. It is possible that some marine mammal species (i.e., beaked whales) may be especially susceptible to injury and/or stranding when exposed to strong pulsed sounds. The following subsections summarize available data on noise-induced hearing impairment and non-auditory physical effects.

Appendix D: Airgun Sounds on Marine Mammals
Shelburne Basin 3-D Seismic Survey Environmental Assessment 24
1.6.1 Temporary Threshold Shift (TTS)
TTS is the mildest form of hearing impairment that can occur during exposure to a strong sound (Kryter 1985). While experiencing TTS, the hearing threshold rises and a sound must be stronger in order to be heard. It is a temporary phenomenon, and (especially when mild) is not considered to represent physical damage or “injury” (Southall et al. 2007; Le Prell 2012). Rather, the onset of TTS is an indicator that, if the animal is exposed to higher levels of that sound, physical damage is ultimately a possibility.
The magnitude of TTS depends on the level and duration of noise exposure, and to some degree on frequency, among other considerations (Kryter 1985; Richardson et al. 1995; Southall et al. 2007). For sound exposures at or somewhat above the TTS threshold, hearing sensitivity recovers rapidly after exposure to the noise ends. Extensive studies on terrestrial mammal hearing in air show that TTS can last from minutes or hours to (in cases of strong TTS) days. More limited data from odontocetes and pinnipeds show similar patterns (e.g., Mooney et al. 2009a,b; Finneran et al. 2010a). However, none of the published data concern TTS elicited by exposure to multiple pulses of sound during operational seismic surveys (Southall et al. 2007).
Toothed Whales
There are empirical data on the sound exposures that elicit onset of TTS in captive bottlenose dolphins, belugas, and finless porpoise. The majority of these data concern non-impulse sound, but there are some limited published data concerning TTS onset upon exposure to a single pulse of sound from a watergun (Finneran et al. 2002). A detailed review of all TTS data from marine mammals can be found in Southall et al. (2007). The following summarizes some of the key results from odontocetes.
Recent information corroborates earlier expectations that the effect of exposure to strong transient sounds is closely related to the total amount of acoustic energy that is received. Finneran et al. (2005) examined the effects of tone duration on TTS in bottlenose dolphins. Bottlenose dolphins were exposed to 3 kHz tones (non-impulsive) for periods of 1, 2, 4 or 8 s, with hearing tested at 4.5 kHz. For 1-s exposures, TTS occurred with SELs of 197 dB, and for exposures >1 s, SEL >195 dB resulted in TTS (SEL is equivalent to energy flux, in dB re 1 μPa2 · s). At an SEL of 195 dB, the mean TTS (4 min after exposure) was 2.8 dB. Finneran et al. (2005) suggested that an SEL of 195 dB is the likely threshold for the onset of TTS in dolphins and belugas exposed to tones of durations 1–8 s (i.e., TTS onset occurs at a near-constant SEL, independent of exposure duration). That implies that, at least for non-impulsive tones, a doubling of exposure time results in a 3 dB lower TTS threshold.
The assumption that, in marine mammals, the occurrence and magnitude of TTS is a function of cumulative acoustic energy (SEL) is probably an oversimplification (Finneran 2012). Kastak et al. (2005) reported preliminary evidence from pinnipeds that, for prolonged non-impulse noise, higher SELs were required to elicit a given TTS if exposure duration was short than if it was longer, i.e., the results were not fully consistent with an equal-energy model to predict TTS onset. Mooney et al. (2009a) showed this in a bottlenose dolphin exposed to octave-band non-impulse noise ranging from 4 to 8 kHz at SPLs of 130 to 178 dB re 1 Pa for periods of 1.88 to 30 min. Higher SELs were required to induce a given TTS if exposure duration was short than if it was longer. Exposure of the aforementioned bottlenose dolphin to a sequence of brief sonar signals showed that, with those brief (but non-impulse) sounds, the received energy (SEL) necessary to elicit TTS was higher than was the case with exposure to the more prolonged octave-band noise (Mooney et al. 2009b). Those authors concluded that, when using (non-impulse) acoustic signals of duration ~0.5 s, SEL must be at least 210–214 dB re 1 μPa2 · s to induce TTS in the bottlenose dolphin. Popov et al. (2011) examined the effects of fatiguing noise on the hearing threshold of Yangtze finless porpoises when exposed to frequencies of 32–128 kHz at 140–160 dB re 1 Pa for 1-30 min. They found that an exposure of higher level and shorter duration produced a higher TTS than an exposure of equal SEL but of lower level and longer duration.

Appendix D: Airgun Sounds on Marine Mammals
Shelburne Basin 3-D Seismic Survey Environmental Assessment 25
On the other hand, the TTS threshold for odontocetes exposed to a single impulse from a watergun (Finneran et al. 2002) appeared to be somewhat lower than for exposure to non-impulse sound. This was expected, based on evidence from terrestrial mammals showing that broadband pulsed sounds with rapid rise times have greater auditory effect than do non-impulse sounds (Southall et al. 2007). The received energy level of a single seismic pulse that caused the onset of mild TTS in the beluga, as measured without frequency weighting, was ~186 dB re 1 µPa2 · s or 186 dB SEL (Finneran et al. 2002).7 The rms level of an airgun pulse (in dB re 1 μPa measured over the duration of the pulse) is typically 10–15 dB higher than the SEL for the same pulse when received within a few kilometres of the airguns. Thus, a single airgun pulse might need to have a received level of ~196–201 dB re 1 µParms in order to produce brief, mild TTS. Exposure to several strong seismic pulses that each has a flat-weighted received level near 190 dBrms (175–180 dB SEL) could result in cumulative exposure of ~186 dB SEL (flat-weighted) or ~183 dB SEL (Mmf-weighted), and thus slight TTS in a small odontocete. That assumes that the TTS threshold upon exposure to multiple pulses is (to a first approximation) a function of the total received pulse energy, without allowance for any recovery between pulses. However, recent data have shown that the SEL required for TTS onset to occur increases with intermittent exposures, with some auditory recovery during silent periods between signals (Finneran et al. 2010b; Finneran and Schlundt 2011). For example, Finneran et al. (2011) reported no measurable TTS in bottlenose dolphins after exposure to 10 impulses from a seismic airgun with a cumulative SEL of ~195 dB re 1 µPa2 · s.
The conclusion that the TTS threshold is higher for non-impulse sound than for impulse sound is somewhat speculative. The available TTS data for a beluga exposed to impulse sound are extremely limited, and the TTS data from the beluga and bottlenose dolphin exposed to non-pulse sound pertain to sounds at 3 kHz and above. Follow-on work has shown that the SEL necessary to elicit TTS can depend substantially on frequency, with susceptibility to TTS increasing with increasing frequency above 3 kHz (Finneran and Schlundt 2010, 2011; Finneran 2012).
The above TTS information for odontocetes is derived from studies on the bottlenose dolphin and beluga. There have been no studies of narwhal hearing impairment attributable to airgun sounds. For the one harbor porpoise tested, the received level of airgun sound that elicited onset of TTS was lower. The animal was exposed to single pulses from a small (20 in3) airgun, and auditory evoked potential methods were used to test the animal’s hearing sensitivity at frequencies of 4, 32, or 100 kHz after each exposure (Lucke et al. 2009). Based on the measurements at 4 kHz, TTS occurred upon exposure to one airgun pulse with received level ~200 dB re 1 μPapk-
pk or an SEL of 164.3 dB re 1 µPa2 · s. If these results from a single animal are representative, it is inappropriate to assume that onset of TTS occurs at similar received levels in all odontocetes (cf. Southall et al. 2007). Some cetaceans may incur TTS at lower sound exposures than are necessary to elicit TTS in the beluga or bottlenose dolphin.
Insofar as we are aware, there are no published data confirming that the auditory effect of a sequence of airgun pulses received by an odontocete is a function of their cumulative energy. Southall et al. (2007) consider that to be a reasonable, but probably somewhat precautionary, assumption. It is precautionary because, based on data from terrestrial mammals, one would expect that a given energy exposure would have somewhat less effect if separated into discrete pulses, with potential opportunity for partial auditory recovery between pulses. However, as yet there has been little study of the rate of recovery from TTS in marine mammals, and in humans and other terrestrial mammals the available data on recovery are quite variable. Southall et al. (2007) concluded that―until
7 If the low-frequency components of the watergun sound used in the experiments of Finneran et al. (2002) are
downweighted as recommended by Southall et al. (2007) using their Mmf-weighting curve, the effective exposure level for onset of mild TTS was 183 dB re 1 μPa2 · s (Southall et al. 2007).

Appendix D: Airgun Sounds on Marine Mammals
Shelburne Basin 3-D Seismic Survey Environmental Assessment 26
relevant data on recovery are available from marine mammals―it is appropriate not to allow for any assumed recovery during the intervals between pulses within a pulse sequence.
Additional data are needed to determine the received sound levels at which small odontocetes would start to incur TTS upon exposure to repeated, low-frequency pulses of airgun sound with variable received levels. To determine how close an airgun array would need to approach in order to elicit TTS, one would (as a minimum) need to allow for the sequence of distances at which airgun shots would occur, and for the dependence of received SEL on distance in the region of the seismic operation (e.g., Erbe and King 2009; Breitzke and Bohlen 2010; Laws 2012). At the present state of knowledge, it is also necessary to assume that the effect is directly related to total received energy even though that energy is received in multiple pulses separated by gaps. The lack of data on the exposure levels necessary to cause TTS in toothed whales when the signal is a series of pulsed sounds, separated by silent periods, remains a data gap, as is the lack of published data on TTS in odontocetes other than the beluga, bottlenose dolphin, and harbor porpoise.
Baleen Whales
There are no data, direct or indirect, on levels or properties of sound that are required to induce TTS in any baleen whale. The frequencies to which mysticetes are most sensitive are assumed to be lower than those to which odontocetes are most sensitive, and natural background noise levels at those low frequencies tend to be higher. As a result, auditory thresholds of baleen whales within their frequency band of best hearing are believed to be higher (less sensitive) than are those of odontocetes at their best frequencies (Clark and Ellison 2004). From this, it is suspected that received levels causing TTS onset may also be higher in mysticetes (Southall et al. 2007). However, based on preliminary simulation modeling that attempted to allow for various uncertainties in assumptions and variability around population means, Gedamke et al. (2011) suggested that some baleen whales whose closest point of approach to a seismic vessel is 1 km or more could experience TTS.
In practice during seismic surveys, few if any cases of TTS are expected given the strong likelihood that baleen whales would avoid the approaching airguns (or vessel) before being exposed to levels high enough for there to be any possibility of TTS (see above for evidence concerning avoidance responses by baleen whales). This assumes that the ramp-up (soft-start) procedure is used when commencing airgun operations, to give whales near the vessel the opportunity to move away before they are exposed to sound levels that might be strong enough to elicit TTS. As discussed earlier, single-airgun experiments with bowhead, gray, and humpback whales show that those species do tend to move away when a single airgun starts firing nearby, which simulates the onset of a ramp up.
Pinnipeds
In pinnipeds, TTS thresholds associated with exposure to brief pulses (single or multiple) of underwater sound have not been measured. Two California sea lions did not incur TTS when exposed to single brief pulses with received levels of ~178 and 183 dB re 1 µParms and total energy fluxes of 161 and 163 dB re 1 μPa2 · s (Finneran et al. 2003). However, initial evidence from more prolonged (non-pulse and pulse) exposures suggested that some pinnipeds (harbor seals in particular) incur TTS at somewhat lower received levels than do small odontocetes exposed for similar durations (Kastak et al. 1999, 2005; Ketten et al. 2001; Kastelein et al. 2011). Kastak et al. (2005) reported that the amount of threshold shift increased with increasing SEL in a California sea lion and harbor seal. They noted that, for non-impulse sound, doubling the exposure duration from 25 to 50 min (i.e., a +3 dB change in SEL) had a greater effect on TTS than an increase of 15 dB (95 vs. 80 dB) in exposure level. Mean threshold shifts ranged from 2.9–12.2 dB, with full recovery within 24 hr (Kastak et al. 2005). Kastak et al. (2005) suggested that, for non-impulse sound, SELs resulting in TTS onset in three species of pinnipeds may range from 183 to 206 dB re 1 μPa2 · s, depending on the absolute hearing sensitivity.

Appendix D: Airgun Sounds on Marine Mammals
Shelburne Basin 3-D Seismic Survey Environmental Assessment 27
As noted above for odontocetes, it is expected that—for impulse as opposed to non-impulse sound—the onset of TTS would occur at a lower cumulative SEL given the assumed greater auditory effect of broadband impulses with rapid rise times. The threshold for onset of mild TTS upon exposure of a harbor seal to impulse sounds has been estimated indirectly as being an SEL of ~171 dB re 1 μPa2 · s (Southall et al. 2007). That would be approximately equivalent to a single pulse with received level ~181–186 dB re 1 μParms, or a series of pulses for which the highest rms values are a few dB lower.
At least for non-impulse sounds, TTS onset occurs at appreciably higher received levels in California sea lions and northern elephant seals than in harbor seals (Kastak et al. 2005). Thus, the former two species would presumably need to be closer to an airgun array than would a harbor seal before TTS is a possibility. Insofar as we are aware, there are no data to indicate whether the TTS thresholds of other pinniped species are more similar to those of the harbor seal or to those of the two less-sensitive species.
Likelihood of Incurring TTS
Most cetaceans show some degree of avoidance of seismic vessels operating an airgun array (see above). It is unlikely that these cetaceans would be exposed to airgun pulses at a sufficiently high level for a sufficiently long period to cause more than mild TTS, given the relative movement of the vessel and the marine mammal. TTS would be more likely in any odontocetes that bow- or wake-ride or otherwise linger near the airguns. However, while bow- or wake-riding, odontocetes would be at the surface and thus not exposed to strong sound pulses given the pressure-release and Lloyd Mirror effects at the surface. But if bow- or wake-riding animals were to dive intermittently near airguns, they would be exposed to strong sound pulses, possibly repeatedly.
If some cetaceans did incur mild or moderate TTS through exposure to airgun sounds in this manner, this would very likely be a temporary and reversible phenomenon. However, even a temporary reduction in hearing sensitivity could be deleterious in the event that, during that period of reduced sensitivity, a marine mammal needed its full hearing sensitivity to detect approaching predators, or for some other reason.
Some pinnipeds show avoidance reactions to airguns, but their avoidance reactions are generally not as strong or consistent as those of cetaceans. Pinnipeds occasionally seem to be attracted to operating seismic vessels. There are no specific data on TTS thresholds of pinnipeds exposed to single or multiple low-frequency pulses. However, given the indirect indications of a lower TTS threshold for the harbor seal than for odontocetes exposed to impulse sound (see above), it is possible that some pinnipeds close to a large airgun array could incur TTS.
NMFS (1995, 2000) concluded that cetaceans should not be exposed to pulsed underwater noise at received levels >180 dB re 1 µParms. The corresponding limit for pinnipeds has been set by NMFS at 190 dB, although the HESS Team (HESS 1999) recommended a 180-dB limit for pinnipeds in California. The 180 and 190 dB re 1 µParms levels have not been considered to be the levels above which TTS might occur. Rather, they were the received levels above which, in the view of a panel of bioacoustics specialists convened by NMFS before TTS measurements for marine mammals started to become available, one could not be certain that there would be no injurious effects, auditory or otherwise, to marine mammals. As summarized above, data that are now available imply that TTS is unlikely to occur in various odontocetes (and probably mysticetes as well) unless they are exposed to a sequence of several airgun pulses stronger than 190 dB re 1 µParms. On the other hand, for the harbor seal, harbor porpoise, and perhaps some other species, TTS may occur upon exposure to one or more airgun pulses whose received level equals the NMFS “do not exceed” value of 190 dB re 1 μParms. That criterion corresponds to a single-pulse SEL of 175–180 dB re 1 μPa2 · s in typical conditions, whereas TTS is suspected to be possible in harbor seals and harbor porpoises with a cumulative SEL of ~171 and ~164 dB re 1 μPa2 · s, respectively.

Appendix D: Airgun Sounds on Marine Mammals
Shelburne Basin 3-D Seismic Survey Environmental Assessment 28
It has been shown that most large whales and many smaller odontocetes (especially the harbor porpoise) show at least localized avoidance of ships and/or seismic operations (see above). Even when avoidance is limited to the area within a few hundred metres of an airgun array, that should usually be sufficient to avoid TTS based on what is currently known about thresholds for TTS onset in cetaceans. In addition, ramping up airgun arrays, which is standard operational protocol for many seismic operators, should allow cetaceans near the airguns at the time of startup (if the sounds are aversive) to move away from the seismic source and to avoid being exposed to the full acoustic output of the airgun array (see above). Thus, most baleen whales likely will not be exposed to high levels of airgun sounds provided the ramp-up procedure is applied. Likewise, many odontocetes close to the trackline are likely to move away before the sounds from an approaching seismic vessel become sufficiently strong for there to be any potential for TTS or other hearing impairment. Therefore, there is little potential for baleen whales or odontocetes that show avoidance of ships or airguns to be close enough to an airgun array to experience TTS. In the event that a few individual cetaceans did incur TTS through exposure to strong airgun sounds, this is a temporary and reversible phenomenon unless the exposure exceeds the TTS-onset threshold by a sufficient amount for PTS to be incurred (see below). If TTS but not PTS were incurred, it would most likely be mild, in which case recovery is expected to be quick (probably within minutes).
1.6.2 Permanent Threshold Shift (PTS)
When PTS occurs, there is physical damage to the sound receptors in the ear. In some cases, there can be total or partial deafness, whereas in other cases, the animal has an impaired ability to hear sounds in specific frequency ranges (Kryter 1985). Physical damage to a mammal’s hearing apparatus can occur if it is exposed to sound impulses that have very high peak pressures, especially if they have very short rise times. (Rise time is the interval required for sound pressure to increase from the baseline pressure to peak pressure.)
There is no specific evidence that exposure to pulses of airgun sound can cause PTS in any marine mammal, even with large arrays of airguns. However, given the likelihood that some mammals close to an airgun array might incur at least mild TTS (see above), there has been further speculation about the possibility that some individuals occurring very close to airguns might incur PTS (e.g., Richardson et al. 1995, p. 372ff; Gedamke et al. 2011). Single or occasional occurrences of mild TTS are not indicative of permanent auditory damage, but repeated or (in some cases) single exposures to a level well above that causing TTS onset might elicit PTS. In terrestrial animals, exposure to sounds sufficiently strong to elicit a large TTS induces physiological and structural changes in the inner ear, and at some high level of sound exposure, these phenomena become non-recoverable (Le Prell 2012). At this level of sound exposure, TTS grades into PTS.
Relationships between TTS and PTS thresholds have not been studied in marine mammals, but are assumed to be similar to those in humans and other terrestrial mammals (Southall et al. 2007). Based on data from terrestrial mammals, a precautionary assumption is that the PTS threshold for impulse sounds (such as airgun pulses as received close to the source) is at least 6 dB higher than the TTS threshold on a peak-pressure basis, and probably >6 dB higher (Southall et al. 2007). The low-to-moderate levels of TTS that have been induced in captive odontocetes and pinnipeds during controlled studies of TTS have been confirmed to be temporary, with no measurable residual PTS (Kastak et al. 1999; Schlundt et al. 2000; Finneran et al. 2002, 2005; Nachtigall et al. 2003, 2004). However, very prolonged exposure to sound strong enough to elicit TTS, or shorter-term exposure to sound levels well above the TTS threshold, can cause PTS, at least in terrestrial mammals (Kryter 1985). In terrestrial mammals, the received sound level from a single non-impulsive sound exposure must be far above the TTS threshold for any risk of permanent hearing damage (Kryter 1994; Richardson et al. 1995; Southall et al. 2007). However, there is special concern about strong sounds whose pulses have very rapid rise times. In terrestrial mammals, there are situations when pulses with rapid rise times (e.g., from explosions) can result in PTS even though their peak levels are only a few dB higher than the level causing slight TTS. The rise time of airgun pulses is fast, but not as fast as that of an explosion.

Appendix D: Airgun Sounds on Marine Mammals
Shelburne Basin 3-D Seismic Survey Environmental Assessment 29
Some factors that contribute to onset of PTS, at least in terrestrial mammals, are as follows:
exposure to single very intense sound,
fast rise time from baseline to peak pressure,
repetitive exposure to intense sounds that individually cause TTS but not PTS, and
recurrent ear infections or (in captive animals) exposure to certain drugs.
Cavanagh (2000) reviewed the thresholds used to define TTS and PTS. Based on this review and SACLANT (1998), it is reasonable to assume that PTS might occur at a received sound level 20 dB or more above that inducing mild TTS. However, for PTS to occur at a received level only 20 dB above the TTS threshold, the animal probably would have to be exposed to a strong sound for an extended period, or to a strong sound with rather rapid rise time.
More recently, Southall et al. (2007) estimated that received levels would need to exceed the TTS threshold by at least 15 dB, on an SEL basis, for there to be risk of PTS. Thus, for cetaceans exposed to a sequence of sound pulses, they estimate that the PTS threshold might be an M-weighted SEL (for the sequence of received pulses) of ~198 dB re 1 μPa2 · s (15 dB higher than the Mmf-weighted TTS threshold, in a beluga, for a watergun impulse). Additional assumptions had to be made to derive a corresponding estimate for pinnipeds, as the only available data on TTS-thresholds in pinnipeds pertained to non-impulse sound (see above). Southall et al. (2007) estimated that the PTS threshold could be a cumulative Mpw-weighted SEL of ~186 dB re 1 μPa2 · s in the case of a harbor seal exposed to impulse sound. The PTS threshold for the California sea lion and northern elephant seal would probably be higher given the higher TTS thresholds in those species. Southall et al. (2007) also note that, regardless of the SEL, there is concern about the possibility of PTS if a cetacean or pinniped received one or more pulses with peak pressure exceeding 230 or 218 dB re 1 μPa, respectively. Thus, PTS might be expected upon exposure of cetaceans to either SEL ≥198 dB re 1 μPa2 · s or peak pressure ≥230 dB re 1 μPa. Corresponding proposed dual criteria for pinnipeds (at least harbor seals) are ≥186 dB SEL and ≥ 218 dB peak pressure (Southall et al. 2007).
These estimates are all first approximations, given the limited underlying data, numerous assumptions, and species differences. Also, data have been published subsequent to Southall et al. (2007) indicating that, at least for non-pulse sounds, the “equal energy” model is not be entirely correct―TTS and presumably PTS thresholds may depend somewhat on the duration over which sound energy is accumulated, the frequency of the sound, whether or not there are gaps, and probably other factors (Ketten 1994, 2012). PTS effects may also be influenced strongly by the health of the receiver’s ear.
As described above for TTS, in estimating the amount of sound energy required to elicit the onset of TTS (and PTS), it is assumed that the auditory effect of a given cumulative SEL from a series of pulses is the same as if that amount of sound energy were received as a single strong sound. There are no data from marine mammals concerning the occurrence or magnitude of a potential partial recovery effect between pulses. In deriving the estimates of PTS (and TTS) thresholds quoted here, Southall et al. (2007) made the precautionary assumption that no recovery would occur between pulses.
The TTS section (above) concludes that exposure to several strong seismic pulses that each have flat-weighted received levels near 190 dB re 1 μParms (175–180 dB re 1 μPa2 · s SEL) could result in cumulative exposure of ~186 dB SEL (flat-weighted) or ~183 dB SEL (Mmf-weighted), and thus slight TTS in a small odontocete. Allowing for the assumed 15 dB offset between PTS and TTS thresholds, expressed on an SEL basis, exposure to several strong seismic pulses that each have flat-weighted received levels near 205 dBrms (190-195 dB SEL) could result in cumulative exposure of ~198 dB SEL (Mmf-weighted), and thus slight PTS in a small odontocete. However, the levels of successive pulses that will be received by a marine mammal that is below the surface as a seismic vessel approaches, passes and moves away will tend to increase gradually and then decrease

Appendix D: Airgun Sounds on Marine Mammals
Shelburne Basin 3-D Seismic Survey Environmental Assessment 30
gradually, with periodic decreases superimposed on this pattern when the animal comes to the surface to breathe. To estimate how close an odontocete’s CPA distance would have to be for the cumulative SEL to exceed 198 dB SEL (Mmf-weighted), one would (as a minimum) need to allow for the sequence of distances at which airgun shots would occur, and for the dependence of received SEL on distance in the region of the seismic operation (e.g., Erbe and King 2009).
It is unlikely that an odontocete would remain close enough to a large airgun array for sufficiently long to incur PTS. There is some concern about bowriding odontocetes, but for animals at or near the surface, auditory effects are reduced by Lloyd’s mirror and surface release effects. The presence of the vessel between the airgun array and bow-riding odontocetes could also, in some but probably not all cases, reduce the levels received by bow-riding animals (e.g., Gabriele and Kipple 2009). The TTS (and thus PTS) thresholds of baleen whales are unknown but, as an interim measure, assumed to be no lower than those of odontocetes. Also, baleen whales generally avoid the immediate area around operating seismic vessels, so it is unlikely that a baleen whale could incur PTS from exposure to airgun pulses. The TTS (and thus PTS) thresholds of some pinnipeds (e.g., harbor seal) as well as the harbor porpoise may be lower (Kastak et al. 2005; Southall et al. 2007; Lucke et al. 2009; Kastelein et al. 2011). If so, TTS and potentially PTS may extend to a somewhat greater distance for those animals. Again, Lloyd’s mirror and surface release effects will ameliorate the effects for animals at or near the surface.
Although it is unlikely that airgun operations during most seismic surveys would cause PTS in many marine mammals, caution is warranted given
the limited knowledge about noise-induced hearing damage in marine mammals, particularly baleen whales, pinnipeds, and sea otters;
the seemingly greater susceptibility of certain species (e.g., harbor porpoise and harbor seal) to TTS and presumably also PTS; and
the lack of knowledge about TTS and PTS thresholds in many species, including various species closely related to the harbor porpoise and harbor seal.
The avoidance reactions of many marine mammals, along with commonly-applied monitoring and mitigation measures (visual and passive acoustic monitoring, ramp ups, and power downs or shut downs when mammals are detected within or approaching the “safety radii”), would reduce the already-low probability of exposure of marine mammals to sounds strong enough to induce PTS.
1.6.3 Strandings and Mortality
Marine mammals close to underwater detonations of high explosives can be killed or severely injured, and the auditory organs are especially susceptible to injury (Ketten et al. 1993; Ketten 1995). However, explosives are no longer used in marine waters for commercial seismic surveys or (with rare exceptions) for seismic research; they have been replaced by airguns and other non-explosive sources. Airgun pulses are less energetic and have slower rise times, and there is no specific evidence that they can cause serious injury, death, or stranding even in the case of large airgun arrays. However, the association of mass strandings of beaked whales with naval exercises and, in one case, a seismic survey (Malakoff 2002; Cox et al. 2006), has raised the possibility that beaked whales exposed to strong “pulsed” sounds may be especially susceptible to injury and/or behavioural reactions that can lead to stranding (e.g., Hildebrand 2005; Southall et al. 2007). Hildebrand (2005) reviewed the association of cetacean strandings with high-intensity sound events and found that deep-diving odontocetes, primarily beaked whales, were by far the predominant (95%) cetaceans associated with these events, with 2% mysticete whales (minke). However, as summarized below, there is no definitive evidence that airguns can lead to injury, strandings, or mortality even for marine mammals in close proximity to large airgun arrays.

Appendix D: Airgun Sounds on Marine Mammals
Shelburne Basin 3-D Seismic Survey Environmental Assessment 31
Specific sound-related processes that lead to strandings and mortality are not well documented, but may include (1) swimming in avoidance of a sound into shallow water; (2) a change in behaviour (such as a change in diving behaviour that might contribute to tissue damage, gas bubble formation, hypoxia, cardiac arrhythmia, hypertensive hemorrhage or other forms of trauma; (3) a physiological change such as a vestibular response leading to a behavioural change or stress-induced hemorrhagic diathesis, leading in turn to tissue damage; and (4) tissue damage directly from sound exposure, such as through acoustically mediated bubble formation and growth or acoustic resonance of tissues. Some of these mechanisms are unlikely to apply in the case of impulse sounds. However, there are increasing indications that gas-bubble disease (analogous to “the bends”), induced in supersaturated tissue by a behavioural response to acoustic exposure, could be a pathologic mechanism for the strandings and mortality of some deep-diving cetaceans exposed to sonar. The evidence for this remains circumstantial and associated with exposure to naval mid-frequency sonar, not seismic surveys (Cox et al. 2006; Southall et al. 2007).
Seismic pulses and mid-frequency sonar signals are quite different, and some mechanisms by which sonar sounds have been hypothesized to affect beaked whales are unlikely to apply to airgun pulses. Sounds produced by airgun arrays are broadband impulses with most of the energy below 1 kHz. Typical military mid-frequency sonars emit non-impulse sounds at frequencies of 2–10 kHz, generally with a relatively narrow bandwidth at any one time (though the frequency may change over time). Thus, it is not appropriate to assume that the effects of seismic surveys on beaked whales or other species would be the same as the apparent effects of military sonar. For example, resonance effects (Gentry 2002) and acoustically-mediated bubble-growth (Crum et al. 2005) are implausible in the case of exposure to broadband airgun pulses. Nonetheless, evidence that sonar signals can, in special circumstances, lead (at least indirectly) to physical damage and mortality (e.g., Balcomb and Claridge 2001; NOAA and USN 2001; Jepson et al. 2003; Fernández et al. 2004, 2005; Hildebrand 2005; Cox et al. 2006) suggests that caution is warranted when dealing with exposure of marine mammals to any high-intensity “pulsed” sound. One of the hypothesized mechanisms by which naval sonars lead to strandings might, in theory, also apply to seismic surveys: If the strong sounds sometimes cause deep-diving species to alter their surfacing–dive cycles in a way that causes bubble formation in tissue, that hypothesized mechanism might apply to seismic surveys as well as mid-frequency naval sonars. However, there is no specific evidence of this upon exposure to airgun pulses.
There is no conclusive evidence of cetacean strandings or deaths at sea as a result of exposure to seismic surveys. However, Gray and Van Waerebeek (2011) have suggested a cause-effect relationship between a seismic survey off Liberia in 2009 and the erratic movement, postural instability, and akinesia in a pantropical spotted dolphin based on spatially and temporally close association with the airgun array. Additionally, a few cases of strandings in the general area where a seismic survey was ongoing have led to speculation concerning a possible link between seismic surveys and strandings. • Suggestions that there was a link between seismic surveys and strandings of humpback whales in Brazil (Engel et al. 2004) were not well founded (IAGC 2004; IWC 2007). • In Sept. 2002, there was a stranding of two Cuvier’s beaked whales in the Gulf of California, Mexico, when the L-DEO seismic vessel R/V Maurice Ewing was operating a 20-airgun, 8490-in3 airgun array in the general area. The evidence linking the stranding to the seismic survey was inconclusive and not based on any physical evidence (Hogarth 2002; Yoder 2002). The ship was also operating its multibeam echosounder at the same time, but this had much less potential than the aforementioned naval sonars to affect beaked whales, given its downward-directed beams, much shorter pulse durations, and lower duty cycle. Nonetheless, the Gulf of California incident plus the beaked whale strandings near naval exercises involving use of mid-frequency sonar suggest a need for caution in conducting seismic surveys in areas occupied by beaked whales until more is known about effects of seismic surveys on those species (Hildebrand 2005).

Appendix D: Airgun Sounds on Marine Mammals
Shelburne Basin 3-D Seismic Survey Environmental Assessment 32
1.6.4 Non-Auditory Physiological Effects
Based on evidence from terrestrial mammals and humans, sound is a potential source of stress (Wright and Kuczaj 2007; Wright et al. 2007a,b, 2009, 2011). However, almost no information is available on sound-induced stress in marine mammals, or on its potential (alone or in combination with other stressors) to affect the long-term well-being or reproductive success of marine mammals (Fair and Becker 2000; Hildebrand 2005; Wright et al. 2007a,b). Such long-term effects, if they occur, would be mainly associated with chronic noise exposure, which is characteristic of some seismic surveys and exposure situations (McCauley et al. 2000a:62ff; Nieukirk et al. 2009) but not of some others.
Available data on potential stress-related impacts of anthropogenic noise on marine mammals are extremely limited, and additional research on this topic is needed. We know of only two specific studies of noise-induced stress in marine mammals. (1) Romano et al. (2004) examined the effects of single underwater impulse sounds from a seismic water gun (source level up to 228 dB re 1 µPa · mp–p) and single short-duration pure tones (sound pressure level up to 201 dB re 1 μPa) on the nervous and immune systems of a beluga and a bottlenose dolphin. They found that neural-immune changes to noise exposure were minimal. Although levels of some stress-released substances (e.g., catecholamines) changed significantly with exposure to sound, levels returned to baseline after 24 hr. (2) During playbacks of recorded drilling noise to four captive beluga whales, Thomas et al. (1990) found no changes in blood levels of stress-related hormones. Long-term effects were not measured, and no short-term effects were detected. For both studies, caution is necessary when extrapolating these results to wild animals and to real-world situations given the small sample sizes, use of captive animals, and other technical limitations of the two studies.
Aside from stress, other types of physiological effects that might, in theory, be involved in beaked whale strandings upon exposure to naval sonar (Cox et al. 2006), such as resonance and gas bubble formation, have not been demonstrated and are not expected upon exposure to airgun pulses (see preceding subsection). If seismic surveys disrupt diving patterns of deep-diving species, this might perhaps result in bubble formation and a form of “the bends”, as speculated to occur in beaked whales exposed to sonar. However, there is no specific evidence that exposure to airgun pulses has this effect.
In summary, very little is known about the potential for seismic survey sounds (or other types of strong underwater sounds) to cause non-auditory physiological effects in marine mammals. Such effects, if they occur at all, would presumably be limited to short distances and to activities that extend over a prolonged period. The available data do not allow identification of a specific exposure level above which non-auditory effects can be expected (Southall et al. 2007), or any meaningful quantitative predictions of the numbers (if any) of marine mammals that might be affected in these ways.
1.7 Literature Cited Akamatsu, T., Y. Hatakeyama, and N. Takatsu. 1993. Effects of pulsed sounds on escape behavior of false killer whales.
Nipp. Suis. Gakkaishi 59(8):1297-1303.
Allen, B.M. and R.P. Angliss. 2011. Alaska marine mammal stock assessments, 2010. U.S. Dep. Commer., NOAA Tech. Memo. NMFS-AFSC-223. 292 p.
Anonymous. 1975. Phantom killer whales. S. Afr. Ship. News & Fishing Indus. Rev. 30(7):50-53.
Arnold, B.W. 1996. Visual monitoring of marine mammal activity during the Exxon 3-D seismic survey: Santa Ynez unit, offshore California 9 November to 12 December 1995. Rep. from Impact Sciences Inc., San Diego, CA, for Exxon Co., U.S.A., Thousand Oaks, CA. 20 p.
Au, W.W.L. 1993. The Sonar of Dolphins. Springer-Verlag, New York, NY. 277 p.
Au, W.W.L., A.N. Popper, and R.R. Fay. 2000. Hearing by Whales and Dolphins. Springer Handbook of Auditory Res. Vol. 12. Springer-Verlag, New York, NY. 458 p.

Appendix D: Airgun Sounds on Marine Mammals
Shelburne Basin 3-D Seismic Survey Environmental Assessment 33
Au, W.W.L., A.A. Pack, M.O. Lammers, L.M. Herman, M.H. Deakos, and K. Andrews. 2006. Acoustic properties of humpback whale songs. J. Acoust. Soc. Am. 120(2):1103-1110.
Backus, R.H. and W.E. Schevill. 1966. Physeter clicks. p. 510-528 in K.S. Norris (ed.), Whales, dolphins, and porpoises. Univ. Calif. Press, Berkeley, CA. 789 p
Bain, D.E. and R. Williams. 2006. Long-range effects of airgun noise on marine mammals: responses as a function of received sound level and distance. Paper SC/58/E35 presented to the IWC Scient. Commit., IWC Annu. Meet., 1-13 June, St. Kitts.
Baird, R.W. 2005. Sightings of dwarf (Kogia sima) and pygmy (K. breviceps) sperm whales from the main Hawaiian Islands. Pacific Sci. 59(3):461-466.
Baird, R.W., D.L. Webster, D.J. McSweeney, A.D. Ligon, G.S. Schorr, and J. Barlow. 2006. Diving behavior and ecology of Cuvier’s (Ziphius cavirostris) and Blainville’s (Mesoplodon densirostris) beaked whales in Hawaii. Can. J. Zool. 84(8):1120-1128.
Balcomb, K.C., III and D.E. Claridge. 2001. A mass stranding of cetaceans caused by naval sonar in the Bahamas. Bahamas J. Sci. 8(2):2-12.
Barkaszi, M.J., D.M. Epperson, and B. Bennett. 2009. Six-year compilation of cetacean sighting data collected during commercial seismic survey mitigation observations throughout the Gulf of Mexico, USA. p. 24-25 In: Abstr. 18th Bienn. Conf. Biol. Mar. Mamm., Québec, Oct. 2009. 306 p.
Barlow, J. and R. Gisiner. 2006. Mitigating, monitoring and assessing the effects of anthropogenic sound on beaked whales. J. Cetac. Res. Manage. 7(3):239-249.
Barry, S.B., A.C. Cucknell and N. Clark. 2012. A direct comparison of bottlenose dolphin and common dolphin behaviour during seismic surveys when airguns are and are not being utilised. p. 273-276 In: A.N. Popper and A. Hawkins (eds.), The effects of noise on aquatic life. Springer, New York. 695 p.
Beale, C.M. and P. Monaghan. 2004. Behavioural responses to human disturbance: a matter of choice? Anim. Behav. 68(5):1065-1069.
Beland, J.A., B. Haley, C.M. Reiser, D.M. Savarese, D.S. Ireland and D.W. Funk. 2009. Effects of the presence of other vessels on marine mammal sightings during multi-vessel operations in the Alaskan Chukchi Sea. p. 29 In: Abstr. 18th Bienn. Conf. Biol. Mar. Mamm., Québec, Oct. 2009:29. 306 p.
Berta, A., R. Racicot and T. Deméré. 2009. The comparative anatomy and evolution of the ear in Balaenoptera mysticetes. p. 33 In: Abstr. 18th Bienn. Conf. Biol. Mar. Mamm., Québec, Oct. 2009. 306 p.
Blackwell, S.B., C.R. Greene, T.L. McDonald, C.S. Nations, R.G. Norman, and A. Thode. 2009a. Beaufort Sea bowhead whale migration route study. Chapter 8 In: D.S. Ireland, D.W. Funk, R. Rodrigues, and W.R. Koski (eds.). 2009. Joint Monitoring Program in the Chukchi and Beaufort seas, open water seasons, 2006-2007. LGL Alaska Rep. P971-2. Rep. from LGL Alaska Res. Assoc. Inc. (Anchorage, AK) et al. for Shell Offshore Inc. (Anchorage, AK) et al. 485 p. plus appendices.
Blackwell, S.B., C.S. Nations, T.L. McDonald, A.M. Thode, K.H. Kim, C.R. Greene, and M.A. Macrander. 2009b. Effects of seismic exploration activities on the calling behavior of bowhead whales in the Alaskan Beaufort Sea. p. 35 In: Abstr. 18th Bienn. Conf. Biol. Mar. Mamm., Québec, Oct. 2009. 306 p.
Blackwell, S.B., C.S. Nations, T.L. McDonald, A. Thode, K.H. Kim, Charles R. Greene, Jr., and A.M. Macrander. 2010. Effects of seismic exploration activities on bowhead whale call distribution in the Alaskan Beaufort Sea. J. Acoust. Soc. Am. 127(3):1756.
Blackwell, S.B., T.L. McDonald, C.S. Nations, A.M. Thode, K.H. Kim, C.R. Greene, Jr., M. Guerra, D. Mathias, and A.M. Macrander. 2011. Effects of seismic exploration activities on the calling behavior of bowhead whales, Balaena mysticetus, in the Alaskan Beaufort Sea. p. 34 In: Abstr. 19th Bienn. Conf. Biol. Mar. Mamm., Tampa, FL, 27 Nov.–2 Dec. 2011. 344 p.
Bowles, A.E., M. Smultea, B. Würsig, D.P. DeMaster, and D. Palka. 1994. Relative abundance and behavior of marine mammals exposed to transmissions from the Heard Island Feasibility Test. J. Acoust. Soc. Am. 96(4):2469-2484.
Appendix D: Airgun Sounds on Marine Mammals
Shelburne Basin 3-D Seismic Survey Environmental Assessment 34
Britto, M.K. and A. Silva Barreto. 2009. Marine mammal diversity registered on seismic surveys in Brazil, between 2000 and 2008. p. 41 In: Abstr. 18th Bienn. Conf. Biol. Mar. Mamm., Québec, Oct. 2009. 306 p.
Brodie, P.F. 1981. Energetic and behavioural considerations with respect to marine mammals and disturbance from underwater noise. p. 287-290 In: N.M. Peterson (ed.), The question of sound from icebreaker operations: Proceedings of a workshop. Arctic Pilot Proj., Petro-Canada, Calgary, Alb. 350 p.
Breitzke, M. and T. Bohlen. 2010. Modelling sound propagation in the Southern Ocean to estimate the acoustic impact of seismic research surveys on marine mammals. Geophys. J. Int. 181(2):818-846.
Bullock, T.H., T.J. O’Shea, and M.C. McClune. 1982. Auditory evoked potentials in the West Indian manatee (Sirenia: Trichechus manatus). J. Comp. Physiol. A 148(4):547-554.
Burgess, W.C. and C.R. Greene, Jr. 1999. Physical acoustics measurements. p. 3-1 to 3-63 In: W.J. Richardson (ed.), Marine mammal and acoustical monitoring of Western Geophysical's open-water seismic program in the Alaskan Beaufort Sea, 1998. LGL Rep. TA22303. Rep. from LGL Ltd., King City, Ont., and Greeneridge Sciences Inc., Santa Barbara, CA, for Western Geophysical, Houston, TX, and Nat. Mar. Fish. Serv., Anchorage, AK, and Silver Spring, MD. 390 p.
Calambokidis, J. and S.D. Osmek. 1998. Marine mammal research and mitigation in conjunction with air gun operation for the USGS `SHIPS' seismic surveys in 1998. Rep. from Cascadia Res., Olympia, WA, for U.S. Geol. Surv., Nat. Mar. Fish. Serv., and Minerals Manage. Serv.
Caldwell, J. and W. Dragoset. 2000. A brief overview of seismic air-gun arrays. Leading Edge 19(8):898-902.
Castellote, M., C.W. Clark, F. Colmenares, and J.A. Esteban. 2009. Mediterranean fin whale migration movements altered by seismic exploration noise. J. Acoust. Soc. Am. 125(4):2519
Castellote, M., C.W. Clark and M.O. Lammers. 2010a. Potential negative effects in the reproduction and survival on fin whales (Balaenoptera physalus) by shipping and airgun noise. Int. Whal. Comm. Working Pap. SC/62/E3. 12 p.
Castellote, M., C.W. Clark, and M.O. Lammers. 2010b. Acoustic compensation to shipping and airgun noise by Mediterranean fin whales (Balaenoptera physalus). J. Acoust. Soc. Am. 127(3):1726.
Castellote, M., C.W. Clark, and M.O. Lammers. 2012. Acoustic and behavioural changes by fin whales (Balaenoptera physalus) in response to shipping and airgun noise. Biol. Conserv. 147(1):115-122.
Cato, D.H. M.J. Noad, R.A. Dunlop, R.D. McCauley, C.P. Salgado Kent, N.J. Gales, H. Kniest, J. Noad, and D. Paton. 2011. Behavioral response of Australian humpback whales to seismic surveys. J. Acoust. Soc. Am. 129(4):2396.
Cavanagh, R.C. 2000. Criteria and thresholds for adverse effects of underwater noise on marine animals. AFRL-HE-WP-TR-2000-0092. Rep. from Science Applications Intern. Corp., McLean, VA, for Air Force Res. Lab., Wright-Patterson AFB, OH.
Cerchio, S., S. Strindberg, T. Collins, C. Bennett, and H. Rosenbaum. 2011. Humpback whale singing activity off northern Angola: an indication of the migratory cycle, breeding habitat and impact of seismic surveys on singer number. p. 56 In: Abstr. 19th Bienn. Conf. Biol. Mar. Mamm., Tampa, FL, 27 Nov.–2 Dec. 2011. 344 p.
Christie, K., C. Lyons, W.R. Koski, D.S. Ireland, and D.W. Funk. 2009. Patterns of bowhead whale occurrence and distribution during marine seismic operations in the Alaskan Beaufort Sea. p. 55 In: Abstr. 18th Bienn. Conf. Biol. Mar. Mamm., Québec, Canada, 12-16 Oct. 2009.
Citta, J.J., L.T. Quakenbush, R.J. Small, and J.C. George. 2007. Movements of a tagged bowhead whale in the vicinity of a seismic survey in the Beaufort Sea. Poster Paper, Soc. Mar. Mammal. 17th Bienn. Meet., Cape Town, South Africa.
Clark, C.W. and W.T. Ellison. 2004. Potential use of low-frequency sounds by baleen whales for probing the environment: Evidence from models and empirical measurements. p. 564-589 In: J.A. Thomas, C.F. Moss and M. Vater (eds.), Echolocation in Bats and Dolphins. Univ. Chicago Press, Chicago, IL. 604 p.
Clark, C.W. and G.C. Gagnon. 2006. Considering the temporal and spatial scales of noise exposures from seismic surveys on baleen whales. Intern. Whal. Commis. Working Pap. SC/58/E9. 9 p.
Clark, C.W., W.T. Ellison, B.L. Southall, L. Hatch, S.M. Van Parijs, A. Frankel, and D. Ponirakis. 2009. Acoustic masking in marine ecosystems: intuitions, analysis, and implication. Mar. Ecol. Prog. Ser. 395:201-222.

Appendix D: Airgun Sounds on Marine Mammals
Shelburne Basin 3-D Seismic Survey Environmental Assessment 35
Cook, M.L.H., R.A. Varela, J.D. Goldstein, S.D. McCulloch, G.D. Bossart, J.J. Finneran, D. Houser, and A. Mann. 2006. Beaked whale auditory evoked potential hearing measurements. J. Comp. Physiol. A 192:489-495.
Cox, T.M., T.J. Ragen, A.J. Read, E. Vos, R.W. Baird, K. Balcomb, J. Barlow, J. Caldwell, T. Cranford, L. Crum, A. D’Amico, G. D’Spain, A. Fernández, J. Finneran, R. Gentry, W. Gerth, F. Gulland, J. Hildebrand, D. Houserp, R. Hullar, P.D. Jepson, D. Ketten, C.D. Macleod, P. Miller, S. Moore, D.C. Mountain, D. Palka, P. Ponganis, S. Rommel, T. Rowles, B. Taylor, P. Tyack, D. Wartzok, R. Gisiner, J. Meads, and L. Benner. 2006. Understanding the impacts of anthropogenic sound on beaked whales. J. Cetac. Res. Manage. 7(3):177-187.
Crum, L.A., M.R. Bailey, J. Guan, P.R. Hilmo, S.G. Kargl, and T.J. Matula. 2005. Monitoring bubble growth in supersaturated blood and tissue ex vivo and the relevance to marine mammal bioeffects. Acoustic Res. Lett. Online 6(3):214-220.
Dahlheim, M.E. 1987. Bio-acoustics of the gray whale (Eschrichtius robustus). Ph.D. Dissertation, Univ. British Columbia, Vancouver, BC. 315 p.
D’Amico, A., R.C. Gisiner, D.R. Ketten, J.A. Hammock, C. Johnson, P.L. Tyack, and J. Mead. 2009. Beaked whales strandings and naval exercises. Aquat. Mamm. 35(4):452-472.
DeRuiter, S.L., P.L. Tyack, Y.-T. Lin, A.E. Newhall, J.F. Lynch, and P.J.O. Miller. 2006. Modeling acoustic propagation of airgun array pulses recorded on tagged sperm whales (Physeter macrocephalus). J. Acoust. Soc. Am. 120(6):4100-4114.
Di Iorio, L. and C.W. Clark. 2010. Exposure to seismic survey alters blue whale acoustic communication. Biol. Lett. 6(1):51-54.
Duncan, P.M. 1985. Seismic sources in a marine environment. p. 56-88 In: Proceedings of the Workshop on Effects of Explosives Use in the Marine Environment, Jan. 1985, Halifax, N.S. Tech. Rep. 5. Can. Oil & Gas Lands Admin., Environ. Prot. Branch, Ottawa, Ont.
Dunn, R.A. and O. Hernandez. 2009. Tracking blue whales in the eastern tropical Pacific with an ocean-bottom seismometer and hydrophone array. J. Acoust. Soc. Am. 126(3):1084-1094.
Ellison, W.T., B.L. Southall, C.W. Clark and A.S. Frankel. 2012. A new context-based approach to assess marine mammal behavioral responses to anthropogenic sounds. Conserv. Biol. (in press). doi: 10.1111/j.1523-1739.2011. 01803.x.
Engel, M.H., M.C.C. Marcondes, C.C.A. Martins, F.O. Luna, R.P. Lima, and A. Campos. 2004. Are seismic surveys responsible for cetacean strandings? An unusual mortality of adult humpback whales in Abrolhos Bank, northeastern coast of Brazil. Paper SC/56/E28 presented to the IWC Scient. Commit., IWC Annu. Meet., 19-22 July, Sorrento, Italy.
Erbe, C. and A.R. King. 2009. Modeling cumulative sound exposure around marine seismic surveys. J. Acoust. Soc. Am. 125(4):2443-2451.
Fair, P.A. and P.R. Becker. 2000. Review of stress in marine mammals. J. Aquat. Ecosyst. Stress Recov. 7:335-354.
Fernández, A., M. Arbelo, R. Deaville, I.A.P. Patterson, P. Castro, J.R. Baker, E. Degollada, H.M. Ross, P. Herráez, A.M. Pocknell, E. Rodríguez, F.E. Howie, A. Espinosa, R.J. Reid, J.R. Jaber, V. Martin, A.A. Cunningham, and P.D. Jepson. 2004. Pathology: whales, sonar and decompression sickness (reply). Nature 428(6984, 15 Apr.). doi: 10.1038/nature02528a.
Fernández, A., J.F. Edwards, F. Rodriquez, A.E. de los Monteros, P. Herráez, P. Castro, J.R. Jaber, V. Martin, and M. Arbelo. 2005. “Gas and fat embolic syndrome” involving a mass stranding of beaked whales (Family Ziphiidae) exposed to anthropogenic sonar signals. Veterin. Pathol. 42(4):446-457.
Filadelfo, R., J. Mintz, E. Michlovich, A. D'Amico, P.L. Tyack and D.R. Ketten. 2009. Correlating military sonar use with beaked whale mass strandings: what do the historical data show? Aquat. Mamm. 35(4):435-444.
Finneran, J.J. 2012. Auditory effects of underwater noise in odontocetes. p. 197-202 In: A.N. Popper and A. Hawkins (eds.), The effects of noise on aquatic life. Springer, New York, NY. 695 p.
Finneran, J.J. and C.E. Schlundt. 2004. Effects of intense pure tones on the behavior of trained odontocetes. Tech. Rep. 1913. Space and Naval Warfare (SPAWAR) Systems Center, San Diego, CA. 15 p.

Appendix D: Airgun Sounds on Marine Mammals
Shelburne Basin 3-D Seismic Survey Environmental Assessment 36
Finneran, J.J. and C.E. Schlundt. 2010. Frequency-dependent and longitudinal changes in noise-induced hearing loss in a bottlenose dolphin (Tursiops truncatus) (L). J. Acoust. Soc. Am. 128(2):567-570.
Finneran, and C. Schlundt. 2011. Noise-induced temporary threshold shift in marine mammals. J. Acoust. Soc. Am. 129(4):2432. [supplemented by oral presentation at the ASA meeting, Seattle, WA, May 2011].
Finneran, J.J., C.E. Schlundt, D.A. Carder, J.A. Clark, J.A. Young, J.B. Gaspin, and S.H. Ridgway. 2000. Auditory and behavioral responses of bottlenose dolphins (Tursiops truncatus) and beluga whale (Delphinapterus leucas) to impulsive sounds resembling distant signatures of underwater explosions. J. Acoust. Soc. Am. 108(1):417-431.
Finneran, J.J., C.E. Schlundt, R. Dear, D.A. Carder, and S.H. Ridgway. 2002. Temporary shift in masked hearing thresholds in odontocetes after exposure to single underwater impulses from a seismic watergun. J. Acoust. Soc. Am. 111(6):2929-2940.
Finneran, J.J., R. Dear, D.A. Carder, and S.H. Ridgway. 2003. Auditory and behavioral responses of California sea lions (Zalophus californianus) to single underwater impulses from an arc-gap transducer. J. Acoust. Soc. Am. 114(3):1667-1677.
Finneran, J.J., D.A. Carder, C.E. Schlundt, and S.H. Ridgway. 2005. Temporary threshold shift in bottlenose dolphins (Tursiops truncatus) exposed to mid-frequency tones. J. Acoust. Soc. Am. 118(4):2696-2705.
Finneran, J.J., D.S. Houser, B. Mase-Guthrie, R.Y. Ewing and R.G. Lingenfelser. 2009. Auditory evoked potentials in a stranded Gervais’ beaked whale (Mesoplodon europaeus). J. Acoust. Soc. Am. 126(1):484-490.
Finneran, J.J., D.A. Carder, C.E. Schlundt and R.L. Dear. 2010a. Growth and recovery of temporary threshold shift (TTS) at 3 kHz in bottlenose dolphins (Tursiops truncatus). J. Acoust. Soc. Am. 127(5):3256-3266.
Finneran, J.J., D.A. Carder, C.E. Schlundt and R.L. Dear. 2010b. Temporary threshold shift in a bottlenose dolphin (Tursiops truncatus) exposed to intermittent tones. J. Acoust. Soc. Am. 127(5):3267-3272.
Finneran, J.J., J.S. Trickey, B.K. Branstetter, C.E. Schlundt, and K. Jenkins. 2011. Auditory effects of multiple underwater impulses on bottlenose dolphins (Tursiops truncatus). J. Acoust. Soc. Am. 130(4):2561.
Fish, J.F. and J.S. Vania. 1971. Killer whale, Orcinus orca, sounds repel white whales, Delphinapterus leucas. Fish. Bull. 69(3):531-535.
Fox, C.G., R.P. Dziak, and H. Matsumoto. 2002. NOAA efforts in monitoring of low-frequency sound in the global ocean. J. Acoust. Soc. Am. 112(5, Pt. 2):2260 (Abstract).
Frankel, A. 2005. Gray whales hear and respond to a 21-25 kHz high-frequency whale-finding sonar. p. 97 In: Abstr. 16th Bienn. Conf. Biol. Mar. Mamm., San Diego, CA, Dec. 2005. 306 p.
Frantzis, A. 1998. Does acoustic testing strand whales? Nature 392(6671):29.
Frost, K.J., L.F. Lowry, and R.R. Nelson. 1984. Belukha whale studies in Bristol Bay, Alaska. p. 187-200 In: B.R. Melteff and D.H. Rosenberg (eds.), Proceedings of the Workshop on Biological Interactions among Marine Mammals and Commercial Fisheries in the Southeastern Bering Sea, Oct. 1983, Anchorage, AK. Univ. Alaska Sea Grant Rep. 84-1. Univ. Alaska, Fairbanks, AK.
Funk, D.W., D.S. Ireland, R. Rodrigues, and W.R. Koski (eds.). 2010. Joint monitoring program in the Chukchi and Beaufort Seas, open water seasons, 2006-2008. LGL Alaska Rep. P1050-2. Rep. from LGL Alaska Res. Assoc. Inc. (Anchorage, AK) et al. for Shell Offshore Inc., other Industry contributors, U.S. Nat. Mar. Fish. Serv., and U.S. Fish Wildl. Serv. 506 p.
Gabriele, C.M. and B. Kipple. 2009. Measurements of near-surface, near-bow underwater sound from cruise ships. p. 86 In: Abstr. 18th Bienn. Conf. Biol. Mar. Mamm., Québec, Oct. 2009. 306 p.
Gailey, G., B. Würsig, and T.L. McDonald. 2007. Abundance, behavior, and movement patterns of western gray whales in relation to a 3-D seismic survey, northeast Sakhalin Island, Russia. Environ. Monit. Assessm. 134(1-3):75-91.
Gedamke, J. 2011. Ocean basin scale loss of whale communication space: potential impacts of a distant seismic survey. p. 105-106 In: Abstr. 19th Bienn. Conf. Biol. Mar. Mamm., Tampa, FL, 27 Nov.–2 Dec. 2011. 344 p.
Gedamke, J., N. Gales, and S. Frydman. 2011. Assessing risk of baleen whale hearing loss from seismic surveys: the effects of uncertainty and individual variation. J. Acoust. Soc. Am. 129(1):496-506.

Appendix D: Airgun Sounds on Marine Mammals
Shelburne Basin 3-D Seismic Survey Environmental Assessment 37
Gentry, R. (ed.). 2002. Report of the workshop on acoustic resonance as a source of tissue trauma in cetaceans. April 24 and 25, Silver Spring, MD. Nat. Mar. Fish. Serv. 19 p. Accessed on 19 November 2011 at http://www.nmfs.noaa.gov/pr/pdfs/acoustics/cetaceans.pdf.
Gerstein, E.R., L.A. Gerstein, S.E. Forsythe, and J.E. Blue. 1999. The underwater audiogram of a West Indian manatee (Trichechus manatus). J. Acoust. Soc. Am. 105(6):3575-3583.
Goold, J.C. 1996a. Acoustic assessment of common dolphins off the West Wales coast, in conjunction with 16th round seismic surveying. Rep. from School of Ocean Sciences, Univ. Wales, Bangor, Wales, for Chevron UK Ltd., Repsol Exploration (UK) Ltd., and Aran Energy Exploration Ltd. 22 p.
Goold, J.C. 1996b. Acoustic assessment of populations of common dolphin Delphinus delphis in conjunction with seismic surveying. J. Mar. Biol. Assoc. U.K. 76:811-820.
Goold, J.C. 1996c. Acoustic cetacean monitoring off the west Wales coast. Rep. from School of Ocean Sciences, Univ. Wales, Bangor, Wales, for Chevron UK Ltd, Repsol Explor. (UK) Ltd, and Aran Energy Explor. Ltd. 20 p.
Goold, J.C. and R.F.W. Coates. 2006. Near source, high frequency air-gun signatures. Paper SC/58/E30 presented to the IWC Scient. Commit., IWC Annu. Meet., 1-13 June, St. Kitts.
Goold, J.C. and P.J. Fish. 1998. Broadband spectra of seismic survey air-gun emissions, with reference to dolphin auditory thresholds. J. Acoust. Soc. Am. 103(4):2177-2184.
Gordon, J., D. Gillespie, J. Potter, A. Frantzis, M.P. Simmonds, R. Swift, and D. Thompson. 2004. A review of the effects of seismic surveys on marine mammals. Mar. Technol. Soc. J. 37(4):16-34.
Gordon, J., R. Antunes, N. Jaquet and B. Würsig. 2006. An investigation of sperm whale headings and surface behaviour before, during and after seismic line changes in the Gulf of Mexico. Intern. Whal. Comm. Working Pap. SC/58/E45. 10 p.
Gosselin, J.-F. and J. Lawson. 2004. Distribution and abundance indices of marine mammals in the Gully and two adjacent canyons of the Scotian Shelf before and during nearby hydrocarbon seismic exploration programmes in April and July 2003. Res. Doc. 2004/133. Can. Sci. Advis. Secretariat, Fisheries & Oceans Canada. 24 p. Available at http://www.dfo-mpo.gc.ca/csas/Csas/DocREC/2004/RES2004_133_e.pdf
Gray, H. and K. Van Waerebeek. 2011. Postural instability and akinesia in a pantropical spotted dolphin, Stenella attenuata, in proximity to operating airguns of a geophysical seismic vessel. J. Nature Conserv. 19(6): 363-367.
Greene, C.R., Jr. 1997. Physical acoustics measurements. p. 3-1 to 3-63 In: W.J. Richardson (ed.), Northstar marine mammal monitoring program, 1996: marine mammal and acoustical monitoring of a seismic program in the Alaskan Beaufort Sea. LGL Rep. 2121-2. Rep. from LGL Ltd., King City, Ont., and Greeneridge Sciences Inc., Santa Barbara, CA, for BP Explor. (Alaska) Inc., Anchorage, AK, and Nat. Mar. Fish. Serv., Anchorage, AK, and Silver Spring, MD. 245 p.
Greene, C.R., Jr. and W.J. Richardson. 1988. Characteristics of marine seismic survey sounds in the Beaufort Sea. J. Acoust. Soc. Am. 83(6):2246-2254.
Greene, G.D., F.R. Engelhardt, and R.J. Paterson (eds.). 1985. Proceedings of the Workshop on Effects of Explosives Use in the Marine Environment, Jan. 1985, Halifax, NS. Tech. Rep. 5. Can. Oil & Gas Lands Admin., Environ. Prot. Branch, Ottawa, Ont.
Greene, C.R., Jr., N.S. Altman, and W.J. Richardson. 1999a. Bowhead whale calls. p. 6-1 to 6-23 In: W.J. Richardson (ed.), Marine mammal and acoustical monitoring of Western Geophysical's open-water seismic program in the Alaskan Beaufort Sea, 1998. LGL Rep. TA2230-3. Rep. from LGL Ltd., King City, Ont., and Greeneridge Sciences Inc., Santa Barbara, CA, for Western Geophysical, Houston, TX, and Nat. Mar. Fish. Serv., Anchorage, AK, and Silver Spring, MD. 390 p.
Greene, C.R., Jr., N.S. Altman and W.J. Richardson. 1999b. The influence of seismic survey sounds on bowhead whale calling rates. J. Acoust. Soc. Am. 106(4, Pt. 2):2280 (Abstract).
Guerra, M., A.M. Thode, S.B. Blackwell and M. Macrander. 2011. Quantifying seismic survey reverberation off the Alaskan North Slope. J. Acoust. Soc. Am. 130(5):3046-3058.

Appendix D: Airgun Sounds on Marine Mammals
Shelburne Basin 3-D Seismic Survey Environmental Assessment 38
Haley, B., and W.R. Koski. 2004. Marine mammal monitoring during Lamont-Doherty Earth Observatory’s seismic program in the Northwest Atlantic Ocean, July–August 2004. LGL Rep. TA2822-27. Rep. from LGL Ltd., King City, Ont., for Lamont-Doherty Earth Observatory, Columbia Univ., Palisades, NY, and Nat. Mar. Fish. Serv., Silver Spring, MD. November. 80 p.
Haley, B., J. Beland, D.S. Ireland, R. Rodrigues, and D.M. Savarese. 2010. Chukchi Sea vessel-based monitoring program. Chapter 3. In: D.W. Funk, D.S. Ireland, R. Rodrigues, and W.R. Koski (eds.), Joint monitoring program in the Chukchi and Beaufort Seas, open water seasons, 2006–2008. LGL Alaska Rep. P1050-2. Rep. from LGL Alaska Res. Assoc. Inc. (Anchorage, AK) et al. for Shell Offshore Inc., other Industry contributors, U.S. Nat. Mar. Fish. Serv., and U.S. Fish Wildl. Serv. 506 p.
Hannay, D.E., J, Delarue, and B. Martin. 2011. Effects of airgun sounds on Pacific walrus (Odobenus rosmarus divergens) calling behavior. p. 122 In: Abstr. 19th Bienn. Conf. Biol. Mar. Mamm., Tampa, FL, 27 Nov.–2 Dec. 2011. 344 p.
Hanser, S.F., L.R. Doyle, A.R. Szabo, F.A. Sharpe and B. McCowan. 2009. Bubble-net feeding humpback whales in Southeast Alaska change their vocalization patterns in the presence of moderate vessel noise. p. 105 In: Abstr. 18th Bienn. Conf. Biol. Mar. Mamm., Québec, Canada, Oct. 2009. 306 p.
Harris, R.E., G.W. Miller, and W.J. Richardson. 2001. Seal responses to airgun sounds during summer seismic surveys in the Alaskan Beaufort Sea. Mar. Mamm. Sci. 17:795-812.
Harris, R.E., [R.E.] T. Elliott, and R.A. Davis. 2007. Results of mitigation and monitoring program, Beaufort Span 2-D marine seismic program, open-water season 2006. LGL Rep. TA4319-1. Rep. from LGL Ltd., King City, Ont., for GX Technol. Corp., Houston, TX. 48 p.
Hauser, D.D.W., M Holst, and V.D. Moulton. 2008. Marine mammal and sea turtle monitoring during Lamont-Doherty Earth Observatory’s marine seismic program in the Eastern Tropical Pacific, April–August 2008. LGL Rep. TA4656/7-1. Rep. from LGL Ltd., King City., Ont., and St. John’s, Nfld, for Lamont-Doherty Earth Observatory of Columbia Univ., Palisades, NY, and Nat. Mar. Fish. Serv., Silver Spring, MD. 98 p.
HESS Team. 1999. High Energy Seismic Survey review process and interim operational guidelines for marine surveys offshore Southern California. Rep. from High Energy Seismic Survey Team for Calif. State Lands Commis. and Minerals Manage. Serv., Camarillo, CA. 39 p. + Appendices.
Available at www.mms.gov/omm/pacific/lease/fullhessrept.pdf
Hildebrand, J.A. 2005. Impacts of anthropogenic sound. p. 101-124 In: J.E. Reynolds, W.F. Perrin, R.R. Reeves, S. Montgomery, and T. Ragen (eds.), Marine Mammal Research: Conservation Beyond Crisis. Johns Hopkins Univ. Press, Baltimore, MD. 223 p.
Hogarth, W.T. 2002. Declaration of William T. Hogarth in opposition to plaintiff’s motion for temporary restraining order, 23 Oct. Civ. No. 02-05065-JL. U.S. District Court, Northern District of Calif., San Francisco Div.
Holst, M. and M.A. Smultea. 2008. Marine mammal and sea turtle monitoring during Lamont-Doherty Earth Observatory’s marine seismic program off Central America, February – April 2008. LGL Rep. TA4342-3. Rep. from LGL Ltd., King City, Ont., for Lamont-Doherty Earth Observatory of Columbia Univ., Palisades, NY, and Nat. Mar. Fish. Serv., Silver Spring, MD. 133 p.
Holst, M., M.A. Smultea, W.R. Koski, and B. Haley. 2005a. Marine mammal and sea turtle monitoring during Lamont-Doherty Earth Observatory’s marine seismic program off the Northern Yucatán Peninsula in the Southern Gulf of Mexico, January–February 2005. LGL Rep. TA2822-31. Rep. from LGL Ltd., King City, Ont., for Lamont-Doherty Earth Observatory of Columbia Univ., Palisades, NY, and Nat. Mar. Fish Serv., Silver Spring, MD.
Holst, M., M.A. Smultea, W.R. Koski, and B. Haley. 2005b. Marine mammal and sea turtle monitoring during Lamont-Doherty Earth Observatory’s marine seismic program in the Eastern Tropical Pacific Ocean off Central America, November–December 2004. LGL Rep. TA2822-30. Rep. from LGL Ltd., King City, Ont., for Lamont-Doherty Earth Observatory of Columbia Univ., Palisades, NY, and Nat. Mar. Fish. Serv., Silver Spring, MD.
Holst, M., W.J. Richardson, W.R. Koski, M.A. Smultea, B. Haley, M.W. Fitzgerald, and M. Rawson. 2006. Effects of large- and small-source seismic surveys on marine mammals and sea turtles. Eos, Trans. Am. Geophys. Union 87(36), Joint Assembly Suppl., Abstract OS42A-01. 23-26 May, Baltimore, MD.

Appendix D: Airgun Sounds on Marine Mammals
Shelburne Basin 3-D Seismic Survey Environmental Assessment 39
Holst, M., J. Beland, B. Mactavish, J. Nicolas, B. Hurley, B. Dawe, G. Caltavuturo, C. Fossati, and G. Pavan. 2011. Visual-acoustic survey of cetaceans during a seismic study near Taiwan, April–July 2009. p. 134 In: Abstr. 19th Bienn. Conf. Biol. Mar. Mamm., Tampa, FL, 27 Nov.–2 Dec. 2011. 344 p.
Holt, M.M., D.P. Noren, V. Veirs, C.K. Emmons, and S. Veirs. 2009. Speaking up: Killer whales (Orcinus orca) increase their call amplitude in response to vessel noise. J. Acoust. Soc. Am. 125(1):EL27-EL32.
Hooker, S.K., R.W. Baird, S. Al-Omari, S. Gowans, and H. Whitehead. 2001. Behavioral reactions of northern bottlenose whales (Hyperoodon ampullatus) to biopsy darting and tag attachment procedures. Fish. Bull. 99(2):303-308.
Hutchinson, D.R. and R.S. Detrick. 1984. Water gun vs. air gun: a comparison. Mar. Geophys. Res. 6(3):295-310.
IAGC. 2004. Further analysis of 2002 Abrolhos Bank, Brazil humpback whale strandings coincident with seismic surveys. Intern. Assoc. Geophys. Contractors, Houston, TX. 12 p.
Ireland, D., M. Holst, and W.R. Koski. 2005. Marine mammal monitoring during Lamont-Doherty Earth Observatory’s seismic program off the Aleutian Islands, Alaska, July-August 2005. LGL Rep. TA4089-3. Rep. from LGL Ltd., King City, Ont., for Lamont-Doherty Earth Observatory of Columbia Univ., Palisades, NY, and Nat. Mar. Fish. Serv., Silver Spring, MD. 67 p.
IWC. 2007. Report of the standing working group on environmental concerns. Annex K to Report of the Scientific Committee. J. Cetac. Res. Manage. 9(Suppl.):227-260.
Jefferson, T.A. and B.E. Curry. 1994. Review and evaluation of potential acoustic methods of reducing or eliminating marine mammal-fishery interactions. Rep. from the Mar. Mamm. Res. Progr., Texas A & M Univ., College Station, TX, for U.S. Mar. Mamm. Commis., Washington, DC. 59 p. NTIS PB95-100384.
Jepson, P.D., M. Arbelo, R. Deaville, I.A.P. Patterson, P. Castro, J.R. Baker, E. Degollada, H.M. Ross, P. Herráez, A.M. Pocknell, F. Rodríguez, F.E. Howie, A. Espinosa, R.J. Reid, J.R. Jaber, V. Martin, A.A. Cunningham, and A. Fernández. 2003. Gas-bubble lesions in stranded cetaceans. Nature 425(6958):575-576.
Jochens, A., D. Biggs, K. Benoit-Bird, D. Engelhaupt, J. Gordon, C. Hu, N. Jaquet, M. Johnson, R. Leben, B. Mate, P. Miller, J. Ortega-Ortiz, A. Thode, P. Tyack, and B. Würsig. 2008. Sperm whale seismic study in the Gulf of Mexico/Synthesis report. OCS Study MMS 2008-006. Rep. from Dep. Oceanogr., Texas A & M Univ., College Station, TX, for U.S. Minerals Manage. Serv., Gulf of Mexico OCS Reg., New Orleans, LA. 323 p.
Johnson, M.P. and P.L. Tyack. 2003. A digital acoustic recording tag for measuring the response of wild marine mammals to sound. IEEE J. Oceanic Eng. 28(1):3-12.
Johnson, S.R., W.J. Richardson, S.B. Yazvenko, S.A. Blokhin, G. Gailey, M.R. Jenkerson, S.K. Meier, H.R. Melton, M.W. Newcomer, A.S. Perlov, S.A. Rutenko, B. Würsig, C.R. Martin, and D.E. Egging. 2007. A western gray whale mitigation and monitoring program for a 3-D seismic survey, Sakhalin Island, Russia. Environ. Monit. Assessm. 134(1-3):1-19.
Kastak, D. and R.J. Schusterman. 1998. Low-frequency amphibious hearing in pinnipeds: methods, measurements, noise, and ecology. J. Acoust. Soc. Am. 103(4):2216-2228.
Kastak, D. and R.J. Schusterman. 1999. In-air and underwater hearing sensitivity of a northern elephant seal (Mirounga angustirostris). Can. J. Zool. 77(11):1751-1758.
Kastak, D., R.L. Schusterman, B.L. Southall, and C.J. Reichmuth. 1999. Underwater temporary threshold shift induced by octave-band noise in three species of pinnipeds. J. Acoust. Soc. Am. 106(2):1142-1148.
Kastak, D., B.L. Southall, R.J. Schusterman, and C. Reichmuth Kastak. 2005. Underwater temporary threshold shift in pinnipeds: effects of noise level and duration. J. Acoust. Soc. Am. 118(5):3154-3163.
Kastelein, R.A., P. Mosterd, B. van Santen, M. Hagedoorn, and D. de Haan. 2002. Underwater audiogram of a Pacific walrus (Odobenus rosmarus divergens) measured with narrow-band frequency-modulated signals. J. Acoust. Soc. Am. 112(5):2173-2182.
Kastelein, R.A., W.C. Verboom, N. Jennings, and D. de Haan. 2008. Behavioral avoidance threshold level of a harbor porpoise (Phocoena phocoena) for a continuous 50 kHz pure tone (L). J. Acoust. Soc. Am. 123(4): 1858-1861.
Kastelein, R.A., P.J. Wensveen, L. Hoek, W.C. Verboom and J.M. Terhune. 2009. Underwater detection of tonal signals between 0.125 and 100 kHz by harbor seals (Phoca vitulina). J. Acoust. Soc. Am. 125(2):1222-1229.

Appendix D: Airgun Sounds on Marine Mammals
Shelburne Basin 3-D Seismic Survey Environmental Assessment 40
Kastelein, R., R. Gransier, R. van Mierlo, L. Hoek, and C. de Jong. 2011. Temporary hearing threshold shifts and recovery in a harbour porpoise (Phocoena phocoena) and harbour seals (Phoca vitulina) exposed to white noise in a 1/1-octave band around 4 kHz. J. Acoust. Soc. Am. 129(4):2432.
Kasuya, T. 1986. Distribution and behavior of Baird's beaked whales off the Pacific coast of Japan. Sci. Rep. Whales Res. Inst. 37:61-83.
Ketten, D.R. 1991. The marine mammal ear: specializations for aquatic audition and echolocation. p. 717-750 In: D. Webster, R. Fay and A. Popper (eds.), The Biology of Hearing. Springer-Verlag, Berlin.
Ketten, D.R. 1992. The cetacean ear: form, frequency, and evolution. p. 53-75 In: J.A. Thomas, R.A. Kastelein, and A. Ya Supin (eds.), Marine Mammal Sensory Systems. Plenum, New York, NY.
Ketten, D.R. 1994. Functional analysis of whale ears: adaptations for underwater hearing. IEEE Proc. Underwater Acoust. 1:264-270.
Ketten, D.R. 1995. Estimates of blast injury and acoustic trauma zones for marine mammals from underwater explosions. p. 391-407 In: R.A. Kastelein, J.A. Thomas, and P.E. Nachtigall (eds.), Sensory Systems of Aquatic Mammals. De Spil Publishers, Woerden, Netherlands. 588 p.
Ketten, D.R. 1998. Marine mammal auditory systems: a summary of audiometric and anatomical data and its implications for underwater acoustic impacts. NOAA Tech. Memo. NOAA-TM-NMFS-SWFSC-256. Southwest Fisheries Sci. Cent., La Jolla, CA. 74 p.
Ketten, D.R. 2000. Cetacean ears. p. 43-108 In: W.W.L. Au, A.N. Popper, and R.R. Fay (eds.), Hearing by Whales and Dolphins. Springer-Verlag, New York, NY. 485 p.
Ketten, D.R. 2012. Marine mammal auditory system noise impacts: evidence and incidence. p. 207-212 In: A.N. Popper and A. Hawkins (eds.), The effects of noise on aquatic life. Springer, New York. 695 p.
Ketten, D.R., J. Lien and S. Todd. 1993. Blast injury in humpback whale ears: evidence and implications. J. Acoust. Soc. Am. 94(3, Pt. 2):1849-1850 (Abstract).
Ketten, D.R., J. O'Malley, P.W.B. Moore, S. Ridgway, and C. Merigo. 2001. Aging, injury, disease, and noise in marine mammal ears. J. Acoust. Soc. Am. 110(5, Pt. 2):2721 (Abstract).
Klima, E.F., G.R. Gitschlag, and M.L. Renaud. 1988. Impacts of the explosive removal of offshore petroleum platforms on sea turtles and dolphins. Mar. Fish. Rev. 50(3):33-42.
Koski, W.R., D.W. Funk, D.S. Ireland, C. Lyons, K. Christie, A.M. Macrander and S.B. Blackwell. 2009. An update on feeding by bowhead whales near an offshore seismic survey in the central Beaufort Sea. Intern. Whal. Comm. Working Pap. SC/61/BRG3. 15 p.
Koski, W.R., J.R. Brandon, D.S. Ireland, D. Funk, A.M. Macrander, and S.B. Blackwell. 2011. Aerial sighting distributions of bowhead whales in the central Beaufort Sea relative to seismic activity during 2007, 2008 and 2010. p. 162 In: Abstr. 19th Bienn. Conf. Biol. Mar. Mamm., Tampa, FL, 27 Nov. –2 Dec. 2011. 344 p.
Kraus, S., A. Read, A. Solov, K. Baldwin, T. Spradlin, E. Anderson, and J. Williamson. 1997. Acoustic alarms reduce porpoise mortality. Nature 388(6642):525.
Kryter, K.D. 1985. The Effects of Noise on Man. 2nd ed. Academic Press, Orlando, FL. 688 p.
Kryter, K.D. 1994. The Handbook of Hearing and the Effects of Noise. Academic Press, Orlando, FL. 673 p.
Laurinolli, M.H. and N.A. Cochrane. 2005. Hydroacoustic analysis of marine mammal vocalization data from ocean bottom seismometer mounted hydrophones in the Gully. p. 89-95 In: K. Lee, H. Bain and G.V. Hurley (eds.), Acoustic monitoring and marine mammal surveys in The Gully and Outer Scotian Shelf before and during active seismic surveys. Environ. Stud. Res. Funds Rep. 151. 154 p. Published 2007.
Laws, R. 2012. Cetacean hearing-damage zones around a seismic source. p. 473-476 In: A.N. Popper and A. Hawkins (eds.), The effects of noise on aquatic life. Springer, New York, NY. 695 p.
Le Prell, C.G. 2012. Noise-induced hearing loss: from animal models to human trials. p. 191-195 In: A.N. Popper and A. Hawkins (eds.), The effects of noise on aquatic life. Springer, New York, NY. 695 p.

Appendix D: Airgun Sounds on Marine Mammals
Shelburne Basin 3-D Seismic Survey Environmental Assessment 41
Lesage, V., C. Barrette, M.C.S. Kingsley, and B. Sjare. 1999. The effect of vessel noise on the vocal behavior of belugas in the St. Lawrence River estuary, Canada. Mar. Mamm. Sci. 15(1):65-84.
Ljungblad, D.K., B. Würsig, S.L. Swartz, and J.M. Keene. 1988. Observations on the behavioral responses of bowhead whales (Balaena mysticetus) to active geophysical vessels in the Alaskan Beaufort Sea. Arctic 41(3):183-194.
Lucke, K., U. Siebert, P.A. Lepper and M.-A. Blanchet. 2009. Temporary shift in masked hearing thresholds in a harbor porpoise (Phocoena phocoena) after exposure to seismic airgun stimuli. J. Acoust. Soc. Am. 125(6):4060-4070.
Lusseau, D. and L. Bejder. 2007. The long-term consequences of short-term responses to disturbance experience from whalewatching impact assessment. Intern. J. Compar. Psychol. 20(2-3):228-236.
MacGillivray, A.O. and D. Hannay. 2007a. Summary of noise assessment. p. 3-1 to 3-21 In: Marine mammal monitoring and mitigation during open water seismic exploration by ConocoPhillips Alaska, Inc., in the Chukchi Sea, July-October 2006. LGL Rep. P903-2 (Jan. 2007). Rep. from LGL Alaska Res. Assoc. Inc., Anchorage, AK, and JASCO Res. Ltd., Victoria, B.C., for ConocoPhillips Alaska Inc., Anchorage, AK, and Nat. Mar. Fish. Serv., Silver Spring, MD. 116 p.
MacGillivray, A. and D. Hannay. 2007b. Field measurements of airgun array sound levels. p. 4-1 to 4-19 In: Marine mammal monitoring and mitigation during open water seismic exploration by GX Technology in the Chukchi Sea, October-November 2006: 90-day report. LGL Rep. P891-1 (Feb. 2007). Rep. from LGL Alaska Res. Assoc. Inc., Anchorage, AK, and JASCO Res. Ltd., Victoria, B.C., for GX Technology, Houston, TX, and Nat. Mar. Fish. Serv., Silver Spring, MD. 118 p.
MacLean, S.A. and B. Haley. 2004. Marine mammal monitoring during Lamont-Doherty Earth Observatory's seismic study in the Støregga Slide area of the Norwegian Sea, August–September 2003. LGL Rep. TA2822-20. Rep. from LGL Ltd., King City, Ont., for Lamont-Doherty Earth Observatory of Columbia Univ., Palisades, NY, and Nat. Mar. Fish. Serv., Silver Spring, MD. 59 p.
MacLean, S.A. and W.R. Koski. 2005. Marine mammal monitoring during Lamont-Doherty Earth Observatory’s seismic program in the Gulf of Alaska, August–September 2004. LGL Rep. TA2822-28. Rep. from LGL Ltd., King City, Ont., for Lamont-Doherty Earth Observatory of Columbia Univ., Palisades, NY, and Nat. Mar. Fish. Serv., Silver Spring, MD. 102 p.
Madsen, P.T. 2005. Marine mammals and noise: problems with root mean square sound pressure levels for transients. J. Acoust. Soc. Am. 117(6):3952-3957.
Madsen, P.T., B. Mohl, B.K. Nielsen, and M. Wahlberg. 2002. Male sperm whale behavior during exposures to distant seismic survey pulses. Aquat. Mamm. 28(3):231-240.
Madsen, P.T., M. Johnson, P.J.O. Miller, N. Aguilar de Soto, J. Lynch, and P.L. Tyack. 2006. Quantitative measures of air gun pulses recorded on sperm whales (Physeter macrocephalus) using acoustic tags during controlled exposure experiments. J. Acoust. Soc. Am. 120(4):2366–2379.
Malakoff, D. 2002. Suit ties whale deaths to research cruise. Science 298(5594):722-723.
Malme, C.I. and P.R. Miles. 1985. Behavioral responses of marine mammals (gray whales) to seismic discharges. p. 253-280 In: G.D. Greene, F.R. Engelhard, and R.J. Paterson (eds.), Proc. Workshop on Effects of Explosives Use in the Marine Environment, Jan. 1985, Halifax, NS. Tech. Rep. 5. Can. Oil & Gas Lands Admin., Environ. Prot. Br., Ottawa, Ont. 398 p.
Malme, C.I., P.R. Miles, C.W. Clark, P. Tyack, and J.E. Bird. 1984. Investigations of the potential effects of underwater noise from petroleum industry activities on migrating gray whale behavior/Phase II: January 1984 migration. BBN Rep. 5586. Rep. from Bolt Beranek & Newman Inc., Cambridge, MA, for MMS, Alaska OCS Region, Anchorage, AK. NTIS PB86-218377.
Malme, C.I., P.R. Miles, P. Tyack, C.W. Clark, and J.E. Bird. 1985. Investigation of the potential effects of underwater noise from petroleum industry activities on feeding humpback whale behavior. BBN Rep. 5851; OCS Study MMS 85-0019. Rep. from BBN Labs Inc., Cambridge, MA, for MMS, Anchorage, AK. NTIS PB86-218385.
Malme, C.I., B. Würsig, J.E. Bird, and P. Tyack. 1986. Behavioral responses of gray whales to industrial noise: feeding observations and predictive modeling. BBN Rep. 6265. OCS Study MMS 88-0048. Outer Contin. Shelf Environ. Assess. Progr., Final Rep. Princ. Invest., NOAA, Anchorage 56(1988): 393-600. NTIS PB88-249008.

Appendix D: Airgun Sounds on Marine Mammals
Shelburne Basin 3-D Seismic Survey Environmental Assessment 42
Malme, C.I., B. Würsig, B., J.E. Bird, and P. Tyack. 1988. Observations of feeding gray whale responses to controlled industrial noise exposure. p. 55-73 In: W.M. Sackinger, M.O. Jeffries, J.L. Imm, and S.D. Treacy (eds.), Port and Ocean Engineering Under Arctic Conditions. Vol. II. Symposium on Noise and Marine Mammals. Univ. Alaska Fairbanks, Fairbanks, AK. 111 p.
Manly, B.F.J., V.D. Moulton, R.E. Elliott, G.W. Miller and W.J. Richardson. 2007. Analysis of covariance of fall migrations of bowhead whales in relation to human activities and environmental factors, Alaskan Beaufort Sea: Phase I, 1996-1998. LGL Rep. TA2799-2; OCS Study MMS 2005-033. Rep. from LGL Ltd., King City, Ont., and WEST Inc., Cheyenne, WY, for U.S. Minerals Manage. Serv., Herndon, VA, and Anchorage, AK. 128 p.
Mate, B.R. and J.T. Harvey. 1987. Acoustical deterrents in marine mammal conflicts with fisheries. ORESU-W-86-001. Oregon State Univ., Sea Grant Coll. Prog., Corvallis, OR. 116 p.
Mate, B.R., K.M. Stafford, and D.K. Ljungblad. 1994. A change in sperm whale (Physeter macrocephalus) distribution correlated to seismic surveys in the Gulf of Mexico. J. Acoust. Soc. Am. 96(5, Pt. 2):3268-3269 (Abstract).
McAlpine, D.F. 2002. Pygmy and dwarf sperm whales. p. 1007-1009 In: W.F. Perrin, B. Würsig, and J.G.M. Thewissen (eds.), Encyclopedia of Marine Mammals. Academic Press, San Diego, CA. 1414 p.
McCall Howard, M.P. 1999. Sperm whales Physeter macrocephalus in the Gully, Nova Scotia: Population, distribution, and response to seismic surveying. B.Sc. (Honours) Thesis. Dalhousie Univ., Halifax, NS.
McCauley, R.D., M.-N. Jenner, C. Jenner, K.A. McCabe, and J. Murdoch. 1998. The response of humpback whales (Megaptera novaeangliae) to offshore seismic survey noise: preliminary results of observations about a working seismic vessel and experimental exposures. APPEA J. 38:692-707.
McCauley, R.D., J. Fewtrell, A.J. Duncan, C. Jenner, M.-N. Jenner, J.D. Penrose, R.I.T. Prince, A. Adhitya, J. Murdoch, and K. McCabe. 2000a. Marine seismic surveys: Analysis of airgun signals; and effects of air gun exposure on humpback whales, sea turtles, fishes and squid. Rep. from Centre for Marine Science and Technology, Curtin Univ., Perth, Western Australia, for Australian Petrol. Produc. & Explor. Association, Sydney, NSW. 188 p.
McCauley, R.D., J. Fewtrell, A.J. Duncan, M.-N. Jenner, M-N., C. Jenner, R.I.T. Prince, A. Adhitya, K. McCabe and J. Murdoch. 2000b. Marine seismic surveys – a study of environmental implications. APPEA J. 40: 692-708.
McDonald, M.A., J.A. Hildebrand, and S.C. Webb. 1995. Blue and fin whales observed on a seafloor array in the Northeast Pacific. J. Acoust. Soc. Am. 98(2, Pt. 1):712-721.
McDonald, T.L., W.J. Richardson, K.H. Kim, and S.B. Blackwell. 2010. Distribution of calling bowhead whales exposed to underwater sounds from Northstar and distant seismic surveys, 2009. p. 6-1 to 6-38 In: W.J. Richardson (ed.), Monitoring of industrial sounds, seals, and bowhead whales near BP's Northstar oil development, Alaskan Beaufort Sea: Comprehensive report for 2005–2009. LGL Rep. P1133-6. Rep. from LGL Alaska Res. Assoc. Inc. (Anchorage, AK), Greeneridge Sciences Inc. (Santa Barbara, CA), WEST Inc. (Cheyenne, WY) and Applied Sociocult. Res. (Anchorage, AK) for BP Explor. (Alaska) Inc., Anchorage, AK. 265 p.
McDonald, T.L., W.J. Richardson, K.H. Kim, S.B. Blackwell, and B. Streever. 2011. Distribution of calling bowhead whales exposed to multiple anthropogenic sound sources and comments on analytical methods. p. 199 In: Abstr. 19th Bienn. Conf. Biol. Mar. Mamm., Tampa, FL, 27 Nov.–2 Dec. 2011. 344 p.
Meier, S.K., S.B. Yazvenko, S.A. Blokhin, P. Wainwright, M.K. Maminov, Y.M. Yakovlev, and M.W. Newcomer. 2007. Distribution and abundance of western gray whales off northeastern Sakhalin Island, Russia, 2001-2003. Environ. Monit. Assessm. 134(1-3):107-136.
Miller, G.W., R.E. Elliott, W.R. Koski, V.D. Moulton, and W.J. Richardson. 1999. Whales. p. 5-1 to 5-109 In: W.J. Richardson (ed.), Marine mammal and acoustical monitoring of Western Geophysical's open-water seismic program in the Alaskan Beaufort Sea, 1998. LGL Rep. TA2230-3. Rep. from LGL Ltd., King City, Ont., and Greeneridge Sciences Inc., Santa Barbara, CA, for Western Geophysical, Houston, TX, and Nat. Mar. Fish. Serv., Anchorage, AK, and Silver Spring, MD. 390 p.
Miller, G.W., V.D. Moulton, R.A. Davis, M. Holst, P. Millman, A. MacGillivray, and D. Hannay. 2005. Monitoring seismic effects on marine mammals—southeastern Beaufort Sea, 2001-2002. p. 511-542 In: S.L. Armsworthy, P.J. Cranford, and K. Lee (eds.), Offshore Oil and Gas Environmental Effects Monitoring/Approaches and Technologies. Battelle Press, Columbus, OH.
Appendix D: Airgun Sounds on Marine Mammals
Shelburne Basin 3-D Seismic Survey Environmental Assessment 43
Miller, P.J.O., M.P. Johnson, P.T. Madsen, N. Biassoni, M. Quero, and P.L. Tyack. 2009. Using at-sea experiments to study the effects of airguns on the foraging behavior of sperm whales in the Gulf of Mexico. Deep-Sea Res. I 56(7):1168-1181.
Mooney, T.A., P.E. Nachtigall, M. Breese, S. Vlachos, and W.W.L. Au. 2009a. Predicting temporary threshold shifts in a bottlenose dolphin (Tursiops truncatus): the effects of noise level and duration. J. Acoust. Soc. Am. 125(3):1816-1826.
Mooney, T.A., P.E. Nachtigall and S. Vlachos. 2009b. Sonar-induced temporary hearing loss in dolphins. Biol. Lett. 4(4):565-567.
Moore, S.E. and Angliss, R.P. 2006. Overview of planned seismic surveys offshore northern Alaska, July-October 2006. Paper SC/58/E6 presented to IWC Scient. Commit., IWC Annu. Meet., 1-13 June, St Kitts.
Morton A.B. and H.K. Symonds. 2002. Displacement of Orcinus orca (L.) by high amplitude sound in British Columbia, Canada. ICES J. Mar. Sci. 59(1):71-80
Moulton, V.D. and M. Holst. 2010. Effects of seismic survey sound on cetaceans in the Northwest Atlantic. Environ. Stud. Res. Funds Rep. 182. St. John’s, Nfld. 28 p. Accessed at http://www.esrfunds.org/pdf/182.pdf in February 2012.
Moulton, V.D. and J.W. Lawson. 2002. Seals, 2001. p. 3-1 to 3-48 In: W.J. Richardson (ed.), Marine mammal and acoustical monitoring of WesternGeco’s open water seismic program in the Alaskan Beaufort Sea, 2001. LGL Rep. TA2564-4. Rep. from LGL Ltd., King City, Ont., and Greeneridge Sciences Inc., Santa Barbara, CA, for WesternGeco, Houston, TX, and Nat. Mar. Fish. Serv., Anchorage, AK, and Silver Spring, MD. 95 p.
Moulton, V.D. and G.W. Miller. 2005. Marine mammal monitoring of a seismic survey on the Scotian Slope, 2003. p. 29-40 In: K. Lee, H. Bain, and G.V. Hurley (eds.), Acoustic monitoring and marine mammal surveys in the Gully and outer Scotian Shelf before and during active seismic programs. Environ. Stud. Res. Funds Rep. 151. 154 p (Published 2007).
Nachtigall, P.E., J.L. Pawloski, and W.W.L. Au. 2003. Temporary threshold shifts and recovery following noise exposure in the Atlantic bottlenose dolphin (Tursiops truncatus). J. Acoust. Soc. Am. 113(6):3425-3429.
Nachtigall, P.E., A.Y. Supin, J. Pawloski, and W.W.L. Au. 2004. Temporary threshold shifts after noise exposure in the bottlenose dolphin (Tursiops truncatus) measured using evoked auditory potentials. Mar. Mamm. Sci. 20(4):673-687
Nations, C.S., S.B. Blackwell, K.H. Kim, A.M. Thode, C.R. Greene Jr., A.M. Macrander, and T.L. McDonald. 2009. Effects of seismic exploration in the Beaufort Sea on bowhead whale call distributions. J. Acoust. Soc. Am. 126(4, Pt. 2):2230 (Abstract).
Nieukirk, S.L., K.M. Stafford, D.K. Mellinger, R.P. Dziak, and C.G. Fox. 2004. Low-frequency whale and seismic airgun sounds recorded in the mid-Atlantic Ocean. J. Acoust. Soc. Am. 115(4):1832-1843.
Nieukirk, S.L., D.K. Mellinger, J.A. Hildebrand, M.A. McDonald, and R.P. Dziak. 2005. Downward shift in the frequency of blue whale vocalizations. p. 205 In: Abstr. 16th Bienn. Conf. Biol. Mar. Mamm., San Diego, CA, 12-16 Dec. 2005.
Nieukirk, S.L., D.K. Mellinger, S.E. Moore, K. Klinck, R.P. Dziak and J. Goslin. 2012. Sounds from airguns and fin whales recorded in the mid-Atlantic Ocean, 1999-2009. J. Acoust. Soc. Am. 131(2):1102-1112.
Nieukirk, S.L., S.L. Heimlich, S.E. Moore, K.M. Stafford, R.P. Dziak, M. Fowler, J. Haxel, J. Goslin and D.K. Mellinger. 2009. Whales and airguns: an eight-year acoustic study in the central North Atlantic. p. 181-182 In: Abstr. 18th Bienn. Conf. Biol. Mar. Mamm., Québec, Oct. 2009. 306 p.
Nieukirk, S.L., H. Klinck, K. Klinck, D.K. Melllinger, and R.P. Dziak. 2011. Seismic airgun sounds and whale vocalizations recorded in the Fram Strait and Greenland Sea. p. 218 In: Abstr. 19th Bienn. Conf. Biol. Mar. Mamm., Tampa, FL, 27 Nov.–2 Dec. 2011. 344 p.
NMFS. 1995. Small takes of marine mammals incidental to specified activities; offshore seismic activities in southern California. Fed. Regist. 60(200):53753-53760.
NMFS. 2000. Small takes of marine mammals incidental to specified activities; marine seismic-reflection data collection in southern California. Fed. Regist. 65(20):16374-16379.

Appendix D: Airgun Sounds on Marine Mammals
Shelburne Basin 3-D Seismic Survey Environmental Assessment 44
NMFS. 2001. Small takes of marine mammals incidental to specified activities; oil and gas exploration drilling activities in the Beaufort Sea/Notice of issuance of an incidental harassment authorization. Fed. Regist. 66(26):9291-9298.
NMFS. 2005. Endangered Fish and Wildlife; Notice of Intent to Prepare an Environmental Impact Statement. Fed. Regist. 70(7):1871-1875.
NOAA and U.S. Navy. 2001. Joint interim report: Bahamas marine mammal stranding event of 15-16 March 2000. Nat. Mar. Fish. Serv., Silver Spring, MD, and Assistant Secretary of the Navy, Installations & Environ., Washington, DC. 61 p. Available at http://www.nmfs.noaa.gov/pr/acoustics/reports.htm
Nowacek, D.P., L.H. Thorne, D.W. Johnston, and P.L. Tyack. 2007. Responses of cetaceans to anthropogenic noise. Mammal Rev. 37(2):81-115.
NRC. 2005. Marine Mammal Populations and Ocean Noise: Determining When Noise Causes Biologically Significant Effects. U. S. Nat. Res. Counc., Ocean Studies Board. (Authors D.W. Wartzok, J. Altmann, W. Au, K. Ralls, A. Starfield, and P.L. Tyack). Nat. Acad. Press, Washington, DC. 126 p.
Pacini, A.F., P.E. Nachtigall, C.T. Quintos, T.D. Schofield, D.A. Look, G.A. Levine, and J.P.Turner. 2011. Audiogram of a stranded Blainville’s beaked whale (Mesoplodon densirostris) measured using auditory evoked potentials. J. Exp. Biol. 214(14):2409-2415.
Parente, C.L., M.C.C. Marcondes, and M.H. Engel. 2006. Humpback whale strandings and seismic surveys in Brazil from 1999 to 2004. Intern. Whal. Commis. Working Pap. SC/58/E41. 16 p.
Parente, C.L., J.P. de Araújo and M.E. de Araújo. 2007. Diversity of cetaceans as tool in monitoring environmental impacts of seismic surveys. Biota Neotrop. 7(1):1-7.
Parks, S.E., C.W. Clark, and P.L. Tyack. 2007a. Short- and long-term changes in right whale calling behavior: the potential effects of noise on acoustic communication. J. Acoust. Soc. Am. 122(6):3725-3731.
Parks, S.E., D.R. Ketten, J.T. O'Malley and J. Arruda. 2007b. Anatomical predictions of hearing in the North Atlantic right whale. Anat. Rec. 290(6):734-744.
Parks, S.E., I. Urazghildiiev and C.W. Clark. 2009. Variability in ambient noise levels and call parameters of North Atlantic right whales in three habitat areas. J. Acoust. Soc. Am. 125(2):1230-1239.
Parks, S.E. M. Johnson, D. Nowacek, and P.L. Tyack. 2011. Individual right whales call louder in increased environmental noise. Biol. Lett. 7(1):33-35.
Popov, V.V., A.Y. Supin, D. Wang, K. Wang, L. Dong, and S. Wang. 2011. Noise-induced temporary threshold shift and recovery in Yangtze finless porpoises Neophocaena phocaenoides asiaeorientalis. J. Acoust. Soc. Am. 130(1):574-584.
Potter, J.R., M. Thillet, C. Douglas, M.A. Chitre, Z. Doborzynski, and P.J. Seekings. 2007. Visual and passive acoustic marine mammal observations and high-frequency seismic source characteristics recorded during a seismic survey. IEEE J. Oceanic Eng. 32(2):469-483.
Reeves, R.R. 1992. Whale responses to anthropogenic sounds: A literature review. Sci. & Res. Ser. 47. New Zealand Dep. Conserv., Wellington. 47 p.
Reeves, R.R., E. Mitchell, and H. Whitehead. 1993. Status of the northern bottlenose whale, Hyperoodon ampullatus. Can. Field-Nat. 107(4):490-508.
Reeves, R.R., R.J. Hofman, G.K. Silber, and D. Wilkinson. 1996. Acoustic deterrence of harmful marine mammal-fishery interactions: proceedings of a workshop held in Seattle, Washington, 20-22 March 1996. NOAA Tech. Memo. NMFS-OPR-10. Nat. Mar. Fish. Serv., Northwest Fisheries Sci. Cent., Seattle, WA. 70 p.
Richardson, W.J. and C.I. Malme. 1993. Man-made noise and behavioral responses. p. 631-700 In: J.J. Burns, J.J. Montague, and C.J. Cowles (eds.), The Bowhead Whale. Spec. Publ. 2, Soc. Mar. Mammal., Lawrence, KS. 787 p.
Richardson, W.J. and B. Würsig. 1997. Influences of man-made noise and other human actions on cetacean behaviour. Mar. Freshw. Behav. Physiol. 29(1-4):183-209.
Richardson, W.J., B. Würsig, and C.R. Greene. 1986. Reactions of bowhead whales, Balaena mysticetus, to seismic exploration in the Canadian Beaufort Sea. J. Acoust. Soc. Am. 79(4):1117-1128.

Appendix D: Airgun Sounds on Marine Mammals
Shelburne Basin 3-D Seismic Survey Environmental Assessment 45
Richardson, W.J., R.A. Davis, C.R. Evans, D.K. Ljungblad, and P. Norton. 1987. Summer distribution of bowhead whales, Balaena mysticetus, relative to oil industry activities in the Canadian Beaufort Sea, 1980-84. Arctic 40(2):93-104.
Richardson, W.J., C.R. Greene, Jr., C.I. Malme, and D.H. Thomson. 1995. Marine mammals and noise. Academic Press, San Diego, CA. 576 p.
Richardson, W.J., G.W. Miller, and C.R. Greene, Jr. 1999. Displacement of migrating bowhead whales by sounds from seismic surveys in shallow waters of the Beaufort Sea. J. Acoust. Soc. Am. 106(4, Pt. 2):2281 (Abstract).
Richardson, W.J., M. Holst, W.R. Koski and M. Cummings. 2009. Responses of cetaceans to large-source seismic surveys by Lamont-Doherty Earth Observatory. p. 213 In: Abstr. 18th Bienn. Conf. Biol. Mar. Mamm., Québec, Oct. 2009. 306 p.
Robertson, F.C., W.R. Koski, T.A. Thomas, W.J. Richardson, and A.W. Trites, 2011. Exposure to seismic operations affects bowhead behavior and sightability in the Alaskan Arctic. p. 254 In: Abstr. 19th Bienn. Conf. Biol. Mar. Mamm., Tampa, FL, 27 Nov.–2 Dec. 2011. 344 p.
Romano, T.A., M.J. Keogh, C.Kelly, P. Feng, L. Berk, C.E. Schlundt, D.A. Carder, and J.J. Finneran. 2004. Anthropogenic sound and marine mammal health: measures of the nervous and immune systems before and after intense sound exposure. Can. J. Fish. Aquat. Sci. 61(7):1124-1134.
SACLANT. 1998. Estimation of cetacean hearing criteria levels. Section II, Chapter 7 In: SACLANTCEN Bioacoustics Panel Summary Record and Report. Rep. from NATO Undersea Res. Center. Available at http://enterprise.spawar.navy.mil/nepa/whales/pdf/doc2-7.pdf
Savarese, D.M., C.M. Reiser, D.S. Ireland, and R. Rodrigues. 2010. Beaufort Sea vessel-based monitoring program. Chapter 6 In: D.W. Funk, D.S. Ireland, R. Rodrigues, and W.R. Koski (eds.), Joint monitoring program in the Chukchi and Beaufort Seas, open water seasons, 2006-2008. LGL Alaska Rep. P1050-2. Rep. from LGL Alaska Res. Assoc. Inc. (Anchorage, AK) et al. for Shell Offshore Inc., other Industry contributors, U.S. Nat. Mar. Fish. Serv., and U.S. Fish Wildl. Serv. 506 p.
Scheifele, P.M., S. Andrew, R.A. Cooper, M. Darre, F.E. Musiek, and L. Max. 2005. Indication of a Lombard vocal response in the St. Lawrence River beluga. J. Acoust. Soc. Am. 117(3, Pt. 1):1486-1492.
Schlundt, C.E., J.J. Finneran, D.A. Carder, and S.H. Ridgway. 2000. Temporary shift in masking hearing thresholds of bottlenose dolphins, Tursiops truncatus, and white whales, Delphinapterus leucas, after exposure to intense tones. J. Acoust. Soc. Am. 107(6):3496-3508.
Scholik-Schlomer, A.R. 2012. Status of NOAA’s guidelines for assessing impacts of anthropogenic sound on marine life. p. 557-561 In: A.N. Popper and A. Hawkins (eds.), The effects of noise on aquatic life. Springer, New York, NY. 695 p.
Simard, Y., F. Samaran and N. Roy. 2005. Measurement of whale and seismic sounds in the Scotian Gully and adjacent canyons in July 2003. p. 97-115 In: K. Lee, H. Bain and C.V. Hurley (eds.), Acoustic monitoring and marine mammal surveys in The Gully and Outer Scotian Shelf before and during active seismic surveys. Environ. Stud. Res. Funds Rep. 151. 154 p (Published 2007).
Simmonds, M. P. and L.F. Lopez-Jurado. 1991. Whales and the military. Nature 351(6326):448.
Smultea, M.A. and M. Holst. 2008. Marine mammal monitoring during a University of Texas Institute for Geophysics seismic survey in the Northeast Pacific Ocean, July 2008. LGL Rep. TA4584-2. Rep. from LGL Ltd., King City, Ont., for Lamont-Doherty Earth Observatory of Columbia Univ., Palisades, NY, and Nat. Mar. Fish. Serv., Silver Spring, MD. 80 p.
Smultea, M.A., M. Holst, W.R. Koski, and S. Stoltz. 2004. Marine mammal monitoring during Lamont-Doherty Earth Observatory's seismic program in the Southeast Caribbean Sea and adjacent Atlantic Ocean, April-June 2004. LGL Rep. TA2822-26. Rep. from LGL Ltd., King City, Ont., for Lamont-Doherty Earth Observatory of Columbia Univ., Palisades, NY, and Nat. Mar. Fish. Serv., Silver Spring, MD. 106 p.
Sodal, A. 1999. Measured underwater acoustic wave propagation from a seismic source. Proc. Airgun Environmental Workshop, 6 July, London, UK.

Appendix D: Airgun Sounds on Marine Mammals
Shelburne Basin 3-D Seismic Survey Environmental Assessment 46
Southall, B.L., A.E. Bowles, W.T. Ellison, J.J. Finneran, R.L. Gentry, C.R. Greene Jr., D. Kastak, D.R. Ketten, J.H. Miller, P.E. Nachtigall, W.J. Richardson, J.A. Thomas, and P.L. Tyack. 2007. Marine mammal noise exposure criteria: initial scientific recommendations. Aquat. Mamm. 33(4):411-522.
Stone, C.J. 2003. The effects of seismic activity on marine mammals in UK waters 1998-2000. JNCC Rep. 323. Joint Nature Conserv. Commit., Aberdeen, Scotland. 43 p.
Stone, C.J. and M.L. Tasker. 2006. The effects of seismic airguns on cetaceans in UK waters. J. Cetac. Res. Manage. 8(3):255-263.
Terhune, J.M. 1999. Pitch separation as a possible jamming-avoidance mechanism in underwater calls of bearded seals (Erignathus barbatus). Can. J. Zool. 77(7):1025-1034.
Thomas, J.A., R.A. Kastelein and F.T. Awbrey. 1990. Behavior and blood catecholamines of captive belugas during playbacks of noise from an oil drilling platform. Zoo Biol. 9(5):393-402.
Thompson, D., M. Sjöberg, E.B. Bryant, P. Lovell, and A. Bjørge. 1998. Behavioural and physiological responses of harbour (Phoca vitulina) and grey (Halichoerus grypus) seals to seismic surveys. p. 134 In: Abstr. 12th Bienn . Conf. and World Mar. Mamm. Sci. Conf., 20-25 Jan., Monte Carlo, Monaco. 160 p.
Thomson, D.H. and W.J. Richardson. 1995. Marine mammal sounds. p. 159-204 In: W.J. Richardson, C.R. Greene, Jr., C.I. Malme, and D.H. Thomson. Marine Mammals and Noise. Academic Press, San Diego, CA. 576 p.
Tolstoy, M., J. Diebold, S. Webb, D. Bohnenstiehl, and E. Chapp. 2004a. Acoustic calibration measurements. Chapter 3 In: W.J. Richardson (ed.), Marine mammal and acoustic monitoring during Lamont-Doherty Earth Observatory's acoustic calibration study in the northern Gulf of Mexico, 2003. Revised Rep. from LGL Ltd., King City, Ont., for Lamont-Doherty Earth Observatory, Palisades, NY, and Nat. Mar. Fish. Serv., Silver Spring, MD.
Tolstoy, M., J.B. Diebold, S.C. Webb, D.R. Bohenstiehl, E. Chapp, R.C. Holmes, and M. Rawson. 2004b. Broadband calibration of R/V Ewing seismic sources. Geophys. Res. Let. 31:L14310. doi: 10.1029/ 2004GL020234
Tolstoy, M., J. Diebold, L. Doermann, S. Nooner, S.C. Webb, D.R. Bohnenstiehl, T.J. Crone and R.C. Holmes. 2009. Broadband calibration of the R/V Marcus G. Langseth four-string seismic sources. Geochem. Geophys. Geosyst. 10(8):1-15. Q08011.
Tyack, P.L. 2008. Implications for marine mammals of large-scale changes in the marine acoustic environment. J. Mammal. 89(3):549-558.
Tyack, P.L. 2009. Human-generated sound and marine mammals. Phys. Today 62(11, Nov.):39-44.
Tyack, P., M. Johnson, and P. Miller. 2003. Tracking responses of sperm whales to experimental exposures of airguns. p. 115-120 In: A.E. Jochens and D.C. Biggs (eds.), Sperm whale seismic study in the Gulf of Mexico/Annual Report: Year 1. OCS Study MMS 2003-069. Rep. from Texas A&M Univ., College Station, TX, for U.S. Minerals Manage. Serv., Gulf of Mexico OCS Region, New Orleans, LA.
Tyack, P.L., M.P. Johnson, P.T. Madsen, P.J. Miller, and J. Lynch. 2006a. Biological significance of acoustic impacts on marine mammals: examples using an acoustic recording tag to define acoustic exposure of sperm whales, Physeter catodon, exposed to airgun sounds in controlled exposure experiments. Eos, Trans. Am. Geophys. Union 87(36), Joint Assembly Suppl., Abstract OS42A-02. 23-26 May, Baltimore, MD.
Tyack, P.L., M. Johnson, N. Aguilar Soto, A. Sturlese, and P.T. Madsen. 2006b. Extreme diving of beaked whales. J. Exp. Biol. 209(21):4238-4253.
Urick, R.J. 1983. Principles of Underwater Sound. 3rd ed. Peninsula Publ., Los Altos, CA. 423 p.
van der Woude, S. 2007. Assessing effects of an acoustic marine geophysical survey on the behaviour of bottlenose dolphins Tursiops truncatis. In: Abstr. 17th Bienn. Conf. Biol. Mar. Mamm., 29 Nov.–3 Dec., Cape Town, South Africa.
Wartzok, D., A.N. Popper, J. Gordon, and J. Merrill. 2004. Factors affecting the responses of marine mammals to acoustic disturbance. Mar. Technol. Soc. J. 37(4):6-15.
Watkins, W.A. 1977. Acoustic behavior of sperm whales. Oceanus 20(2):50-58.
Watkins, W.A. 1986. Whale reactions to human activities in Cape Cod waters. Mar. Mamm. Sci. 2(4):251-262.

Appendix D: Airgun Sounds on Marine Mammals
Shelburne Basin 3-D Seismic Survey Environmental Assessment 47
Watkins, W.A. and W.E. Schevill. 1975. Sperm whales (Physeter catodon) react to pingers. Deep-Sea Res. 22(3):123-129.
Watkins, W.A., K.E. Moore, and P. Tyack. 1985. Sperm whale acoustic behaviors in the southeast Caribbean. Cetology 49:1-15.
Weilgart, L.S. 2007. A brief review of known effects of noise on marine mammals. Intern. J. Comp. Psychol. 20:159-168.
Weir, C.R. 2008a. Overt responses of humpback whales (Megaptera novaeangliae), sperm whales (Physeter macro-cephalus), and Atlantic spotted dolphins (Stenella frontalis) to seismic exploration off Angola. Aquat. Mamm. 34(1):71-83.
Weir, C.R. 2008b. Short-finned pilot whales (Globicephala macrorhynchus) respond to an airgun ramp-up procedure off Gabon. Aquat. Mamm. 34(3):349-354.
Weller, D.W., Y.V. Ivashchenko, G.A. Tsidulko, A.M. Burdin, and R.L. Brownell, Jr. 2002. Influence of seismic surveys on western gray whales off Sakhalin Island, Russia in 2001. Paper SC/54/BRG14, IWC, Western Gray Whale Working Group Meet., 22-25 Oct., Ulsan, South Korea. 12 p.
Weller, D.W., S.H. Rickards, A.L. Bradford, A.M. Burdin, and R.L. Brownell, Jr. 2006a. The influence of 1997 seismic surveys on the behavior of western gray whales off Sakhalin Island, Russia. Paper SC/58/E4 presented to the IWC Scient. Commit., IWC Annu. Meet., 1-13 June, St. Kitts.
Weller, D.W., G.A. Tsidulko, Y.V. Ivashchenko, A.M. Burdin and R.L. Brownell Jr. 2006b. A re-evaluation of the influence of 2001 seismic surveys on western gray whales off Sakhalin Island, Russia. Paper SC/58/E5 presented to the IWC Scient. Commit., IWC Annu. Meet., 1-13 June, St. Kitts.
Wieting, D. 2004. Background on development and intended use of criteria. p. 20 In: S. Orenstein, L. Langstaff, L. Manning, and R. Maund (eds.), Advisory Committee on Acoustic Impacts on Marine Mammals, Final Meet. Summary. Second Meet., April 28-30, 2004, Arlington, VA. Sponsored by the Mar. Mamm. Commis., 10 Aug.
Winsor, M.H. and B.R. Mate. 2006. Seismic survey activity and the proximity of satellite tagged sperm whales. Intern. Whal. Comm. Working Pap. SC/58/E16. 8 p.
Wright, A.J. and S. Kuczaj. 2007. Noise-related stress and marine mammals: An Introduction. Intern. J. Comp. Psychol. 20(2-3):iii-viii.
Wright, A.J., N. Aguilar Soto, A.L. Baldwin, M. Bateson, C.M. Beale, C. Clark, T. Deak, E.F. Edwards, A. Fernández, A. Godinho, L.T. Hatch, A. Kakuschke, D. Lusseau, D. Martineau, L.M. Romero, L.S. Weilgart, B.A. Wintle, G. Notarbartolo-di-Sciara, and V. Martin. 2007a. Do marine mammals experience stress related to anthropogenic noise? Intern. J. Comp. Psychol. 20(2-3):274-316.
Wright, A.J., N. Aguilar Soto, A.L. Baldwin, M. Bateson, C.M. Beale, C. Clark, T. Deak, E.F. Edwards, A. Fernández, A. Godinho, L.T. Hatch, A. Kakuschke, D. Lusseau, D. Martineau, L.M. Romero, L.S. Weilgart, B.A. Wintle, G. Notarbartolo-di-Sciara and V. Martin. 2007b. Anthropogenic noise as a stressor in animals: A multidisciplinary perspective. Intern. J. Comp. Psychol. 20(2-3): 250-273.
Wright, A.J., T. Deak and E.C.M. Parsons. 2009. Concerns related to chronic stress in marine mammals. Intern. Whal. Comm. Working Pap. SC/61/E16. 7 p.
Wright, A.J., T. Deak, and E.C.M. Parsons. 2011. Size matters: management of stress responses and chronic stress in beaked whales and other marine mammals may require larger exclusion zones. Mar. Poll. Bull. 63(1-4):5-9.
Würsig, B., S.K. Lynn, T.A. Jefferson, and K.D. Mullin. 1998. Behaviour of cetaceans in the northern Gulf of Mexico relative to survey ships and aircraft. Aquat. Mamm. 24(1):41-50.
Würsig, B.G., D.W. Weller, A.M. Burdin, S.H. Reeve, A.L Bradford, S.A. Blokhin, and R.L Brownell, Jr. 1999. Gray whales summering off Sakhalin Island, Far East Russia: July-October 1997. A joint U.S.-Russian scientific investigation. Final Report. Rep. from Texas A&M Univ., College Station, TX, and Kamchatka Inst. Ecol. & Nature Manage., Russian Acad. Sci., Kamchatka, Russia, for Sakhalin Energy Investment Co. Ltd and Exxon Neftegaz Ltd, Yuzhno-Sakhalinsk, Russia. 101 p.

Appendix D: Airgun Sounds on Marine Mammals
Shelburne Basin 3-D Seismic Survey Environmental Assessment 48
WWF, IFAW Russia, Pacific Environment Sakhalin and Environment Watch. 2010. Preliminary results of the NGO monitoring of seismic geophysical explorations at the Lebedinskoye field, July-September 2010. Report to Western Gray Whales Advisory Panel (WGWAP), 9th Meeting, Intern. Union Conserv. Nature, Geneva, Switzerland, 4–6 Dec. 2010. 10 p.
Yazvenko, S.B., T.L. McDonald, S.A. Blokhin, S.R. Johnson, S.K. Meier, H.R. Melton, M.W. Newcomer, R.M. Nielson, V.L. Vladimirov, and P.W. Wainwright. 2007a. Distribution and abundance of western gray whales during a seismic survey near Sakhalin Island, Russia. Environ. Monit. Assessm. 134(1-3):45-73.
Yazvenko, S. B., T.L. McDonald, S.A. Blokhin, S.R. Johnson, H.R. Melton, and M.W. Newcomer. 2007b. Feeding activity of western gray whales during a seismic survey near Sakhalin Island, Russia. Environ. Monit. Assessm. 134(1-3):93-106.
Yoder, J.A. 2002. Declaration James A. Yoder in opposition to plaintiff’s motion for temporary restraining order, 28 October 2002. Civ. No. 02-05065-JL. U.S. District Court, Northern District of Calif., San Francisco Div.

Appendix E. Airgun Sounds on Sea Turtles
Shelburne Basin 3-D Seismic Survey Environmental Assessment 1
APPENDIX E:
REVIEW OF THE EFFECTS OF AIRGUN SOUNDS ON SEA TURTLES8
The following subsections review relevant information concerning the potential effects of airgun sounds on sea turtles. This information is included here as background. Much of this information has been included in varying formats in previous reviews, assessments, and regulatory applications prepared by LGL Limited.
1. Sea Turtle Hearing
Although there have been a limited number of studies on sea turtle hearing (see review by Southwood et al. 2008), the available data are not very comprehensive. However, these data demonstrate that sea turtles appear to be low-frequency specialists (see Table E-1).
Sea turtle auditory perception occurs through a combination of both bone and water conduction rather than air conduction (Lenhardt 1982; Lenhardt and Harkins 1983). Detailed descriptions of sea turtle ear anatomy are found in Ridgway et al. (1969), Lenhardt et al. (1985), and Bartol and Musick (2003). Sea turtles do not have external ears, but the middle ear is well adapted as a peripheral component of a bone conduction system. The thick tympanum is disadvantageous as an aerial receptor, but enhances low-frequency bone conduction hearing (Lenhardt et al. 1985; Bartol et al. 1999; Bartol and Musick 2003). A layer of subtympanal fat emerging from the middle ear is fused to the tympanum (Ketten et al. 2006; Bartol 2004, 2008). A cartilaginous disk, the extracolumella, is found under the tympanic membrane and is attached to the columella (Bartol 2004, 2008). The columella is a long rod that expands to form the stapes, and fibrous strands connect the stapes to the saccule (Bartol 2004, 2008). When the tympanum is depressed, the vibrations are conveyed via the fibrous stapedo-sacular strands to the sacule (Lenhardt et al. 1985). This arrangement of fat deposits and bone enables sea turtles to hear low-frequency sounds while underwater and makes them relatively insensitive to sound above water. Vibrations, however, can be conducted through the bones of the carapace to reach the middle ear.
A variety of audiometric methods are available to assess hearing abilities. Electrophysiological measures of hearing (e.g., auditory brainstem response or ABR) provide good information about relative sensitivity to different frequencies. However, this approach may underestimate the frequency range to which the animal is sensitive and may be imprecise at determining absolute hearing thresholds (e.g., Wolski et al. 2003). Nevertheless, when time is critical and only untrained animals are available, this method can provide useful information on sea turtle hearing (e.g., Wolski et al. 2003).
Ridgway et al. (1969) obtained the first direct measurements of sea turtle hearing sensitivity (Table E-1). They used an electrophysiological technique (cochlear potentials) to determine the response of green sea turtles (Chelonia mydas) to aerial- and vibrational-stimuli consisting of tones with frequencies 30 to 700 Hz. They found that green turtles exhibit maximum hearing sensitivity between 300 and 500 Hz, and speculated that the turtles had a useful hearing range of 60–1000 Hz. (However, there was some response to strong vibrational signals at frequencies down to the lowest one tested — 30 Hz.)
8 By Valerie D. Moulton and W. John Richardson, with subsequent updates (to Oct. 2012) by Mari A.
Smultea and Meike Holst, all of LGL Ltd., environmental research associates.

Appendix E. Airgun Sounds on Sea Turtles
Shelburne Basin 3-D Seismic Survey Environmental Assessment 2
TABLE E-1. Hearing capabilities of sea turtles as measured using behavioral and electro-physiological techniques. ABR: auditory brainstem response; AEP: auditory evoked potential; Beh.: behavioral; NA: no empirical data available.
Hearing
Sea Turtle Species
Range (Hz)
Highest Sensitivity(Hz) Technique
Source
Green 60-1000 300-500 Cochlear Potentials a
Ridgway et al. 1969
100-800 600-700 (juveniles) 200-400 (subadults)
ABR w Bartol & Ketten 2006; Ketten & Bartol 2006
50-1600 50-400 ABR a,w Dow et al. 2008 Hawksbill NA NA NA NA Loggerhead 250-1000
50-1131 250
100-400 ABR a
AEP w, Beh.w
Bartol et al. 1999; Martin et al. 2012
Olive ridley NA NA NA NA Kemp’s ridley 100-500 100-200 ABR w Bartol & Ketten 2006;
Ketten & Bartol 2006 Leatherback NA NA NA NA Flatback NA NA NA NA
a measured in air; w measured underwater.
Bartol et al. (1999) tested the in-air hearing of juvenile loggerhead turtles Caretta caretta (Table E-1). The authors used ABR to determine the response of the sea turtle ear to two types of vibrational stimuli: (1) brief, low-frequency broadband clicks, and (2) brief tone bursts at four frequencies from 250 to 1000 Hz. They demonstrated that loggerhead sea turtles hear well between 250 and 1000 Hz; within that frequency range the turtles were most sensitive at 250 Hz. The authors did not measure hearing sensitivity below 250 Hz or above 1000 Hz. The signals used in this study were very brief — 0.6 ms for the clicks and 0.8–5.5 ms for the tone bursts. In other animals, auditory thresholds decrease with increasing signal duration up to ~100–200 ms. Thus, sea turtles probably could hear weaker signals than demonstrated in the study if the signal duration were longer.
Lenhardt (2002) exposed loggerhead turtles while they were near the bottom of holding tanks at a depth of 1 m to tones from 35 to 1000 Hz. The turtles exhibited startle responses (neck contractions) to these tones. The lowest thresholds were in the 400–500 Hz range (106 dB SPL re 1 Pa), and thresholds in the 100–200 Hz range were ~124 dB (Lenhardt 2002). Thresholds at 735 and 100 Hz were 117 and 156 dB, respectively (Lenhardt 2002). Diving behaviour occurred at 30 Hz and 164 dB. Martin et al. (2012) used both behavioral and auditory evoked potential methods to derive an underwater audiogram of an adult loggerhead turtle. Both testing methods confirmed that the loggerhead turtle has low-frequency hearing and that best sensitivity occurred from 100-400 Hz.
More recently, ABR techniques have been used to determine the underwater hearing capabilities of six subadult green turtles, two juvenile green turtles, and two juvenile Kemp’s ridley (Lepidochelys kempii) turtles (Ketten and Bartol 2006; Bartol and Ketten 2006; Table E-1). The turtles were physically restrained in a small box tank with their ears below the water surface and the top of the head exposed above the surface. Pure-tone acoustic stimuli were presented to the animals, though the exact frequencies of these tones were not indicated. The six subadult green turtles detected sound at frequencies 100–500 Hz, with the most sensitive hearing at

Appendix E. Airgun Sounds on Sea Turtles
Shelburne Basin 3-D Seismic Survey Environmental Assessment 3
200-400 Hz. In contrast, the two juvenile green turtles exhibited a slightly expanded overall hearing range of 100–800 Hz, with their most sensitive hearing occurring at 600–700 Hz. The most restricted range of sensitive hearing (100–200 Hz) was found in the two juvenile Kemp’s ridleys turtles, whose overall frequency range was 100–500 Hz.
Preliminary data from a similar study of a trained, captive green turtle indicate that the animal heard and responded behaviorally to underwater tones ranging in frequency from 100 to 500 Hz. At 200 Hz, the threshold was between 107 and 119 dB, and at 400 Hz the threshold was between 121 and 131 dB [reference units not provided] (Streeter 2003; ONR N.D.).
In summary, the limited available data indicate that the frequency range of best hearing sensitivity of sea turtles extends from ~200 to 700 Hz. Sensitivity deteriorates as one moves away from this range to either lower or higher frequencies. However, there is some sensitivity to frequencies as low as 60 Hz, and probably as low as 30 Hz (Ridgway et al. 1969). Thus, there is substantial overlap in the frequencies that sea turtles detect and the dominant frequencies produced by airgun pulses. Given that, plus the high energy levels of airgun pulses, we can conclude that sea turtles hear airgun sounds. However, we are not aware of measurements of the absolute hearing thresholds of any sea turtle to waterborne sounds similar to airgun pulses. Given the high source levels of airgun pulses and the substantial received levels even at distances many km away from the source, it is probable that sea turtles can also hear the sound source output from distant seismic vessels. However, in the absence of relevant absolute threshold data, we cannot estimate how far away an airgun array might be audible to a sea turtle.
2. Effects of Airgun Pulses on Behavior and Movement
The effects of exposure to airgun pulses on the behavior and distribution of various marine animals have been studied over the past three decades. Most such studies have concerned marine mammals (e.g., see reviews by Richardson et al. 1995; Gordon et al. 2004; Nowacek et al. 2007; Southall et al. 2007), but also fish (e.g., reviewed by Thomson et al. 2001; Herata 2007; Payne et al. 2008). There have been far fewer studies on the effects of airgun noise (or indeed any type of noise) on sea turtles, and little is known about the sound levels that will or will not elicit various types of behavioral reactions. There have been four directed studies that focused on short-term behavioral responses of sea turtles in enclosures to single airguns. However, comparisons of results among studies are difficult because experimental designs and reporting procedures have varied greatly, and few studies provided specific information about the levels of the airgun pulses received by the turtles. Although monitoring studies are now providing some information on responses (or lack of responses) of free-ranging sea turtles to seismic surveys, we are not aware of any directed studies on responses of free-ranging sea turtles to seismic sounds or on the long-term effects of seismic or other sounds on sea turtles.
Directed Studies.―The most recent of the studies of caged sea turtles exposed to airgun pulses was a study by McCauley et al. (2000a,b) off Western Australia. The authors exposed caged green and loggerhead sea turtles (one of each) to pulses from an approaching and then receding 20 in3 airgun operating at 1500 psi and a 5-m airgun depth. The single airgun fired every 10 s. There were two trials separated by two days; the first trial involved ~2 h of airgun exposure and the second ~1 h. The results from the two trials showed that, above a received level of 166 dB re 1 Pa (rms) 9, the turtles noticeably increased their swim speed relative to periods when no airguns were operating. The behavior of the sea turtles became more erratic when received levels
9 rms = root mean square. This measure represents the average received sound pressure over the duration of the
pulse, with duration being defined in a specific way (from the time when 5% of the pulse energy has been received to the time when 95% of the energy has been received). The rms received level of a seismic pulse is typically about 10 dB less than its peak level, and about 16 dB less than its peak-to-peak level (Greene et al. 1997, 2000; McCauley et al. 1998, 2000a,b).

Appendix E. Airgun Sounds on Sea Turtles
Shelburne Basin 3-D Seismic Survey Environmental Assessment 4
exceeded 175 dB re 1 Pa (rms). The authors suggested that the erratic behavior exhibited by the caged sea turtles would likely, in unrestrained turtles, be expressed as an avoidance response (McCauley et al. 2000a,b).
O’Hara and Wilcox (1990) tested the reactions to airguns by loggerhead sea turtles held in a 300 × 45 m area of a canal in Florida with a bottom depth of 10 m. Nine turtles were tested at different times. The sound source consisted of one 10 in3 airgun plus two 0.8 in3 “poppers” operating at 2000 psi10 and an airgun-depth of 2 m for prolonged periods of 20–36 h. The turtles maintained a standoff range of about 30 m when exposed to airgun pulses every 15 or 7.5 s. Some turtles may have remained on the bottom of the enclosure when exposed to airgun pulses. O’Hara and Wilcox (1990) did not measure the received airgun sound levels. McCauley et al. (2000a,b) estimated that “the level at which O’Hara saw avoidance was around 175–176 dB re 1 Pa rms.” The levels received by the turtles in the Florida study probably were actually a few dB less than 175–176 dB because the calculations by McCauley et al. apparently did not allow for the shallow 2-m airgun depth in the Florida study. The effective source level of airguns is less when they are at a depth of 2 m vs. 5 m (Greene et al. 2000).
Moein et al. (1994) investigated the avoidance behavior and physiological responses of loggerhead turtles exposed to an operating airgun, as well as the effects on their hearing. The turtles were held in a netted enclosure ~18 m by 61 m by 3.6 m deep, with an airgun of unspecified size at each end. Only one airgun was operated at any one time; the firing rate was one shot every 5–6 s. Ten turtles were tested individually, and seven of these were retested several days later. The airgun was initially discharged when the turtles were near the center of the enclosure and the subsequent movements of the turtles were documented. The turtles exhibited avoidance during the first presentation of airgun sounds at a mean range of 24 m, but the avoidance response waned quickly. Additional trials conducted on the same turtles several days later did not show statistically significant avoidance reactions. However, there was an indication of slight initial avoidance followed by rapid waning of the avoidance response which the authors described as “habituation”. Their auditory study indicated that exposure to the airgun pulses may have resulted in temporary threshold shift (TTS; see later section). Reduced hearing sensitivity may also have contributed to the waning response upon continued exposure. Based on physiological measurements, there was some evidence of increased stress in the sea turtles, but this stress could also have resulted from handling of the turtles.
Inconsistencies in reporting procedures and experimental design prevent direct comparison of this study with either McCauley et al. (2000a,b) or O’Hara and Wilcox (1990). Moein et al. (1994) stated, without further details, that “three different decibel levels (175, 177, 179) were utilized” during each test. These figures probably are received levels in dB re 1 Pa, and probably relate to the initial exposure distance (mean 24 m), but these details were not specified. Also, it was not specified whether these values were measured or estimated, or whether they are expressed in peak-peak, peak, rms, SEL, or some other units. Given the shallow water in the enclosure (3.6 m), any estimates based on simple assumptions about propagation would be suspect.
Lenhardt (2002) exposed captive loggerhead sea turtles while underwater to seismic airgun (Bolt 600) sounds in a large net enclosure. At received levels of 151–161 dB, turtles were found to increase swimming speeds. Similar to the McCauley et al. studies (2000a,b--see above), near a received level of ~175 dB, an avoidance reaction was common in initial trials, but habituation then appeared to occur. Based on ABRs measured pre- and post-airgun exposures, a TTS of over 15 dB was found in one animal, with recovery two weeks later. Lenhardt (2002) suggested that exposure of sea turtles to airguns at water depths >10 m may result in exposure to more energy in the low frequencies with unknown biological effects.
10 There was no significant reaction by five turtles during an initial series of tests with the airguns operating at the
unusually low pressure of 1000 psi. The source and received levels of airgun sounds would have been substantially lower when the air pressure was only 1000 psi than when it was at the more typical operating pressure of 2000 psi.

Appendix E. Airgun Sounds on Sea Turtles
Shelburne Basin 3-D Seismic Survey Environmental Assessment 5
Despite the problems in comparing these studies, they are consistent in showing that, at some received level, sea turtles show avoidance of an operating airgun. McCauley et al. (2000a,b) found evidence of behavioral responses when the received level from a single small airgun was 166 dB re 1 Pa rms and avoidance responses at 175 dB re 1 Pa rms. Based on these data, McCauley et al. estimated that, for a typical airgun array (2678 in3, 12-elements) operating in 100–120 m water depth, sea turtles may exhibit behavioral changes at ~2 km and avoidance around 1 km. These estimates are subject to great variation, depending on the seismic source and local propagation conditions.
A further potential complication is that sea turtles on or near the bottom may receive sediment-borne “headwave” signals from the airguns (McCauley et al. 2000a,b). As previously discussed, it is believed that sea turtles use bone conduction to hear. It is unknown how sea turtles might respond to the headwave component of an airgun impulse or to bottom vibrations.
Related studies involving stimuli other than airguns may also be relevant. (1) Two loggerhead turtles resting on the bottom of shallow tanks responded repeatedly to low-frequency (20–80 Hz) tones by becoming active and swimming to the surface. They remained at the surface or only slightly submerged for the remainder of the 1-min trial (Lenhardt 1994). Although no detailed data on sound levels at the bottom vs. surface were reported, the surfacing response probably reduced the levels of underwater sound to which the turtles were exposed. (2) In a separate study, a loggerhead and a Kemp’s ridley sea turtle responded similarly when vibratory stimuli at 250 or 500 Hz were applied to the head for 1 s (Lenhardt et al. 1983). There appeared to be rapid habituation to these vibratory stimuli. (3) Turtles in tanks showed agitated behaviour when exposed to simulated boat noise and recordings from the U.S. Navy’s Low Frequency Active (LFA) sonar (Samuel et al. 2005, 2006). The tones and vibratory stimuli used in these two studies were quite different from airgun pulses. However, it is possible that resting sea turtles may exhibit a similar “alarm” response, possibly including surfacing or alternatively diving, when exposed to any audible noise, regardless of whether it is a pulsed sound or tone.
Monitoring Results.―Data on sea turtle behavior near airgun operations have also been collected during marine mammal and sea turtle monitoring and mitigation programs associated with various seismic operations around the world. Although the primary objectives concerned marine mammals, sea turtle sightings have also been documented in some of monitoring projects. Vessel-based observations indicate that avoidance of approaching seismic vessels is small-scale such that sea turtles are often seen from operating seismic vessels. Also, average distances from the airguns to these sea turtles are usually not greatly increased when the airguns are operating as compared with times when airguns are silent.
For example, during six large-source (10–20 airguns; 3050–8760 in3) and small-source (up to six airguns or three GI guns; 75–1350 in3) surveys conducted by L-DEO during 2003–2005, the mean closest point of approach (CPA) for turtles was closer during non-seismic than seismic periods: 139 m vs. 228 m and 120 m vs. 285 m, respectively (Holst et al. 2006). During a large-source L-DEO seismic survey off the Pacific coast of Central America in 2008, the turtle sighting rate during non-seismic periods was seven times greater than that during seismic periods (Holst and Smultea 2008). In addition, distances of turtles seen from the seismic vessel were significantly farther from the airgun array when it was operating (mean 159 m, n = 77) than when the airguns were off (mean 118 m, n = 69; Mann-Whitney U test, P<0.001) (Holst and Smultea 2008). During another L-DEO survey in the Eastern Tropical Pacific in 2008, the turtle sighting rate during non-seismic periods was 1.5 times greater than that during seismic periods; however, turtles tended to be seen closer to the airgun array when it was operating, but this difference was not statistically significant (Hauser et al. 2008).
Weir (2007) reported on the behavior of sea turtles near seismic exploration operations off Angola, West Africa. A total of 240 sea turtles were seen during 676 h of vessel-based monitoring, mainly for associated marine mammals mitigation measures. Airgun arrays with total volumes of 5085 and 3147 in3 were used at different times during the seismic program. Sea turtles tended to be seen slightly closer to the seismic source, and

Appendix E. Airgun Sounds on Sea Turtles
Shelburne Basin 3-D Seismic Survey Environmental Assessment 6
at sighting rates twice as high, during non-seismic vs. seismic periods (Weir 2007). However, there was no significant difference in the median distance of turtle sightings from the array during non-seismic vs. seismic periods, with means of 743 m (n = 112) and 779 m (n = 57). DeRuiter and Doukara (2012) observed that small numbers of basking loggerhead sea turtles (n=6 of 86 turtles of whose behavior was observed) exhibited an apparent startle response (sudden raising of the head and splashing of flippers, occasionally accompanied by blowing bubbles from the beak and nostrils, followed by a short dive) immediately following an airgun shot. Diving turtles (49 of 86 individuals) were observed at distances from the center of the airgun array ranging from 50–839 m. The estimated sound level at the median distance of 130 m was 191 dB re 1 Pa (peak). These observations were made during ~150 h of vessel-based monitoring from a seismic vessel actively operating an airgun array (13 airgun, 2440 in3) off Algeria—there was no corresponding observation effort during periods when the airgun array was inactive (DeRuiter and Doukara 2012).
Off northeastern Brazil, 46 sea turtles were seen during 2028 h of vessel-based monitoring of seismic exploration using 4–8 GI airguns (Parente et al. 2006). There were no apparent differences in turtle sighting rates during seismic and non-seismic periods, but detailed behavioral data during seismic operations were lacking (Parente et al. 2006).
Behavioral responses of marine mammals and fish to seismic surveys sometimes vary depending on species, time of year, activity of the animal, and other unknown factors. The same species may show different responses at different times of year or even on different days (e.g., Richardson et al. 1995; Thomson et al. 2001). Sea turtles of different ages vary in size, behavior, feeding habits, and preferred water depths. Nothing specific is known about the ways in which these factors may be related to airgun sound effects in sea turtles. However, it is reasonable to expect lesser effects in young turtles concentrated near the surface (where levels of airgun sounds are attenuated) as compared with older turtles that spend more time at depth where airgun sounds are generally stronger.
3. Possible Effects of Airgun Sounds on Distribution
In captive enclosures, sea turtles generally respond to seismic noise by startling, increasing swimming speed, and/or swimming away from the noise source. Animals resting on the bottom often become active and move toward the surface where received sound levels normally will be reduced, although some turtles dive upon exposure. Unfortunately, quantitative data for free-ranging sea turtles exposed to seismic pulses are very limited, and potential long-term behavioral effects of seismic exposure have not been investigated. The paucity of data precludes clear predictions of sea turtle responses to seismic noise. Available evidence suggests that localized behavioral and distributional effects on sea turtles are likely during seismic operations, including responses to the seismic vessel, airguns, and other gear (e.g., McCauley 1994; Pendoley 1997; Weir 2007). Pendoley (1997) summarized potential effects of seismic operations on the behavior and distribution of sea turtles and identified biological periods and habitats considered most sensitive to potential disturbance. The possible responses of free-ranging sea turtles to seismic pulses could include
avoiding the entire seismic survey area to the extent that turtles move to less preferred habitat;
avoiding only the immediate area around the active seismic vessel (i.e., local avoidance of the source vessel but remain in the general area); and
exhibiting no appreciable avoidance, although short-term behavioral reactions are likely.
Complete avoidance of an area, if it occurred, could exclude sea turtles from their preferred foraging area and could displace them to areas where foraging is sub-optimal. Avoidance of a preferred foraging area may prevent sea turtles from obtaining preferred prey species and hence could impact their nutritional status. The potential alteration of a migration route might also have negative impacts. However, it is not known whether

Appendix E. Airgun Sounds on Sea Turtles
Shelburne Basin 3-D Seismic Survey Environmental Assessment 7
avoidance by sea turtles would ever be on a sufficient geographic scale, or be sufficiently prolonged, to prevent turtles from reaching an important destination.
Available evidence suggests that the zone of avoidance around seismic sources is not likely to exceed a few kilometers (McCauley et al. 2000a,b). Avoidance reactions on that scale could prevent sea turtles from using an important coastal area or bay if there was a prolonged seismic operation in the area, particularly in shallow waters (e.g., Pendoley 1997). If such avoidance were to occur, it is uncertain how long it would last. Sea turtles might be excluded from the area for the duration of the seismic operation, or they might remain but exhibit abnormal behavioral patterns (e.g., lingering longer than normal at the surface where received sound levels are lower). Whether those that were displaced would return quickly after the seismic operation ended is unknown.
It is unclear whether exclusion from a particular nesting beach by seismic operations, if it occurred, would prevent or decrease reproductive success. It is believed that females migrate to the region of their birth and select a nesting beach (Miller 1997). However, the degree of site fidelity varies between species and also intra-seasonally by individuals. If a sea turtle is excluded from a particular beach, it may select a more distant, undisturbed nesting site in the general area (Miller 1997). For instance, Bjorndal et al. (1983) reported a maximal intra-seasonal distance between nesting sites of 290 km, indicating that turtles use multiple nesting sites spaced up to a few hundred kilometers apart. Also, it is uncertain whether a turtle that failed to go ashore because of seismic survey activity would abandon the area for that full breeding cycle, or would simply delay going ashore until the seismic vessel moved to a different area.
Shallow coastal waters can contain relatively high densities of sea turtles during nesting, hatching, and foraging periods. Thus, seismic operations in these areas could correspondingly impact a relatively higher number of individual turtles during sensitive biological periods. Samuel et al. (2005) noted that anthropogenic noise in vital sea turtle habitats, such as a major coastal foraging area off Long Island, NY, could affect sea turtle behaviour and ecology. There are no specific data that demonstrate the consequences to sea turtles if seismic operations with large or small arrays of airguns occur in important areas at biologically important times of year. However, a number of mitigation measures can, on a case-by-case basis, be considered for application in areas important to sea turtles (e.g., Pendoley 1997).
4. Possible Impacts of Airgun Sounds on Hearing
Noise-induced hearing damage can be either temporary or permanent. In general, the received sound must be strong for either to occur, and must be especially strong and/or prolonged for permanent impairment to occur.
Few studies have directly investigated hearing or noise-induced hearing loss in sea turtles. Moein et al. (1994) used an evoked potential method to test the hearing of loggerhead sea turtles exposed to a few hundred pulses from a single airgun. Turtle hearing was tested before, within 24 h after, and two weeks after exposure to pulses of airgun sound. Levels of airgun sound to which the turtles were exposed were not specifically reported. The authors concluded that five turtles exhibited some change in their hearing when tested within 24 h after exposure relative to pre-exposure hearing, and that hearing had reverted to normal when tested two weeks after exposure. The results are consistent with the occurrence of TTS upon exposure of the turtles to airgun pulses. Unfortunately, the report did not state the size of the airgun used, or the received sound levels at various distances. The distances of the turtles from the airgun were also variable during the tests; the turtle was about 30 m from the airgun at the start of each trial, but it could then either approach the airgun or move away to a maximum of about 65 m during subsequent airgun pulses. Thus, the levels of airgun sounds that apparently elicited TTS are not known. Nonetheless, it is noteworthy that there was evidence of TTS from exposure to pulses from a single airgun. However, the turtles were confined and unable to move more than about 65 m away. Similarly, Lenhardt (2002) exposed loggerhead turtles in a large net enclosure to airgun pulses. A TTS of >15 dB was evident for one loggerhead turtle, with recovery occurring in two weeks. Turtles in the open sea might have
Appendix E. Airgun Sounds on Sea Turtles
Shelburne Basin 3-D Seismic Survey Environmental Assessment 8
moved away from an airgun operating at a fixed location, and in the more typical case of a towed airgun or airgun array, very few shots would occur at or around one location. Thus, exposure to underwater sound during net-enclosure experiments was not typical of that expected during an operational seismic survey.
Studies with terrestrial reptiles have demonstrated that exposure to airborne impulse noise can cause hearing loss. For example, desert tortoises (Gopherus agassizii) exhibited TTS after exposure to repeated high-intensity sonic booms (Bowles et al. 1999). Recovery from these temporary hearing losses was usually rapid (<1 h), which suggested that tortoises can tolerate these exposures without permanent injury (Bowles et al. 1999).
The results from captive, restrained sea turtles exposed repeatedly to seismic sounds in enclosed areas indicate that TTS is possible under these artificial conditions. However, there are no data to indicate whether there are any plausible field situations in which exposure to repeated airgun pulses at close range could cause permanent threshold shift (PTS) or hearing impairment in sea turtles. Hearing impairment (whether temporary or permanent) from seismic sounds is considered unlikely to occur at sea; turtles are unlikely to be exposed to more than a few strong pulses close to the sound source, as individuals are mobile and the vessel travels relatively quickly compared to the swimming speed of a sea turtle. However, in the absence of specific information on received levels of impulse sound necessary to elicit TTS and PTS in sea turtles, it is uncertain whether there are circumstances where these effects could occur in the field. If sea turtles exhibit little or no behavioral avoidance, or if they acclimate to seismic noise to the extent that avoidance reactions cease, sea turtles might sustain hearing loss if they are close enough to seismic sources. Similarly, in the absence of quantitative data on behavioral responses, it is unclear whether turtles in the area of seismic operations prior to start-up move out of the area when standard ramp-up (=soft-start) procedures are in effect. It has been proposed that sea turtles require a longer ramp-up period because of their relatively slow swimming speeds (Eckert 2000). However, it is unclear at what distance (if any) from a seismic source sea turtles could sustain hearing impairment, and whether there would ever be a possibility of exposure to sufficiently high levels for a sufficiently long period to cause permanent hearing damage.
In theory, a reduction in hearing sensitivity, either temporary or permanent, may be harmful for sea turtles. However, very little is known about the role of sound perception in the sea turtle’s normal activities. While it is not possible to estimate how much of a problem it would be for a turtle to have either temporary or permanent hearing impairment, there is some evidence indicating that hearing plays an important role in sea turtle survival. (1) It has been suggested (Eckert et al. 1998; Eckert 2000) that sea turtles may use passive reception of acoustic signals to detect the hunting sonar of killer whales (Orcinus orca), a known predator of leatherback sea turtles Dermochelys coriacea (Fertl and Fulling 2007). Further investigation is needed before this hypothesis can be accepted. Some communication calls of killer whales include components at frequencies low enough to overlap the frequency range where sea turtles hear. However, the echolocation signals of killer whales are at considerably higher frequencies and based on available evidence, are likely inaudible to sea turtles (e.g., Simon et al. 2007). (2) Hearing impairment, either temporary or permanent, might inhibit a turtle’s ability to avoid injury from vessels. A recent study found that green sea turtles often responded behaviorally to close, oncoming small vessels and that the nature of the response was related to vessel speed, with fewer turtles displaying a flee response as vessel speed increased (Hazel et al. 2007). However, Hazel et al. (2007) suggested that a turtles’ ability to detect an approaching vessel was vision-dependent. (3) Hearing may play a role in navigation. For example, it has been proposed that sea turtles may identify their breeding beaches by their acoustic signature (Lenhardt et al. 1983). However, available evidence suggests that visual, wave, and magnetic cues are the main navigational cues used by sea turtles, at least in the case of hatchlings and juveniles (Lohmann et al. 1997, 2001; Lohmann and Lohmann 1998).
Appendix E. Airgun Sounds on Sea Turtles
Shelburne Basin 3-D Seismic Survey Environmental Assessment 9
5. Conclusions
Based on available data concerning sea turtles and other marine animals, it is likely that some sea turtles exhibit behavioral changes and/or avoidance within an area of unknown size near an operating seismic survey vessel. There is also the possibility of temporary hearing impairment or perhaps even permanent hearing damage to turtles close to the airguns. However, there are very few data on temporary hearing loss and no data on permanent hearing loss in sea turtles exposed to airgun pulses. Although some information is available about effects of exposure to sounds from a single airgun on captive sea turtles, the long term acoustic effects (if any) of a full-scale marine seismic operation on free-ranging sea turtles are unknown. The greatest impact is likely to occur if seismic operations occur in or near areas where turtles concentrate, and at seasons when turtles are concentrated there. However, there are no specific data that demonstrate the consequences of such seismic operations to sea turtles. Until more data become available, it would be prudent to avoid seismic operations near important nesting beaches or in areas of known concentrated feeding during times of year when those areas are in use by sea turtles.
6. Literature Cited
Bartol, S.M. 2004. Sea turtle hearing and sensitivity to acoustic impact. Appendix H In: Geophysical and geophysical exploration for mineral resources on the Gulf of Mexico outer continental shelf. OCS EIS/EA MMS 2004-054. U.S. Minerals Manage. Serv. Gulf of Mexio OCS Region, New Orleans, LA.
Bartol, S.M. 2008. A review of auditory function of sea turtles. Bioacoustics 17(1-3):57-59.
Bartol, S.M. and D.R. Ketten. 2006. Turtle and tuna hearing. p. 98-103 In: Y. Swimmer and R. Brill (eds.), Sea Turtle and Pelagic Fish Sensory Biology: Developing Techniques to Reduce Sea Turtle Bycatch in Longline Fisheries. NOAA Tech. Memo. NMFS-PIFSC-7.
Bartol, S.M. and J. A. Musick. 2003. Sensory biology of sea turtles. p. 79-102 In: P.L. Lutz, J.A. Musick and J. Wyneken (eds.), The Biology of Sea Turtles, Volume 2. CRC Press, Boca Raton, FL. 455 p.
Bartol, S.M., J.A. Musick, and M.L. Lenhardt. 1999. Auditory evoked potentials of the loggerhead sea turtle (Caretta caretta). Copeia 1999(3):836-840.
Bjorndal K.A., A.B. Meylan, and B.J. Turner. 1983. Sea turtles nesting at Melbourne Beach, Florida, I. Size, growth and reproduction. Biol. Conserv. 26(1):65-77.
Bowles, A.E., S. Eckert, L. Starke, E. Berg, L. Wolski, and J. Matesic, Jr. 1999. Effects of flight noise from jet aircraft and sonic booms on hearing, behavior, heart rate, and oxygen consumption of desert tortoises (Gopherus agassizii). U.S. Air Force Res. Lab., Wright-Patterson AFB, OH. 131 p.
DeRuiter, S.L. and K.L. Doukara. 2012. Loggerhead turtles dive in response to airgun sound exposure. Endang. Species Res. 16:55-63.
Dow, W.E., D.A. Mann, T.T. Jones, S.A. Eckert, and C.A. Harms. 2008. In-water and in-air hearing sensitivity of the green sea turtle (Chelonia mydas). Abstract, Acoustic Communication by Animals, 2nd Intern. Conf., 12-15 August 2008, Corvallis, OR.
Eckert, S.A. 2000. Letter to M. James, Nova Scotia Leatherback Turtle Working Group, re: possible impacts of seismic exploration off Nova Scotia on sea turtles. Hubbs-Sea World Res. Inst., San Diego, CA. 4 p.
Eckert, S.A., A. Bowles, and E. Berg. 1998. The effect of seismic airgun surveys on leatherback sea turtles (Dermochelys coriacea) during the nesting season. Rep. from Hubbs-Sea World Res. Inst., San Diego, CA, for BHP Petroleum (Trinidad) Ltd. 67 p.
Fertl, D. and G.L. Fulling. 2007. Interactions between marine mammals and sea turtles. Mar. Turtle Newsl. 115:4-8.
Gordon, J., D. Gillespie, J. Potter, A. Frantzis, M.P. Simmonds, R. Swift, and D. Thompson. 2004. A review of the effects of seismic surveys on marine mammals. Mar. Technol. Soc. J. 37(4):16-34.

Appendix E. Airgun Sounds on Sea Turtles
Shelburne Basin 3-D Seismic Survey Environmental Assessment 10
Greene, C.R., Jr., with J.S. Hanna and R.W. Blaylock. 1997. Physical acoustics measurements. p. 3-1 to 3-63 In: W.J. Richardson (ed.), Northstar marine mammal monitoring program, 1996: marine mammal and acoustical monitoring of a seismic program in the Alaskan Beaufort Sea. LGL Rep. 2121-2. Rep. from LGL Ltd., King City, Ont., and Greeneridge Sciences Inc., Santa Barbara, CA, for BP Explor. (Alaska) Inc., Anchorage, AK, and Nat. Mar. Fish. Serv., Anchorage, AK, and Silver Spring, MD. 245 p.
Greene, C.R., Jr. and W.C. Burgess, with R. Norman and R.W. Blaylock. 2000. Physical acoustics measurements, 1999. p. 3-1 to 3-45 In: W.J. Richardson (ed.), Marine mammal and acoustical monitoring of Western Geophysical's open-water seismic program in the Alaskan Beaufort Sea, 1999. LGL Rep. TA2313-4. Rep. from LGL Ltd., King City, Ont., and Greeneridge Sciences Inc., Santa Barbara, CA, for Western Geophysical, Houston, TX, and U.S. Nat. Mar. Fish. Serv., Anchorage, AK, and Silver Spring, MD. 155 p.
Hauser, D.D.W., M. Holst, and V.M. Moulton. 2008. Marine mammal and sea turtle monitoring during Lamont-Doherty Earth Observatory’s marine seismic program in the Eastern Tropical Pacific, April – August 2008. LGL Rep. TA4656/7-1. Rep. from LGL Ltd., St. John’s, Nfld, for Lamont-Doherty Earth Observatory of Columbia Univ., Palisades, NY, and Nat. Mar. Fish. Serv., Silver Spring, MD. 98 p.
Hazel, J., I.R. Lawler, H. Marsh, and S. Robson. 2007. Vessel speed increases collision risk for the green turtle Chelonia mydas. Endang. Species Res. 3:105-113.
Herata, H. (ed.). 2007. International workshop, Impacts of Seismic Survey Activities on Whales and Other Marine Biota. Dessau, Germany, Sept. 2006.
Holst, M. and M.A. Smultea. 2008. Marine mammal and sea turtle monitoring during Lamont-Doherty Earth Observatory’s marine seismic program off Central America, February – April 2008. LGL Rep. TA4342-3. Rep. from LGL Ltd., King City, Ont., for Lamont-Doherty Earth Observatory of Columbia Univ., Palisades, NY, and Nat. Mar. Fish. Serv., Silver Spring, MD. 133 p.
Holst, M., W.J. Richardson, W.R. Koski, M.A. Smultea, B. Haley, M.W. Fitzgerald, and M. Rawson. 2006. Effects of large and small-source seismic surveys on marine mammals and sea turtles. Abstract. Presented at Am. Geophys. Union - Soc. Explor. Geophys. Joint Assembly on Environ. Impacts from Marine Geophys. & Geological Studies - Recent Advances from Academic & Industry Res. Progr., Baltimore, MD, May 2006.
Ketten, D.R. and S.M. Bartol. 2006. Functional measures of sea turtle hearing, ONR Award No: N00014-02-1-0510. Rep. from Woods Hole Oceanogr. Inst., Woods Hole, MA, and Virginia Inst. Mar. Sci., Gloucester, VA, for Office of Naval Res., Arlington, VA. 5 p.
Ketten, D.R., I. Fischer, S. Cramer, S.M. Bartol, and J. O’Malley. 2006. Water, fats, and acoustic impedance: soft tissue adaptations for underwater hearing in turtles, seabirds and marine mammals. p. 162 In: N.J. Pilcher (ed.), Proc. 23rd Symp. on Sea Turtle Biology and Conservation. NOAA Tech. Memo. NMFS-SEFSC-536. 283 p.
Lenhardt, M.L. 1982. Bone conduction hearing in turtles. J. Aud. Res. 22(3):153-160.
Lenhardt, M.L. 1994. Seismic and very low frequency sound induced behaviors in captive loggerhead marine turtles (Caretta caretta). p. 238-241 In: K.A. Bjorndal, A.B. Bolten, D.A. Johnson and P.J. Eliazar (eds.), Proc. 14th Symp. on Sea Turtle Biology and Conservation. NOAA Tech. Memo. NMFS-SEFSC-351. 323 p.
Lenhardt, M. 2002. Sea turtle auditory behavior. J. Acoust. Soc. Amer. 112(5, Pt. 2):2314 (Abstract).
Lenhardt, M.L. and S.W. Harkins. 1983. Turtle shell as an auditory receptor. J. Aud. Res. 23(4):251-260.
Lenhardt, M.L., S. Bellmund, R.A. Byles, S.W. Harkins, and J.A. Musick. 1983. Marine turtle reception of bone-conducted sound. J. Aud. Res. 23(2):119-125.
Lenhardt, M.L., R.C. Klinger, and J.A. Musick. 1985. Marine turtle middle-ear anatomy. J. Aud. Res. 25(1):66-72.
Lohmann, K.J. and C.M.F. Lohmann. 1998. Migratory guidance mechanisms in marine turtles. J. Avian Biol. 29(4):585-596.
Lohmann, K.J., B.E. Witherington, C.M.F. Lohmann, and M. Salmon. 1997. Orientation, navigation, and natal beach homing in sea turtles. p. 107-135 In: P.L. Lutz and J.A. Musick (eds.), The biology of sea turtles. CRC Press, Boca Raton, FL. 432 p.

Appendix E. Airgun Sounds on Sea Turtles
Shelburne Basin 3-D Seismic Survey Environmental Assessment 11
Lohmann, K.J., S.D. Cain, S.A. Dodge, and C.M.F. Lohmann. 2001. Regional magnetic fields as navigational markers for sea turtles. Science 294(5541):364-366.
Martin, K.J., S.C. Alessi, J.C. Gaspard, A.D. Tucker, G.B. Bauer and D.A. Mann. 2012. Underwater hearing in the loggerhead turtle (Caretta caretta): a comparison of behavorial and auditory evoked potential audiograms. J. Exp. Biol. 215:3001-3009.
McCauley, R.D. 1994. The environmental implications of offshore oil and gas development in Australia – seismic surveys. p. 19-122 In: M. Swan, J.M. Neff and P.C. Young (eds.), Environmental Implications of Offshore Oil and Gas Development in Australia - The Findings of an Independent Scientific Review. Australian Petroleum Explor. Assoc. and Energy Research and Developm. Corp., Sydney, N.S.W.
McCauley, R.D., M.-N. Jenner, C. Jenner, K.A. McCabe, and J. Murdoch. 1998. The response of humpback whales (Megaptera novaeangliae) to offshore seismic survey noise: preliminary results of observations about a working seismic vessel and experimental exposures. APPEA J. 38:692-707.
McCauley, R.D., J. Fewtrell, A.J. Duncan, C. Jenner, M-N. Jenner, J.D. Penrose, R.I.T. Prince, A. Adhitya, J. Murdoch, and K. McCabe. 2000a. Marine seismic surveys – a study of environmental implications. APPEA J. 40:692-708.
McCauley, R. D., J. Fewtrell, A.J. Duncan, C. Jenner, M.-N. Jenner, J.D. Penrose, R.I.T. Prince, A. Adhitya, J. Murdoch, and K. McCabe. 2000b. Marine seismic surveys: Analysis and propagation of air-gun signals; and effects of air-gun exposure on humpback whales, sea turtles, fishes and squid. Curtin Univ. Technol., Centre for Mar. Sci. and Technol., Bentley, Australia.
Miller, J.D. 1997. Reproduction in sea turtles. p. 51-81 In: P.L. Lutz and J.A. Musick (eds.), The Biology of Sea Turtles. CRC Press, Boca Raton, FL. 432 p.
Moein, S.E., J.A. Musick, J.A. Keinath, D.E. Barnard, M. Lenhardt, and R. George. 1994. Evaluation of seismic sources for repelling sea turtles from hopper dredges. Rep. from Virginia Inst. Mar. Sci. [Gloucester Point], VA, for U.S. Army Corps of Engineers. 33 p.
National Marine Fisheries Service (NMFS). 2007. Endangered Species Act, Section 7 Consultation, Biological Opinion: Issuance of License to Neptune LNG by MARAD to Construct, Own, and Operate an LNG Deepwater Port, FINE W2006104000. National Marine Fisheries Service, Northeast Region, Gloucester, MA.
Nowacek, D.P., L.H. Thorne, D.W. Johnston, and P.L. Tyack. 2007. Responses of cetaceans to anthropogenic noise. Mammal Rev. 37(2):81-115.
O’Hara, J. and J.R. Wilcox. 1990. Avoidance responses of loggerhead turtles, Caretta caretta, to low frequency sound. Copeia 1990(2):564-567.
ONR (Office of Naval Research). N.D. Science and Technology Focus, Oceanography, Ocean Life: Green sea turtle – Current research. http://www.onr.navy.mil/focus/ocean/life/turtle4.htm. Last update not indicated. Accessed 3 March 2009.
Parente, C.L., J.D. Lontra, and M.E. de Araújo. 2006. Occurrence of sea turtles during seismic surveys in Northeastern Brazil. Biota Neotropica 6(1). Available at http://www.biotaneotropica.org.br/
Payne, J.F., C. Andrews, L. Fancey, D. White, and J. Christian. 2008. Potential effects of seismic energy on fish and shellfish: An update since 2003. Canadian Science Advisory Secretariat Research Document 2008/060. Department of Fisheries and Oceans Canada. www.dfo-mpo.gc.ca/CSAS/Csas/Publications/ResDocs-DocRech/2008/2008_060_e.htm. Lasted updated 26 November 2008. Accessed 3 March 2009.
Pendoley, K. 1997. Sea turtles and management of marine seismic programs in Western Australia. Petrol. Expl. Soc. Austral. J. 25:8-16.
Richardson, W.J., C.R. Greene, Jr., C.I. Malme, and D.H. Thomson. 1995. Marine mammals and noise. Academic Press, San Diego, CA. 576 p.
Ridgway, S.H., E.G. Wever, J.G. McCormick, J. Palin, and J.H. Anderson. 1969. Hearing in the giant sea turtle, Chelonia mydas. Proc. Nat. Acad. Sci. U.S. 64(2):884-890.

Appendix E. Airgun Sounds on Sea Turtles
Shelburne Basin 3-D Seismic Survey Environmental Assessment 12
Samuel, Y., S.J. Morreale, C.W. Clark, C.H. Greene, and M.E. Richmond. 2005. Underwater, low-frequency noise in a coastal sea turtle habitat. J. Acoust. Soc. Am. 117(3):1465-1472.
Samuel, Y., S.J. Morreale, C.W. Clark, M.E. Richmond, and C.H. Greene. 2006. Underwater noise and anthropogenic disturbance in critical sea turtle habitats. p. 93 In: N.J. Pilcher (ed.), Proc. 23rd Symp. on Sea Turtle Biology and Conservation. NOAA Tech. Memo. NMFS-SEFSC-536. 283 p.
Simon, M., M. Wahlberg, and L.E. Miller. 2007. Echolocation clicks from killer whales (Orcinus orca) feeding on herring (Clupea harengus) (L). J. Acoust. Soc. Amer. 121(2):749-752.
Southall, B.L., A.E. Bowles, W.T. Ellison, J.J. Finneran, R.L. Gentry, C.R. Greene Jr., D. Kastak, D.R. Ketten, J.H. Miller, P.E. Nachtigall, W.J. Richardson, J.A. Thomas, and P.L. Tyack. 2007. Marine mammal noise exposure criteria: initial scientific recommendations. Aquat. Mamm. 33(4):411-522.
Southwood, A., K. Fritsches, R. Brill, and Y. Swimmer. 2008. Sound, chemical, and light detection in sea turtles and pelagic fishes: sensory-based approaches to bycatch reduction in longling fisheries. Endang. Species Res. 5:225-238.
Streeter, K. 2003. Studying the hearing capabilities of a green sea turtle. Abstract. Presented at Environmental Consequences of Underwater Sound (ECOUS) Symposium. San Antonio, TX, May 2003.
Thomson, D.H., J.W. Lawson, and A. Muecke. 2001. Proceedings of a workshop to develop methodologies for conducting research on the effects of seismic exploration on the Canadian east coast fishery, Halifax, Nova Scotia, 7-8 September 2000. ESRF Rep. 139. Environ. Stud. Res. Funds, Calgary, AB. 75 p.
Weir, C.R. 2007. Observations of marine turtles in relation to seismic airgun sound off Angola. Mar. Turtle Newsl. 116:17-20.
Wolski, L.F., R.C. Anderson, A.E. Bowles, and P.K. Yochem. 2003. Measuring hearing in the harbor seal (Phoca vitulina): Comparison of behavioral and auditory brainstem response techniques. J. Acoust. Soc. Am. 113(1):629-637.

Appendix F: Airgun Sounds on Fishes
Shelburne Basin 3-D Seismic Survey Environmental Assessment 1
APPENDIX F:
REVIEW OF POTENTIAL EFFECTS OF AIRGUN SOUND ON FISHES11
Here we review literature about the effects of airgun sounds on fishes during seismic surveys. The potential effect of seismic sounds on fish has been studied with a variety of taxa, including marine, freshwater, and anadromous species (reviewed by Fay and Popper 2000; Ladich and Popper 2004; Hastings and Popper 2005; Popper and Hastings 2009a,b).
It is sometimes difficult to interpret studies on the effects of underwater sound on marine animals because authors often do not provide enough information, including received sound levels, source sound levels, and specific characteristics of the sound. Specific characteristics of the sound include units and references, whether the sound is continuous or impulsive, and its frequency range. Underwater sound pressure levels are typically reported as a number of decibels referenced to a reference level, usually 1 micro-Pascal (µPa). However, the sound pressure dB number can represent multiple types of measurements, including “zero to peak”, “peak to peak”, or averaged (“rms”). Sound exposure levels (SEL) may also be reported as dB. The SEL is the integration of all the acoustic energy contained within a single sound event. Unless precise measurement types are reported, it can be impossible to directly compare results from two or more independent studies.
Acoustic Capabilities
Sensory systems, like those that allow for hearing, provide information about an animal’s physical, biological, and social environments, in both air and water. Extensive work has been done to understand the structures, mechanisms, and functions of animal sensory systems in aquatic environments (Atema et al. 1988; Kapoor and Hara 2001; Collin and Marshall 2003). All fish species have hearing and skin-based mechanosensory systems (inner ear and lateral line systems, respectively) that provide information about their surroundings (Fay and Popper 2000). Fay (2009) and some others refer to the ambient sounds to which fishes are exposed as ‘underwater soundscapes’. Anthropogenic sounds can have important negative consequences for fish survival and reproduction if they disrupt an individual’s ability to sense its soundscape, which often tells of predation risk, prey items, or mating opportunities. Potential negative effects include masking of key environmental sounds or social signals, displacement of fish from their habitat, or interference with sensory orientation and navigation.
Fish hearing via the inner ear is typically restricted to low frequencies. As with other vertebrates, fish hearing involves a mechanism whereby the beds of hair cells (Howard et al. 1988; Hudspeth and Markin 1994) located in the inner ear are mechanically affected and cause a neural discharge (Popper and Fay 1999). At least two major pathways for sound transmittance between sound source and the inner ear have been identified for fishes. The most primitive pathway involves direct transmission to the inner ear’s otolith, a calcium carbonate mass enveloped by sensory hairs. The inertial difference between the dense otolith and the less-dense inner ear causes the otolith to stimulate the surrounding sensory hair cells. This motion differential is interpreted by the central nervous system as sound.
The second transmission pathway between sound source and the inner ear of fishes is via the swim bladder, a gas-filled structure that is much less dense than the rest of the fish’s body. The swim bladder, being more compressible and expandable than either water or fish tissue, will differentially contract and expand relative to the rest of the fish in a sound field. The pulsating swim bladder transmits this mechanical disturbance directly to the inner ear (discussed below). Such a secondary source of sound detection may be more or less effective at
11 By John R. Christian and R.C. Bocking, LGL Ltd., environmental research associates (rev. September 2012)

Appendix F: Airgun Sounds on Fishes
Shelburne Basin 3-D Seismic Survey Environmental Assessment 2
stimulating the inner ear depending on the amplitude and frequency of the pulsation, and the distance and mechanical coupling between the swim bladder and the inner ear (Popper and Fay 1993).
A recent paper by Popper and Fay (2011) discusses the designation of fishes based on sound detection capabilities. They suggest that the designations ‘hearing specialist’ and ‘hearing generalist’ no longer be used for fishes because of their vague and sometimes contradictory definitions, and that there is instead a range of hearing capabilities across species that is more like a continuum, presumably based on the relative contributions of pressure to the overall hearing capabilities of a species.
According to Popper and Fay (2011), one end of this continuum is represented by fishes that only detect particle motion because they lack pressure-sensitive gas bubbles (e.g., swim bladder). These species include elasmobranchs (e.g., sharks) and jawless fishes, and some teleosts including flatfishes. Fishes at this end of the continuum are typically capable of detecting sound frequencies less than 1,500 Hz (e.g., Casper et al. 2003: Casper and Mann 2006, 2007, 2009).
The other end of the fish hearing continuum is represented by fishes with highly specialized otophysic connections between pressure receptive organs, such as the swim bladder, and the inner ear. These fishes include some squirrelfish, mormyrids, herrings, and otophysan fishes (freshwater fishes with Weberian apparatus, an articulated series of small bones that extend from the swim bladder to the inner ear). Rather than being limited to 1.5 kHz or less in hearing, these fishes can typically hear up to several kHz. One group of fish in the anadromous herring sub-family Alosinae (shads and menhaden) can detect sounds to well over 180 kHz (Mann et al. 1997, 1998, 2001). This may be the widest hearing range of any vertebrate that has been studied to date. While the specific reason for this very high frequency hearing is not totally clear, there is strong evidence that this capability evolved for the detection of the ultrasonic sounds produced by echolocating dolphins to enable the fish to detect, and avoid, predation (Mann et al. 1997; Plachta and Popper 2003).
All other fishes have hearing capabilities that fall somewhere between these two extremes of the continuum. Some have unconnected swim bladders located relatively far from the inner ear (e.g., salmonids, tuna) while others have unconnected swim bladders located relatively close to the inner ear (e.g., Atlantic cod, Gadus morhua). There has also been the suggestion that Atlantic cod can detect 38 kHz (Astrup and Møhl 1993). However, the general consensus was that this was not hearing with the ear, but probably the fish responding to exceedingly high pressure signals of the 38-kHz source through some other receptor in the skin, such as touch receptors (Astrup and Møhl 1998).
It is important to recognize that the swim bladder itself is not a sensory end organ, but rather an intermediate part of the sound pathway between sound source and the inner ear of some fishes. The inner ear of fishes is ultimately the organ that translates the particle displacement component into neural signals for the brain to interpret as sound.
A third mechanosensory pathway found in most bony fishes and elasmobranchs (i.e., cartilaginous fishes) involves the lateral line system. It too relies on sensitivity to water particle motion. The basic sensory unit of the lateral line system is the neuromast, a bundle of sensory and supporting cells whose projecting cilia, similar to those in the ears, are encased in a gelatinous cap. Neuromasts detect distorted sound waves in the immediate vicinity of fishes. Generally, fishes use the lateral line system to detect the particle displacement component of low frequency acoustic signals (up to 160 to 200 Hz) over a distance of one to two body lengths. The lateral line is used in conjunction with other sensory systems, including hearing (Sand 1981; Coombs and Montgomery 1999).
There has also been recent study of the auditory sensitivity of settlement-stage fishes. Using the auditory brainstem response (ABR) technique in the laboratory, Wright et al. (2010) concluded that larvae of coral reef species tested had significantly more sensitive hearing than the larvae of pelagic species tested. All reef fish larvae as well as the larvae of one of the pelagic species detected frequencies in the 100-2,000 Hz range. The

Appendix F: Airgun Sounds on Fishes
Shelburne Basin 3-D Seismic Survey Environmental Assessment 3
larvae of the one other pelagic species did not detect frequencies higher than 800 Hz. The larvae of all six species exhibited best hearing at frequencies between 100 and 300 Hz. The results of Wright et al. (2010) suggested that settlement-stage larval reef fishes may be able to detect reef sounds at distances of 100s of metres. Other recent research also indicates that settlement-stage larvae of coral reef fishes may use sound as a cue to locate settlement sites (Tolimieri et al. 2004; Leis et al. 2003; Simpson et al. 2005; Leis and Locket 2005).
Potential Effects on Fishes
Review papers on the effects of anthropogenic sources of underwater sound on fishes have been published recently (Popper 2009; Popper and Hastings 2009a,b; Fay and Popper 2012). These papers consider various sources of anthropogenic sound, including seismic airguns. For the purposes of this review, only the effects of seismic airgun sound are considered.
Marine Fishes
Evidence for airgun-induced damage to fish ears has come from studies using pink snapper Pagrus auratus (McCauley et al. 2000a,b, 2003). In these experiments, fish were caged and exposed to the sound of a single moving seismic airgun every 10 s over a period of 1 h and 41 min. The source SPL at 1 m was about 223 dB re 1 µPa · mp-p, and the received SPLs ranged from 165 to 209 dB re 1 µPap-p. The sound energy was highest over the 20–70 Hz frequency range. The pink snapper were exposed to more than 600 airgun discharges during the study. In some individual fish, the sensory epithelium of the inner ear sustained extensive damage as indicated by ablated hair cells. Damage was more extensive in fish examined 58 days post-exposure compared to those examined 18 h post-exposure. There was no evidence of repair or replacement of damaged sensory cells up to 58 days post-exposure. McCauley et al. (2000a,b, 2003) included the following caveats in the study reports: (1) fish were caged and unable to swim away from the seismic source, (2) only one species of fish was examined, (3) the impact on the ultimate survival of the fish is unclear, and (4) airgun exposure specifics required to cause the observed damage were not obtained (i.e., a few high SPL signals or the cumulative effect of many low to moderate SPL signals).
The fish exposed to sound from a single airgun in this study (i.e., pink snapper and trevally Pseudocaranx dentex) also exhibited startle responses to short range start up and high-level airgun signals (i.e., with received SPLs of 182 to 195 dB re 1 µParms (McCauley et al. 2000a,b; Fewtrell and McCauley 2012). Smaller fish were more likely to display a startle response. Responses were observed above received SPLs of 156 to 161 dB re 1 µParms. The occurrence of both startle response (classic C-turn response) and alarm responses (e.g., darting movements, flash school expansion, fast swimming) decreased over time. Other observations included downward distributional shift that was restricted by the 10 m x 6 m x 3 m cages, increase in swimming speed, and the formation of denser aggregations. Fish behavior appeared to return to pre-exposure state 15–30 min after cessation of seismic firing.
Pearson et al. (1992) investigated the effects of seismic airgun sound on the behavior of captive rockfishes (Sebastes sp.) exposed to the sound of a single stationary airgun at a variety of distances. The airgun used in the study had a source SPL at 1 m of 223 dB re 1 µPa · m0-p, and measured received SPLs ranged from 137 to 206 dB re 1 µPa0-p. The authors reported that rockfishes reacted to the airgun sounds by exhibiting varying degrees of startle and alarm responses, depending on the species of rockfish and the received SPL. Startle responses were observed at a minimum received SPL of 200 dB re 1 µPa0-p, and alarm responses occurred at a minimum received SPL of 177 dB re 1 µPa0-p. Other observed behavioral changes included the tightening of schools, downward distributional shift, and random movement and orientation. Some fishes ascended in the water column and commenced to mill (i.e., “eddy”) at increased speed, while others descended to the bottom of the enclosure and remained motionless. Pre-exposure behavior was reestablished from 20 to 60 min after cessation of seismic airgun discharge. Pearson et al. (1992) concluded that received SPL thresholds for overt

Appendix F: Airgun Sounds on Fishes
Shelburne Basin 3-D Seismic Survey Environmental Assessment 4
rockfish behavioral response and more subtle rockfish behavioral response are 180 dB re 1 µPa0-p and 161 dB re 1 µPa0-p, respectively.
Using an experimental hook and line fishery approach, Skalski et al. (1992) studied the potential effects of seismic airgun sound on the distribution and catchability of rockfishes. The source SPL of the single airgun used in the study was 223 dB re 1 µPa · m 0-p, and the received SPLs at the bases of the rockfish aggregations ranged from 186 to 191 dB re 1 µPa0-p. Characteristics of the fish aggregations were assessed using echosounders. During long-term stationary seismic airgun discharge, there was an overall downward shift in fish distribution. The authors also observed a significant decline in total catch of rockfishes during seismic discharge. It should be noted that this experimental approach was quite different from an actual seismic survey, in that duration of exposure was much longer.
In another study, caged European sea bass (Dicentrarchus labrax) were exposed to multiple discharges from a moving seismic airgun array with a source SPL of about 256 dB re 1 µPa · m 0-p (unspecified measure type) (Santulli et al. 1999). The airguns were discharged every 25 s during a 2-h period. The minimum distance between fish and seismic source was 180 m. The authors did not indicate any observed pathological injury to the sea bass. Blood was collected from both exposed fish (6 h post-exposure) and control fish (6 h pre-exposure) and subsequently analyzed for cortisol, glucose, and lactate levels. Levels of cortisol, glucose, and lactate were significantly higher in the sera of exposed fish compared to sera of control fish. The elevated levels of all three chemicals returned to pre-exposure levels within 72 h of exposure (Santulli et al. 1999).
Santulli et al. (1999) also used underwater video cameras to monitor fish response to seismic airgun discharge. Resultant video indicated slight startle responses by some of the sea bass when the seismic airgun array discharged as far as 2.5 km from the cage. The proportion of sea bass that exhibited startle response increased as the airgun sound source approached the cage. Once the seismic array was within 180 m of the cage, the sea bass were densely packed at the middle of the enclosure, exhibiting random orientation, and appearing more active than they had been under pre-exposure conditions. Normal behavior resumed about 2 h after airgun discharge nearest the fish (Santulli et al. 1999).
Boeger et al. (2006) reported observations of coral reef fishes in field enclosures before, during and after exposure to seismic airgun sound. This Brazilian study used an array of eight airguns that was presented to the fishes as both a mobile sound source and a static sound source. Minimum distances between the sound source and the fish cage ranged from 0 to 7 m. Received sound levels were not reported by Boeger et al. (2006). Neither mortality nor external damage to the fishes was observed in any of the experimental scenarios. Most of the airgun array discharges resulted in startle responses although these behavioral changes lessened with repeated exposures, suggesting habituation.
Chapman and Hawkins (1969) investigated the reactions of free ranging whiting (silver hake), Merluccius bilinearis, to an intermittently discharging stationary airgun with a source SPL of 220 dB re 1 µPa · m0-p. Received SPLs were estimated to be 178 dB re 1 µPa0-p. The whiting were monitored with an echosounder. Prior to any airgun discharge, the fish were located at a depth range of 25 to 55 m. In apparent response to the airgun sound, the fish descended, forming a compact layer at depths greater than 55 m. After an hour of exposure to the airgun sound, the fish appeared to have habituated as indicated by their return to the pre-exposure depth range, despite the continuing airgun discharge. Airgun discharge ceased for a time and upon its resumption, the fish again descended to greater depths, indicating only temporary habituation.
Hassel et al. (2003, 2004) studied the potential effects of exposure to airgun sound on the behavior of captive lesser sandeel, Ammodytes marinus. Depth of the study enclosure used to hold the sandeel was about 55 m. The moving airgun array had an estimated source SPL of 256 dB re 1 µPa · m (unspecified measure type). Received SPLs were not measured. Exposures were conducted over a 3-day period in a 10 km × 10 km area with the cage at its center. The distance between airgun array and fish cage ranged from 55 m when the array was
Appendix F: Airgun Sounds on Fishes
Shelburne Basin 3-D Seismic Survey Environmental Assessment 5
overhead to 7.5 km. No mortality attributable to exposure to the airgun sound was noted. Behavior of the fish was monitored using underwater video cameras, echosounders, and commercial fishery data collected close to the study area. The approach of the seismic vessel appeared to cause an increase in tail-beat frequency although the sandeels still appeared to swim calmly. During seismic airgun discharge, many fish exhibited startle responses, followed by flight from the immediate area. The frequency of occurrence of startle response seemed to increase as the operating seismic array moved closer to the fish. The sandeels stopped exhibiting the startle response once the airgun discharge ceased. The sandeel tended to remain higher in the water column during the airgun discharge, and none of them were observed burying themselves in the soft substrate. The commercial fishery catch data were inconclusive with respect to behavioral effects.
Various species of demersal fishes, blue whiting, and some small pelagic fishes were exposed to a moving seismic airgun array with a source SPL of about 250 dB re 1 µPa · m (unspecified measure type) (Dalen and Knutsen 1986). Received SPLs estimated using the assumption of spherical spreading ranged from 200 to 210 dB re 1 µPa (unspecified measure type). Seismic sound exposures were conducted every 10 s during a one week period. The authors used echosounders and sonars to assess the pre- and post-exposure fish distributions. The acoustic mapping results indicated a significant decrease in abundance of demersal fish (36%) after airgun discharge but comparative trawl catches did not support this. Non-significant reductions in the abundances of blue whiting and small pelagic fish were also indicated by post-exposure acoustic mapping.
La Bella et al. (1996) studied the effects of exposure to seismic airgun sound on fish distribution using echosounder monitoring and changes in catch rate of hake by trawl, and clupeoids by gill netting. The seismic array used was composed of 16 airguns and had a source SPL of 256 dB re 1 µPa · m 0-p The shot interval was 25 s, and exposure durations ranged from 4.6 to 12 h. Horizontal distributions did not appear to change as a result of exposure to seismic discharge, but there was some indication of a downward shift in the vertical distribution. The catch rates during experimental fishing did not differ significantly between pre- and post-seismic fishing periods.
Wardle et al. (2001) used video and telemetry to make behavioral observations of marine fishes (primarily juvenile saithe, adult pollock, juvenile cod, and adult mackerel) inhabiting an inshore reef off Scotland before, during, and after exposure to discharges of a stationary airgun. The received SPLs ranged from about 195 to 218 dB re 1 µPa0-p. Pollock did not move away from the reef in response to the seismic airgun sound, and their diurnal rhythm did not appear to be affected. However, there was an indication of a slight effect on the long-term day-to-night movements of the pollock. Video camera observations indicated that fish exhibited startle responses (“C-starts”) to all received levels. There were also indications of behavioral responses to visual stimuli. If the seismic source was visible to the fish, they fled from it. However, if the source was not visible to the fish, they often continued to move toward it.
The potential effects of exposure to seismic sound on fish abundance and distribution were also investigated by Slotte et al. (2004). Twelve days of seismic survey operations spread over a period of 1 month used a seismic airgun array with a source SPL of 222.6 dB re 1 µPa · mp-p. The SPLs received by the fish were not measured. Acoustic surveys of the local distributions of various kinds of pelagic fish, including herring, blue whiting, and mesopelagic species, were conducted during the seismic surveys. There was no strong evidence of short-term horizontal distributional effects. With respect to vertical distribution, blue whiting and mesopelagics were distributed deeper (20 to 50 m) during the seismic survey compared to pre-exposure. The average densities of fish aggregations were lower within the seismic survey area, and fish abundances appeared to increase in accordance with increasing distance from the seismic survey area.
Fertilized capelin (Mallotus villosus) eggs and monkfish (Lophius americanus) larvae were exposed to seismic airgun sound and subsequently examined and monitored for possible effects of the exposure (Payne et al. 2009). The laboratory exposure studies involved a single airgun. Approximate received SPLs measured in the capelin egg and monkfish larvae exposures were 199 to 205 dB re 1 µPap-p and 205 dB re 1 µPap-p, respectively.

Appendix F: Airgun Sounds on Fishes
Shelburne Basin 3-D Seismic Survey Environmental Assessment 6
The capelin eggs were exposed to either 10 or 20 airgun discharges, and the monkfish larvae were exposed to either 10 or 30 discharges. No statistical differences in mortality/morbidity between control and exposed subjects were found at 1 to 4 days post-exposure in any of the exposure trials for either the capelin eggs or the monkfish larvae.
In uncontrolled experiments, Kostyvchenko (1973) exposed the eggs of numerous fish species (anchovy, red mullet, crucian carp, blue runner) to various sound sources, including seismic airguns. With the seismic airgun discharge as close as 0.5 m from the eggs, over 75% of them survived the exposure. Egg survival rate increased to over 90% when placed 10 m from the airgun sound source. The range of received SPLs was about 215 to 233 dB re 1 µPa0-p.
Eggs, yolk sac larvae, post-yolk sac larvae, post-larvae, and fry of various commercially important fish species (cod, saithe, herring, turbot, and plaice) were exposed to received SPLs ranging from 220 to 242 dB re 1 µPa (unspecified measure type) (Booman et al. 1996). These received levels corresponded to exposure distances ranging from 0.75 to 6 m. The authors reported some cases of injury and mortality but most of these occurred as a result of exposures at very close range (i.e., <15 m). The rigor of anatomical and pathological assessments was questionable.
Saetre and Ona (1996) applied a “worst-case scenario” mathematical model to investigate the effects of seismic sound on fish eggs and larvae. They concluded that mortality rates caused by exposure to seismic airgun sound are so low compared to the natural mortality that the impact of seismic surveying on recruitment to a fish stock must be regarded as insignificant.
Freshwater Fishes
Popper et al. (2005) tested the hearing sensitivity of three Mackenzie River fish species after exposure to five discharges from a seismic airgun. The mean received peak SPL was 205 to 209 dB re 1 µPa per discharge, and the approximate mean received SEL was 176 to 180 dB re 1 µPa2 · s per discharge. While the broad whitefish showed no Temporary Threshold Shift (TTS) as a result of the exposure, adult northern pike and lake chub exhibited TTSs of 10 to 15 dB, followed by complete recovery within 24 h of exposure. The same animals were also examined to determine whether there were observable effects on the sensory cells of the inner ear as a result of exposure to seismic sound (Song et al. 2008). No damage to the ears of the fishes was found, including those that exhibited TTS.
In another part of the same Mackenzie River project, Jorgenson and Gyselman (2009) investigated the behavioral responses of arctic riverine fishes to seismic airgun sound. They used hydroacoustic survey techniques to determine whether fish behavior upon exposure to airgun sound can either mitigate or enhance the potential impact of the sound. The study indicated that fish behavioral characteristics were generally unchanged by the exposure to airgun sound. The tracked fish did not exhibit herding behavior in front of the mobile airgun array and, therefore, were not exposed to sustained high sound levels.
Anadromous Fishes
In uncontrolled experiments using a very small sample of different groups of young salmonids, including Arctic cisco, fish were caged and exposed to various types of sound. One sound type was either a single firing or a series of four firings 10 to 15 s apart of a 300-in3 seismic airgun at 2000 to 2200 psi (Falk and Lawrence 1973). Swim bladder damage was reported but no mortality was observed when fish were exposed within 1 to 2 m of an airgun source with source level, as estimated by Turnpenny and Nedwell (1994), of ~230 dB re 1 µPa · m (unspecified measure).
Thomsen (2002) exposed rainbow trout and Atlantic salmon held in aquaculture enclosures to the sounds from a small airgun array. Received SPLs were 142 to 186 dB re 1 µPap-p. The fish were exposed to 124 pulses over a 3-day period. In addition to monitoring fish behavior with underwater video cameras, the authors also

Appendix F: Airgun Sounds on Fishes
Shelburne Basin 3-D Seismic Survey Environmental Assessment 7
analyzed cod and haddock catch data from a longline fishing vessel operating in the immediate area. Only eight of the 124 shots appeared to evoke behavioral reactions by the salmonids, but overall impacts were minimal. No fish mortality was observed during or immediately after exposure. The author reported no significant effects on cod and haddock catch rates, and the behavioral effects were hard to differentiate from normal behavior.
Weinhold and Weaver (1972, cited in Turnpenny et al. 1994) exposed caged coho salmon smolts to impulses from 330 and 660-in3 airguns at distances ranging from 1 to 10 m, resulting in received levels estimated at ~214 to 216 dB (units not given). No lethal effects were observed.
It should be noted that, in a recent and comprehensive review, Hastings and Popper (2005) take issue with many of the authors cited above for problems with experimental design and execution, measurements, and interpretation. Hastings and Popper (2005) deal primarily with possible effects of pile-driving sounds (which, like airgun sounds, are impulsive and repetitive). However, that review provides an excellent and critical review of the impacts to fish from other underwater anthropogenic sounds.
Indirect Effects on Fisheries
The most comprehensive experimentation on the effects of seismic airgun sound on catchability of fishes was conducted in the Barents Sea by Engås et al. (1993, 1996). They investigated the effects of seismic airgun sound on distributions, abundances, and catch rates of cod and haddock using acoustic mapping and experimental fishing with trawls and longlines. The maximum source SPL was about 248 dB re 1 µPa · m 0-p based on back-calculations from measurements collected via a hydrophone at depth 80 m. No measurements of the received SPLs were made. Davis et al. (1998) estimated the received SPL at the sea bottom immediately below the array and at 18 km from the array to be 205 dB re 1 µPa0-p and 178 dB re 1 µPa0-p, respectively. Engås et al. (1993, 1996) concluded that there were indications of distributional change during and immediately following the seismic airgun discharge (45 to 64% decrease in acoustic density according to sonar data). The lowest densities were observed within 9.3 km of the seismic discharge area. The authors indicated that trawl catches of both cod and haddock declined after the seismic operations. While longline catches of haddock also showed decline after seismic airgun discharge, those for cod increased.
Løkkeborg (1991), Løkkeborg and Soldal (1993), and Dalen and Knutsen (1986) also examined the effects of seismic airgun sound on demersal fish catches. Løkkeborg (1991) examined the effects on cod catches. The source SPL of the airgun array used in his study was 239 dB re 1 µPa · m (unspecified measure type), but received SPLs were not measured. Approximately 43 h of seismic airgun discharge occurred during an 11-day period, with a five-second interval between pulses. Catch rate decreases ranging from 55 to 80% within the seismic survey area were observed. This apparent effect persisted for at least 24 h within about 10 km of the survey area.
Løkkeborg et al. (2012) described a 2009 study of the effect of seismic sound on commercial fishes. Both gillnet and longline vessels fished for Greenland halibut, redfish, saithe and haddock for 12 days before the onset of seismic surveying, 38 days during seismic surveying, and 25 days after cessation of seismic surveying. Acoustic surveying was also conducted during these times. Gillnet catches of Greenland halibut and redfish increased during seismic operations and remained higher after cessation of seismic surveying than they had been before the onset of seismic surveying. Longline catches of Greenland halibut decreased during seismic operations but increased again after the seismic surveying was completed. Gillnet catches of saithe decreased during seismic operations and remained low during the 25 day period following the seismic surveying. Longline catches of haddock before and during seismic operations were not significantly different although catches did decline as the seismic vessel approached the fishing area. The haddock fishery was conducted in an area with lower esonification compared to the fishery areas of the other three species. Acoustic surveys showed that the saithe had partly left the area, perhaps in response to the seismic operations, while the distributional changes of the other

Appendix F: Airgun Sounds on Fishes
Shelburne Basin 3-D Seismic Survey Environmental Assessment 8
three species were not observed. Løkkeborg et al. (2012) suggested that an increase in swimming activity as a result of exposure to seismic sound might explain why gillnet catches increased and longline catches decreased.
Turnpenny et al. (1994) examined results of these studies as well as the results of other studies on rockfish. They used rough estimations of received SPLs at catch locations and concluded that catchability is reduced when received SPLs exceed 160 to 180 dB re 1 µPa0-p. They also concluded that reaction thresholds of fishes lacking a swim bladder (e.g., flatfish) would likely be about 20 dB higher. Given the considerable variability in sound transmission loss between different geographic locations, the SPLs that were assumed in these studies were likely quite inaccurate.
Turnpenny and Nedwell (1994) also reported on the effects of seismic airgun discharge on inshore bass fisheries in shallow U.K. waters (5 to 30 m deep). The airgun array used had a source level of 250 dB re 1 µPa · m0-p. Received levels in the fishing areas were estimated to be 163–191 dB re 1 µPa0-p. Using fish tagging and catch record methodologies, they concluded that there was not any distinguishable migration from the ensonified area, nor was there any reduction in bass catches on days when seismic airguns were discharged. The authors concluded that effects on fisheries would be smaller in shallow nearshore waters than in deep water because attenuation of sound is more rapid in shallow water.
Skalski et al. (1992) used a 100-in3 airgun with a source level of 223 dB re 1 µPa · m0-p to examine the potential effects of airgun sound on the catchability of rockfishes. The moving airgun was discharged along transects in the study fishing area, after which a fishing vessel deployed a set line, ran three echosounder transects, and then deployed two more set lines. Each fishing experiment lasted 1 h 25 min. Received SPLs at the base of the rockfish aggregations ranged from 186 to 191 dB re 1 µPa0-p. The catch-per-unit-effort (CPUE) for rockfish declined on average by 52.4% when the airguns were operating. Skalski et al. (1992) believed that the reduction in catch resulted from a change in behavior of the fishes. The fish schools descended towards the bottom and their swimming behavior changed during airgun discharge. Although fish dispersal was not observed, the authors hypothesized that it could have occurred at a different location with a different bottom type. Skalski et al. (1992) did not continue fishing after cessation of airgun discharge. They speculated that CPUE would quickly return to normal in the experimental area, because fish behavior appeared to normalize within minutes of cessation of airgun discharge. However, in an area where exposure to airgun sound might have caused the fish to disperse, the authors suggested that a lower CPUE might persist for a longer period.
European sea bass were exposed to sound from seismic airgun arrays with a source SPL of 262 dB re 1 µPa · m0-p
(Pickett et al. 1994). The seismic survey was conducted over a period of 4 to 5 months. The study was intended to investigate the effects of seismic airgun discharge on inshore bass fisheries. Information was collected through a tag and release program, and from the logbooks of commercial fishermen. Most of the 152 recovered fish from the tagging program were caught within 10 km of the release site, and it was suggested that most of these bass did not leave the area for a prolonged period. With respect to the commercial fishery, no significant changes in catch rate were observed (Pickett et al. 1994).
Literature Cited
Atema, J., R.R. Fay, A.N. Popper, and W.N. Tavolga. 1988. The sensory biology of aquatic animals. Springer-Boeger, W.A., M.R. Pie, A. Ostrensky, and M.F. Cardoso. 2006. The effect of exposure to seismic prospecting on coral reef fishes. Braz. J. Oceanog. 54(4):235-239.
Booman, C., J. Dalen, H. Leivestad, A. Levsen, T. van der Meeren, and K. Toklum. 1996. Effecter av luftkanonskyting på egg, larver og yngel. Fisken Og Havet 1996(3):1-83 (Norwegian with English summary).
Casper, B.M. and D.A. Mann. 2006. Evoked potential audiograms of the nurse shark (Ginglymostoma cirratum) and the yellow stingray (Urobatis jamaicensis). Envir. Biol. Fish. 76:101-108.
Casper, B.M. and D.A. Mann. 2007. The directional hearing abilities of two species of bamboo sharks. J. Exp. Biol. 210:505-511.

Appendix F: Airgun Sounds on Fishes
Shelburne Basin 3-D Seismic Survey Environmental Assessment 9
Casper, B.M. and D.A. Mann. 2009. Field hearing measurements of the Atlantic sharpnose shark Rhizoprionodon terraenovae. J. Fish Biol. 75:2768-2776.
Casper, B.M., P.S. Lobel and H.Y. Yan. 2003. The hearing sensitivity of the little skate, Raja erinacea: a comparison of two methods. Envir. Biol. Fish. 68:371-379.
Chapman, C.J. and A.D. Hawkins. 1969. The importance of sound in fish behaviour in relation to capture by trawls. FAO Fish. Rep. 62:717-729.
Collin, S.P. and N.J. Marshall (eds.). 2003. Sensory processing in aquatic environments. Springer-Verlag, New York, NY. 446 p.
Coombs, S. and J.C. Montgomery. 1999. The enigmatic lateral line system. p. 319-362 In: R.R. Fay and A.N. Popper (eds.), Comparative hearing: fish and amphibians. Springer Handbook of Auditory Research 11. Springer-Verlag, New York, NY. 438 p.
Dalen, J. and G.M. Knutsen. 1986. Scaring effects in fish and harmful effects on eggs, larvae and fry by offshore seismic explorations. Symposium on Underwater Acoustics, Halifax.
Davis, R.A., D. Thomson, and C.I. Malme. 1998. Environmental assessment of seismic exploration of the Scotian Shelf. Rep. by LGL Ltd., King City, Ont., and Charles I. Malme, Engineering and Scientific Services, Hingham, MA, for Mobil Oil Canada Properties Ltd., Shell Canada Ltd., and Imperial Oil Ltd.
Engås, A., S. Løkkeborg, A.V. Soldal, and E. Ona. 1993. Comparative trials for cod and haddock using commercial trawl and longline at two different stock levels. J. Northw. Atl. Fish. Sci. 19:83-90.
Engås, A, S. Løkkeborg, E. Ona, and A.V. Soldal. 1996. Effects of seismic shooting on local abundance and catch rates of cod (G. morhua) and haddock (M. aeglefinus). Can. J. Fish. Aquat. Sci. 53(10):2238-2249.
Falk, M.R. and M.J. Lawrence. 1973. Seismic exploration: its nature and effects on fish. Tech. Rep. Ser. CEN/T-73-9. Can. Dep. Environ., Fisheries & Marine Serv., Resource Manage. Br., Fisheries Operations Directorate, Central Region (Environment), Winnipeg, Man.
Fay, R. 2009. Soundscapes and the sense of hearing of fishes. Integr. Zool. 4(1):26-32.
Fay, R.R. and A.N. Popper. 2000. Evolution of hearing in vertebrates: The inner ears and processing. Hearing Res. 149(1):1-10.
Fay, R.R. and A.N. Popper. 2012. Fish hearing: new perspectives from two senior bioacousticians. Brain Behav. Evol. 79:215-217.
Fewtrell, J.L. and R.D. McCauley. 2012. Impact of air gun noise on the behaviour of marine fish and squid. Mar. Poll. Bull. 64(5):984-993.
Hassel, A., T. Knutsen, J. Dalen, S. Løkkeborg, K. Skaar, Ø. Østensen, E.K. Haugland, M. Fonn, Å. Høines, and O.A. Misund. 2003. Reaction of sandeel to seismic shooting: a field experiment and fishery statistics study. Institute of Marine Research, Bergen, Norway.
Hassel, A., T. Knutsen, J. Dalen, K. Skaar, S. Løkkeborg, O.A. Misund, O. Ostensen, M. Fonn, and E.K. Haugland. 2004. Influence of seismic shooting on the lesser sandeel (Ammodytes marinus). ICES J. Mar. Sci. 61(7):1165-1173.
Hastings, M.C. and A.N. Popper. 2005. Effects of sound on fish. Rep. from Jones & Stokes, Sacramento, CA, for California Department of Transportation, Sacramento, CA. 28 January.
Howard J, W.M. Roberts, and A.J. Hudspeth. 1988. Mechanoelectrical transduction by hair cells. Annu. Rev. Biophys. Chem. 17:99-124.
Hudspeth, A.J. and V.S. Markin. 1994. The ear’s gears: mechanical transduction by hair cells. Physics Today 47(2):22-28.
Jorgenson, J.K. and E.C. Gyselman. 2009. Hydroacoustic measurements of the behavioral response of arctic riverine fishes to seismic airguns. J. Acoust. Soc. Am. 126(3):1598-1606.
Kapoor, B.G. and T.J. Hara (eds.). 2001. Sensory biology of jawed fishes: new insights. Science Publishers, Inc., Enfield, NH. 404 p.

Appendix F: Airgun Sounds on Fishes
Shelburne Basin 3-D Seismic Survey Environmental Assessment 10
Kostyvchenko, L.P. 1973. Effects of elastic waves generated in marine seismic prospecting on fish eggs in the Black Sea. Hydrobiol. J. 9:45-48.
La Bella, G., S. Cannata, C. Froglia, A. Modica, S. Ratti, and G. Rivas. 1996. First assessment of effects of air-gun seismic shooting on marine resources in the Central Adriatic Sea. p. 227-238 In: Society of Petroleum Engineers, Intern. Conf. on Health, Safety and Environ., New Orleans, LA, 9-12 June.
Ladich, F. and A.N. Popper. 2004. Parallel evolution in fish hearing organs. p. 95-127 In: G.A. Manley, A.N. Popper, and R.R. Fay (eds.), Evolution of the vertebrate auditory system. Springer-Verlag, New York, NY. 415 p.
Leis, J.M. and M.M. Lockett. 2005. Localization of reef sounds by settlement-stage larvae of coral-reef fishes (Pomacentridae). Bull. Mar. Sci. 76:715–724.
Leis, J.M., B.M. Carson-Ewart, A.C. Hay and D.H. Cato. 2003. Coral-reef sounds enable nocturnal navigation by some reef-fish larvae in some places and at some times. J. Fish. Biol. 63:727–737.
Løkkeborg, S. 1991. Effects of geophysical survey on catching success in longline fishing. Paper presented at Intern. Council for the Exploration of the Sea (ICES) Annual Science Conf. ICES CM B 40:1-9.
Løkkeborg, S. and A.V. Soldal. 1993. The influence of seismic explorations on cod (Gadus morhua) behaviour and catch rates. ICES Mar. Sci. Symp. 196:62-67.
Løkkeborg, S., E. Ona, A. Vold and A. Salthaug. 2012. Sounds from seismic air guns: gear- and species-specific effects on catch rates and fish distribution. Can. J. Fish. Aquat. Sci. 69:1278-1291.
Mann, D.A., Z. Lu, and A.N. Popper. 1997. A clupeid fish can detect ultrasound. Nature 389(6649):341.
Mann, D.A., Z. Lu, M.C. Hastings, and A.N. Popper. 1998. Detection of ultrasonic tones and simulated dolphin echolocation clicks by a teleost fish, the American shad (Alosa sapidissima). J. Acoust. Soc. Am. 104(1):562-568.
Mann, D.A., D.M. Higgs, W.N. Tavolga, M.J. Souza, and A.N. Popper. 2001. Ultrasound detection by clupeiform fishes. J. Acoust. Soc. Am. 109(6):3048-3054.
McCauley, R.D., J. Fewtrell, A.J. Duncan, C. Jenner, M.-N. Jenner, J.D. Penrose, R.I.T. Prince, A. Adhitya, J. Murdoch, and K. McCabe. 2000a. Marine seismic surveys: analysis of airgun signals; and effects of air gun exposure on humpback whales, sea turtles, fishes and squid. Rep. from Centre for Marine Science and Technology, Curtin University, Perth, WA, for Australian Petroleum Production Association, Sydney, NSW.
McCauley, R.D., J. Fewtrell, A.J. Duncan, C. Jenner, M.-N. Jenner, J.D. Penrose, R.I.T. Prince, A. Adhitya, J. Murdoch, and K. McCabe. 2000b. Marine seismic surveys – a study of environmental implications. APPEA J. 40:692-706.
McCauley, R.D., J. Fewtrell, and A.N. Popper. 2003. High intensity anthropogenic sound damages fish ears. J. Acoust. Soc. Am. 113(1):638-642.
Payne, J.F., J. Coady, and D. White. 2009. Potential effects of seismic airgun discharges on monkfish eggs (Lophius americanus) and larvae. Environ. Stud. Res. Funds Rep. 170. St. John’s, NL. 35 p.
Pearson, W.H., J.R. Skalski, and C.I. Malme. 1992. Effects of sounds from a geophysical survey device on behavior of captive rockfish (Sebastes spp.). Can. J. Fish. Aquat. Sci. 49(7):1343-1356.
Pickett, G.D., D.R. Eaton, R.M.H. Seaby, and G.P. Arnold. 1994. Results of bass tagging in Poole Bay during 1992. Laboratory Leaflet Number 74. Ministry of Agriculture, Fisheries and Food, Directorate of Fisheries Research, Lowestoft, UK.
Popper, A.N. 2009. Are we drowning out fish in a sea of noise? Marine Scientist 27:18-20.
Popper, A.N. and R.R. Fay. 1993. Sound detection and processing by fish: critical review and major research questions. Brain Behav. Evol. 41(1):14-38.
Popper, A.N. and R.R. Fay. 1999. The auditory periphery in fishes. p. 43-100 In: R.R. Fay and A.N. Popper (eds.), Comparative hearing: fish and amphibians. Springer-Verlag, New York, NY. 438 p.
Popper, A.N. and M.C. Hastings. 2009a. The effects of human-generated sound on fish. Integr. Zool. 4(1):43-52.
Popper, A.N. and M.C. Hastings. 2009b. The effects of anthropogenic sources of sound on fishes. J. Fish Biol. 75(3):455-489.

Appendix F: Airgun Sounds on Fishes
Shelburne Basin 3-D Seismic Survey Environmental Assessment 11
Popper, A.N. and R.R. Fay. 2011. Rethinking sound detection by fishes. Hear. Res. 273(1-2):25-36.
Popper, A.N., M.E. Smith, P.A. Cott, B.W. Hanna, A.O. MacGillivray, M.E. Austin, and D.A. Mann. 2005. Effects of exposure to seismic airgun use on hearing of three fish species. J. Acoust. Soc. Am. 117(6):3958-3971.
Saetre, R. and E. Ona. 1996. Seismiske undersøkelser og skader på fiskeegg og -larver en vurdering av mulige effekter pa bestandsniv. [Seismic investigations and damages on fish eggs and larvae; an evaluation of possible effects on stock level] Fisken og Havet 1996:1-17, 1-8. (in Norwegian with English summary).
Sand, O. 1981. The lateral line and sound reception. p. 459-478 In: W.N. Tavolga, A.N. Popper, and R.R. Fay (eds.), Hearing and sound communication in fishes. Springer-Verlag, New York, NY.
Santulli, A., C. Messina, L. Ceffa, A. Curatolo, G. Rivas, G. Fabi, and V. Damelio. 1999. Biochemical responses of European sea bass (Dicentrachus labrax) to the stress induced by offshore experimental seismic prospecting. Mar. Poll. Bull. 38(12):1105-1114.
Simpson, S.D., M.G. Meekan, J.C. Montgomery, R.D. McCauley and A. Jeffs. 2005. Homeward sound. Science 308:221.
Skalski, J.R., W.H. Pearson, and C.I. Malme. 1992. Effects of sounds from a geophysical survey device on catch-per-unit-effort in a hook-and-line fishery for rockfish (Sebastes spp.). Can. J. Fish. Aquat. Sci. 49(7):1357-1365.
Slotte, A., K. Hansen, J. Dalen, and E. Ona. 2004. Acoustic mapping of pelagic fish distribution and abundance in relation to a seismic shooting area off the Norwegian west coast. Fish. Res. 67(2):143-150.
Song, J., D.A. Mann, P.A. Cott, B.W. Hanna, and A.N. Popper. 2008. The inner ears of Northern Canadian freshwater fishes following exposure to seismic air gun sounds. J. Acoust. Soc. Am. 124(2):1360-1366.
Thomsen, B. 2002. An experiment on how seismic shooting affects caged fish. Thesis, Faroese Fisheries Laboratory, University of Aberdeen, Aberdeen, Scotland. 16 August.
Tolimieri, N., O. Haine, A. Jeffs, R.D. McCauley and J.C. Montgomery. 2004. Directional orientation of pomacentrid larvae to ambient reef sound. Coral Reefs 23:184–19.
Turnpenny, A.W.H. and J.R. Nedwell. 1994. Consultancy Report: The effects on marine fish, diving mammals and birds of underwater sound generated by seismic surveys. FCR 089/94. Rep. from Fawley Aquatic Research Laboratories Ltd. for U.K. Offshore Operators Association (UKOOA).
Turnpenny, A.W.H., K.P. Thatcher, and J.R. Nedwell. 1994. Research report: the effects on fish and other marine animals of high-level underwater sound. FRR 127/94. Rep. from Fawley Aquatic Research Laboratories, Ltd. for the Defence Research Agency.
Wardle, C.S., T.J. Carter, G.G. Urquhart, A.D.F. Johnstone, A.M. Ziolkowski, G. Hampson, and D. Mackie. 2001. Effects of seismic airguns on marine fish. Cont. Shelf Res. 21(8-10):1005-1027.
Wright, K.J., D.M. Higgs, D.H. Cato and J.M. Leis. 2010. Auditory sensitivity in settlement-stage larvae of coral reef fishes. Coral Reefs 29: 235-243.


Appendix G: Airgun Sounds on Marine Invertebrates
Shelburne Basin 3-D Seismic Survey Environmental Assessment 1
APPENDIX G:
REVIEW OF POTENTIAL EFFECTS OF AIRGUN SOUNDS
ON MARINE INVERTEBRATES
This review provides a detailed summary of the limited data and literature available on the potential effects of exposure to airgun sound on marine invertebrates. Specific conditions and results of the studies, including sound exposure levels and sound thresholds of responses, are discussed if available.
Sound caused by underwater seismic survey equipment results in energy pulses with very high peak pressures (Richardson et al. 1995). This was especially true when chemical explosives were used for underwater surveys. Virtually all underwater seismic surveying conducted today uses airguns which typically have lower peak pressures and longer rise times than chemical explosives. However, sound levels from underwater airgun discharges might still be high enough to potentially injure or kill animals located close to the source. Less overt than physical effects are the disturbances to normal behaviours that animals exposed to airgun sound may experience. The following sections provide an overview of sound production and detection in marine invertebrates, and information on the effects of exposure to sound on marine invertebrates, with an emphasis on seismic survey sound. The information includes results of studies of varying degrees of scientific veracity as well as anecdotal information. Fisheries and Oceans Canada has published two internal documents that provide a literature review of the effects of seismic and other underwater sound on invertebrates (Moriyasu et al. 2004; Payne et al. 2008).
Acoustic Capabilities
Sound Production
Much of the available information on acoustic abilities of marine invertebrates pertains to crustaceans, specifically lobsters, crabs and shrimps. Other acoustic-related studies have been conducted on cephalopods. Many invertebrates are capable of producing sound, including barnacles, amphipods, shrimp, crabs, and lobsters (Au and Banks 1998; Tolstoganova 2002). Invertebrates typically produce sound by scraping or rubbing various parts of their bodies, although they also produce sound in other ways. Sounds made by marine invertebrates may be associated with territorial behaviour, mating, courtship, and aggression. On the other hand, some of these sounds may be incidental and not have any biological relevance. Sounds known to be produced by marine invertebrates have frequencies ranging from 87 Hz to 200 kHz, depending on the species.
Both male and female American lobsters produce a buzzing vibration with their carapace when grasped (Pye and Watson III 2004; Henninger and Watson III 2005). Larger lobsters vibrate more consistently than smaller lobsters, suggesting that sound production may be involved with mating behaviour. Sound production by other species of lobsters has also been studied (Buscaino et al. 2011). Among deep-sea lobsters, sound level was more variable at night than during the day, with the highest levels occurring at the lowest frequencies.
While feeding, king crab produce impulsive sounds that appear to stimulate movement by other crabs, including approach behaviour (Tolstoganova 2002). King crab also appeared to produce ‘discomfort’ sounds when environmental conditions were manipulated. These discomfort sounds differ from the feeding sounds in terms of frequency range and pulse duration.
Snapping shrimp (Synalpheus parneomeris) are among the major sources of biological sound in temperate and tropical shallow-water areas (Au and Banks 1998). By rapidly closing one of its frontal chela (claws), a snapping shrimp generates a forward jet of water and the cavitation of fast moving water produces a sound. Both the sound and the jet of water may function as both offensive and defensive means in feeding and territorial behaviours of alpheidae shrimp. Measured source sound pressure levels (SPLs) for snapping ship were 183-189 dB re 1 µPa·mp-p and extended over a frequency range of 2–200 kHz.

Appendix G: Airgun Sounds on Marine Invertebrates
Shelburne Basin 3-D Seismic Survey Environmental Assessment 2
Sound Detection
There is considerable debate about the hearing capabilities of aquatic invertebrates. Whether they are able to hear or not depends on how underwater sound and underwater hearing are defined. In contrast to fish and aquatic mammals, no physical structures have been discovered in aquatic invertebrates that are stimulated by the pressure component of sound. However, vibrations (i.e., mechanical disturbances of the water) are also characteristic of sound waves. Rather than being pressure-sensitive, aquatic invertebrates appear to be most sensitive to the vibrational component of sound (Breithaupt 2002). Statocyst organs may provide one means of vibration detection for aquatic invertebrates.
More is known about the acoustic detection capabilities in decapod crustaceans than in any other marine invertebrate group although cephalopod capability is now becoming a focus of study. Crustaceans appear to be most sensitive to sounds of low frequencies, i.e., <1000 Hz (Budelmann 1992; Popper et al. 2001). A study by Lovell et al. (2005) suggests greater sensitivity of the prawn (Palaemon serratus) to low-frequency sound than previously thought. Lovell et al. (2006) showed that P. serratus is capable of detecting a 500 Hz tone regardless of its body size and the related number and size of statocyst hair cells. Studies involving American lobster suggest that these crustaceans are more sensitive to higher frequency sounds than previously realized (Pye and Watson III 2004).
It is possible that statocyst hair cells of cephalopods are directionally sensitive in a way that is similar to the responses of hair cells of the vertebrate vestibular and lateral line systems (Budelmann and Williamson 1994; Budelmann 1996). Kaifu et al. (2008) provided evidence that the cephalopod Octopus ocellatus detects particle motion with its statocyst. Studies by Packard et al. (1990), Rawizza (1995), Komak et al. (2005) and Mooney et al. (2010) have tested the sensitivities of various cephalopods to water-borne vibrations, some of which were generated by low-frequency sound. Using the auditory brainstem response (ABR) approach, Hu et al. (2009) showed that auditory evoked potentials can be obtained in the frequency ranges 400 to 1,500 Hz for the squid Sepiotheutis lessoniana and 400 to 1,000 Hz for the octopus Octopus vulgaris, higher than frequencies previously observed to be detectable by cephalopods.
Recently, Vermeij et al. (2010) studied the movement of coral larvae in the laboratory and concluded that these larvae are able to detect and respond to underwater sound. This is the first description of an auditory response in the invertebrate phylum Cnidaria. The authors speculate that coral larvae may use reef noise as a cue for orientation.
In summary, only a few studies have been conducted on the sensitivity of certain invertebrate species to underwater sound. Available data suggest that they are capable of detecting vibrations but they do not appear to be capable of detecting pressure fluctuations.
Potential Effects
There are three categories of potential effects of exposure to sound on marine invertebrates: pathological, physiological, and behavioural. Pathological effects include lethal and sub-lethal injury to the animals, physiological effects include temporary primary and secondary stress responses, and behavioural effects refer to changes in exhibited behaviours (i.e., disturbance). The three categories should not be considered as independent of one another and are likely interrelated in complex ways.
Pathological Effects
In water, acute injury or death of organisms as a result of exposure to sound appears to depend on two features of the sound source: (1) received peak pressure, and (2) time required for the pressure to rise and decay. Generally, the higher the received pressure and the less time it takes for the pressure to rise and decay, the greater the chance of acute pathological effects. Considering the peak pressure and rise/decay time characteristics of

Appendix G: Airgun Sounds on Marine Invertebrates
Shelburne Basin 3-D Seismic Survey Environmental Assessment 3
seismic airgun arrays used today, the associated pathological zone for invertebrates would be expected to be small (i.e., within a few meters of the seismic source). Few studies have assessed the potential for pathological effects on invertebrates from exposure to seismic sound.
The pathological impacts of seismic survey sound on marine invertebrates were investigated in a pilot study on snow crabs (Christian et al. 2003, 2004). Under controlled field experimental conditions, captive adult male snow crabs, egg-carrying female snow crabs, and fertilized snow crab eggs were exposed to variable SPLs (191–221 dB re 1 µPa0-p) and sound energy levels (SELs) (<130–187 dB re 1 µPa2·s). Neither acute nor chronic (12 weeks post-exposure) mortality was observed for the adult crabs. There was a significant difference in development rate noted between the exposed and unexposed fertilized eggs/embryos. The egg mass exposed to seismic energy had a higher proportion of less-developed eggs than the unexposed mass. It should be noted that both egg masses came from a single female and any measure of natural variability was unattainable (Christian et al. 2003, 2004).
Another study of the effects of seismic survey sound on marine invertebrates had serious design problems that impacted the interpretation of some of the results (Chadwick 2004). In 2003, a collaborative study was conducted in the southern Gulf of St. Lawrence, Canada, to investigate the effects of exposure to sound from a commercial seismic survey on egg-bearing female snow crabs (DFO 2004). Caged animals were placed on the ocean bottom at a location within the survey area and at a location outside of the survey area. The maximum received SPL was ~195 dB re 1 µPa0-p. The crabs were exposed for 132 hr of the survey, equivalent to thousands of seismic shots of varying received SPLs. The animals were retrieved and transferred to laboratories for analyses. Neither acute nor chronic lethal or sub-lethal injury to the female crabs or crab embryos was indicated. DFO (2004) reported that some exposed individuals had short-term soiling of gills, antennules, and statocysts, bruising of the hepatopancreas and ovary, and detached outer membranes of oocytes. However, these differences could not be conclusively linked to exposure to seismic survey sound. Boudreau et al. (2009) presented the proceedings of a workshop held to evaluate the results of additional studies conducted to answer some questions arising from the original study discussed in DFO (2004). Proceedings of the workshop did not include any more definitive conclusions regarding the original results.
Payne et al. (2007) recently conducted a pilot study of the effects of exposure to seismic sound on various health endpoints of the American lobster (Homarus americanus). Adult lobsters were exposed either 20 to 200 times to 202 dB re 1μPa p-p or 50 times to 227 dB re 1μPa p-p, and then monitored for changes to survival, food consumption, turnover rate, serum protein level, serum enzyme levels, and serum calcium level. Observations were made over a period of a few days to several months. Results indicated no effects on delayed mortality or damage to the mechanosensory systems associated with animal equilibrium and posture (as assessed by turnover rate).
In a field study, Pearson et al. (1994) exposed Stage II larvae of the Dungeness crab to single discharges from a seven-airgun array and compared their mortality and development rates with those of unexposed larvae. For immediate and long-term survival and time to molt, this study did not reveal any statistically significant differences between the exposed and unexposed larvae, even those exposed within 1 m of the seismic source.
In 2001 and 2003, there were two incidents of multiple strandings of the giant squid on the north coast of Spain, and there was speculation that they were caused by exposure to geophysical seismic survey sounds occurring at about the same time in the Bay of Biscay (Guerra et al. 2004). A total of nine giant squid, either stranded or moribund surface-floating, were collected at these times. However, Guerra et al. (2004) did not present any evidence that conclusively links the giant squid strandings and floaters to seismic activity in the area. Based on necropsies of seven (six females and one male) specimens, there was evidence of acute tissue damage. The authors speculated that one female with extensive tissue damage was affected by the impact of acoustic waves. However, little is known about the impact of marine acoustic technology on cephalopods and the authors did not describe the seismic sources, locations, and durations of the Bay of Biscay surveys. In addition, there

Appendix G: Airgun Sounds on Marine Invertebrates
Shelburne Basin 3-D Seismic Survey Environmental Assessment 4
were no controls, the presence of seismic activity was entirely circumstantial, and the examined animals had been dead long enough for commencement of tissue degradation.
Caged cephalopods (Sepioteuthis australis) were exposed to noise from a single 20-in3 airgun with maximum SPLs of >200 dB re 1 µPa0-p (McCauley et al. (2000a,b; Fewtrell and McCauley 2012). Statocysts were removed and preserved, but results of the statocyst analyses were not reported. No squid mortalities were reported as a result of these exposures.
Physiological Effects
Biochemical responses by marine invertebrates to acoustic stress have also been studied. The study of the biochemical parameters influenced by acoustic stress could possibly provide some indication of the acute extent of the stress and perhaps any subsequent chronic detrimental effects. Stress could potentially affect animal populations by reducing reproductive capacity and adult abundance.
Stress indicators in the haemolymph of adult male snow crabs were monitored immediately after exposure of the animals to seismic survey sound (Christian et al. 2003, 2004) and at various intervals after exposure. No significant acute or chronic differences between exposed and unexposed animals in terms of the stress indicators (e.g., proteins, enzymes, cell type count) were observed.
Payne et al. (2007), in their study of the effects of exposure to seismic sound on adult American lobsters, noted decreases in the levels of serum protein, particular serum enzymes and serum calcium in the haemolymph of animals exposed to seismic sound. Statistically significant differences (p=0.05) were noted in serum protein at 12 days post-exposure, serum enzymes at 5 days post-exposure, and serum calcium at 12 days post-exposure. These significant differences were noted in lobsters exposed 30 times to SPLs of about 202 dB re 1 µPap-p and in those exposed to 50 times to SPLs of about 227 202 dB re 1 µPap-p. During the histological analysis conducted 4 months post-exposure, Payne et al. (2007) noted more deposits of PAS-stained material, likely glycogen, in the hepatopancreas of some of the exposed lobsters. Accumulation of glycogen could be due to stress or disturbance of cellular processes.
Price (2007) found that blue mussels (Mytilus edulis) responded to a 10 kHz pure tone continuous signal by decreasing respiration. Smaller mussels did not appear to react until after 30 minutes of exposure whereas larger mussels responded after 10 minutes of exposure. The larger mussels tended to lower the oxygen uptake rate more than the smaller animals.
Behavioural Effects
The limited study of the effects of exposure to sound on marine invertebrates has not indicated any serious pathological and physiological effects. In light of this, some recent studies have focused on the potential behavioural effects on marine invertebrates.
Christian et al. (2003) investigated the behavioural effects of exposure to seismic survey sound on snow crabs. Eight animals were equipped with ultrasonic tags, released, and monitored for multiple days prior to exposure and after exposure. Received SPL and SEL were ~191 dB re 1 µPa0-p and <130 dB re 1 µPa2·s, respectively. The crabs were exposed to 200 discharges over a 33-min period. None of the tagged animals left the immediate area after exposure to the seismic survey sound. Five animals were captured in the snow crab commercial fishery the following year, one at the release location, one 35 km from the release location, and three at intermediate distances from the release location.
Another study approach used by Christian et al. (2003) involved monitoring snow crabs with a remote video camera during their exposure to seismic sound. The caged animals were placed on the ocean bottom at a depth of 50 m. Received SPL and SEL were ~202 dB re 1 µPa0-p and 150 dB re 1 µPa2·s, respectively. The crabs

Appendix G: Airgun Sounds on Marine Invertebrates
Shelburne Basin 3-D Seismic Survey Environmental Assessment 5
were exposed to 200 discharges over a 33-min period. They did not exhibit any overt startle response during the exposure period.
Christian et al. (2003) also investigated the pre- and post-exposure catchability of snow crabs during a commercial fishery. Received SPLs and SELs were not measured directly and likely ranged widely considering the area fished. Maximum SPL and SEL were likely similar to those measured during the telemetry study. There were seven pre-exposure and six post-exposure trap sets. Unfortunately, there was considerable variability in set duration because of poor weather. Results indicated that the catch-per-unit-effort did not decrease after the crabs were exposed to seismic survey sound.
Parry and Gason (2006) statistically analyzed data related to rock lobster commercial catches and seismic surveying in Australian waters between 1978 and 2004. They did not find any evidence that lobster catch rates were affected by seismic surveys.
Caged female snow crabs exposed to sound associated with a recent commercial seismic survey conducted in the southern Gulf of St. Lawrence, Canada, exhibited a higher rate of ‘righting’ than those crabs not exposed to seismic survey sound (J. Payne, Research Scientist, DFO, St. John’s, Newfoundland, personal communication). ‘Righting’ refers to a crab’s ability to return itself to an upright position after being placed on its back. Christian et al. (2003) made the same observation in their study.
Payne et al. (2007), in their study of the effects of exposure to seismic sound on adult American lobsters, noted a trend of increased food consumption by the animals exposed to seismic sound.
Andriguetto-Filho et al. (2005) attempted to evaluate the impact of seismic survey sound on artisanal shrimp fisheries off Brazil. Bottom trawl yields were measured before and after multiple-day shooting of an airgun array with a source SPL of 196 dB re 1 µPa·m. Water depth in the experimental area ranged between 2 and 15 m. Results of the study did not indicate any significant deleterious impact on shrimp catches. Anecdotal information from Newfoundland, Canada, indicated that catch rates of snow crabs showed a significant reduction immediately following a pass by a seismic survey vessel (G. Chidley, Newfoundland fisherman, personal communication). More anecdotal information from Newfoundland, Canada, indicated that a school of shrimp observed on a fishing vessel sounder shifted downwards and away from a nearby seismic sound source (H. Thorne, Newfoundland fisherman, personal communication). This observed effect was temporary.
Caged brown shrimp reared under different acoustical conditions exhibited differences in aggressive behaviour and feeding rate (Lagardère 1982). Those exposed to a continuous sound source showed more aggression and less feeding behaviour. It should be noted that behavioural response to stress by caged animals may differ from behavioural responses of animals in the wild.
McCauley et al. (2000a,b) provided the first evidence of the behavioural response of southern calamari squid exposed to seismic survey sound. McCauley et al. (2000a,b) reported on the exposure of caged cephalopods (50 squid and two cuttlefish) to noise from a single 20-in3 airgun. The cephalopods were exposed to both stationary and mobile sound sources. The two-run total exposure times of the three trials ranged from 69 to 119 min. at a firing rate of once every 10–15 s. The maximum SPL was >200 dB re 1 µPa0-p. Some of the squid fired their ink sacs apparently in response to the first shot of one of the trials and then moved quickly away from the airgun. In addition to the above-described startle responses, some squid also moved towards the water surface as the airgun approached. McCauley et al. (2000a,b) reported that the startle and avoidance responses occurred at a received SPL of 174 dB re 1 µParms. They also exposed squid to a ramped approach-depart airgun signal whereby the received SPL was gradually increased over time. No strong startle response was observed (i.e., ink discharge) but alarm responses were observed once the received SPL reached a level in the 156–161 dB re 1 µParms range (McCauley et al. 2000a,b; Fewtrell and McCauley 2012).
Appendix G: Airgun Sounds on Marine Invertebrates
Shelburne Basin 3-D Seismic Survey Environmental Assessment 6
Komak et al. (2005) also reported the results of a study of cephalopod behavioural responses to local water movements. In this case, juvenile cuttlefish exhibited various behavioural responses to local sinusoidal water movements of different frequencies between 0.01 and 1000 Hz. These responses included body pattern changing, movement, burrowing, reorientation, and swimming. The behavioural responses of the octopus Octopus ocellatus to underwater sound have been investigated by Kaifu et al. (2007). The 120 dB re 1 μPa rms sound stimuli were at various frequencies; 50, 100, 150, 200 and 1,000 Hz. The respiratory activity of the octopus changed when exposed to sound in the 50-150 Hz range but not at the 200-1,000 Hz range. Respiratory suppression by the octopus might have represented a means of escaping detection by a predator.
Low-frequency sound (<200 Hz) has also been used as a means of preventing settling/fouling by aquatic invertebrates such as zebra mussels (Donskoy and Ludyanskiy 1995) and balanoid barnacles (Branscomb and Rittschof 1984). Price (2007) observed that blue mussels closed their valves upon exposure to 10 kHz pure tone continuous sound.
Although not demonstrated in the literature, masking can be considered a potential effect of anthropogenic underwater sound on marine invertebrates. Some invertebrates are known to produce sounds (Au and Banks 1998; Tolstoganova 2002; Latha et al. 2005). The functionality and biological relevance of these sounds are not understood (Jeffs et al. 2003, 2005; Lovell et al. 2005; Radford et al. 2007). Masking of produced sounds and received sounds (e.g., conspecifics and predators), at least the particle displacement component, could potentially have adverse effects on marine invertebrates.
Literature Cited
Andriguetto-Filho, J.M., A. Ostrensky, M.R. Pie, U.A. Silva, and W.A. Boeger. 2005. Evaluating the impact of seismic prospecting on artisanal shrimp fisheries. Cont. Shelf Res. 25:1720-1727.
Au, W.W.L. and K. Banks. 1998. The acoustics of snapping shrimp Synalpheus parneomeris in Kaneohe Bay. J. Acoust. Soc. Am. 103:41-47.
Boudreau, M., S.C. Courtenay, and K. Lee (eds.). 2009. Proceedings of a workshop held 23 January 2007 at the Gulf Fisheries Center, Potential impacts of seismic energy on snow crab: An update to the September 2004 review. Can. Tech. Rep. Fish. Aquat. Sci. 2836.
Branscomb, E.S. and D. Rittschof. 1984. An investigation of low frequency sound waves as a means of inhibiting barnacle settlement. J. Exp. Mar. Biol. Ecol. 79:149-154.
Breithaupt, T. 2002. Sound perception in aquatic crustaceans. p. 548-558 In: K. Wiese (ed.), The crustacean nervous system. Springer-Verlag, Berlin-Heidelberg, Germany. 623 p.
Budelmann, B.U. 1992. Hearing in crustacea. p. 131-139 In: D.B. Webster, R.R. Fay, and A.N. Popper (eds.), Evolutionary biology of hearing. Springer-Verlag, New York, NY.
Budelmann, B.U. 1996. Active marine predators: the sensory world of cephalopods. Mar. Freshw. Behav. Physiol. 27:59-75.
Budelmann, B.U. and R. Williamson. 1994. Directional sensitivity of hair cell afferents in the octopus statocyst. J. Exp. Biol. 187:245-259.
Buscaino, G., F. Filiciotto, M. Gristina, A. Bellante, G. Buffa, V. Di Stefano, V. Maccarrone, G. Tranchida, C. Buscaino and S. Mazzola. 2011. Acoustic behavior of the European spiny lobster Palinurus elephas. Mar. Ecol. Prog. Ser. 441:177-184.
Chadwick, M. 2004. Proceedings of the peer review on potential impacts of seismic energy on snow crab. Gulf Region, Department of Fisheries and Oceans Canada, Sci. Adv. Sec. Proc. Ser. 2004/045.
Christian, J.R., A. Mathieu, D.H. Thomson, D. White, and R.A. Buchanan. 2003. Effect of seismic energy on snow crab (Chionoecetes opilio). Environmental Studies Research Funds Report No. 144. Calgary, AB, Canada.

Appendix G: Airgun Sounds on Marine Invertebrates
Shelburne Basin 3-D Seismic Survey Environmental Assessment 7
Christian, J.R., A. Mathieu, and R.A. Buchanan. 2004. Chronic effects of seismic energy on snow crab (Chionoecetes opilio). Environmental Studies Research Funds Report No. 158, Calgary, AB, Canada.
DFO. 2004. Potential impacts of seismic energy on snow crab. Can. Sci. Adv. Sec. Hab. Stat. Rep. 2004/003.
Donskoy, D.M. and M.L. Ludyanskiy. 1995. Low frequency sound as a control measure for zebra mussel fouling. Proc. 5th Int. Zebra Mussel and Other Aquatic Nuisance Organisms Conference, February 1995, Toronto, Canada.
Fewtrell, J.L. and R.D. McCauley. 2012. Impact of air gun noise on the behaviour of marine fish and squid. Mar. Poll. Bull. 64(5):984-993.
Guerra, A., A.F. González, and F. Rocha. 2004. A review of the records of giant squid in the north-eastern Atlantic and severe injuries in Architeuthis dux stranded after acoustic explorations. Paper presented at the International Council for the Exploration of the Sea (ICES) Annual Science Conference, 22–25 September 2004, Vigo, Spain. ICES CM 2004/CC:29.
Henninger, H.P. and W.H. Watson, III. 2005. Mechanisms underlying the production of carapace vibrations and associated waterborne sounds in the American lobster, Homarus americanus. J. Exp. Biol. 208:3421-3429.
Hu, M.Y., H.Y. Yan, W-S Chung, J-C Shiao, and P-P Hwang. 2009. Acoustically evoked potentials in two cephalopods inferred using the auditory brainstem response (ABR) approach. Comp. Biochem. Physiol. Part A 153:278-283.
Jeffs, A., N. Tolimieri, and J.C. Montgomery. 2003. Crabs on cue for the coast: the use of underwater sound for orientation by pelagic crab stages. Mar. Freshwater Res. 54:841-845.
Jeffs, A.G., J.C. Montgomery, and C.T. Tindle. 2005. How do spiny lobster post-larvae find the coast? New Zealand J. Mar. Fresh. Res. 39:605-617.
Kaifu, K., S. Segawa, and K. Tsuchiya. 2007. Behavioral responses to underwater sound in the small benthic octopus Octopus ocellatus. J. Marine Acoust. Soc. Jpn. 34:46-53.
Kaifu, K., T. Akamatsu, and S. Segawa. 2008. Underwater sound detection by cephalopod statocyst. Fish. Sci. 74:781-786.
Komak, S., J.G. Boal, L. Dickel, and B.U. Budelmann. 2005. Behavioural responses of juvenile cuttlefish (Sepia officinalis) to local water movements. Mar. Freshwater Behav. Physiol. 38:117-125.
Lagardère, J.P. 1982. Effects of noise on growth and reproduction of Crangon crangon in rearing tanks. Mar. Biol. 71:177-186.
Latha, G., S. Senthilvadivu, R. Venkatesan, and V. Rajendran. 2005. Sound of shallow and deep water lobsters: measurements, analysis, and characterization (L). J. Acoust. Soc. Am. 117: 2720-2723.
Lovell, J.M., M.M. Findley, R.M. Moate, and H.Y. Yan. 2005. The hearing abilities of the prawn Palaemon serratus. Comp. Biochem. Physiol. Part A 140:89-100.
Lovell, J.M., R.M. Moate, L. Christiansen, and M.M. Findlay. 2006. The relationship between body size and evoked potentials from the statocysts of the prawn Palaemon serratus. J. Exp. Biol. 209:2480-2485.
McCauley, R.D., J. Fewtrell, A.J. Duncan, C. Jenner, M.-N. Jenner, J.D. Penrose, R.I.T. Prince, A. Adhitya, J. Murdoch, and K. McCabe. 2000a. Marine seismic surveys: analysis of airgun signals; and effects of air gun exposure on humpback whales, sea turtles, fishes and squid. Rep. from Centre for Marine Science and Technology, Curtin University, Perth, Western Australia, for Australian Petroleum Production Association, Sydney, NSW.
McCauley, R.D., J. Fewtrell, A.J. Duncan, C. Jenner, M.-N. Jenner, J.D. Penrose, R.I.T. Prince, A. Adhitya, J. Murdoch, and K. McCabe. 2000b. Marine seismic surveys – a study of environmental implications. APPEA J. 40:692-706.
Mooney, T.A., R.T. Hanlon, J. Christensen-Dalsgaard, P.T. Madsen, D.R. Ketten and P.E. Nachtigall. 2010. Sound detection by the longfin squid (Loligo pealeii) studied with auditory evoked potentials: sensitivity to low-frequency particle motion and not pressure. J. Exp. Mar. Biol. 213: 3748-3759.
Moriyasu, M., R. Allain, K. Benhalima, and R. Claytor. 2004. Effects of seismic and marine noise on invertebrates: A literature review. Fisheries and Oceans Canada, Science. Can. Sci. Adv. Sec. Res. Doc. 2004/126.
Packard, A., H.E. Karlsen, and O. Sand. 1990. Low frequency hearing in cephalopods. J. Comp. Physiol. A 166: 501-505.

Appendix G: Airgun Sounds on Marine Invertebrates
Shelburne Basin 3-D Seismic Survey Environmental Assessment 8
Parry, G.D. and A. Gason. 2006. The effect of seismic surveys on catch rates of rock lobsters in western Victoria, Australia. Fish. Res. 79:272-284.
Payne, J.F., C.A. Andrews, L.L. Fancey, A.L. Cook, and J.R. Christian. 2007. Pilot study on the effects of seismic air gun noise on lobster (Homarus americanus). Fisheries and Oceans Canada, Can. Tech. Rep. Fish. Aquat. Sci. No. 2712.
Payne, J.F., C. Andrews, L. Fancey, D. White, and J. Christian. 2008. Potential effects of seismic energy on fish and shellfish: An update since 2003. Fisheries and Oceans Canada Science, Can. Sci. Advis. Sec. Res. Doc. 2008/060.
Pearson, W., J. Skalski, S. Sulkin, and C. Malme. 1994. Effects of seismic energy releases on the survival and development of zoeal larvae of Dungeness crab (Cancer magister). Mar. Environ. Res. 38:93-113.
Popper, A.N., M. Salmon, and K.W. Horch. 2001. Acoustic detection and communication by decapod crustaceans. J. Comp. Physiol. A 187:83-89.
Price, A. 2007. The effects of high frequency, high intensity underwater sound on the oxygen uptakes of Mytilus edulis (L.). Thesis submitted as part of assessment for the Degree of Bachelor of Science (Honours) in Applied Biology. Heriot-Watt University, Scotland.
Pye, H.J., and W.H. Watson, III. 2004. Sound detection and production in the American lobster, Homarus americanus: sensitivity range and behavioural implications. J. Acoust. Soc. Am. 115 (Part 2):2486.
Radford, C.A., A.G. Jeffs, and J.C. Montgomery. 2007. Orientated swimming behavior of crab postlarvae in response to reef sound. Poster at First International Conference on the Effects of Noise on Aquatic Life, Nyborg, Denmark, August 2007.
Rawizza, H.E. 1995. Hearing and associative learning in cuttlefish, Sepia officinalis. Hopkins Marine Station Student Paper. Stanford University, Palo Alto, CA.
Richardson, W.J., C.R. Greene, Jr., C.I. Malme, and D.H. Thomson. 1995. Marine mammals and noise. Academic Press, San Diego, CA. 576 p.
Tolstoganova, L.K. 2002. Acoustical behaviour in king crab (Paralithodes camtschaticus). p. 247-254 In: A.J. Paul, E.G. Dawe, R. Elner, G.S. Jamieson, G.H. Kruse, R.S. Otto, B. Sainte-Marie, T.C. Shirley, and D. Woodby (eds.), Crabs in cold water regions: biology, management, and economics. University of Alaska Sea Grant, AK-SG-02-01, Fairbanks, AK.
Vermeij, M.J.A., K.L. Marhaver, C.M. Huijbers, I. Nagelkerken and S.D. Simpson. 2010. Coral larvae move toward reef sounds. PLoS ONE 5(5): e10660. doi: 10.1371/journal.pone.0010660.

Appendix H: Supplemental Fisheries Data
Shelburne Basin 3-D Seismic Survey Environmental Assessment 1
APPENDIX H: SUPPLEMENTAL FISHERIES DATA Table H-1 Average Annual Study Area Catch Weight by Gear Type, 2005 to 2010.
Species Fixed Gear Mobile Gear
Gear Type Catch Weight (mt)
(% of Total) Total (mt)
(% of Total) Gear Type
Catch Weight (mt) (% of Total)
Total (mt) (% of Total)
Swordfish Longline 286 (31.6%) 286 (31.6%) Rod and Reel (trolling)
Harpoon <0.1 (<0.1%)
12 (0.6%) 12 (0.6%)
Haddock Gillnet (set of fixed)
Longline <0.1 (<0.1%) 111 (12.2%)
111 (12.2%) Bottom Otter Trawl (stern) 866 (45.0%) 866 (45.0%)
Atlantic Cod Gillnet (set of fixed)
Longline 2 (0.2%)
94 (10.4%) 96 (10.6%)
Bottom Otter Trawl (stern) Midwater Trawl (side)
110 (5.7%) <0.1 (<0.1%)
110 (5.7%)
Lobster Pot (unspecified) 91 (10.1%) 91 (10.1%) None 0 (0%) 0 (0%)
Atlantic Halibut Longline 72 (7.9%) 72 (7.9%) Bottom Otter Trawl (stern)
Midwater Trawl (side) Bottom Pair Trawl
2 (0.1%) <0.1 (<0.1%) 0.2 (<0.1%)
2 (0.1%)
White Hake Gillnet (set f fixed)
Longline 2 (0.2%)
53 (5.8%) 55 (6.1%)
Bottom Otter Trawl (stern) Midwater Trawl (side)
Bottom Pair Trawl
11 (0.6%) <0.1 (<0.1%) 0.2 (<0.1%)
11 (0.6%)
Pollock Gillnet (set of fixed)
Longline Pot (unspecified)
20 (2.2%) 4 (0.4%)
<0.1 (<0.1%) 24 (2.6%)
Bottom Otter Trawl (stern) Midwater Trawl (side)
301 (15.6%) <0.1 (<0.1%)
301 (15.6%)
Cusk Gillnet (set of fixed)
Longline <0.1 (<0.1%)
22 (2.5%) 22 (2.5%)
Bottom Otter Trawl (stern) Midwater Trawl (side)
6 (0.3%) <0.1 (<0.1%)
6 (0.3%)
Herring Gillnet (set of fixed) 6 (0.6%) 6 (0.6%) Bottom Otter Trawl (stern)
Midwater Trawl (stern) Purse Seine
0.2 (<0.1%) 19 (1.0%) 26 (1.3%)
45 (2.3%)
Monkfish Gillnet (set of fixed)
Longline 0.1 (<0.1%)
2 (0.2%) 2 (0.2%) Bottom Otter Trawl (stern) 123 (6.4%) 123 (6.4%)
Silver Hake Longline
Pot (unspecified) <0.l (<0.1%)
1 (0.1%) 1 (0.1%) Bottom Otter Trawl (stern) 269 (14.0%) 269 (13.9%)
Atlantic (Striped) Wolffish Longline 0.3 (<0.1%) 0.3 (<0.1% Bottom Otter Trawl (stern) <0.1 (<0.1%) <0.1 (<0.1%)
Redfish Gillnet (set of fixed)
Longline Pot (unspecified)
<0.1 (<0.1%) 0.1 (<0.1%)
<0.1 (<0.1%) 0.1 (<0.1%) Bottom Otter Trawl (stern) 145 (7.5%) 145 (7.5%)
Porbeagle Shark Gillnet (set of fixed)
Longline <0.1 (<0.1%)
38 (4.2%) 38 (4.2% Harpoon <0.1 (<0.1%) <0.1 (<0.1%)
Totals 905 (95.6%) 1,925 (98.2%) Source: DFO Commercial Fishery Landings Database, 2005 to 2010
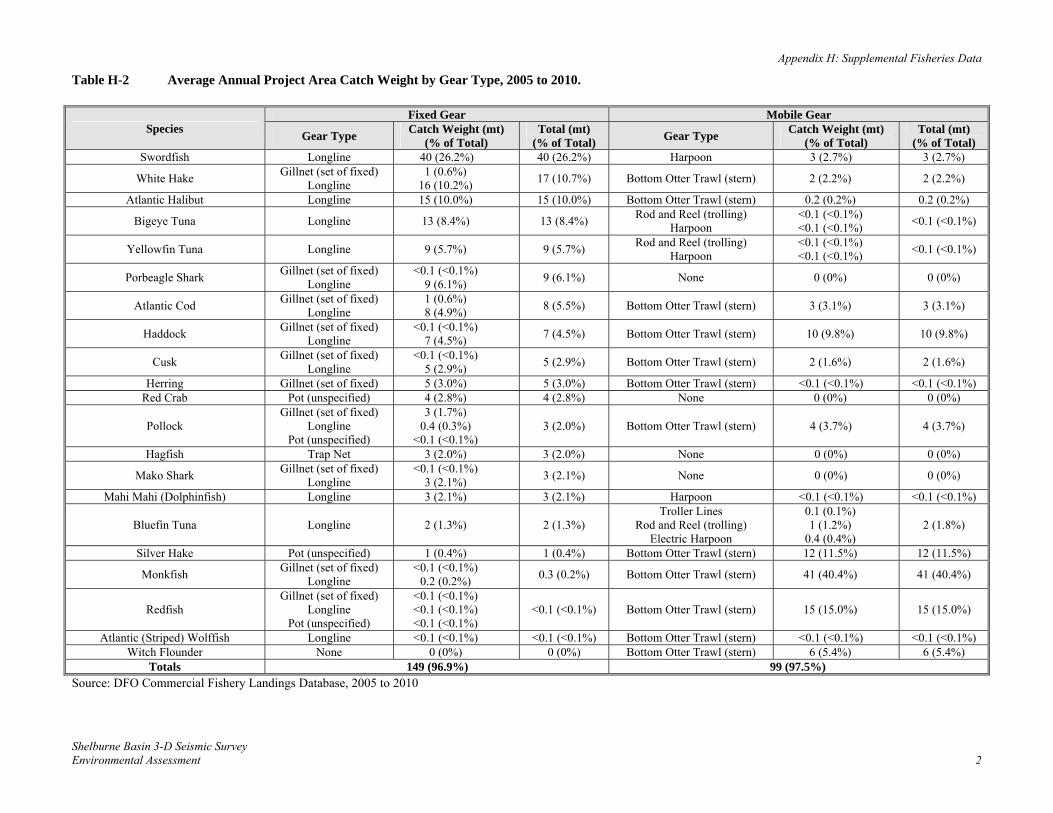
Appendix H: Supplemental Fisheries Data
Shelburne Basin 3-D Seismic Survey Environmental Assessment 2
Table H-2 Average Annual Project Area Catch Weight by Gear Type, 2005 to 2010.
Species Fixed Gear Mobile Gear
Gear Type Catch Weight (mt)
(% of Total) Total (mt)
(% of Total) Gear Type
Catch Weight (mt) (% of Total)
Total (mt) (% of Total)
Swordfish Longline 40 (26.2%) 40 (26.2%) Harpoon 3 (2.7%) 3 (2.7%)
White Hake Gillnet (set of fixed)
Longline 1 (0.6%)
16 (10.2%) 17 (10.7%) Bottom Otter Trawl (stern) 2 (2.2%) 2 (2.2%)
Atlantic Halibut Longline 15 (10.0%) 15 (10.0%) Bottom Otter Trawl (stern) 0.2 (0.2%) 0.2 (0.2%)
Bigeye Tuna Longline 13 (8.4%) 13 (8.4%) Rod and Reel (trolling)
Harpoon <0.1 (<0.1%) <0.1 (<0.1%)
<0.1 (<0.1%)
Yellowfin Tuna Longline 9 (5.7%) 9 (5.7%) Rod and Reel (trolling)
Harpoon <0.1 (<0.1%) <0.1 (<0.1%)
<0.1 (<0.1%)
Porbeagle Shark Gillnet (set of fixed)
Longline <0.1 (<0.1%)
9 (6.1%) 9 (6.1%) None 0 (0%) 0 (0%)
Atlantic Cod Gillnet (set of fixed)
Longline 1 (0.6%) 8 (4.9%)
8 (5.5%) Bottom Otter Trawl (stern) 3 (3.1%) 3 (3.1%)
Haddock Gillnet (set of fixed)
Longline <0.1 (<0.1%)
7 (4.5%) 7 (4.5%) Bottom Otter Trawl (stern) 10 (9.8%) 10 (9.8%)
Cusk Gillnet (set of fixed)
Longline <0.1 (<0.1%)
5 (2.9%) 5 (2.9%) Bottom Otter Trawl (stern) 2 (1.6%) 2 (1.6%)
Herring Gillnet (set of fixed) 5 (3.0%) 5 (3.0%) Bottom Otter Trawl (stern) <0.1 (<0.1%) <0.1 (<0.1%) Red Crab Pot (unspecified) 4 (2.8%) 4 (2.8%) None 0 (0%) 0 (0%)
Pollock Gillnet (set of fixed)
Longline Pot (unspecified)
3 (1.7%) 0.4 (0.3%)
<0.1 (<0.1%) 3 (2.0%) Bottom Otter Trawl (stern) 4 (3.7%) 4 (3.7%)
Hagfish Trap Net 3 (2.0%) 3 (2.0%) None 0 (0%) 0 (0%)
Mako Shark Gillnet (set of fixed)
Longline <0.1 (<0.1%)
3 (2.1%) 3 (2.1%) None 0 (0%) 0 (0%)
Mahi Mahi (Dolphinfish) Longline 3 (2.1%) 3 (2.1%) Harpoon <0.1 (<0.1%) <0.1 (<0.1%)
Bluefin Tuna Longline 2 (1.3%) 2 (1.3%) Troller Lines
Rod and Reel (trolling) Electric Harpoon
0.1 (0.1%) 1 (1.2%)
0.4 (0.4%) 2 (1.8%)
Silver Hake Pot (unspecified) 1 (0.4%) 1 (0.4%) Bottom Otter Trawl (stern) 12 (11.5%) 12 (11.5%)
Monkfish Gillnet (set of fixed)
Longline <0.1 (<0.1%)
0.2 (0.2%) 0.3 (0.2%) Bottom Otter Trawl (stern) 41 (40.4%) 41 (40.4%)
Redfish Gillnet (set of fixed)
Longline Pot (unspecified)
<0.1 (<0.1%) <0.1 (<0.1%) <0.1 (<0.1%)
<0.1 (<0.1%) Bottom Otter Trawl (stern) 15 (15.0%) 15 (15.0%)
Atlantic (Striped) Wolffish Longline <0.1 (<0.1%) <0.1 (<0.1%) Bottom Otter Trawl (stern) <0.1 (<0.1%) <0.1 (<0.1%) Witch Flounder None 0 (0%) 0 (0%) Bottom Otter Trawl (stern) 6 (5.4%) 6 (5.4%)
Totals 149 (96.9%) 99 (97.5%) Source: DFO Commercial Fishery Landings Database, 2005 to 2010
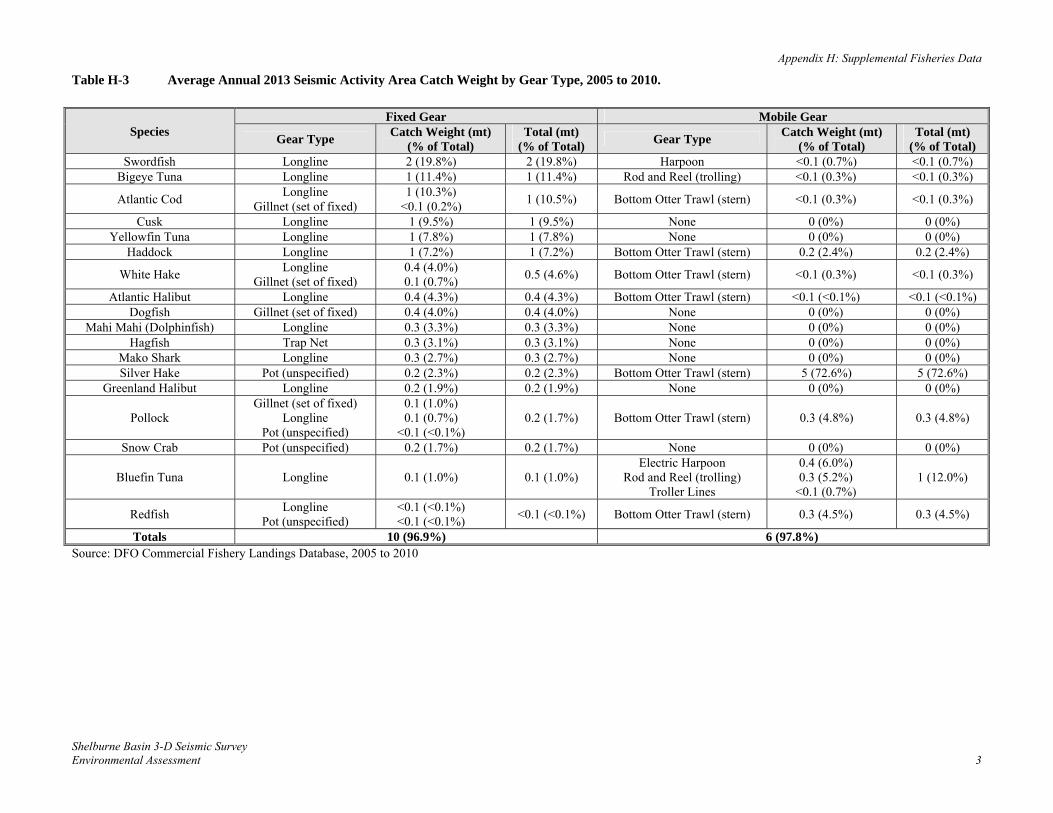
Appendix H: Supplemental Fisheries Data
Shelburne Basin 3-D Seismic Survey Environmental Assessment 3
Table H-3 Average Annual 2013 Seismic Activity Area Catch Weight by Gear Type, 2005 to 2010.
Species Fixed Gear Mobile Gear
Gear Type Catch Weight (mt)
(% of Total) Total (mt)
(% of Total) Gear Type
Catch Weight (mt) (% of Total)
Total (mt) (% of Total)
Swordfish Longline 2 (19.8%) 2 (19.8%) Harpoon <0.1 (0.7%) <0.1 (0.7%) Bigeye Tuna Longline 1 (11.4%) 1 (11.4%) Rod and Reel (trolling) <0.1 (0.3%) <0.1 (0.3%)
Atlantic Cod Longline
Gillnet (set of fixed) 1 (10.3%)
<0.1 (0.2%) 1 (10.5%) Bottom Otter Trawl (stern) <0.1 (0.3%) <0.1 (0.3%)
Cusk Longline 1 (9.5%) 1 (9.5%) None 0 (0%) 0 (0%) Yellowfin Tuna Longline 1 (7.8%) 1 (7.8%) None 0 (0%) 0 (0%)
Haddock Longline 1 (7.2%) 1 (7.2%) Bottom Otter Trawl (stern) 0.2 (2.4%) 0.2 (2.4%)
White Hake Longline
Gillnet (set of fixed) 0.4 (4.0%) 0.1 (0.7%)
0.5 (4.6%) Bottom Otter Trawl (stern) <0.1 (0.3%) <0.1 (0.3%)
Atlantic Halibut Longline 0.4 (4.3%) 0.4 (4.3%) Bottom Otter Trawl (stern) <0.1 (<0.1%) <0.1 (<0.1%) Dogfish Gillnet (set of fixed) 0.4 (4.0%) 0.4 (4.0%) None 0 (0%) 0 (0%)
Mahi Mahi (Dolphinfish) Longline 0.3 (3.3%) 0.3 (3.3%) None 0 (0%) 0 (0%) Hagfish Trap Net 0.3 (3.1%) 0.3 (3.1%) None 0 (0%) 0 (0%)
Mako Shark Longline 0.3 (2.7%) 0.3 (2.7%) None 0 (0%) 0 (0%) Silver Hake Pot (unspecified) 0.2 (2.3%) 0.2 (2.3%) Bottom Otter Trawl (stern) 5 (72.6%) 5 (72.6%)
Greenland Halibut Longline 0.2 (1.9%) 0.2 (1.9%) None 0 (0%) 0 (0%)
Pollock Gillnet (set of fixed)
Longline Pot (unspecified)
0.1 (1.0%) 0.1 (0.7%)
<0.1 (<0.1%) 0.2 (1.7%) Bottom Otter Trawl (stern) 0.3 (4.8%) 0.3 (4.8%)
Snow Crab Pot (unspecified) 0.2 (1.7%) 0.2 (1.7%) None 0 (0%) 0 (0%)
Bluefin Tuna Longline 0.1 (1.0%) 0.1 (1.0%) Electric Harpoon
Rod and Reel (trolling) Troller Lines
0.4 (6.0%) 0.3 (5.2%)
<0.1 (0.7%) 1 (12.0%)
Redfish Longline
Pot (unspecified) <0.1 (<0.1%) <0.1 (<0.1%)
<0.1 (<0.1%) Bottom Otter Trawl (stern) 0.3 (4.5%) 0.3 (4.5%)
Totals 10 (96.9%) 6 (97.8%) Source: DFO Commercial Fishery Landings Database, 2005 to 2010