environment dnp and global environmental issues group environmental policy environmental management...
TRANSCRIPT

Acid rain
Ozone depletion
Desertification
Natural resource depletion
Diminishing wildlife species
Tropical forests in decline
Basic Law for Environmental Pollution
United Nations Conference
on the Human Environment
Rio Summit
The Basic Environment Law
Kyoto Protocol
Basic Law for Establishing
A Recycling-Based Society
Marine pollution
50
High-resource consump-tion society
DNP and GlobalEnvironmental IssuesEnvironmental issues are of major importance to DNP as a manufacturer.
We are aware of our environmental impact, and strive for zero emissions,
resource conservation, and toxic substance controls.
Environment
Noise measures
Plant location measures
Odor measures
Vibration measures
Ground subsidence measures
Waste water measures
Air pollution measures
Soil contamination measures
Environmental con-servation measures
Global warming measures
Waste management measures
Zero emissions

Use of new energy sources Reduce dependence on
exhaustible resources
Use of recyclableresources
Control emissions of environmental pollutants
Major improvements in energy and resource use
Sustainable Society
51
Environmental Performance
LCA
Environmental education
Green purchasing
Supply chain management
Environmental communication
Environmentally-friendly products
Environmental accounting
Increase environmental efficiency
Environmental management system
Information disclosure & provision
(Environmental report publication, labeling)
VOC measures
Chemical substance management
DNP

DNP Group Environmental Policy
Environmental Management Structure
(1) Deliberate and decide on environmental policies, targets and plans of DNP Group(2) Approve environmental policies, targets and plans of the Operations Environmental Committee(3) Check and follow up on the progress being made in the plans of the Operations Environmental Committee, and the status of the achievement of those objectives
Director : Full-time or othersMembers : General Managers of the operations
(1) Propose the DNP Group Environmental policies, targets, planning, and submit reports to the committee(2) Convey the environmental policies, targets, and plans of the DNP Group to all Operations Environmental Committees, check its progress, and support activities(3) Report to the Environmental Committee regarding the progress (results, progress of the measures, etc.) achieved by the Operations Environmental Committee
12members
29members
276members
248members
741members
DNP Environmental Committee
President
Environmental Committee inEach Operation
Each Site of the Operations
Promotion Office
Promotion Office
Technical and Manufacturing Group Environmentally Conscious Products Development Group
Regional Measures Group Environmental Conservation and PRTR Group
Office and Work Environment Group Industrial Waste Reduction Group
Energy Conservation Group
57 sites
(1) Deliberate and decide on the environmental policies, targets and plans of each operation(2) Check and follow up on the progress of plans by the Operations Environmental Committee, and the progress being made towards the targets(3) Periodically hold committee meetings
(1) Submit the environmental policies, targets, planning, and report to the Operations Environmental Committee(2) Convey environmental policies, targets, and plans of divisional groups decided by committee to all sites, check and follow up on its progress(3) Report to the committee regarding the progress (results, progress of the measures, etc.) being achieved by all of the sites
Chairman: Managing Director of the Environment & Product Liability DepartmentMembers: Directors of the basic business divisions at headquarters
Director : Manager of the Environment & Product Liability DepartmentMembers : Managers of the basic operations at headquarters, Managers of the Environment & Product Liability Department, and members of the Technical Division
Environmental Committees in 28 operationsChairman : Operations Managers or Presidents of Group Manufacturing CompaniesMembers : Division Managers of each operation, and Presidents and Division Managers of Group Manufacturing Companies
52
Environmental Policy / Environmental Management Structure
As a manufacturing company we have a responsibility to contribute to the realization of a recycling-based society.
After establishing our Environment Department in 1972, the DNP Group drafted its Environment Declaration and began full-scale
activities for environmental management in 1992. In 2000 we established the DNP Group Environmental Policy.
The DNP Group’s efforts are directed towards the continuous prosperity of a world economy with limited resources and for the development of a society that recirculates resources. The DNP Group is making every effort to minimize the impact our business operations have on the environment, and this includes compliance with environmental laws and regulations as well as recognizing the relationship that each of our business activities has with the environment.
(1) Each member of the DNP Group establishes and periodically reviews its own environmental policies and environmental targets, and puts into effect continuous improvement of its activities and the prevention of environmental pollution.
(2) For all construction projects, and before designing and commissioning new facilities, we carry out a full and detailed envi-ronmental survey to assess the impact that the project will have on the environment to make proper efforts to protect the environment.
(3) When carrying out research, development and design for a new product, we consider the impact of the product on the en-vironment throughout its life cycle, including the ordering of raw materials, production, distribution, use, and disposal. We give special consideration to energy conservation, resource conservation, and reducing the use of harmful chemicals.
(4) When purchasing raw materials, stationery, and equipment, we choose items that are ecologically-friendly and easy to recycle.
(5) In manufacturing a product, we aim to comply with environmental laws and regulations, and moreover we set up more stringent standards to reduce the emissions of pollutants into the air, watershed, and soil, and to prevent unpleasant odors, noise, vibration, and land subsidence. We are constantly improving facilities, techniques and manufacturing pro-cesses to promote the targets of energy conservation, resource conservation and the reduction of industrial waste.
(6) When generating waste from business operations, we strive to achieve zero emissions by separating and recycling waste as much as possible.
DNP Environmental Committee / March 2003
Controlling the environmental activities of the entire Group through an optimum management system
Our environmental management sys-tem consists of the DNP Environmental Committee, which is in charge of the management of the entire Group, and the Operations Environmental Committee. Each committee has its own promotional office.
The DNP Environmental Commit-tee, which is made up of the directors in charge of the basic organizations at company headquarters, deliberates and decides on environmental policy, objec-tives and plans for the entire Group, and monitors the progress of the plans and the status of the achievement of those objectives.
The decisions made by the DNP En-vironmental Committee are further devel-oped by the Operations Environmental Committee with consideration to the characteristic features of its own sphere of business.
DNP Group Environmental Management Structure

Site Eco-ReportsAnnual issue
DOACT
CHECK
Environmental Guidelines
DNP GroupEco-Report
Annual issue
DNP GroupCSR ReportAnnual issue
Management Concept
DNP Group Corporate Pledge
DNP Group Environmental Policies
Environmental policiesof each site
Environmental organizationand responsibility
Internal environmentalaudit (Eco-Audit)
Promotion Office
Promotion Office
DNP Group Environmental Targets(DNP Environmental Committee)
PLAN
Th is pub l i ca t ion descr ibes various standards and guidelines ( s u c h a s i n d u s t r i a l w a s t e processing standards, energy c o n s e r v a t i o n s t a n d a r d s , voluntary inspection standards for environmental conservation, standards for office waste sorting and collection, and Eco-Audit checklists) for establishing the Eco-Report System. This report serves as a registry of
environmental management activities. Each DNP business site must submit it twice a year (April and October).
Based on the Site Eco-Report, we consolidate and summarize the semiannua l env i ronmen ta l activities of the entire group, and in light of trends in Japan and abroad regarding environmental issues, as well as the status of the achieve-ment of our group objectives, we indicate policy for our activities over the next half year. These reports are issued twice a year (in May and November).
Operations Environmental Targets(Operations Environmental Committee)
Eco-Report System Environmental management
53
forts are those that gain us recognition as a company and that actually get results in contributing through environmental man-agement for the realization of a resource circulation society. These include green purchasing, reducing the environmen-tal impact of our production processes, developing and selling products that are even more environmentally-friendly, and reducing the environmental impact of the shipping process.
Promoting the Eco-Report System for Practical Environmental Management
Environmental Management System
Eco-Report System is DNP’s own environmental management system created in 1993 with the goal of attaining the DNP Group
environmental targets. It forms the basis of our environmental management efforts.
PDCA (Plan-Do-Check-Action) is devel-oped over biannual cycle using three tools - the DNP Group Eco-Report, the Site Eco-Report, and the Environmental Guidelines - and is directly connected to the making of continuous improvements.The main themes of our environmental ef-
Eco-Report System
[Environmental Policies and Targets]The DNP environmental policies and targets are decided by the DNP Environ-mental Committee at its head office and reviewed on a regular basis in light of global and customer trends, and the sta-tus of company wide activities.
The policies and targets specified herein are widely communicated through-out the company from the headquarters promotion office to the environmental committee and promotion office in each operations.
[Implementing Activities at the Site]When implementing specific activities, each site conducts environmental activi-ties as stipulated in the DNP Environ-mental Guidelines. Activities are recorded monthly in the Site Eco-Report. On a six month basis, results are assessed and targets are set for the next six month pe-riod. In addition, site activities are audited once a year to ascertain if they comply with regulations and to see the achieve-ment of targets for the overall group. This is done to ensure the improvement of environmental activities.
[Flow for the Disclosure of Environmental Information]The headquarters promotion office pub-lishes DNP Group Eco-Report covering company wide activities twice a year, based on changes in social environmen-tal trends and the Site Eco-Reports from each operation. This is the Group’s white paper on environmental activities. Follow-ing publication of the report, management goes out to each site to resolve problems at a particular site or the positioning of each problem within the Group for the purpose of mutually understanding en-vironmental information and pinpointing important issues that exist among opera-tions. The paper also supports the shar-ing of information and ascertaining future key topics. Furthermore, once a year, this DNP Group CSR Report is published to inform of our environmental management activities over the past year.
Be the world’s corporate leader in environmental conservation.
The DNP Group’s environmental efforts are nothing less than earnest. One finds descriptions on every page of the simple and honest implementation of
basic environmental measures, such as setting up a policy, establishing goals and targets, making regular revisions, implementing continuous improvements, and preventing pollution. One especially notable item in this report is the significant in-crease in environmentally-friendly products, in which a conscious attempt is made to use environmentally-friendly materials and to eliminate those that are hazardous. I would like to see DNP attempt, if possible, to make all of its products environmen-tally-friendly. DNP, as a signatory of the UN Global Compact, should attempt to position itself as the world’s corporate leader in environmental conservation.
In terms of things DNP needs to continue to work on, implementing measures to reduce CO2 emissions resulting from transport would be an important step. DNP is currently no closer to achieving its goal for per-unit fuel use. I would hope they will achieve this after 2006. DNP should also put more effort into reducing the incidence of unusable items and on improving the recycling rate.
Environmental Performance
Chairman, Japan Association of Environment and Society for the 21st CenturyPresident, Research Institute for Environment and Society
Saburo Kato

Features Results
Air
Water
Noise
Vibration
Odor
Waste
Energy
Dioxin
Organization
Total
1
12
6
5
1
62
1
1
4
93
1
8
2
1
0
18
0
0
1
31
5
5
5
4
0
14
1
1
1
36
0
2
1
1
0
27
0
1
1
33
2
6
3
2
1
30
0
0
1
45
'01 '02 '03 '04 '05
100
50
0
54
Eco-Audit to further improve our Eco-Report System
We conducted Eco-Audits at 58 sites in FY2005. We are confirming that appropriate corrective actions are being taken for all
items designated “improvement required” or “improvement consideration & examination.”
Internal Environmental Audit
The DNP Group has been conducting eco-audits for environmental issues in the company since 1996. The promotional office at company headquarters plans, selects a team of auditors, carries out the plans, and performs the appropriate veri-fication on the corrective action response papers. The chair of the Environment Committee at headquarters then ap-proves the results of the audit and the corrective action response papers.Feature (1)
By bringing together the expertise inherent in the products and manufac-turing processes and the independ-ence of the sites, the auditors are able to obtain significant and objective results from their auditing.
Feature (2)In the Eco-Audit we place importance on in on-site confirmation of actual items. In addition, we point out factors for which danger is projected and re-quest preventive action when needed.
Feature (3)In addition to confirmation on compli-ance, we confirm the status of con-tinuous improvements and corrections being made towards the achievement of the environmental targets. When necessary, we require audited sites to review plans (Compliance audit and operations audit).
We conducted Eco-Audits on 58 sites in FY 2005.
Items requiring improvement, pointed out through the audit, include legally con-flicting items such as inadequaciesin the legal descriptions at waste prod-uct management facilities, and defects regarding notification of specified facili-ties. All of the items indicated, however, were addressed in the corrective action response papers submitted by the sites in question, and it was confirmed that the appropriate corrective actions taken.
Analyzing the contents of the indicated items and deciding on which items action should be taken, we will follow up during the Eco-Audit for FY 2006.
Confirming the site and actual items
Collecting data by phoning directly
Confirming the traceability of data
2005 Eco-Audit Performance
Number of sites audited
Number of attendees at sites
Cumulative auditor numbers
Cumulative auditing hours
58 sites
416 persons
123 persons
587 hours
Features Regarding the Expertise and Independence of Eco-Audits Number of Notifications Issued for “Improvement Required” in Eco-Audit (Number issued)
Types of Notifications and Corrections Issued in the Eco-Audit
Type of AuditExpertise of auditors
regarding products and manufacturing processes
Independence of auditors(sites)
(We promote ISO14001 certificates for each site. See p. 75.)
Eco-AuditISO14001 External AuditISO14001 Internal Audit
Types of Notifications
Improvementrequired
Improvement consideration & examination
Corrections
Submission as necessary of a written description of results of consideration/examination or improvement plans
Submission of a written description of correction measures performed or improvement plans

DNP Group Eco-Auditchecklist
Record of correction andmeasures performedsheets from previous audit
Acceptane of AuditReport and Requests foImprovement Measures
Completion of Eco-Audit
Promoted by Head Office
Auditing team
Auditing team
sites subject to audit
Auditing team
Auditing team
sites subject to audit
Auditor QualificationLead Auditor
Site Confirmation
Lead Auditor
Auditor
Auditor
Preparation and notification of annual plan
Formation of auditing team
Adjustment of auditing schedule
Preparation of audit notification
Notification to sites of impending audit(1monthinadvance)
Performance of eco-audit
Eco-Audit Notification
Person designated or selected from auditors by Head Office Promotions Office Manager
Persons having qualification who completed special training courseOther persons recognized as being suitable by the Promotions Office Manager
Auditor’s pre-audit meetingAllocation of roles, briefing of site environment, confirmation of deficiency notices in previous audit
Confirmation of applicable standards, scope of audit, auditor assignment, types of deficiency notifications, warning during audit, confirmation of documentation
Consistency of documents, state of management of related facilities, site conditions
Preparation of Audit Report and Requests for Improvement Measures
Description of audit results and content of requests for improvements
(1) Compliance audit (Air, water, sewer, noise, vibration, odors, qualified personnel, energy conservation,waste)
(2) Operations audit(Reduction of waste, global warming prevention, reduction of chemical substances)
Open Meeting
Document Checking
Auditor's Meeting
Closing Meeting
Audit Report and Requests forImprovement Measures
Correction MeasuresPerformed sheet
Preparation ofCorrection MeasuresPerformed sheet
Approval
Approval
Approval
Approval
Approval Head Office Environmental Committee Chair
Audited site manager
Audited site
Audited Site Promotions Office Manager
Audited Site EnvironmentalCommittee Chair
Auditing Team Chief Auditor
Head Office Promotions Office Manager
Auditors
55
Step in Eco-Audit <Eco-Audit Contents>
Compliance Audit(1) Document Audit
Site locationType and number of statutory facilitiesTypes of wasteEnergy ConsumptionExhaust and wastewater channelsChanges in facilities, production pro-cesses since the last auditApplicable lawsState of improvement of notifications of deficiencies in previous auditState of submission of statutory notifica-tions, reports, and changesFrequency of measurement, validity of measured data, traceability of clataChanges in management personnel due to internal transfers
(2) On-site InspectionsSite location and relationship with sur-rounding sitesConformity to statutory facility document audit (type, number, scale, etc.)State of management of individual facilities and equipment, existence of abnormalitiesEmergency containment in case of ab-normality or emergencySite picture takingAppropriateness of actual work per-formed
Operations Audit(1) Confirmation of validity of site policy and
established targetsPerformance in the previous termConsistency with DNP Group policyContinuity of performance in previous termValidity of established targets
(2) Confirmation of the validity of implemen-tation programsConsistency between targets and pro-gramsEffectiveness of the programsPossibilities of the programsPossibilities of fulfillment of the programsPromotion system and schedule
(3) Confirmation of achievement of imple-mentation items, performance and targetsRecords of activities performedState of progression of the programsEffects of the programs performance of indicator and achievement of targets
Environmental Performance

56
Sites for Environmental Disclosure
The following consolidated manufacturing sites are subject to disclosure in this report.
*[BC (Brother Company)]: Group companies that man-ufacture products not related to the group’s Information Communication, Lifestyle and Industrial supplies, and Electronics divisions or related to several divisions.
Hokkaido/Higashi-ku, Sapporo
• DNP HokkaidoPlate-making/printing/bookbinding/manufac-turing of packaging (BC*)
Kiyota-ku, Sapporo• Sapporo Plant, Hokkaido Coca-Cola Bottling
Beverage manufacturing (BC)
Miyagi/Miyagino-ku, Sendai
• DNP TohokuPlate-making/printing/bookbinding/manufac-turing of packaging (BC)
Fukushima/Izumizaki, Nishi Shirakawa
• Izumizaki Plant, DNP TechnopackPlate-making/printing plate/printing (Lifestyle and Industrial Supplies)
Tochigi/Nishikatacho, Kamitsuga
• DNP GraphicaPrinting/bookbinding (Information Communi-cation)
Ibaraki/Ushiku
• DNP Data TechnoManufacturing of various types of Smart cards (Information Communication)
Saitama/Otone, Kita Saitama
• Otone Plant, DNP Precision DevicesManufacturing of electronic parts for displays (Electronics)
Shiraoka, Minami Saitama• Shiraoka Plant, DNP Offset
Offset printing (Information Communication)
Kawaguchi• Kawaguchi Plant, DNP Offset
Offset printing (Information Communication)
Miyoshi, Iruma• Tsuruse Plant, Ichigaya Publication Printing
OperationsPlate-making/printing plate/printing/bookbind-ing (Information Communication)
• Tokyo Plant, DNP KenzaiPlate-making/printing plate/printing/process-ing (Lifestyle and Industrial Supplies)
• Tsuruse Plant, DNP Opto-Materials *1
Manufacturing of electronic precision parts (Lifestyle and Industrial Supplies)
Warabi• Warabi Plant, IPS Operations*2
Plate-making/printing/processing (Information Communication)
Sayama• Sayama Plant, DNP Technopack
Plate-making/printing plate/printing (Lifestyle and Industrial Supplies)
• DNP Cup TechnoMolding and processing of various types of paper containers (Lifestyle and Industrial Supplies)
• Sayama Plant, DNP IMSManufacturing of thermal transfer carbon rib-bons (Lifestyle and Industrial Supplies)
Fujimino• Kamifukuoka Plant, DNP Fine Electronics/
DNP Precision DevicesManufacturing of electronic precision parts (Electronics)
Kuki• Kuki Plant, Ichigaya Publication Printing
OperationsPrinting/bookbinding (Information Communi-cation)
• Kuki Plant, DNP Fine Electronics/DNP Preci-sion DevicesManufacturing of electronic precision parts (Electronics)
Chiba/Kashiwa
• Kashiwa Plant, DNP Techno PolymerMolding, processing and printing of plastic containers (Lifestyle and Industrial Supplies)
• DNP Techno FilmManufacturing and processing of synthetic resin films (Lifestyle and Industrial Supplies)
Tokyo/Shinjuku-ku
• Ichigaya Plant, Ichigaya Publication PrintingOperationsPlate-making/printing plate/printing/bookbind-ing (Information Communication)
• DNP Facility ServicesMeal services, etc.
• Enokicho Plant, Commercial PrintingOperationsPlate-making/printing/bookbinding (Informa-tion Communication)
Shinagawa-ku• DNP SP Tech
Manufacturing of various advertising and pro-motional materials (BC)
*1:Through 2006.3.31, Tsuruse Plant, DNP AdvancedIndustrial Supplies
*2:Through 2006.3.31, Warabi Plant, BF Operations

57
*DAP Technology one of the equity-method affiliates, has been included in the scope of disclosure in recognition of its importance.Please refer to page 76 for information of our overseas business sites.
Kita-ku• Akabane Plant, Ichigaya Publication Printing
OperationsPrinting (Information Communication)
• Akabane Plant, Commercial PrintingOperationsPlate-making/printing/bookbinding (Informa-tion Communication)
• DNP SeihonBookbinding (BC)
• DNP LogisticsPackaging/shipping (BC)
• DNP HosoProcessing of filling and packaging (BC)
• D.N.KPrinting and manufacturing of machine tools (BC)
Kanagawa/Tsuzuki-ku, Yokohama
• DNP Technopack YokohamaPlate-making/printing plate/printing (Lifestyle and Industrial Supplies)
Midori-ku, Yokohama• Tokyo Plant, The Inctec
Manufacturing of ink, varnish, pigments and dyes (BC)
Odawara• Sagami Yoki
Manufacturing of laminated tubes (Lifestyle and Industrial Supplies)
Aikawa, Aiko• Tokyo Plant, DNP Ellio
Printing and processing of metal sheets (Life-style and Industrial Supplies)
Saiwai-ku, Kawasaki• DT Fine Electronics
Manufacturing of semiconductor photomasks (Electronics)
Gifu/Nakatsugawa
• DNP Technopack TokaiManufacturing/printing/processing of packag-ing (Lifestyle and Industrial Supplies)
Aichi/Moriyama-ku, Nagoya
• DNP TokaiPrinting/bookbinding/manufacturing of pack-aging (BC)
Kyoto/Minami-ku, Kyoto
• Kyoto Plant, DNP Fine ElectronicsManufacturing of electronic precision parts (Electronics)
Ukyo-ku, Kyoto• Kyoto Plant, DNP Technopack Kansai
Plate-making/printing plate/printing (Lifestyle and Industrial Supplies)
Kyotanabe• Tanabe Plant, DNP Technopack Kansai
Plate-making/printing plate/printing (Lifestyle and Industrial Supplies)
Nara/Kawanishi, Shiki
• DNP Data Techno KansaiPlate-making/printing/processing (Information Communication)
Osaka/Hirakata
• Kansai Plant, The InctecManufacturing of ink, varnish, pigments and dyes (BC)
Neyagawa• Neyagawa Plant, DNP Media Create Kansai
Printing (Information Communication)• Kansai Plant, DNP Techno Polymer
Molding, processing and printing of plastic containers (Lifestyle and Industrial Supplies)
• Osaka Plant, DNP EllioPrinting and processing of metal sheets (Life-style and Industrial Supplies)
Hyogo/Kita-ku, Kobe
• Kobe Plant, DNP KenzaiPrinting/processing (Lifestyle and Industrial Supplies)
Ono• Ono Plant, DNP Media Create Kansai
Plate-making/printing/bookbinding (Informa-tion Communication)
Okayama/Okayama
• Okayama Plant, DNP IMSManufacturing of dye-sublimation transfer materials (Lifestyle and Industrial Supplies)
• Okayama Plant, DNP KenzaiPlate-making/printing plate/printing/process-ing (Lifestyle and Industrial Supplies)
• Okayama Plant, DNP Opto-materials*3
Manufacture of electronic parts, etc. (Lifestyle and Industrial Supplies)
Hiroshima/Mihara
• Mihara Plant, DNP Precision DevicesManufacturing of electronic precision parts (Electronics)
Tokushima/Tokushima
• DNP ShikokuPlate-making/printing/manufacturing of pack-aging (BC)
Fukuoka/Yahatanishi-ku, Kitakyushu
• Advanced ColortechManufacturing of color filters (Electoronics)
Tobata-ku, Kitakyushu• DAP Technology
Manufacturing of rear panels for plasma (Electoronics)
Minami-ku, Fukuoka• Fukuoka Plant, DNP Nishinippon
Plate-making/printing/bookbinding/manufac-turing of packaging (BC)
Chikugo• Chikugo Plant, DNP Nishinippon
Plate-making/printing/bookbinding/manufac-turing of packaging (BC)
Other Domestic Consolidated Affiliates• DNP Art, DNP Total Process Ichigaya, DNP
Uniprocess, and DNP Techtas Ichigaya are covered under a portion of the Ichigaya Plant, Ichigaya Publication Printing Operations
• DNP Butsuryu Systems Ichigaya is covered as a division of the plants under the Ichigaya Publication Printing Operations (Ichigaya Plant, Tsuruse Plant, Kuki Plant and the Aka-bane Plant)
• DNP Media Create and DNP Butsuryu Sys-tems Shouin are covered as a division of the Enokicho Plant, Commercial Printing Opera-tions
• DNP Total Process BF and DNP Techtas BF are covered as a division of the Warabi Plant, IPS Operations
• DNP Micro Technica is covered as a division of the Kamifukuoka Plant, DNP Fine Elec-tronics
• Of the companies treated as consolidated companies under financial accounting prac-tice, we excluded 12 companies without manufacturing divisions, such as DNP Trad-ing
Overseas Consolidated Manufacturing Af-filiates• DNP IMS America (US, processing thermal
transfer ribbons)• DNP Electronics America (US, manufacturing
and sales of precision electronics parts)• DNP Denmark (Denmark, manufacturing and
sales of precision electronics parts)• Tien Wah Press (Singapore, plate-making/
printing/bookbinding)• DNP Indonesia (Indonesia, plate-making/
printing/bookbinding, manufacturing and sales of packaging)
• DNP Photomask Europe (Italia, manufactur-ing and sales of precision electronics parts)
*3:Okayama Plant, DNP Advanced Industrial Supplies until March 31, 2006.
Environmental Performance

20052004
INP
UT
OU
TP
UT
2004
2,700 kl 2,400 kl (11.1% decrease)
182 TJ 181 TJ (0.5% decrease)
2005
2004 2005 2004 2005
2004 2005
73%9%
18%
2004
88%
1%
11%
2004
63%
12%
12%
13%
2004
73%8%
19%
2005
88%
1%
11%
2005
67%
10%
11%
12%
2005
30%
27%
33%
10%
2004 32%
26%
32%
10%
2005
2004 2005
9%9%
69%
13%
2004
9%8%
71%
12%
2005
35%
19%
34%
12%
200437%
19%
31%
13%
2005
2004 2005
Product Manufacturing Process
Information Communication
Books and periodicals, commercial printing, business forms
Lifestyle and Industrial Supplies
Packaging, decorative materials, industrial supplies
Electronics
Displays, electronic devices
BC (brother companies)
Ink, beverages, etc.
Current Status of Recycling in the DNP Group
Recycledsolvent
Recycled acidand alkaline
Recycledwater
Vapor generated fromwaste heat recovery
6,100 tons(usage ratio: 1.22)
178,200 tons 198,400 tons
58,500 tons(usage ratio: 2.26)
30,500 tons(usage ratio: 1.86)
5,900 tons(usage ratio: 1.26)
529.42 milion m3
(usage ratio: 35.6)532.074 million m3
(usage ratio: 35.0)
Emissions into the air
GHG emissions
NOx emissions
SOx emissions
VOC emissions
Percentage distribution by individual segment for GHG emission amounts.
Emissions into bodies of water
Water discharged
COD emissions *
Nitrogen emissions *
Phosphoric emissions *
12.506 million m3 13.216 million m3 (5.7% increase)
52.9 tons
527,700 tons
95,500 tons
10,500 tons
53.3 tons (0.8% increase)
14.6 tons (28.1% decrease)
0.4 tons (0.0% decrease)
502,700 tons (4.7% decrease)
91,100 tons (4.6% decrease)
8,000 tons (23.8% decrease)
935,900 tons-CO2
702 tons
2,101,300 tons
126,400 tons
74,500 tons
78,100 tons
62,600 tons
117,300 tons
28,300 tons
46,300 tons
22.6 tons
12,600 tons
20.3 tons
0.4 tons
963,800 tons-CO2 (3.0% increase)
724 tons (3.1% increase)
20.4 tons (9.7% decrease)
10,662 tons (15.4% decrease)
Percentage distribution by each segment for water discharge.
Undesired Materials Generated
Waste emissions
Landfill waste amount
Total amount ofundesired materials
Information Communication
Lifestyle and Industrial Supplies
Electronics
BC (brother companies)
Percentage distribution by each segment for undesired substances.
Main materials
Paper
Film
Plastic
Metal
Ink
Others
2,265,800 tons (7.8% increase)
140,700 tons (11.3% increase)
74,800 tons (0.4% increase)
73,700 tons (5.6% decrease)
58,300 tons (6.9% decrease)
120,700 tons (2.9% increase)
22,300 tons (21.2% decrease)
35,400 tons (23.5% decrease)
Solvent
Acid and alkaline
Percentage distribution by individual segment formain materials (paper)
Main secondary materials
Electricity
City gas
LPG
Fuel oil
Steam
Water
Percentage distribution by individual segment formain secondary materials (solvent)
Utilities
1,186.4 million kWh 1,255.2 million kWh (5.8% increase)
149.0 million m3 152.0 million m3 (2.0% increase)
15.307 million m3 15.653 million m3 (2.3% increase)
25.9 million kg 24.8 million kg (4.2% decrease)
Information Communication
Lifestyle and Industrial Supplies
Electronics
BC (brother companies)
Percentage distribution by individual segment for utilities (water)
2
4
6
8
10
12
'01 '02 '03 '04
11.3
9.5
7.5
'05
4.5
5.6
85
110
0
20
40
60
80
100
120
0
39
48 62
Eco-Points (1 billion EIP) Eco-Efficiency (Output* /EIP)
58
Current Status of Environmental Impact
Each segment has its own environmental impact due to the differences in the manufac-turing processes
*[Output]: Indicates operation activities, this is the total added value for companies covered in this report.
The Information Communications Segment uses a significant amount of raw materials (paper), while the Lifestyle and Industrial
Supplies Segment uses solvents and the Electronics Segment used and discharged water.
The DNP Group manufactures a variety of different products closely related to the everyday lives of consumers, which consist of main materials as film, plastic, metal (iron, aluminum, etc.) and/or ink.
The Information Communications Seg-ment, which mainly manufactures maga-zines and other printed material through offset printing, uses a great amount of paper. The Lifestyle and Industrial Sup-
plies Segment, is one of the biggest us-ers of solvents in the DNP Group as it manufactures packaging, construction and other industrial materials and uses solvents for its gravure printing, coating and lamination. The Electronics Segment uses and discharges great amount of wa-ter in proportion to the rest of the Group for its shadow masks and lead frames.
Trends in Eco-Efficiency
The DNP Group evaluates eco-efficiency using JEPIX*. We are improving our eco-efficiency by reducing pollutants such as air pollution and photochemical oxidants through measures to reduce atmospheric emissions of VOCs (volatile organic chemicals). The focus in JEPIX is mainly on the on-site environmental impact, with a notable aspect being that reducing emission amounts of chemicals listed in the PRTR Law has a significant effect on the improvement of eco-efficiency. We are working to improve our eco-efficiency through maintaining awareness of these items.
*[JEPIX]: Environmental Policy Priorities Index for Japan is a single index environmental evaluation system developed in Japan, which calculates the degree of overall environmental impact according to a single numeric value expressed as Eco-Points. The JEPIX Forum for the application of the JEPIX methodology was held as part of the Ministry of Education, Culture, Sports, Science and Technology’s COE Project (International Christian University), and our company began participating in the second term.

20052004
INP
UT
OU
TP
UT
2004
2,700 kl 2,400 kl (11.1% decrease)
182 TJ 181 TJ (0.5% decrease)
2005
2004 2005 2004 2005
2004 2005
73%9%
18%
2004
88%
1%
11%
2004
63%
12%
12%
13%
2004
73%8%
19%
2005
88%
1%
11%
2005
67%
10%
11%
12%
2005
30%
27%
33%
10%
2004 32%
26%
32%
10%
2005
2004 2005
9%9%
69%
13%
2004
9%8%
71%
12%
2005
35%
19%
34%
12%
200437%
19%
31%
13%
2005
2004 2005
Product Manufacturing Process
Information Communication
Books and periodicals, commercial printing, business forms
Lifestyle and Industrial Supplies
Packaging, decorative materials, industrial supplies
Electronics
Displays, electronic devices
BC (brother companies)
Ink, beverages, etc.
Current Status of Recycling in the DNP Group
Recycledsolvent
Recycled acidand alkaline
Recycledwater
Vapor generated fromwaste heat recovery
6,100 tons(usage ratio: 1.22)
178,200 tons 198,400 tons
58,500 tons(usage ratio: 2.26)
30,500 tons(usage ratio: 1.86)
5,900 tons(usage ratio: 1.26)
529.42 milion m3
(usage ratio: 35.6)532.074 million m3
(usage ratio: 35.0)
Emissions into the air
GHG emissions
NOx emissions
SOx emissions
VOC emissions
Percentage distribution by individual segment for GHG emission amounts.
Emissions into bodies of water
Water discharged
COD emissions *
Nitrogen emissions *
Phosphoric emissions *
12.506 million m3 13.216 million m3 (5.7% increase)
52.9 tons
527,700 tons
95,500 tons
10,500 tons
53.3 tons (0.8% increase)
14.6 tons (28.1% decrease)
0.4 tons (0.0% decrease)
502,700 tons (4.7% decrease)
91,100 tons (4.6% decrease)
8,000 tons (23.8% decrease)
935,900 tons-CO2
702 tons
2,101,300 tons
126,400 tons
74,500 tons
78,100 tons
62,600 tons
117,300 tons
28,300 tons
46,300 tons
22.6 tons
12,600 tons
20.3 tons
0.4 tons
963,800 tons-CO2 (3.0% increase)
724 tons (3.1% increase)
20.4 tons (9.7% decrease)
10,662 tons (15.4% decrease)
Percentage distribution by each segment for water discharge.
Undesired Materials Generated
Waste emissions
Landfill waste amount
Total amount ofundesired materials
Information Communication
Lifestyle and Industrial Supplies
Electronics
BC (brother companies)
Percentage distribution by each segment for undesired substances.
Main materials
Paper
Film
Plastic
Metal
Ink
Others
2,265,800 tons (7.8% increase)
140,700 tons (11.3% increase)
74,800 tons (0.4% increase)
73,700 tons (5.6% decrease)
58,300 tons (6.9% decrease)
120,700 tons (2.9% increase)
22,300 tons (21.2% decrease)
35,400 tons (23.5% decrease)
Solvent
Acid and alkaline
Percentage distribution by individual segment formain materials (paper)
Main secondary materials
Electricity
City gas
LPG
Fuel oil
Steam
Water
Percentage distribution by individual segment formain secondary materials (solvent)
Utilities
1,186.4 million kWh 1,255.2 million kWh (5.8% increase)
149.0 million m3 152.0 million m3 (2.0% increase)
15.307 million m3 15.653 million m3 (2.3% increase)
25.9 million kg 24.8 million kg (4.2% decrease)
Information Communication
Lifestyle and Industrial Supplies
Electronics
BC (brother companies)
Percentage distribution by individual segment for utilities (water)
59
*[Usage Ratio]: This is a calculation of (input + recovery and recycling)/in-put. It does not include vapor or solvent in ink.
*[COD, nitrogen and phosphoric emission]: This covers water discharge chan-nels which apply to the Water Pollution Control Law.
Environmental Performance

60
2005 Targets and Results
Making steady headway towards achieving our environmental targets.
Per unit in 1990: 20.6 t-CO2/1 billion yen
Per unit in 2005: 18.8 t-CO2/1 billion yen
8.7% decrease from that in 1990
Per unit CO2 emissions in 2000:115.0 t-CO2/million ton-km
Per unit CO2 emissions in 2005: 59.8 t-CO2/million ton-km
48% decrease from that in 2000
Per unit fuel use for transport in 2000: 8.33 kl/1 billion yen
Per unit fuel use for transport in 2005: 7.90 kl/1 billion yen
5.1% decrease from that in 2000
Emissions in 2002: 21,312 tons
Emissions in 2005: 10,662 tons
50% reduction from that in 2002.
Per unit in 2000: 0.312 tons/million yen
Per unit in 2005: 0.185 tons/million yen
40.7% decrease from that in 2000
Total undesired materials in 2000: 646,000 tons
Total undesired materials in 2005: 503,000 tons
22.1% decrease from that in 2000
Achieved at 31 sites
17.7% generation rate of undesired material in 2000
12.9% generation rate of undesired material in 2004
27.1% decrease from that in 2000
79.4% recycling rate in 2005
Sales of 256.6 billion yen in 2005
56% increase over that in 2004
23.6% green purchasing rate for materials in 2004
27.5% green purchasing rate for materials in 2005
30.6% green purchasing rate for materials in 2004
41.6% green purchasing rate for materials in 2005
96% achievement rate of targets for 2005 (voluntary target)
93% achievement rate of targets for 2005 (voluntary target)
56% achievement rate of targets for 2005 (voluntary target)
100% achievement rate of targets for 2005 (voluntary target)
96% achievement rate of targets for 2005 (voluntary target)
74.4% rate wastepaper separation in 2005
Acquired by 5 sites in 2005. Total 31 sites.
Eco-Audits conducted at all sites in 2005.
Targets through 2005 2005 results
To reduce per unit CO2 emissions by 15% from the 1990 level by 2010.
To reduce per unit CO2 emissions per unit shipped (CO2 emissions/shipped weight/distance shipped) by 5% from the 2000 level (2010).
To reduce per unit fuel use for transport (amount of fuel used/sales) by 20% from the 2000 level (2010).
To reduce emissions of VOCs by 50% compared to 2002 by fiscal 2005.
To increase the ratio of the fractional recovery of waste paper to 65% of that for general waste.
To reduce per unit waste emissions (waste emissions/production) by 40% from the 2000 level (2005).
To reduce undesired material generation by 25% from the 2000 level (2005).
Reduction of environ-
mental im
pact incurred during transport
VO
C
Office envi-ronment
Reduction of industrial w
asteDevelopment and sales of environmen-
tally conscious products
Green
purchasingE
nvironmental
conservation
To achieve zero emissions at 30 sites.
To reduce the undesired material generation ratio (undesired material genera-tion/total material input) by 20% from the 2000 level (2005).
To achieve a 80% recycling ratio (recycled amount/total amount of undesired ma-terial generation) in the disposing main raw materials (2005).
To increase the level each year by 10% (over the previous year).
To increase the rate of the products purchased according to the green purchas-ing standards of DNP, to 40% by 2010.
To increase the purchasing rate of environmentally certified products, such as those labeled with the Eco-Mark, of the total supplies (office supplies and equip-ment) to 50% by 2010.
To keep the maximum concentration of air emissions subject to emissions regu-lations at 70% of the required standard or less (2005).To keep the maximum concentration of wastewater discharges subject to waste-water regulations at 70% of the required standard or less (2005).To keep the maximum level of noise at our site perimeters at 95% of the required standard or less.To keep the maximum level of vibration at our site perimeters at 95% of the re-quired standard or less (2005).To keep the maximum concentration of odors at our site perimeters at 70% of the required standard or less (2005).
To promote ISO14001 certification at 30 sites (2005).
To promote Eco-Audits at all sites.
Environmen-tal manage-ment system
Global warming preven-
tion
In light of our environmental policy, the DNP Group sets environmental targets appropriate to our business, and is steadily get-
ting results. The table on the right indicates our targets and the results for fiscal 2005 and our targets for fiscal 2006.

Environmental Performance
61
Evaluation
p64
p65
p65
p63 • 66
p68 • 69
p68 • 69
p68 • 69
p68 • 69
p68 • 69
p73
p74
p74
p70
p70
p70
p70
p70
p67
p75
p54
Targets from fiscal 2006
To reduce per unit CO2 emissions by 15% from the 1990 level by 2010.
We aim to achieve the following targets by 2010:• To reduce per unit CO2 emissions per unit shipped (CO2 emissions/shipped weight/distance
shipped) by 40% from the 2000 level.• To reduce per unit fuel use for transport (amount of fuel used/sales) by 20% from the 2000
level.
To reduce emissions of VOCs by 70% compared to 2002 by fiscal 2008.
To increase the ratio of the fractional recovery of waste paper to 70% of that for general waste.
We aim to achieve the following targets by 2010:• To reduce per unit waste emissions (waste emissions/production)
by 50% from the 2000 level.• To reduce undesired material generation by ratio (undesired material generation/total material
input) at all sites by more than 3%, 35% from the 2000 level.• To achieve a 98% recycling ratio (recycled amount/total amount of undesired material genera-
tion) in the disposing main raw materials.2005 results: paper 99.8%, plastic 93.2%, metal 99.1%, glass 59.8%
• To achieve zero emissions for the entire DNP Group.
To increase the level each year by 10% (over the previous year), and achieve 300 billion yen by 2010.
To increase the rate of the products purchased according to the green purchasing standards of DNP, to 40% by 2010.To increase the purchasing rate of environmentally certified products, such as those labeled with the Eco-Mark, of the total supplies (office supplies and equipment) to 50% by 2010.
• To keep the maximum concentration of air emissions subject to emissions regulations at 70% of the required standard or less.
• To keep the maximum concentration of wastewater discharges subject to wastewater regula-tions at 70% of the required standard or less.
• To keep the maximum level of noise and vibration at our site perimeters at 95% of the required standard or less.
• To keep the maximum concentration of odors at our site perimeters at 70% of the required standard or less.
• To promote ISO14001 certification.• To promote Eco-Audits at all sites.
Described in this report
:Target Broadly Achieved :Achieved target or in steady progress toward target :Target not achieved

62
Environmental Pollutants
We are working to reduce emissions of environmental pollutants.
We are making efforts to monitor and reduce emissions of environmental pollutants so as to conserve both the global and local
environments. We are making steady progress toward achieving the environmental targets we have established.
[Hazardous Air Pollutants]22 hazardous air pollutants are desig-nated among the substances listed in the Air Pollution Control Law as requir-ing priority measures toward reduction. Of these, dichloromethane was used in the past as a cleaner in the printing process, but by switching to a water-based cleaner we have reduced our emissions of this substance from 52.9 tons in 2001 to 0.3 tons in 2005.
Dioxin is emitted through waste in-cineration. We eliminated small-scale incinerators, in which incineration is difficult to control, by 2002, broadly reducing emissions stemming from waste incineration. Currently, all of our active incinerators are large-scale thermal recovery incinerators that fulfill the 2002 regulations. We use six such incinerators nationwide, and continued in 2005 to maintain emissions levels far lower than those in 2000.
[Ozone-depleting substances (CFC substitute)]In the case of ozone-depleting sub-stances, we use air conditioners that employ coolant containing CFC-11 and CFC-12, and currently use ten of these units. In addition, we had been using HCFC-141b, which is a CFC substitute, as a cleaning agent in our manufactur-ing process, and reduced emissions in 2005 by switching to a cleaning agent substitute.
Dichloromethane emissions (tons)
We are working to reduce VOC emissions.
Manager, Facility Control GroupDNP Technopack Tokai
Zenichi Higuchi
Our company manufactures packaging for food and medical products. We use VOCs such as toluene in ink and acetic ether, and reducing the emissions of
these VOCs is a major issue for us. In May 2005 we installed a gas emissions proces-sor. We got it into optimal working order by doing trials and getting it running, making adjustments for seasonal changes, etc. As a result, we have been able to reduce VOC emissions by 60% in comparison with 2004. We are going to keep working for even greater emissions reduction by shooting for more efficient operations.
Dioxin emissions(mg-TEQ)
CFC substitute emissions (tons)
SOx emissions (tons)
NOx emissions (tons)
[SOx (sulfur oxides)]SOx is emitted when fuel oil is burned to fire boilers. We have been working to reduce SOx emissions by switching from fuel oil to municipal gas, improv-ing combustion facilities, and energy conservation. By switching our boilers from fuel oil to municipal gas in fiscal 2005, we were able to reduce SOx emissions.
[NOx (nitrogen oxides)]NOx is also generated when fuel is burned in production processes. As with SOx, we have thus far made ef-forts to reduce NOx by such means as improving combustion facilities and conserving energy. NOx emissions in-creased in 2005 due to an increase in energy consumption.
10
20
30
40
0'01 '02 '03 '04
23.6
37.5 37.5
29.8
25
50
75
100
0'01 '02 '03 '04
74.5
56.5
25.2 22.6
50
100
150
200
250
0'01 '02 '03 '04
44.5
'00
214.9
22.2 15.433.9
200
400
600
800
0'01 '02 '03 '04
620.4 626.7660.3
702.1
15
30
45
60
0'01 '02 '03 '04
52.9
24.9
3.60.6
'05
0.3
'05
18.9
'05
20.4
'05
3.1
'05
723.6
Reducing Air Pollutants and Switching to Low-Impact Substances

63
[COD (chemical oxygen demand)]We use wastewater treatment facilities to decontaminate and reduce the pol-lution of wastewater discharged from our production lines and dining areas, which contains organic substances. Despite working to reduce impact in the Electronics Segment in 2005 through the adoption of low-COD chemicals, an increase in production volume resulted in an increase in post-processing wastewater and COD emissions.
[Nitrogen]We have been using wastewater treat-ment facilities and water-purifier tanks to decontaminate wastewater from our plants and offices as a means of preventing the eutrophication* of public waters. In 2005, the Electronics
* Eutrophication Eutrophication is a problem affecting water quality in closed coastal water areas and lakes. This is caused by the nitrogen and phosphorous content in residential and industrial wastewater, and is characterized by an unusually high growth rate for plankton.
VOC emissions (tons)
Segment was able to reduce nitrogen emissions by reducing the amount of nitrogen- and phosphorous-containing bacterial eutrophics used in the biologi-cal treatment of wastewater.
[Phosphorous]In 2004 the Electronics Segment, which releases large amounts of drainage water, also reduced its phos-phorous amounts by such means as changing cleaning agents that contain phosphorous.
As it did for nitrogen emissions, in 2005 the Electronics Segment, which discharges large amounts of wastewa-ter, was able to maintain phosphorous emissions at roughly the same levels as in 2004 by switching to a non-phos-phorous cleaner and by reducing the amount of (nitrogen- and phosphorous-containing) bacterial eutrophics used in the biological treatment of wastewater.
COD emissions (tons)
Nitrogen emissions (tons)
Phosphorous emissions (tons)
[VOCs (volatile organic compounds)]In our printing processes we use large amounts of ink solvents, adhesive agents and cleaning agents which con-tain VOC. In order to reduce the VOC emission, we have employed such means as switching over to alternatives that have less of an environmental
impact, and installing processing and recovery equipment. In 2005, we re-duced the VOC emissions by such means as switching over to other materials and introducing processing equipment.
Environmental Performance
10,000
5,000
15,000
20,000
25,000
0'02 '03 '04
17,791 16,864
3,521
21,312
2,204
19,068
11,400
12,6421,242
PRTP-listed VOC
PRTR-unlisted VOC
'05
9,713
10,662
949
52.9
20
10
30
40
50
0'01 '02 '03 '04
32.3
41.1
49.7
10
20
30
0'01 '02 '03 '04
19.221.3
28.3
20.3
0.5
1.0
1.5
2.0
0'01 '02 '03 '04
0.9
1.6
1.1
0.4
53.3
'05
'05
14.6
'05
0.4
Reducing Water Pollutants

64
Greenhouse gas emissions calculation method
Greenhouse gas emissions are calcu-lated using emission coefficients from the "guideline for the calculation of greenhouse emissions from businesses" (Ministry of the Environment, July 2002). Calculations in the 2007 edition of this report will be made as required by the amendment of the Law Concerning the Promotion of Measures to Cope with Global Warning.
Measures Against Global Warming
We are taking measures to reduce greenhouse gas emissions such as installing energy-saving equipment, switching to better fuel types, and improving production efficiency.
Although we continued CO2 emissions reduction measures in 2005, such as installing energy-saving equipment and implementing
thorough air conditioning temperature controls in summer and winter, increases in production, particularly in the Electronics
Segment, resulted in increases in greenhouse gas emissions. Per unit CO2 emissions are at a standstill.
To reduce per unit CO2 emissions by 15% from the 1990 level by 2010.
Per unit CO2 emissions have been re-duced by 8.7%, to 18.8 tons/1 billion yen.
Method of calculating per unit energy consumption and per unit CO2 emissions
Per unit CO2 emissions = CO2 (1,000 tons) emitted through the consumption of energy (fuel, electricity)/production (1 billion yen)
Production output expresses the amount of business activity, using the total added value amount for consolidated companies subject to disclosure in this report.
* All greenhouse gas emissions amounts are converted to CO2 and given in tons.
Working to use energy efficiently and reduce CO2 emissions.
Okayama Plant, Opto-Materials Operations
Masato Igarashi
We manufacture optical film at our plant by applying various materials to plastic film that alter its opti-
cal characteristics. The solvent (VOC*) that we discharge during the application process is incinerated in processing equipment. The heat that is emitted dur-ing the incineration is collected and used to generate steam through a waste-heat boiler we installed in June 2005, giving us an effective way to use this heat. We generated roughly 4,000 tons of steam in 2005, and, in comparison with the steam we get from the regular boilers, we got about 11,500 gigajoules, while reducing CO2 emissions by roughly 690 tons. In this way, we are working both for the efficient use of energy and CO2 emission reduction.
Greenhouse Gas Emissions (Unit: 1,000 tons-CO2)
Per Unit CO2 Emissions (Unit: tons-CO2/1 billion yen)
* [VOC]: Volatile Organic Compounds
The DNP Group is participating in "Team -6% committee" efforts against global warming.
ManagerDNP Facility Services
Kazuo Hatazawa
DNP Facility Services is in charge of energy man-agement for DNP Group plants and offices. The
DNP Group began participating in "Team -6% com-mittee" in July 2005, and has been promoting energy conservation through measures such as turning the thermostat up 2°C in summer and down 2°C in winter and participating in the "light-down" campaign.
We are also conducting efforts at the C&I Building in Ichigaya, Tokyo, such as thorough air conditioning tem-perature controls in summer and winter, controlling the number of elevators in operation, and optimizing the use of lighting in offices, washrooms, etc. We will contin-ue to proceed with energy use optimization in 2006 in our efforts to reduce CO2 emissions.
<Individual registration in the "Team -6% committee">
The DNP Group has been participating in the Japanese government's "Team -6% committee" program for citizen ac-tion in preventing global warming since last year. This program encourages energy conservation measures such as adjusting the temperature of officesand turning off PCs and lights when not in use. We have called upon all Group employees to register individually in the "Team -6% committee" so as to broad-en this effort, and they have responded positively to furthering the goals of this program.
Target Result
20.0
15.0
10.0
5.0
0'90
20.6
'01 '02
18.1
'03 '04
18.717.7
19.0
1,000
750
500
250
0'90
550
'01 '02
849
'03 '04
899842
936
'05
964
'05
18.8
Energy consumed
Industrial wastes incinerated
waste-heat boiler
"Black Illumination" (signage lighting)

Environmental Performance
65
We are making progress in transport efficiency and ensuring safety.
General Manager, DNP Logistics
Sadao Obara
Our principle is, "We do our work on roads created for public use, so we must by all means avoid
causing trouble to others using the roads." We there-fore put serious effort into safety training for our site supervisors and our drivers. Site supervisors have face-to-face "TAIWA" with drivers at morning and evening roll call, and each driver is called upon to declare a "personal safety pledge." During the National Traffic Safety weeks conducted in the spring and fall, our site supervisors work with traffic safety organizations to conduct pedestrian guidance at intersections. This is part of our safety training, which teaches the impor-tance of seeing from the pedestrian’s point of view.
We are reducing CO2 emissions from our trucks by conducting more efficient transport operations.
Environmental Impact from Transport
DNP Logistics handles transport for the DNP Group. It is based in the Tokyo area but covers a wide area from Northeast Honshu to
Kyushu, and is making solid progress in reducing the environmental impact of our transport operations.
CO2 emissions stemming from trans-port operations in 2005 amounted to 4,540 tons, a 25.8% decrease in com-parison to 2000. Progress was made in reducing per unit CO2 emissions due to an increase in transport volume, but transport fuel consumption per unit of sales is on an upward trend.
To reduce per unit CO2 emissions per unit shipped (CO2 emissions/shipped weight/distance shipped) by 5% from the 2000 level.•To reduce per unit fuel use for trans-port (amount of fuel used/sales) by 20% from the 2000 level.
Transitions of CO2 emissions and fuel use for transportation
CO2 emissions from transport (t-CO2)
DNP Logistics has made progress to-ward greater efficiency by optimizing its fleet of transport vehicles and distri-bution routes, and by installing digital tachometers. Other efforts toward re-d u c i n g C O 2 e m i s s i o n s i n c l u d e implementing an idling stop policy, bringing CNG and hybrid vehicles into the fleet, and making the transition to
larger vehicles. DNP Logistics has been participating in the Eco-Report System, which is the DNP Group envi-ronmental management system, and has added to the environmental im-provement activit ies it is already engaging in by acquiring ISO14001 certification for its Itabashi Offices. The company plans to continue pursuing ISO14001 certification for its offices, with the Akabane Offices scheduled for certification in autumn of this year.
•Reduced 48.0% of CO2 emissions•Reduced 5.1% of fuel use for transport
* Transportation ton/km (t·km) ∑ (amount of cargo x distance)
Targets
Results
Morning and evening roll call
Efforts to reduce CO2
80
60
40
20
100
120
Target
Target
0
8
6
4
2
10
12
0'00 '01 '03'02 '04
115.0
8.33
95.5
84.6 79.0
76.0
59.8
7.907.76 7.76 7.877.79
'05
Per unit CO2 emissions (ton/1 million ton, km)
Fuel use for transportation (Kl/1 billion yen)
4,000
0
5,000
6,000
7,000
'00 '01 '03'02 '04 '05
6,120
5,310
4,700
4,630
4,640 4,540

66
Zinc compound (water-soluble) 6.8 0.0 0.0 6.8 0.0 0.0 0.0 0.0
Bis(2-ehtylhexyl) adipate 1.1 0.0 0.0 0.0 0.2 0.0 0.0 0.02-Aminoethanol 38.9 0.0 0.0 4.1 34.7 0.0 0.0 0.0
Isophorone-di-isocyanate 21.8 0.0 0.0 0.0 0.0 0.0 21.8 0.0
Ethyl-benzene 208.4 2.0 0.0 0.0 3.1 47.1 74.9 81.3
Ethylene glycol 10.8 0.0 0.0 0.0 7.9 0.0 2.9 0.0
Ethylene glycol monoethyl ether 21.3 0.6 0.0 0.0 3.1 0.0 5.3 12.3
Ethylene glycol monomethyl ether 60.5 2.1 0.0 0.0 7.5 0.0 25.4 25.5
Epsilon-caprolactam 19.7 0.0 0.0 0.0 1.5 0.0 18.2 0.0
Xylene 283.3 6.8 0.0 0.0 5.7 58.8 88.5 123.5
Silver and its water soluble compounds 16.1 0.0 0.0 0.2 3.7 6.2 1.6 4.5
Chromium & chromium (III) compounds 160.7 0.0 0.0 0.0 47.8 81.1 28.9 2.8
Hexavalent chromium compounds 38.4 0.0 0.0 0.0 0.8 0.1 21.6 15.9
Cobalt and its compounds 5.7 0.0 0.0 0.0 1.7 0.8 3.1 0.0
Inorganic cyanide compound 4.2 0.0 0.0 0.0 3.4 0.0 0.0 0.8
1,1 Dichloro-1-fluroethane 19.0 18.9 0.0 0.0 0.0 0.0 0.0 0.0
Dichloromethane 5.1 0.3 0.0 0.0 0.0 0.0 0.0 4.2
Dioxins 0.0 3.1 0.0 0.0 164.0 0.0 0.0 0.0
Water soluble copper salts 578.4 0.0 0.0 0.0 162.3 312.0 101.2 3.0
1,3,5-trimethylbenzene 7.2 0.1 0.0 0.0 0.0 4.4 0.0 2.8
Toluene 16,309.3 914.4 0.0 0.0 1,751.5 2,929.9 2,556.2 8,157.2
Lead and its compounds 171.3 0.0 0.0 0.0 117.7 12.0 41.7 0.0
Nickel 2,545.0 0.0 0.0 0.0 0.0 1,242.6 1,280.7 21.8
Nickel compounds 781.0 0.0 0.0 0.0 89.1 689.4 2.1 0.4
Hydroquinone 4.4 0.0 0.0 4.4 0.0 0.0 0.0 0.0
Di-n-butyl phthalate 1.1 0.0 0.0 0.0 0.0 0.0 1.0 0.1
Bis (2-ethylhexyl) phthalate 19.9 0.1 0.0 0.0 1.6 0.0 15.9 2.2
1,2,4-Benzenetricarboxylic acid-1,2-anhydride 9.8 0.0 0.0 0.0 0.6 0.0 9.2 0.0
Boron and its compounds 17.6 0.0 0.0 0.4 12.5 0.0 4.6 0.0
Octylphenol ether 5.8 0.0 0.0 0.1 0.0 0.0 5.7 0.0
Formaldehyde 3.2 3.2 0.0 0.0 0.0 0.0 0.0 0.0
Manganese compounds 11.8 0.0 0.0 0.0 4.5 2.0 5.4 0.0
Molybdenum compounds 1.1 0.0 0.0 0.0 0.0 0.0 1.0 0.0
21,388.7 948.5 0.0 16.0 2,260.9 5,386.4 4,316.9 8,458.3
•VOC emissions totaled 10,662 tons in 2005, a reduction of 1,980 tons in comparison to the previous year, and a 50% reduction in comparison to 2002, thereby achieving our target.
•We will continue to work to reduce the VOC emissions, stepping up our reduction goal to a 70% reduction in comparison to 2002 by 2008.
Chemical Substances
We are making extensive reductions in the emissions of chemical substances.
We are working to reduce emissions of all Volatile Organic Chemicals (VOCs) listed under the PRTR Law as "Class 1 for
emissions or transport", with the goal of reducing the environmental impact of chemicals used in our manufacturing processes.
•To reduce emissions of VOCs by 50% compared to 2002 by fiscal 2005.
Chemical Substances subject to the RPTR Law (tons; dioxins: mg-TEQ)
* The data above are compiled with PRTR results. In accordance with the data compilation limits stipulated by the PRTR Law, substances are subject to compilation when the amount of the said substance handled in one year is one ton or greater.
* The amount handled has decreased in comparison with last year's report, with a reduction in emissions of 24.0%.
Solvent processing equipment: DNP Tohoku
Solvent processing equipment: Okayama Plant, DNP Opto-Materials
* [The PRTR Law]: The PRTR Law is a law enacted to promote the monitoring and control of emissions of designated chemicals into the environment.
Substance HandledEmissions
to AirEmissions to
Public WatersTransferred to Sewer System
Transferred as Waste Recycled Consumed
Removed/ Consumed
•Target Result

Environmental Performance
67
To increase the rate of the fractional recovery of waste paper to 65% of that for general waste.
The amount of used paper collected in 2005 was 1,298 tons, with a collection rate of 74.4%. The collection rate was improved in the Ichigaya area (Ichigaya Publication Printing Operations), which is a large-scale operation.
We are reducing waste from our production processes and recycling paper and water used at our offices and plants.
Resource Recycling
We are putting efforts into separating and collecting the used paper generated by our offices, as well as the efficient use and
recycling of water. In addition, we seek to achieve "zero emissions" at our plants.
Wastepaper collection/Wastepaper collection rate(tons·%)
Transition of the amount of recycled water (1,000 m3)
Transition of the amount of rainwater used (m3)
Water Input-Output (The total amount for the DNP Group in FY 2005)
* Wastepaper collection rateWaste paper collection/wastepaper collection + general waste amount(excluding cans, bottles, and garbage)
* As water is mainly used for heating or cooling the manufacturing equipment, air condition-ing in buildings, and in product cleaning, the majority of plants are starting to use recycled water through a closed system. The amount of recycled water is the total amount that flows through heat exchangers and cleaning equipments in these closed systems in one year.
* Water usage ratio = (amount consumed + wastewater amount + amount of recycled water)/amount of water used
Hokkaido Coca-Cola Bottling and the The Inctec use a portion of its water consumption amount in products.
We used 5.32 billion m3 of recycled water in 2005 in cleaning our products, heating and cooling our production equipment, and air conditioning our buildings. Our water usage ratio was 35-fold.
We are also making effective use of rainwater at our C&I Building and the DNP Logistics No. 2 Building. We used 5,140m3 of rainwater in 2005, which amounts to 29% of the water used for to i le t f lush ing and water ing our grounds.
* Compiled from data obtained at sites where relevant information was available.
Target
Result
500
1,000
1,500
2,000
0
20
40
60
80
0'01 '02 '03 '04
1,015
60.7
1,074
62.3
1,231
68.4
1,242
'05
1,298
73.8 74.4
Year
Waste paper collection
Cardboard
Magazines
Newspapers
High quality paper
General waste
Waste paper collection +general waste amount
Wastepaper collection rate
Number of sites
2001
1,015
125
740
78
72
657
1,672
60.7%25
2002
1,074
154
770
65
86
651
1,725
62.3%27
2003
1,231
165
930
65
71
569
1,800
68.4%29
2004
1,242
195
906
52
88
441
1,683
73.8%30
2005
1,298
234
953
31
80
446
1,743
74.4%
29
Recycling used officepaper
600,000
500,000
400,000
300,000
200,000
100,000
0'01 '02 '03 '04
473,489 479,604 523,556 529,420
7,000
6,000
5,000
4,000
3,000
2,000
1,000
0'01 '02 '03 '04
4,850 4,820 4,660
6,310
'05
532,074
'05
Water consumption15,653,000m3
Flow of processes that do notuse the water recycling system
13,380,000m3
Flow of processes that use thewater recycling system
532,074,000m3
Product164,000m3
Wastewater13,216,000m3
Evaporation2,273,000m3
INPUT
OUTPUT
5,140
Efficient use and recycling ofwater

68
To achieve the following targets by 2005:• To reduce per unit waste emissions
(waste emissions/production) by 40% from the 2000 level.
• To reduce undesired material genera-tion by 25% from the 2000 level.
• To reduce the undesired material generation ratio (undesired material generation/total material input) by 20% from the 2000 level.
• To achieve an 80% recycling ratio (recycled amount/total amount of undesired material generation) in the disposing main raw materials.
• To achieve zero emissions at 30 sites.
• Per unit waste in 2005 was 0.185 tons/1 million yen, a 40.7% decease in comparison with 0.312 tons/mil-lion yen in 2000, achieving targets. Production output expresses the amount of business activity, using the total added value amount for consolidated companies subject to disclosure in this report.
• The total amount of undesired mate-rial generated in 2005 was 503,000 tons, a 22.1% decrease compared to the 646,000 tons generated in 2000. Nevertheless, this fell short of our target of 25%.
• Undesired material generation rate in 2005 was 12.9%, marking a 27.1% achievement over the 2000 rate of 17.7%.
• Recycling rate was 79.4% roughly at the target level, just short of the tar-get of 80%.
• Zero emissions (a landfill waste rate of 0.5% or less) in the processing of undesired material from plants was achieved at 31 sites, achieving the 2010 goal.
Resource Recycling
Breakdown of undesired materials
<Paper recycling rate: 99.8%>
The DNP Group manufactures an enormous volume and variety of products that are mainly composed of paper, such as books, magazines, catalogues, business forms, and containers. We are working through our Manufacturing 21 efforts to minimize waste and loss in our production processes, and also to reduce the amount of paper used and paper waste generated. It is never-theless impossible generating some undesired material in the process of making paper products. We therefore use great care in separating waste paper so as to provide the best material possible for paper recycling. Paper that is not suitable for use in recycling is processed as solid waste in-cinerator fuel. Through these efforts we have succeeded in achieving a 99.8% recycling rate.
Targets
Results
52%
10%
9%
21%
2% 2%
4%
11%
20%
7%
54%
1% 1%
5%
6%
9%
85%
16%
16%
12%
10%
4% 12%
31%
19%
13%
13%
7%
3% 12%
34%
15%
1%
13%
14%
3% 10%
44%
1%
39%
11%21%
17%
11%
3%
78%
4%
3%2%
10%
Total amount ofundesired materials
100%502,700tons
Waste
38.1%191,500tons
(Processed by on-site incineratorsand sludge dehydrators)
(Ash, dehydrated sludge, etc.)
Waste subject to on-siteinterim processing
22.2%111,700tons
Waste not subject toon-site interimprocessing
15.9%79,800tons
(Amount recycled for afee or free of charge)
(Final disposal after outsourcingfor interim processing)
Materialsrecycled asresources
12.7%63,900tons
Waste to outsourceinterim processing
2.4%12,100tons
Final Disposal
0.5%2,300tons
(Directly from sites tofinal disposal)
Final Disposal
1.1%5,700tons
Materials recycledas thermal
1.9%9,400tons
Waste after on-siteinterim processing
2.2%11,300tons
Valuable waste
61.9%311,200tons
Waste paper
Waste plastic
Wastewater
Sludge
Metal
Other
Waste oil
Reduct ion and Ef fect ive Use of Undesired Materials Generated in Production

Environmental Performance
69
Per unit waste emissions/Waste generation rate/recycling rate
Waste missions (1,000 tons)
Total waste generation (1,000 tons)
[Examples of Our Efforts]
We seek to create an effective system of production that minimizes resource inputting and undesired material gen-eration. We have implemented raw measures and efficiency improvement through the Manufacturing 21 activi-ties underway at our production sites. Some of these efforts include improv-ing the non-defective product ratio and shortening lead times, reducing the overall generation of undesired material, improving per unit waste, and improving the undesired material generation ratio. In addition, we have implemented raw measures such as the installation of solvent collection equipment.
We have also been able to achieve zero emissions of undesired material at 31 sites and continue to improve recy-cling rates since 2000. We have done so by implementing thorough separa-tion, processing improvements, and contractor selection, adding value (pa-per and plastic waste, sludge), creating raw material for paper manufacturing (paper waste), solid waste incinerator fuel (paper and plastic waste), distilla-tion recycling (waste solvent), and raw material for cement (ash).
[Revising Our Environmental Targets]
The cutoff point for the waste reduction targets among the DNP Group’s overall environmental targets was fiscal 2005, so the DNP Group Environmental Committee revised these targets when it met in March. The new targets, which are to be achieved by fiscal 2010, use per unit waste and undesired materials generation rate indicators in order to promote greater eco-efficiency. They seek also to promote more efficient use of resources through the improvement of recycling rates for the most impor-tant raw materials, as well as aiming for zero emissions for the entire Group so as to achieve further reduction of the landfill waste.
We have made a significant contribution to achieving the targets.
General Manager, Environmental Management OfficeDNP Precision Devices
Yasuaki Ishii
The Mihara Plant was established in 1993 for the manufacture of shadow masks for color TVs, and the range of products we make has grown. We were the second
member of the DNP Group to acquire ISO14001 certification, and have been making continuous efforts to reduce our environmental impact.
Our plant has been trying to make effective use of the waste we produce, such as by selling our waste etching acid, of which we generate a large amount, as an ingre-dient for acid manufacture. Also, we go beyond simply attempting to reduce sludge generated in large amounts by our wastewater treatment facility at the source; and also reduce the sludge emissions by selling the metals-containing sludge as valuable waste. Through these measures we have been able to make a significant contribution to the achievement of the DNP Group’s environmental targets by reducing undesired material per month by 1,100 tons, waste by 950 tons per month, and final disposul by 300 tons per month.
528
63
180
100
60
120
180
0'00 '01 '02 '03 '04
19
30
67
17
19
34
32
20
17
37
25
18
16
39
21
17
14
39
27
16
96
BC
Electronics
Lifestyle and IndustrialSuppliesInformation Communication
BC
Electronics
Lifestyle and IndustrialSuppliesInformation Communication
200
400
600
800
0'00 '01 '02 '03 '04
268
93
222
63
202
94
148
75
195
97
142
72
189
99
166
65
'05
12
38
25
16
91
'05
503
65
158
94
186
0.1
0.3
0.2
0.4
0.5
0
20
60
40
80
100
0'00 '01 '02 '03 '04
0.312
17.7
71.9
0.236
15.4
74.2
0.211
15.1
77.6
0.202
14.8
78.8
0.202
13.8
79.5
'05
0.185
12.9
79.4
Unit (tons/million)
Used productsgeneration ratio (%)
Recycle ratio (%)
185

70
Environmental Risk Management
Complying with Environmental Laws as well as Voluntary Standards and Guidelines
The DNP Group monitors trends in environmental regulations so as to ensure full compliance. We also have established and
strictly adhere to our own voluntary standards (air, water, noise, vibration, odor) and voluntary guidelines (chemical substance
management, soil contamination measures).
To achieve the following targets by 2005:•To keep the maximum concentration of air emissions subject to emissions regu-lations at 70% of the required standard or less (2005).
•To keep the maximum concentration of wastewater discharges subject to waste-water regulations at 70% of the required standard or less (2005).
•To keep the maximum level of noise at our site perimeters at 95% of the re-quired standard or less.
•To keep the maximum level of vibration at our site perimeters at 95% of the re-quired standard or less (2005).
•To keep the maximum concentration of odors at our site perimeters at 70% of the required standard or less (2005).
We have established our own voluntary standards for air, water, noise, vibration, and odor that exceed the legal require-ments in our efforts to preserve the environmental quality of the areas around our plants and to reduce the environmen-tal impact of their operations.
As the chart below shows, we contin-ued to make improvements in achieving our 2005 goals for vibration and odor since 2004. Nevertheless, there has been an increase in voluntary standards for water quality items that we have not been able to clear, such pH (hydrogen ion concentration) and BOD (biochemical oxygen demand), causing a worsening of our voluntary standard achievement rate. While we have made improvements re-garding noise since the previous year, the degree of achievement remains low com-pared to other environmental categories. We will continue to take measures such as upgrading our environmental facilities and installing equipment for the reduction of environmental impact.
* State of compliance with emissions duct regulations also included in odor measurement data.* For items for which measurements were not taken in the previous year, and in which targets were not achieved according to the most recent deemed as not achieving targets in the fiscal year concerned.
<Main Improvements in 2005>
Main air pollution measuresSoot measurementChange of fuel (from fuel oil to natural gas)Burner cleaningNOx emissions control measuresAuditing of VOC-emitting facilitiesVOC measurementEmergency response drills
Main water quality measuresWater quality measurementsSeparation and recovery of oily waterReplacement of filters and membranes at water treatment facilitiesInstallation of grease trap cleaners at dining hallsInstallation of leak collection tanksInstallation of leak reduction equipmentCleaning of pipesGrease trap cleaningSludge recycling method testsInstallation of leak barrierspH measuresReduction of nitrogen facility loadEmergency response drills
Main noise measuresNoise measurementInstallation of noise barriersSash board blockingInsulation of exhaust fansMeasures against noise from gas pipesChecking for open windowsSheet shutter upgradesMoving of printing equipment Measurement of background noise
Main vibration measureVibration measurementInspection and maintenance of relevant equipment
Main odor measuresOdor measurementUpgrading of deodorizing equipment Changing and recycling of filtersCleaning of filtersChanging activated charcoalRepairing cracks in deodorizing equipmentDeodorizing equipment temperature controlsEmergency response drills
Noise barrier/Nara Plant, DNP Data Techno Kansai
Leakage retaining wall/Utsunomiya Plant,DNP Graphica
Grease trap processing equipment/Enokicho Plant, Commercial Printing Operations
2005 Voluntary Standard Achievement Rate
Item
Air*Water*Nose*
Vibration*Odor*
Voluntary Standards (Targets)
Under 70% of legal standardsUnder 70% of legal standardsUnder 95% of legal standardsUnder 95% of legal standardsUnder 70% of legal standards
2004
96%96%56%100%92%
2005
96%93%56%100%96%
* The voluntary standard achievement ratio is determined by multiplying the indexes measuring air, water, odors, noise, and vibrations in plants subject to regulations (total measured indexes) by the target attainment indexes for each item.
* Air: Ratio of the voluntary standard achievement index number aga ins t t he t o ta l measured index number for Sox, part iculate, NOx, and dioxin.
* Water: Ratio of the voluntary standard achievement index number aga ins t the to ta l measured index number for pH, CoD, SS, etc. (excluding water temperatures)
* Noise: Ratio of time zones in which voluntary standards were achieved out of the total number of time zones in which measurements were taken (daytime, morning, evening, and night)
* Vibration: Ratio of time zones in which voluntary standards were achieved out of the total number of time zones in which measurements were taken (daytime and night)
[Ensuring Legal Compliance]We have established our own voluntary standards that exceed legal requirements so as to minimize environmental damage and the economic costs of repairing that damage, as well as to limit as much as possible the risk of losing the confidence of society, while ensuring compliance with laws and regulations. We also constantly monitor trends in environmental regula-tions and attempt to have measures in place that preempt the passage of new laws.
Targets
ResultsOur measures concerning air, water, noise, vibration, and odor

Environmental Performance
71
* Odors: Ratio of the voluntary standard achievement index number against the total measured index number for emission duct odor density, perimeter fence odor density and the number of substances for which density the measurements were taken.
We have established the “DNP Group Chemical Control Standards”for the monitoring and control of toxic chemi-cals, including raw materials, and to ensure product safety and environ-mental conservation pertaining to chemicals. Controls on 29 chemicals are implemented based upon three categories, “purchasing prohibited,” “inclusion in products prohibited,” and “inclusion in products controlled.” The chemicals are for all products and materials used in the manufacturing processes by the DNP Group.
The table below outlines the man-agement categories of the audits conducted at our suppliers in 2005, by which we renewed our database of the
amounts of chemicals subject to con-trols contained in approximately 23,000 ingredients. Using this database we then renewed our datasheet for chemi-cals contained in approximately 340 product lines from across the DNP Group, and created a structure for ensuring product safety and environ-mental conservation.
In addition, as the chemicals and solvents may leak during deliveries to the plants or during waste disposal, we endeavored to prevent accidents by enacting a Chemical Substance Management Guide, by setting up levees to prevent the liquid from over-flowing in the delivered plants, and by creating two-tier storage tanks.
Furthermore, in case of emergen-cies, we stocked up on materials that can be used during emergencies and held emergency training drills.
Chemical Substance Management System
Examples of scenario-based emergency response training
1. Establishing a Chemical Substance Man-agement System
2. Monitoring Amounts of Chemical Sub-stances Handled
3. Implementing Chemical Substance Man-agement(1) Examining Facilities(2) Managing Waste that Contains
Chemical Substances(3) Restricting Emissions through Facili-
ties Improvement (4) Management by Production Process (5) Proper Usage
4. Preparing for Accidents and Emergencies5. Education and Training
* Chemical substance management in purchasing is described on page 27.
Air pollution prevention Water pollution prevention Water pollution prevention Water pollution prevention
Kamifukuoka Plant, Electronics Devices Operations, gas leak response drill
Tokyo Plant, DNP Kenzai, ink leak response drill
DNP Technopack Tokai, oil leak response drill
Otone Plant, DNP Precision Devices, chemical leak response drill
<Chemical Substance Management Guide><DNP Group Chemical Control Standards>
1) Purchasing prohibited: 10 chemicals.These are chemicals that may not be contained in any raw materials we pur-chase.
2) Inclusion in products prohibited: 6 chemi-cals.These are chemicals that may not be contained in amounts above a prescribed level in any DNP product.
3) Inclusion in product controlled: 13 chemi-cals.These are chemicals for which inclusion in DNP products is monitored.
Warehouse Supervisor
Usage Supervisor
Storage SupervisorDisposal Supervisor
EnvironmentalCommittees
in eachOperation
Promotion Office
PRTRGroup
Chemical SubstanceManagement

72
Environmental Risk Management
The DNP Group implements soil in-spection guidelines that exceed the legal requirements. When soil con-tamination is discovered through our inspection, we file a report with the of-fice of the governor or mayor in charge of that prefecture or city, and upon instructions from the local authorities, we implement appropriate measures for removing the contamination.
In 2005, DNP inspected groundwa-ter conditions at the following sites.
A soil inspection was conducted in accordance with the “Osaka Prefecture Living Environment Ordinance” due to the dismantling of the DNP Media Create Kansai Osaka Plant. The inspection revealed that levels of trichloroethane, flourine and lead in some areas exceeded environmental standards. Soil decontamination by soil removal and replacement was thereby conducted under the guidance of the Osaka prefectural authorities.
No soil contamination was found at any other sites.
PCBs are currently in storage at 26 sites. There is a total of 294 units, an increase of 5 units from 2004. The PCBs were contained in electric equipment that was used in substa-tion facilities in our plants which are no longer in use. The PCBs are stored in special containers in special storage rooms, and are managed under the strictest of conditions in accordance with applicable regulations to ensure prevention of leakage or loss. Each site makes sure the PCBs are stored in the appropriate manner, performing daily
inspections and making regular re-ports to the authorities, and confirming storage conditions in annual internal audits.
PCB disposal began nationwide at the end of 2004. All PCB currently in storage with be disposed of as required by law according to the disposal plans for each region.
While we make all efforts to comply with environmental laws and regula-tions, over the past three years we have experienced 1 leakage of solvent onto the pavement, 2 incidents of wa-ter quality abnormalities in wastewater, 1 discharge of wastewater into public waters, and one case of inadequacy of qualified personnel.
There are no ongoing legal disputes involving environmental issues. We have unfortunately had some com-plaints from areas neighboring our plants concerning noise and odors. Whenever we receive such complaints, we launch a thorough investigation into the cause of the problem and work to make improvements to prevent a recurrence.
Soil and GroundwaterContamination
<Sites inspected for soil and groundwater pollution in 2005>
Groundwater inspectionTokyo Plant, DNP KenzaiKamifukuoka Plant (Electronics Segment)Mihara Plant, DNP Precision DevicesFukuoka Plant, DNP Nishinippon
Soil inspectionOsaka Plant, DNP Media Create Kansai
PCB storage
Legal compliance situation
<Situation over the past three years>
March 29, 2004/ Ichigaya Plant, Ichigaya Publication Printing Operations
An accident occurred involving the leak-age of ink dilution solvent, which was caused by deterioration in a pipe fitting in a gravure ink pipe. Approximately 50 liters of ink leaked outside the premises. Sand and other materials were immediately spread to absorb the solvent, and there was no leakage into the main sewer. After the accident occurred we took measures to prevent any expansion of the leakage, and we filed accident reports with both the local fire department and the water bureau. We proceeded to take measurers against recurrence under the guidance of the fire department
August 24, 2004/ Ushiku Plant, DNP Data Techno
An accident occurred when the BOD and COD value of the final discharged water was above the standard criterion. It was caused by a good quantity of isoprophy
alcohol and anon used for printing in the air conditioning drains in the plants. We exchanged the pipes to clear the drain-age in the drains which completed our measures against reoccurrence.
July 27, 2005/ Ushiku Plant, DNP Data Techno
An inspection plate cover accidentally came off of a wastewater pipe, discharg-ing wastewater, but the wastewater gate was immediately closed and the wastewater pumped out. Although the wastewater contained no toxins, about 500 liters escaped into public water, so we filed an accident report with the authorities. We changed the method for fastening the inspection plate cover under the guidance of the authorities.
February 6, 2006/ Ushiku Plant, DNP Data Techno
An on-site inspection by the public au-thorities revealed that the BOD and COD values of the plant's final effluent were in excess of the standard. The cause of this turned out to be an excess volume of injections of methanol used in testing to improve sludge processing ability. Under the guidance of the authorities we took measures to prevent recurrence by in-stalling a control system that adjusts the amount of methanol injected based on the wastewater throughput burden.
February 24, 2006/ Tanabe Plant, Dai Nippon Printing
Despite being a Type 1 Designated Electricity Management Plant, an Energy Manager had not yet been appointed. Therefore, the authorit ies issued a warning upon conducting an on-site in-spection. We reported the appointment of an Energy Manager the following March, which was acknowledged by the authorities.
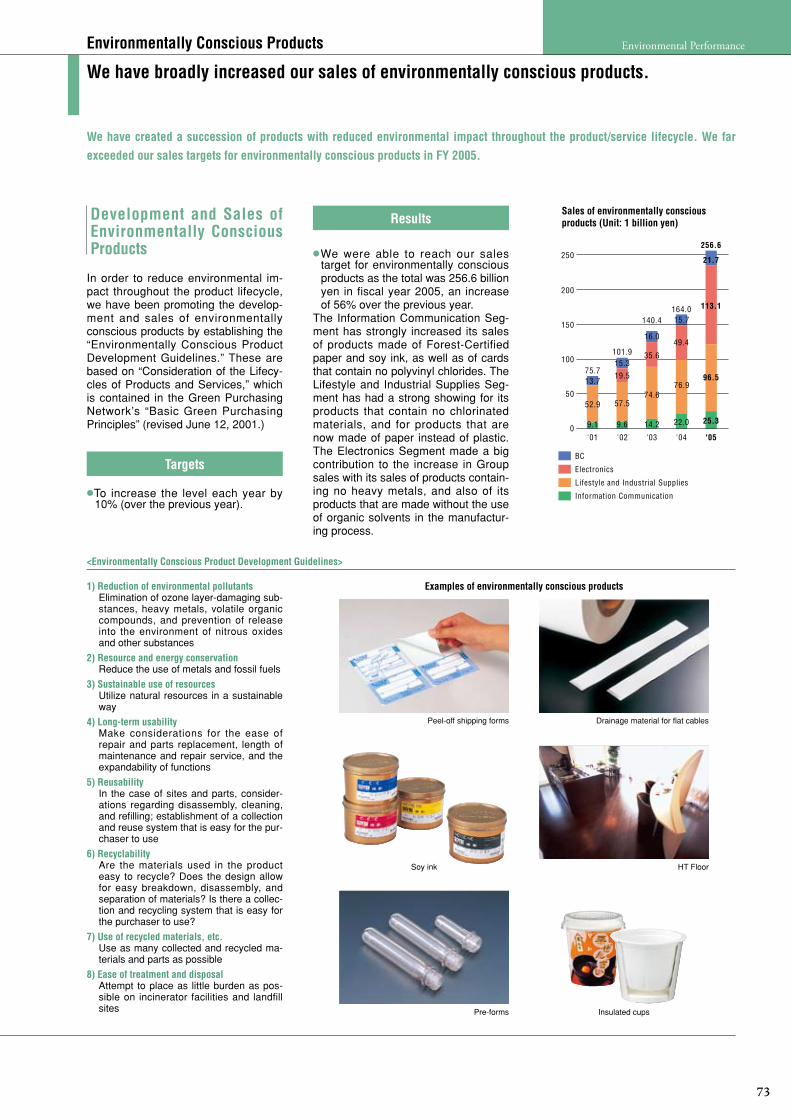
Environmental Performance
73
In order to reduce environmental im-pact throughout the product lifecycle, we have been promoting the develop-ment and sales of environmentally conscious products by establishing the “Environmentally Conscious Product Development Guidelines.” These are based on “Consideration of the Lifecy-cles of Products and Services,” which is contained in the Green Purchasing Network’s “Basic Green Purchasing Principles” (revised June 12, 2001.)
•To increase the level each year by 10% (over the previous year).
Environmentally Conscious Products
We have broadly increased our sales of environmentally conscious products.
We have created a succession of products with reduced environmental impact throughout the product/service lifecycle. We far
exceeded our sales targets for environmentally conscious products in FY 2005.
•We were able to reach our sales target for environmentally conscious products as the total was 256.6 billion yen in fiscal year 2005, an increase of 56% over the previous year.
The Information Communication Seg-ment has strongly increased its sales of products made of Forest-Certified paper and soy ink, as well as of cards that contain no polyvinyl chlorides. The Lifestyle and Industrial Supplies Seg-ment has had a strong showing for its products that contain no chlorinated materials, and for products that are now made of paper instead of plastic. The Electronics Segment made a big contribution to the increase in Group sales with its sales of products contain-ing no heavy metals, and also of its products that are made without the use of organic solvents in the manufactur-ing process.
Sales of environmentally conscious products (Unit: 1 billion yen)
Peel-off shipping forms Drainage material for flat cables
HT FloorSoy ink
Pre-forms Insulated cups
1) Reduction of environmental pollutantsElimination of ozone layer-damaging sub-stances, heavy metals, volatile organic compounds, and prevention of release into the environment of nitrous oxides and other substances
2) Resource and energy conservationReduce the use of metals and fossil fuels
3) Sustainable use of resourcesUtilize natural resources in a sustainable way
4) Long-term usabilityMake considerations for the ease of repair and parts replacement, length of maintenance and repair service, and the expandability of functions
5) ReusabilityIn the case of sites and parts, consider-ations regarding disassembly, cleaning, and refilling; establishment of a collection and reuse system that is easy for the pur-chaser to use
6) RecyclabilityAre the materials used in the product easy to recycle? Does the design allow for easy breakdown, disassembly, and separation of materials? Is there a collec-tion and recycling system that is easy for the purchaser to use?
7) Use of recycled materials, etc.Use as many collected and recycled ma-terials and parts as possible
8) Ease of treatment and disposalAttempt to place as little burden as pos-sible on incinerator facilities and landfill sites
<Environmentally Conscious Product Development Guidelines>
Examples of environmentally conscious products
Targets
Results
9.1 9.6 14.2 22.0
50
150
250
100
200
0'01 '02 '03 '04
52.9
13.775.7
57.5
15.3
19.5
101.9
74.6
16.0
35.6
140.4
76.9
15.7
49.4
164.0
25.3
'05
96.5
21.7
113.1
256.6
BC
Electronics
Lifestyle and Industrial Supplies
Information Communication
Development and Sales of Environmentally Conscious Products

74
*[Products conforming to Green Purchasing Standards]Paper: Paper made from recycled pulp, non-wood pulp paper, ECF/TEF pulp paper (paper made from non-chlorine bleached pulp), FSC-certified forest pulp, biodegradable resin. Ink: Soy ink, water-based ink, and non-toluene ink (ink that does not contain toluene), substitute solvent, recycled solvent. Manufacturing supplies: Eco-mark certified products, reused or recycled materials. Sites subject to these standards are the 32 sites under the jurisdiction of DNP’s Purchasing Division.
Purchasing rate for environmentally-conscious products (%)
We have established targets for green purchasing of raw materials and gen-eral materials with the goal of reducing upstream environmental impact and creating a sustainable recycling-based society.
•To increase the rate of the products purchased according to the green purchasing standards of DNP, to 40% by 2010.
•To increase the purchasing rate of en-vironmentally certified products, such as those labeled with the Eco-Mark, of the total supplies (office supplies and equipment) to 50% by 2010.
In 2005 we succeed in increasing our purchasing ratio for environmentally-conscious raw materials (Purchasing Division Green Purchasing Standards) by 3.9 points, and our purchases of en-vironmentally-friendly general supplies (products with Environmental Label certification, such as the Eco-Mark) by 11 points, to 27.5% and 41.6% respec-tively.
[Efforts in Raw Materials (paper, ink, and manufacturing supplies)]We improved our purchasing rate for environmentally-conscious materials in 2005. The Information Communication Segment increased purchases of ECF-pulp and TCF-pulp paper, while the clear-vapor deposit film and barrier film of the Lifestyle and Industrial Supplies Segment and the steel frames and arsenic-free glass used in the shadow masks of the Electronics Segment received environmentally-conscious certification.
Green Purchasing / Environmental Label Certification
We are making progress in our “green purchasing” of raw materials and general sup-plies, and in acquiring CoC and EPD certification.
We putt priority in purchasing to low-environmental impact parts, materials, equipment, and office supplies, and are making
efforts to reduce the environmental impact of production processes upstream. We also are promoting Environmental Label
certification, which provides proper environmental information about products.
In regard to environmental labels, we are acquiring the “S-mail recycled paper type” Eco-Mark, and in addition are promoting the acquisition of CoC certification for use as a Type I envi-ronmental label. The CoC certification system guarantees that the pulp used in making the printed materials is For-est Certified as having originated in forests that are managed according to environmentally sound practices. We are endeavoring to promote the sales of CoC certified products.
We also acquired EPD certification in June 2005 for Type III labeling of fused thermal transfer materials and dye-sublimation transfer materials. EPD is an environmental declaration program developed by Sweden’s Envi-ronmental Management Committee for the disclosure of LCA data reviewed by a third party.
[Efforts in General Supplies (stationery and office supplies)]We broadly increased our purchases of environmentally-conscious general supplies because of an increase in the selection of newly-certified environ-mentally-conscious products.
CoC and EPD Certification Acquisition Status
*Date of initial registration
Certification Type Acquired By Acquisition Date*
FSC-CoC DNP Tokai Oct. 2002 SGS*
FSC-CoC Commercial Printing Operations Aug. 2003 SGS
FSC-CoC DNP Media Create Kansai Sep. 2003 SGS
FSC-CoC DNP Trading Dec. 2003 SGS
FSC-CoC Yokohama Plant, Packaging Operations Dec. 2005 SGS
FSC-CoC DNP Tohoku Mar. 2006 SGS
FSC-CoC Ichigaya Publication Printing Operations Mar. 2006 SGS
PEFC*-CoC Packaging Operations Jan. 2004 JIA*
PEFC-CoC DNP Tokai Sep. 2005 SGS
EPD* Dye-sublimation transfer materials (2 types) Mar. 2003 JIA
EPD Fused thermal transfer materials (8 types) Jun. 2005 JIA
*[FSC] Forest Stewardship Council*[PEFC] Programme for the Endorsement of Forest Certification Scheme*[SGS] SGS ICS Japan*[JIA] Japan Gas Appliances Association*[EPD] Environmental Product Declarations
Results
Targets
Green Purchasing
30
0
10
20
40
17.621.6
15.9
26.1
18.6
24.3
30.6
23.6
41.6
27.5
'01 '02 '03 '04 '05
Raw materials
General supplies
E n v i r o n m e n t a l L a b e l Certification Registration
Organization

Environmental Performance
75
*[JIA-QA]: Japan Gas Appliances Association QA Center, QA Center
*[DNV]: Det Norske Veritas (Norway)
*[AJA]: AJA Registrars Ltd.
*[JCQA]: JIC Quality Assurance Ltd.
*[PSB]: PSB Certification Pte Ltd. (Singapore)
*[LRQA]: Lloyd’s Register Quality Assurance Ltd.
*[JACO]: Japan Audit and Certification Organization for Environment and Quality
*[CISQ]: Federazione Certificazione Italiana dei Sistemi Qualit Aziendali (Italy)
•To promote ISO14001 certification at 30 sites by FY2005.
We promote the acquisition of ISO14001 certification.
Certification Acquisition
We are promoting a unique environmental management system by creating ISO14001 compliance based on the Eco-Report
System that takes into account the special characteristics of each business domain.
ISO14001 Certificates
Okayama Plant, Information Media Supplies OperationsMihara Plant, Display Components OperationsDNP Facility Services*Okayama Plant, Decorative Interiors OperationsCHUBU Operations, DNP TokaiSayama Plant, DNP TechnopackKobe Plant, Decorative Interiors Operations (same system with No. 4)Tokyo Plant, The InctecKansai Plant, The Inctec (same system with No. 8)Utsunomiya Plant, The Inctec (same system with No. 8)Ushiku Plant, IPS Operations DNP Technopack Tokai Tien Wah Press (Singapore)Chikugo Plant, DNP NishinipponKyoto Plant, Electronics Devices OperationsSayama Plant, Information Media Supplies OperationsDNP Media Create KansaiAdvanced ColortechTokyo Plant, Decorative Interiors Operations (same system with No. 4) Kamifukuoka Plant, Electronics Devices OperationsFukuoka Plant, DNP NishinipponItabashi Area, DNP Logistics Tokyo Plant, DNP Ellio Osaka Plant, DNP Ellio (same system with No. 23)Warabi Plant, IPS Operations (same system with No. 11)Nara Plant, DNP Data Techno KansaiTien Wah Press (Johor Bahru)Otone Plant, Display Components Operations (same system with No.2)Kashiwa Plant, DNP Techno PolymerKansai Plant, DNP Techno Polymer (same system with No.29)DNP Photomask EuropeDT Fine Electronics*
123456789
1011121314151617181920212223242526272829303132
Nov. 1997Jul. 1998Apr. 2000Jul. 2000May 2001Dec. 2001Jan. 2002Jan. 2002Jan. 2002Jan. 2002Mar. 2002Mar. 2002May 2002Jun. 2002Jul. 2002Oct. 2002Mar. 2003Jan. 2004Jan. 2004Mar. 2004Jun. 2004Oct. 2004Jan. 2005Jan. 2005Mar. 2005Jun. 2005Nov. 2005Mar. 2006Mar. 2006Mar. 2006Apr. 2006Mar. 1997
JIA-QA*DNV*AJA*
JIA-QAJIA-QADNV
JIA-QAJCQA*JCQAJCQADNVJCQAPSB*DNVDNV
JIA-QAJIA-QAJCQA
JIA-QAAJADNVAJA
LRQA*LRQADNVDNVPSBDNV
JACO*JACOCISQ*JACO
•By FY2005, 31 sites had acquired certification, meeting our target.
DNP Photomask Europe of Italy was added to this list as of April 2006, bringing the certification total to 24 systems at 32 sites.
* Indicates the first registration date.* DNP Facility Services acquired the certificate as part
of a comprehensive management system of quality, environment, labor safety and food sanitation; the initial registration organ was JIC-QA (JIC Quality Assurance Ltd.)
* DT Fine Electronics registered as part of Toshiba Corporation (Semiconductor Company) (Kawasaki-shi, Kanagawa Pref.)
Site
Targets Results
Mihara and Otone Plants, Display Components Operations
Kashiwa and Kansai Plants, DNP Techno Polymer
Registration Organization
Date*
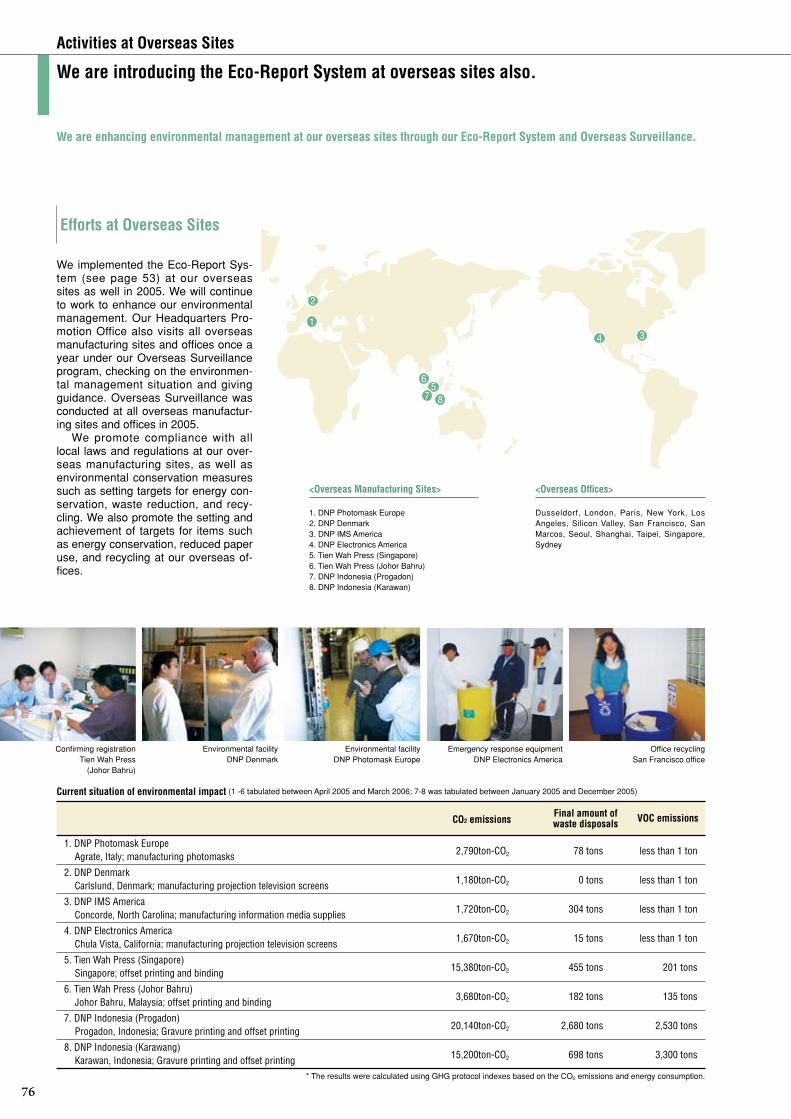
76
Activities at Overseas Sites
We are introducing the Eco-Report System at overseas sites also.
We are enhancing environmental management at our overseas sites through our Eco-Report System and Overseas Surveillance.
We implemented the Eco-Report Sys-tem (see page 53) at our overseas sites as well in 2005. We will continue to work to enhance our environmental management. Our Headquarters Pro-motion Office also visits all overseas manufacturing sites and offices once a year under our Overseas Surveillance program, checking on the environmen-tal management situation and giving guidance. Overseas Surveillance was conducted at all overseas manufactur-ing sites and offices in 2005.
We promote compliance with all local laws and regulations at our over-seas manufacturing sites, as well as environmental conservation measures such as setting targets for energy con-servation, waste reduction, and recy-cling. We also promote the setting and achievement of targets for items such as energy conservation, reduced paper use, and recycling at our overseas of-fices.
Current situation of environmental impact (1 -6 tabulated between April 2005 and March 2006; 7-8 was tabulated between January 2005 and December 2005)
* The results were calculated using GHG protocol indexes based on the CO2 emissions and energy consumption.
<Overseas Offices>
Dusseldorf, London, Paris, New York, Los Angeles, Silicon Valley, San Francisco, San Marcos, Seoul, Shanghai, Taipei, Singapore, Sydney
<Overseas Manufacturing Sites>
1. DNP Photomask Europe2. DNP Denmark 3. DNP IMS America4. DNP Electronics America5. Tien Wah Press (Singapore)6. Tien Wah Press (Johor Bahru)7. DNP Indonesia (Progadon)8. DNP Indonesia (Karawan)
Confirming registrationTien Wah Press
(Johor Bahru)
1. DNP Photomask Europe Agrate, Italy; manufacturing photomasks 2,790ton-CO2
1,180ton-CO2
1,720ton-CO2
1,670ton-CO2
15,380ton-CO2
3,680ton-CO2
20,140ton-CO2
15,200ton-CO2
2. DNP DenmarkCarlslund, Denmark; manufacturing projection television screens
3. DNP IMS AmericaConcorde, North Carolina; manufacturing information media supplies
4. DNP Electronics AmericaChula Vista, California; manufacturing projection television screens
5. Tien Wah Press (Singapore)Singapore; offset printing and binding
6. Tien Wah Press (Johor Bahru)Johor Bahru, Malaysia; offset printing and binding
7. DNP Indonesia (Progadon)Progadon, Indonesia; Gravure printing and offset printing
8. DNP Indonesia (Karawang)Karawan, Indonesia; Gravure printing and offset printing
less than 1 ton
less than 1 ton
less than 1 ton
less than 1 ton
201 tons
135 tons
2,530 tons
3,300 tons
78 tons
0 tons
304 tons
15 tons
455 tons
182 tons
2,680 tons
698 tons
CO2 emissionsFinal amount of waste disposals VOC emissions
Environmental facilityDNP Denmark
Environmental facilityDNP Photomask Europe
Emergency response equipment DNP Electronics America
Office recycling San Francisco office
2
134
56
87
Efforts at Overseas Sites

Environmental Performance
77
Environmental Education
We are constructing education and training systems so that consciousness of environ-mental issues takes root among our employees.
Type of Training Course Name Description Held in Eligibility Time of yearNo. in attendance
in 2005 (Total Participants)
Environmental Activity Overall (required)
How DNP Deals with the Environment (required)
Environmental Issues and Business (required)
Environmental Issues of the Group (required)
Risk Communications (required)
valuating health risks of chemical substances, methods of reducingemissions, disclosure of data concerning such substances
Domestic & international trends in environmental issues, revisions in environmental laws, degree of achievement of environmental targets, new targets, issues concerning specific sites
Beginners class on ISO 14001 and LCA
Environmental information to be used when presenting customers with proposals concerning environment-oriented businesses
Environmental laws and regulations
Basic knowledge of the environment issue, its impact and improvement means such as environmental conservation facilities
Basic environmental knowledge and conservation efforts of the DNP Group
1994
1997
1999
2000
1993
2002
Education for New Recruits
Network Learning
Environmental Communications
All new recruits
Technicians in their 2nd year of
employment
Technicians
Employees with more than 2 years experiencein the sales and planning
divisions
All employees of DNP Group
S i t e m e m b e r s a n d factory-related personnel of the operations' group environmental committee
Site members of the operations' group
environmental committee
When joining the company
Fiscal year of attending
the seminar
At irregular intervals
Employees can decide for
themselves
Semiannual
Twice a year upon issuing of the Eco-Report
At irregular intervals
438 persons (3,673 persons)
Technical Seminar
Technical Seminar
Correspondence Course
Eco-report Training
286 persons(2,564 persons)
164 persons(314 persons)
1,634 persons(8,837 persons)
0 persons(263 persons)
Technical seminar held March 8, 2006(Topic: Industrial waste)
I took an environmental course so that CSR can fully take root at the workplace.
Technical OperationsDNP Tokai
Toshiaki Yatsuhashi
As the central organization within the DNP Tokai Manufacturing 21 Pro-motion Group, the ISO Bureau is currently engaged in restructuring our
Integrated Management System (IMS), which consolidates all of the various international standards, such as ISO14001, Forest Certification, ISO9001, and JISQ15001, under a single system. I was inspired to take an environmental course because I believe in the importance of a company’s behavior in so-ciety and in corporate compliance with laws and societal ethics in realizing the sustainable pursuit of profit. These are major factors in a company’s CSR (corporate social responsibility), and taking the course helps ensure that the knowledge of laws with which we must comply as members of the DNP Group becomes thoroughly understood within the ISO Bureau.
The lectures that I attended on environmental laws focused on common themes within these laws, and were very easy to understand. The lecture materials and topics have been effectively developed as part of environ-mental education focusing on employees at the level of Section Manager and above. We, in the central organization, get quite a few inquiries through the business segments every year from clients concerning environmentally conscious products and services. I hope to attend more such lectures, which contain a lot of specific details and useful explanations of actual examples, so as to help develop the full potential of this business.
Technical seminar held November 25, 2005 (Topic: Environment)
Environment (optional)
Optional

78
Environmental Accounting
We manage costs and economic benefits in order to continue improving our environ-mental conservation efforts.
Our environmental accounting follows the Ministry for the Environment guidelines for effective environmental management and is
a social communication tool. We reduced our VOC emissions in 2005.
(1) Use as an environmental manage-ment tool for the DNP Group
• Environmental accounting produces a breakdown of environmental con-servation costs as that can be used as a reference for determining the effectiveness of environmental con-servation activities.
• Environmental accounting data is used to determine the cost of indi-vidual environmental facilities, the Group’s overall budget for environ-mental conservation, and the amount of investment in environmentalactivities.
• Environmental accounting is used to monitor and evaluate the effects and achievements of activities performed throughout the year in order to en-sure continuous improvement in our environmental performance.
(2) Use as a tool for communicating with society
• Environmental accounting provides the means for the public release of our environmental conservation ef-forts and their results.
• We use the reception concerning our environmental accounting reports as received from shareholders, clients, and local communities as a reference for improving our approach to envi-ronmental conservation.
Table (1) Environmental conservation costs (Categories corcesponding to business activities)
* Includes ¥400,000 for WWF and ¥200,000 for Japan Greenery Research and Development Center
<Environmental Accounting Calculation Bases>
1) Period covered: April 1, 2005 through March 31, 2006 (Environmental conservation facilities are those considered as of March 31, 2006)
2) Scope of coverage: Of companies subject to our consolidated financial accounting, environmental accounting was applied to the Group’s domestic manufacturing companies (43 companies and 54 sites), one distribution company, one in-house food catering company, and one important company covered under the equity method.
3) Monetary unit: All monetary figures are expressed in millions of yen, rounded off to the nearest million.
4) Announcement format: Used the format in the 2005 version of the Environmental Accounting Guidebook by the Ministry of the Environment.
5) Basis for the environmental conservation cost• The environmental conservation costs include depreciation expenses for investments. Depreciation
is applied in accordance with corporate tax law regulations.• Personnel costs for full-time workers were calculated at the average labor cost per person, while
personnel costs for workers holding two or more posts were calculated at 1/10 or 1/5 the average personnel cost per person, depending on the worker’s assigned duty.
• R&D costs are the total costs incurred by our 10 R&D centers in the development of environmen-tally conscious products and manufacturing equipment
6) Basis for environmental conservation benefits• DNP uses consumption per added-value as an indicator for the volume of resources (energy and
water) spent on business activities, as well as for the volume of waste materials and CO2 emis-sions. Furthermore, the DNP Group uses the added-value total of the company concerned as an indicator of the volume of business activities, given that companies within the Group perform prod-uct transactions. The added-value amount is calculated pursuant to the “Management Analysis of Japanese Corporations” issued by the Ministry of the Economy, Trade and Industry.
• Environmental pollutant emissions’ volume into the air for the business area costs from this period refers to the total volume of PRTR-listed VOCs.
• The benefit related to goods produced by business activities is the benefit of the reduction of CO2 emissions when disposing of or recycling containers or packaging.
• The benefit related to the environmental impact of transportation is the benefit of reduced CO2 emissions during the transportation of products by the distribution company subject to DNP’s con-solidated accounting.
7) Bases for the calculation of the economic benefit of environmental conservation activities• The benefit corresponding to global environmental conservation and resource circulation costs are
calculated respectively as saving energy costs by energy conservation and saving waste disposal costs by resource conservation.The reduction amount is calculated as follows: ((Benchmark period unit consumption - unit con-sumption for the current period) x business activity amount for the current period).
• The calculation of business activities was performed using the added-value indicated in Item 6 of the above benefit calculation basis.
• For unit consumption, we used energy cost/added-value and waste disposal cost/added value.• The benchmark period unit consumption is the gross average value for the three-year period up to
and including the previous term. However, energy costs are adjusted to current price levels in cal-culating unit consumption due to severe fluctuations in prices.
<Results of Our Environmental Accounting>
Environmental conservation costs to total costs ratio
Investment of current period
R&D cost of current period
136,059
28,692
1,318
2,696
0.97%
9.40%
Catalytic deodorizing equipment, expansion of wastewater treatment facilities, increase in waste-heat boilers, etc.
Non-PVC decorative sheets, biodegradable plastics, product weight reduction, water-based inks, etc.
62,63,66
73
(1) Business area cost
Pollution prevention cost
Global environmental conservation cost
Resource circulation costs
(Total business area costs)
(2) Up/downstream cost
(3) Administration cost
(4) R&D cost
(5) Social activities cost
(6) Environmental remediation cost
Total
854
101
171
1,126
1,126
997
220
102
1,318
1,318
2,885
1,050
3,725
7,660
129
2,036
2,386
11
65
12,287
2,200
725
3,008
5,933
115
2,078
2,696
21
0
10,842
Increase in deodorizing equipment, expansion of wastewater treatment facilities, erection of noise barriers
Increase in waste-heat boilers, motive energy inversion, thermostat and light controls
Increase in compressors, separation recycling, zero emissions (conversion to RPF / cement ingredients), use of recycled water
Cost of environmentally conscious product design and container/packaging recycling
ISO14001 inspection and registration costs, environmental measurement costs, environmental report composition costs
Research and development into environmentally conscious products and production methods
Cleanup of areas outside the plant compound, support for activities of environmental conservation groups
62,63,66,70
64
67,68,69
73
52-55,75
73
72
CategoryInvestment
2004 2005 2004 2005Details of Major Efforts
ExpenseRefer to:
ConsolidatedTotal Costs
Category Costs Ratio Details of Major Environmental Conservation Costs Refer to:
Targets
Environmental Accounting Data and Disclosure

Environmental Performance
79
<Evaluation of 2005 Environmental Accounting Performance Data>
Environmental conservation cost and environmental conservation activities1) Investment in environmental facilities increased by 19.2 billion yen (17.1%) over the previous year. In addition expansion of large-scale environmental facilities such as
waste-heat boilers and wastewater treatment facilities was due to the continuation of VOC measures (catalytic incinerator and solvent collection equipment) ongoing since 2004.
2) Business area costs were down 22.5% in comparison to the previous year. This was mainly due to a reduction in the costs of recycling and processing industrial waste.3) The increase in research and development costs over the previous year was due to an increase in the number of environmentally conscious product themes in the
Living and Industry Segment and an increase in the budget for existing themes.
Environmental conservation benefit1) An approximately 76.0 billion yen investment in solvent collection and elimination facilities was made in 2005, and emissions of VOCs were reduced by 1,938 tons.2) The conversion to LNG for fuel reduced SOX by 10%.3) Material input increased as a result of expansion of business operations, but progress was made in improving the yield rate and adding value to undesired material,
and reductions were made in undesired material and waste emissions amounts. Conversely, due to an expansion in industrial output, the greenhouse gas emissions increased. However, per unit emissions decreased due to improvements in production efficiency and increases in waste-heat boilers and inverter equipment.
Economic benefit of environmental conservation measures1) Sales of environmentally conscious products increased by 56% in comparison with the previous year, exceeding the target with a 10% increase.2) Income from recycling undesired materils showed a decrease of 90.0 billion yen in comparison with the previous year, due to a reduction in undesired material gener-
ated, mainly waste metal.3) The cost reduction benefit is calculated according to "Basis for economic benefits of environmental conservation measures" on the previous page.
The added value amount increased 5.9% in 2005 in comparison to the benchmark period (three-year average from 2002~2004). Including per unit improvement for waste, an economic benefit of 7.2 billion yen was gained. Also, due to an improvement in per unit energy consumption from the previous year, the worsening trend in energy consumption was halted.
Issues Henceforth1) Make further improvements in eco-efficiency through Manufacturing 21 activity and eliminate all waste from production processes.2) Continue to install solvent collection and elimination equipment so as to achieve the VOC emissions reduction targets.3) Continue fuel conversions (fuel oil gas, LPG natural gas) so as to improve per unit greenhouse gas emissions.
Table (2) Environmental conservation benefits
(1) Increased sales
· Economic benefit of R&D costs
Sales of environmentally conscious products
(2) Increased income
· Benefit of resource recycling costs
ncome from recycling undesired materials
(3) Cost saving
· Benefit corresponding to global environmental conservation and resource circulation costs Saving energy costs by energy conservation Saving disposal processing cost by resource conservation
163,975
3,048
-861
263
256,639
2,148
-590
335
92,664
-900
271
72
73
58,68,69
58,64
58,68,69
Sales up 56% over 2004
Reduction of waste metal
Improvement in per unit energy consumption volume
Improvement per unit due to reduction of emissions
Economical benefits of environmental conservation activitiesAmount
2004 2005 DifferenceRemarks Refer to
(1) Environmental conservation benefit related to resources input into business activities
· Benefit arising from supplied resources
Total energy input volume
Input volume of water
Input volume of main raw materials (paper, plastic, metal, etc.)
Emissions to the air
Water quality
Water emission volume
Volume of green gas emission
(2) Environmental conservation benefit related goods and services produced from business activities
· Benefit related to goods produced by business activities
(3) Other environmental conservation benefit
· Benefit related to the environmental impact of transportation
20,100
0.425
15,307
0.324
2,560
13.8
22.6
702.1
12,600
52.9
0.0
528
95.5
0.202
79.5
2,271
936
19
395.3
1.46
4,630
76.0
20,800
0.423
15,653
0.318
2,734
12.9
20.4
723.6
10,662
53.3
0.0
502.7
91.1
0.185
79.4
2,261
964
18.8
386.0
1.38
4,540
59.8
700
-0.002
346
-0.006
174
-0.9
-2.2
21.5
-1,938
0.4
0.0
-25.3
-4.4
-0.017
-0.1
-10
28
-0.2
-9.3
-0.08
-90
-16
58,64
58,67
58,67
58
58
59,62
59,62
59,63,66
59,63
59,66
59,68,69
59,68,69
68,69
68,69
66
58,59,64
64
65
65
All consumed energy was converted into average value in calories
Energy reduced by -0.002TJ per 1 billion yen in added value
Water supply, industrial water, and well water
Water reduced by 60m3 per 1 billion yen
Total weight of paper, plastic, ink and metals
Ratio of unwanted materials that are main raw materials
Calculated from supplied energy
Calculated from supplied energy
Including 12 substances covered by the PRTR report
Calculated from the amount of discharged water and average concentration
Three substances discharged in 2005
Including undesired materials other than main raw
materials
Reduction of waste emissions per amount of added valueThe value-added cost per waste disposal amount is the same as last year Including heat recovered on site
Total for 27 substances reported
Including emissions by incinerators and drying furnaces
Reduction of 2t of emissions per 1 billion yen of added value
Emitted at incineration and recycling of used containers and packaging
Reduction of CO2 emissions of 0.08t per 1t of product
1.9% reduction of CO2 emissions CO2 emissions reduced by 2 tons for each ton of goods transported 1 mil-lion ton-km
Remarks Refer to:Value
2004 2005 DifferenceCategory Category of indicator showing benefit
Table (3) Economic Benefits of Environmental Conservation Activities
· Environmental conservation benefit related to waste or environmental impact originating from business activities
CO2 emissions after product shipment
Energy consumption (TJ)Added-value unit consumption for the above(TJ/1 billion yen)
Water usage (in thousands of tons)Added-value unit consumption for the above(1,000 tons/1 billion yen)
Supplied amount (in thousands of tons)
Amount of undesired materials generated/supplied (%)
SOx emissions (tons)
NOx emissions (tons)
Environmental pollutant emissions volume(VOC emissions volume) (tons)
COD discharge (tons)Emissions of environmental pollutants(354 PRTR substances) (tons)
Generated undesired materials (1,000 tons)
Discharged waste (1,000 tons)
Added-value unit consumption for the above(ton/1 million yen)Recycle rate (%)Emissions of environmental pollutants(354 PRTR substances) (tons)
Emissions of greenhouse gasses (1,000 t-CO2)Added-value unit consumption for the above (ton-CO2/1 billion yen)
CO2 emissions (1,000 t-CO2)
CO2 emissions / volume of products
CO2 emissions during the transportation of products (tons)
CO2 emissions during the transportation / (weight x distance) (tons/million tons•km)
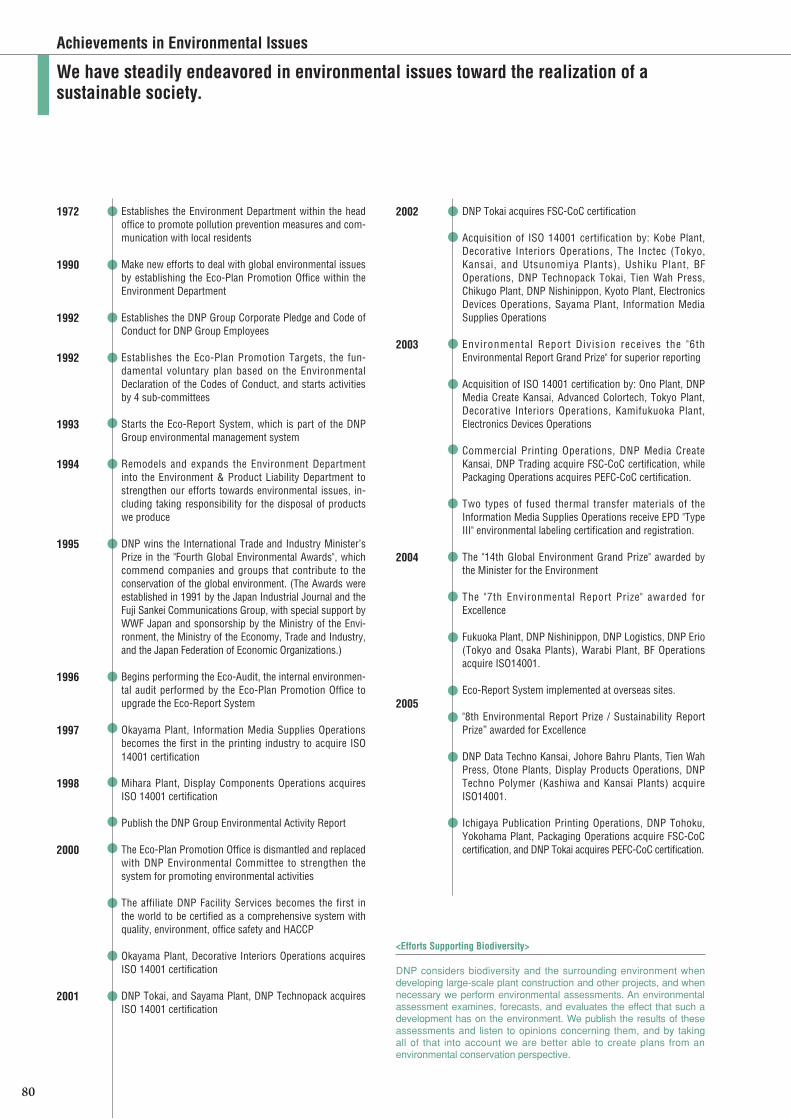
Achievements in Environmental Issues
1972
1990
1992
1992
1993
1994
1995
1996
1997
1998
2000
2001
Establishes the Environment Department within the head office to promote pollution prevention measures and com-munication with local residents
Make new efforts to deal with global environmental issues by establishing the Eco-Plan Promotion Office within the Environment Department
Establishes the DNP Group Corporate Pledge and Code of Conduct for DNP Group Employees
Establishes the Eco-Plan Promotion Targets, the fun-damental voluntary plan based on the Environmental Declaration of the Codes of Conduct, and starts activities by 4 sub-committees
Starts the Eco-Report System, which is part of the DNP Group environmental management system
Remodels and expands the Environment Department into the Environment & Product Liability Department to strengthen our efforts towards environmental issues, in-cluding taking responsibility for the disposal of products we produce
DNP wins the International Trade and Industry Minister’s Prize in the "Fourth Global Environmental Awards", which commend companies and groups that contribute to the conservation of the global environment. (The Awards were established in 1991 by the Japan Industrial Journal and the Fuji Sankei Communications Group, with special support by WWF Japan and sponsorship by the Ministry of the Envi-ronment, the Ministry of the Economy, Trade and Industry, and the Japan Federation of Economic Organizations.)
Begins performing the Eco-Audit, the internal environmen-tal audit performed by the Eco-Plan Promotion Office to upgrade the Eco-Report System
Okayama Plant, Information Media Supplies Operations becomes the first in the printing industry to acquire ISO 14001 certification
Mihara Plant, Display Components Operations acquires ISO 14001 certification
Publish the DNP Group Environmental Activity Report
The Eco-Plan Promotion Office is dismantled and replaced with DNP Environmental Committee to strengthen the system for promoting environmental activities
The affiliate DNP Facility Services becomes the first in the world to be certified as a comprehensive system with quality, environment, office safety and HACCP
Okayama Plant, Decorative Interiors Operations acquires ISO 14001 certification
DNP Tokai, and Sayama Plant, DNP Technopack acquires ISO 14001 certification
We have steadily endeavored in environmental issues toward the realization of a sustainable society.
DNP Tokai acquires FSC-CoC certification
Acquisition of ISO 14001 certification by: Kobe Plant, Decorative Interiors Operations, The Inctec (Tokyo, Kansai, and Utsunomiya Plants), Ushiku Plant, BF Operations, DNP Technopack Tokai, Tien Wah Press, Chikugo Plant, DNP Nishinippon, Kyoto Plant, Electronics Devices Operations, Sayama Plant, Information Media Supplies Operations
Environmental Report Division receives the "6th Environmental Report Grand Prize" for superior reporting
Acquisition of ISO 14001 certification by: Ono Plant, DNP Media Create Kansai, Advanced Colortech, Tokyo Plant, Decorative Interiors Operations, Kamifukuoka Plant, Electronics Devices Operations
Commercial Printing Operations, DNP Media Create Kansai, DNP Trading acquire FSC-CoC certification, while Packaging Operations acquires PEFC-CoC certification.
Two types of fused thermal transfer materials of the Information Media Supplies Operations receive EPD "Type III" environmental labeling certification and registration.
The "14th Global Environment Grand Prize" awarded by the Minister for the Environment
The "7th Environmental Report Prize" awarded for Excellence
Fukuoka Plant, DNP Nishinippon, DNP Logistics, DNP Erio (Tokyo and Osaka Plants), Warabi Plant, BF Operations acquire ISO14001.
Eco-Report System implemented at overseas sites.
"8th Environmental Report Prize / Sustainability Report Prize” awarded for Excellence
DNP Data Techno Kansai, Johore Bahru Plants, Tien Wah Press, Otone Plants, Display Products Operations, DNP Techno Polymer (Kashiwa and Kansai Plants) acquire ISO14001.
Ichigaya Publication Printing Operations, DNP Tohoku, Yokohama Plant, Packaging Operations acquire FSC-CoC certification, and DNP Tokai acquires PEFC-CoC certification.
2002
2003
2004
2005
<Efforts Supporting Biodiversity>
DNP considers biodiversity and the surrounding environment when developing large-scale plant construction and other projects, and when necessary we perform environmental assessments. An environmental assessment examines, forecasts, and evaluates the effect that such a development has on the environment. We publish the results of these assessments and listen to opinions concerning them, and by taking all of that into account we are better able to create plans from an environmental conservation perspective.
80