environment and behavior dietary © the author(s) 2012...
TRANSCRIPT

Environment and Behavior44(5) 695 –712
© The Author(s) 2012Reprints and permission:
sagepub.com/journalsPermissions.navDOI: 10.1177/0013916511403623
http://eab.sagepub.com
403623 EAB
1Pennington Biomedical Research Center, Baton Rouge, LA, USA2Children’s Digital Media Center, Georgetown University, Washington, DC, USA
Corresponding Author:Amanda E. Staiano, Pennington Biomedical Research Center, 6400 Perkins Road, Baton Rouge, LA 70808, USA Email: [email protected]
Dietary Digital Diaries: Documenting Adolescents’ Obesogenic Environment
Amanda E. Staiano1, Christina M. Baker2, and Sandra L. Calvert2
Abstract
Obesogenic environments promote excessive caloric and fat intake. A total of 23 low-income, African American adolescents digitally photographed their lunchtime food environment at a school buffet during summer camp. Depicted food was coded for nutritional content on the platescape (own plate or others’ plates) and the tablescape (open buffet). Students digitally depicted high-caloric and high-fat content, particularly students who had higher baseline waist-to-hip ratio. Students who included higher caloric and fat content in their digital diaries gained more weight over the 4-week pro-gram than those who did not. Digital photography connects adolescents’ perceived food environment with weight gain, revealing the environmental cues that promote excessive caloric and fat intake. Digital photography can also identify adolescents with problematic eating behaviors that increase risk for obesity.
Article
696 Environment and Behavior 44(5)
Keywords
food environment, adolescence, digital photography, weight, food buffet
Adolescents are embedded in obesogenic environments that constantly cue excessive eating, contributing to obesity and associated comorbidities at young ages (McGinnis, Gootman, & Kraak, 2006). Average fat and caloric intake of youth far exceeds nutritional recommendations, particularly for low-income and ethnic minority youth (McGinnis et al., 2006). This situation translates to high rates of obesity. In 12- to 19-year-old African American adolescents, 46.3% of females and 33% of males were overweight or obese (Ogden, Carroll, Curtin, Lamb, & Flegal, 2010). The microscale built envi-ronments that promote overeating may best be seen through the eyes of the adolescent.
This study is the first to use digital photography to examine the impact of adolescents’ perceived food environment on weight gain. By providing low-income, African American youth with digital cameras, we captured their exp-eriences at a summer school buffet lunch, examining how physical health affects perceived food availability and caloric and fat intake, which contribute to pediatric obesity.
Food EnvironmentsMicroscale contexts—which create one’s immediate food environment, inc-luding rooms, furniture, objects, and actual foods—can promote caloric and fat overconsumption, which then promotes unhealthy weight gain (Sobal & Wansink, 2007). To better understand how food environment affects eating behavior, salient environmental cues in the food environment can be classified by their spatial characteristics and scope (Sobal & Wansink, 2007). Kitchenscapes, tablescapes, platescapes, and foodscapes are terms developed by Sobal and Wansink (2007) to describe the multilayered food environment that facilitates food intake.
Kitchenscapes, the environment largest in physical size, are the rooms in which eating occurs. Food visibility and access, in combination with the peo-ple and activities that populate the room, can provide cues for overeating (Sobal & Wansink, 2007). School cafeterias are a primary kitchenscape for adolescents, with 52% of eating occasions for teens occurring at school (Story, Neumark-Sztainer, & French, 2003).
School cafeterias also promote a social environment of eating with friends, which can increase food consumption by 40% to 70% compared with eating

Staiano et al. 697
alone (Shide & Rolls, 1991). Eating duration with friends is longer when compared with eating alone, so there is more opportunity to consume larger amounts of food (de Castro, 1990). Adolescents and college students chiefly eat together in social settings, which distract them from monitoring food con-sumption (Hetherington, Anderson, Norton, & Newson, 2006). Higher amounts of food consumed in a school cafeteria translate to higher amounts of fat and sugar intake for adolescent males and females (Cusatis & Shannon, 1996).
Within the kitchenscape is the tablescape, which is the furniture that pres-ents the variety, abundance, and accessibility of the food to be consumed. A buffet tablescape, in particular, promotes increased food consumption due to its offerings of plentiful and diverse foods (Stunkard & Mazur, 1978). The effects of buffet tablescapes are notable for college freshmen who experience weight gain during the 1st year of college, which is largely explained by all-you-can-eat buffets in campus dining halls (Levitsky & Youn, 2004). Buffets may also contribute to expanded portion sizes, which have increased substan-tially in size over the past 3 decades (Young & Nestle, 2002).
Within tablescapes are platescapes, which are defined as the containers that hold the food to be eaten. Larger plates promote increased food intake compared with compartmentalized plates that encourage portion control (Sobal & Wansink, 2007). Participants overserve themselves and underestimate total food intake when using an exaggerated environmental cue, such as a large bowl or plate on which food can easily be piled (Wansink & Sobal, 2007). Even when physiological satiety signals are released, consumers typically over-consume calories when using large plates (Kral & Rolls, 2004).
The appearance of the food on the platescape is termed the foodscape, which provides visual indicators that promote eating. Focus group discus-sions reveal that adolescents’ food choices are influenced by appearance, smell, how the food is prepared or served, the temperature of food, and the variety of food (Neumark-Sztainer, Story, Perry, & Casey, 1999). When asked how to encourage adolescents to eat healthier foods, the most frequent response was to make healthy food look more appealing (Neumark-Sztainer et al., 1999).
Adolescent Food Choices and Perceptions of Food EnvironmentEven when provided with nutritious options, adolescents may continue to choose high-caloric, high-fat foods if they are salient in their environment (Rosenheck, 2008). In particular, overweight and obese youth are more likely to consume high-fat and high-caloric foods (Nicklas, Yang, Baranowski, Zakeri,

698 Environment and Behavior 44(5)
& Berenson, 2003), so they may be more drawn toward noticing these foods in their environment.
Low-income youth also tend to live in neighborhoods with a less healthy food environment, characterized by a high concentration of quick serve res-taurants that sell low-cost, high-calorie, high-fat foods, and a dearth of super-markets and healthful foods (McGinnis et al., 2006). Low-income youth often consume a higher percentage of calories from fat compared with higher income youth (Cole & Fox, 2004), revealing the behavioral impact of living in an unhealthy food environment.
Digital Photography as a Measure of Food EnvironmentDigital photography is emerging as an accurate, reliable measure of food intake in cafeterias, providing an alternative to direct observation or self-report (Williamson et al., 2004). This measure has been validated in school cafeterias for participants as young as elementary school students (Swanson, 2008), but photos have not been linked to weight loss or weight gain. Digital photography may provide a more accurate and cost-effective measure of food intake than traditional tools of self-report and direct observation, which are limited by recall problems, high costs, and time constraints (Swanson, 2008). In addition to using digital photography as a measurement tool, photographs may also reveal how an adolescent perceives the food environment. Allowing adolescents to digitally capture both their own food intake and their perspec-tive of the cafeteria setting provides unique insight into the accessibility and appeal of foods in their environment as well as how their food choices may potentially lead to changes in weight.
Present StudyBy providing adolescents with digital cameras to capture their summer school food environment and food intake, we hypothesized the following:
Hypothesis 1: Low-income adolescents will display high-caloric and high-fat foods on their own platescapes, their friends’ platescapes, and the tablescapes in their digital diaries, despite having nutritious food available on an affluent college campus.
Hypothesis 2: Low-income adolescents with higher initial waist-to-hip ratio will include more foods that are high in calories and fat on their own platescapes, their friends’ platescapes, and the tablescapes in their digital diaries than those with lower waist-to-hip ratios.

Staiano et al. 699
Hypothesis 3: Low-income adolescents who depict more fat and caloric content on their own platescapes will increase in weight over the 4-week summer school experience.
MethodParticipants
Twenty-three 12- to 17-year-old African American students (17 females) from urban, low-income areas of a metropolitan city were randomly selected from a college-preparatory program on a university campus. The 4-week program recruited students from low-income neighborhoods on a first-come, first-served basis, without any academic, financial, or other criteria. The ran-domly selected sample participated in a summer digital diary course as an elective to their academic classes. Participants and parents signed assent/consent forms as per the University’s Institutional Review Board policy. Par-ticipants were awarded a movie gift certificate for participation.
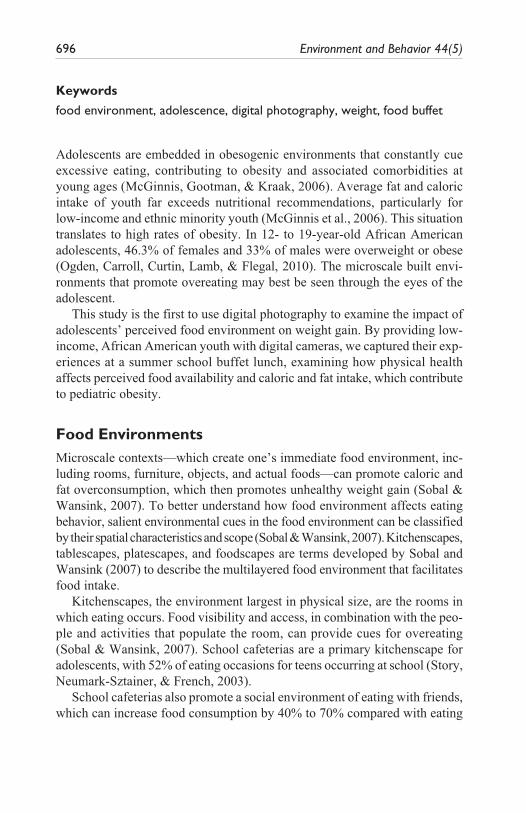
MeasuresPhysical health was measured by same-sex, trained, research assistants in a private space at baseline and at follow-up, which occurred 4 weeks after baseline. Height, waist circumference, and hip circumference were measured with a measurement tape, and weight (clothed, no shoes) was measured on a Tanita body mass scale. Waist-to-hip ratio was calculated by dividing waist circumference by hip circumference, which has been shown to be a valid indicator of health risks due to overweight (Pischon et al., 2008) and a sig-nificant predictor for all-cause mortality (Folsom et al., 2000). Body mass index (BMI) percentile was calculated using the age- and sex-specific Centers for Disease Control and Prevention BMI growth reference charts for 2- to 20-year-old youth. For adolescents, healthy weight is considered to be a BMI percentile between 5% and 85%, overweight is a BMI percentile between 85% and 95%, and obese is a percentile exceeding 95% (Kuczmarski et al., 2000). In our sample, 30.43% of participants were overweight or obese (see Table 1).
ProcedureDuring the first week of the students’ 4-week digital diary course, students brainstormed ideas for their diaries and learned how to pitch their ideas to fellow classmates. Students were instructed that their digital diaries would capture
Tabl
e 1.
Des
crip
tive
Stat
istic
s fo
r St
uden
t Wei
ghts
, BM
I Per
cent
iles,
Wai
st-t
o-H
ip R
atio
s, an
d Pr
opor
tion
Ove
rwei
ght
and
Obe
se
Mal
es (
n =
6)Fe
mal
es (
n =
17)
Tota
l (n
= 23
)
T
ime
1T
ime
2T
ime
1T
ime
2T
ime
1T
ime
2
Wei
ght
(kg)
(lo
w t
o hi
gh
valu
es)
60.1
5 (3
5.63
-105
.48)
60.4
5 (3
5.10
-106
.20)
55.2
8 (3
9.32
-98.
99)
54.2
0 (4
0.50
-101
.00)
55.3
0 (3
5.63
-105
.48)
55.6
0 (3
5.10
-106
.00)
BMI p
erce
ntile
(lo
w t
o hi
gh
valu
es)
67.5
0 (1
8.00
-98.
00)
67.5
0 (1
8.00
-98.
00)
65.0
0 (7
.00
to 9
1.00
)65
.00
(7.0
0 to
91.
00)
65.0
0 (7
.00
to 9
8.00
)65
.00
(7.0
0 to
98.
00)
Wai
st-t
o-hi
p ra
tio (
low
to
high
val
ues)
.82
(0.7
7 to
0.9
2).8
0 (0
.73-
0.92
).8
0 (0
.73
to 0
.88)
.78
(0.7
1-0.
88)
.80
(0.7
3 to
0.9
2).7
8 (0
.71-
0.92
)
Num
ber
over
wei
ght
(%)
1 (1
6.67
%)
1 (1
6.67
%)
2 (1
1.76
%)
2 (1
1.76
%)
3 (1
3.04
%)
3 (1
3.04
%)
Num
ber
obes
e (%
)1
(16.
67%
)1
(16.
67%
)3
(17.
65%
)3
(17.
65%
)4
(17.
39%
)4
(17.
39%
)
Not
e: B
MI =
bod
y m
ass
inde
x. M
edia
n va
lues
rep
orte
d fo
r w
eigh
t, BM
I per
cent
ile, a
nd w
aist
-to-
hip
ratio
. A B
MI p
erce
ntile
bet
wee
n 85
% a
nd 9
5% in
dica
tes
over
wei
ght
and
abov
e 95
% in
dica
tes
obes
e.
700

Staiano et al. 701
their summer camp experiences, through photographs of their academic and social environments, which would then be shared with fellow students. During the second week of the program, students were taught how to use the digital equipment and were given access to digital cameras to take photos in the campus cafeteria twice during the students’ lunch period. Participants were instructed to take photos of their lunchtime environment, which could include both food and friends. Students were also given the opportunity to use the cameras during academic class time, though only photos of food in the caf-eteria were coded for the present study.
Before and after taking photos, a professional filmmaker taught students how to assemble digital stories using the iMovie editing software. Students were allowed to include any of the photos they had personally captured dur-ing their academic class and lunchtime throughout the study to represent their own summer experiences. During the final 2 weeks of the program, students created and edited their digital diaries and then presented their final digital diaries to the rest of the class.
Students’ lunchtime experiences occurred in a university campus cafeteria. All students ate lunch together during a 1-hr period and could choose where to sit within the dining hall. Food was displayed on self-service buffets. Nonpartitioned circular plates were available, and students could return to the buffet as many times as they wished. See Table 2 for the food options avail-able to the participants, which included a full buffet line with meats, fruits, vegetables, grains, desserts, and beverages. Nutritional content was not avail-able to students.
Coding of Food in Digital DiariesFoods depicted in the digital diaries were coded according to estimated por-tion sizes that were digitally captured, and caloric and fat amounts were calculated from information provided by the University cafeteria’s registered dietitian and the 2008 U.S. Department of Agriculture (USDA) National Nutrient Database for Standard Reference, full version, release 21, for micro-computers. The caloric and fat content of foods digitally captured and included in the digital diaries was calculated for each participant’s digital diary and categorized based on whether the food was shown on their platescape (i.e., the student’s plate), a friend’s platescape, or the tablescape (the buffet). A total sum was also calculated for each participant, which represented total fat and caloric content depicted in the entire digital diary. Platescapes were circu-lar dining plates without partitions, placed on rectangular cafeteria trays that could hold multiple cups, plates, and bowls.

702 Environment and Behavior 44(5)
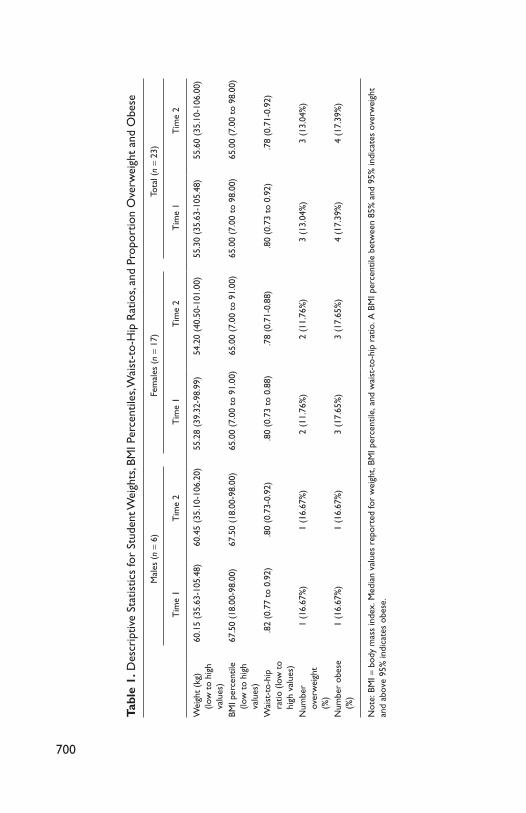
Table 2. Caloric and Fat Content of One Serving of Each Food Option for Participants During School Buffet Lunch
Total calories
Total fat (g)
Percent calories from fat
Depicted in digital diariesa
French friesb 414.43 22.15 48.10 Ice creamb 140.00 8.00 51.43 Soda 182.00 0.00 0.00 Pepperoni pizza 553.57 15.38 25.00 Chicken wingsb 300.00 19.00 57.00 Salad bar unknown unknown unknown Crispy chicken stripsb 321.05 19.19 53.80 Grilled cheese and tomato 233.81 6.08 23.40 French toast 155.00 3.00 17.42 Assorted fresh fruits unknown unknown unknown Deep fried chickenb 700.00 48.00 61.71 Chicken pattie sandwichb 304.64 12.90 38.11 Garlic breadsticks 196.42 5.21 23.87 Chocolate chip cookiesb 96.00 4.52 42.38 Captain crunch cereal 110.00 1.50 12.27 Steamed broccoli spears 30.19 0.35 10.44Not depicted in digital diaries Fried red fish 1767.69 6.98 3.55 Vegetable quesadillab 809.99 41.87 46.52 Cheese ravioli in pestob 791.59 37.65 42.81 Hamburgerb 704.74 42.17 53.85 Patty meltb 698.09 42.18 54.38 Meatball sandwichb 686.98 30.28 39.67 Beef with broccoli and black bean sauce 629.59 16.22 23.19 Philly cheese steak sandwich 551.01 16.51 26.97 Chicken cacciatoreb 536.47 33.04 55.43 Fried tofu sweet and sour 467.18 12.25 23.60 Eggplant parmesanb 465.61 27.7 53.54 Beef lo mein 464.18 10.92 21.17 Vegetable Indian curry 459.52 8.71 17.06 Sloppy Joe sandwichb 413.83 14.22 30.93 Baked macaroni and cheeseb 407.91 14.48 31.95 Alfredo sauceb 380.71 29.26 69.17 Grilled ham and swissb 366.42 17.20 42.25 Black bean burger 346.35 10.71 27.83 Cream of vegetable soupb 332.82 18.11 48.97 Cream of chicken soupb 328.89 16.59 45.40 Vegetable pizza 323.74 9.09 25.27
(continued)
Staiano et al. 703
Total calories
Total fat (g)
Percent calories from fat
Cheese pizza 312.99 9.06 26.05 Tater puffsb 308.83 14.01 40.83 Cheese and tomato casseroleb 284.35 14.16 44.82 Hot dogb 282.53 16.59 52.85 Three bean chili 262.19 2.84 9.75 Beer-battered fishb 245.81 8.93 32.70 Tomato soupb 233.75 13.47 51.86 Broccoli cheese soupb 231.84 15.3 59.39 Cream of mushroom soupb 226.24 11.09 44.12 Vegetable fried riceb 189.95 9.18 43.50 Egg noodles 181.44 2.10 10.42 Creamy coleslawb 166.29 15.52 84.00 Manhattan clam chowder 160.02 3.35 18.84 Potatoes O’Brienb 158.46 6.41 36.41 Marinated grilled chicken 152.9 4.74 27.90 Baked beans 132.3 2.10 14.29 Jasmine rice 129.64 0.28 1.94 Baked tilapia 120.17 3.66 27.41 Herb-roasted red potatoes 112.73 2.43 19.40 Lentil stuffed peppersb 108.7 3.83 31.71 Herb-roasted vegetablesb 106.68 4.14 34.93 Greek orzo 85.12 2.43 25.69 Sweet ‘n sour carrotsb 84.29 3.37 35.98 Old fashioned chicken with rice soupb 84.06 3.12 33.40 Vegetable soup 78.84 0.59 6.74 Peas and carrotsb 76.24 3.99 47.10 Turkey vegetable chowder 74.10 1.04 12.63 Marinara sauce 68.91 1.55 20.24 Chicken noodle soup 67.06 1.78 23.89 Oriental beef noodle soup 64.32 2.07 28.97 Corn on the cob 61.74 0.49 7.14 Grilled asparagusb 41.81 2.49 53.60 Tomato and zucchini sautéb 37.40 2.33 56.07 Waffle bar unknown unknown unknown Deli unknown unknown unknown Asian stir fry unknown unknown unknown
aFoods are ordered from most to least depicted on adolescents’ platescapes when presented in the digital diaries and by total calories for foods that were not depicted in digital diaries.bIndicates foods that exceed the recommendation of <30% calories from fat. Caloric and fat values are based on 1 serving size.
Table 2. (continued)

704 Environment and Behavior 44(5)
All repeat photos were only coded for the first occurring photo because these photos did not introduce new material to the digital diary. Twenty-five percent of the sample was coded by a second independent observer for inter-observer reliability. Interrater reliability, measured as Cohen’s kappa, exceeded κ = .70 for food depicted on platescape, friends’ platescapes, and tablescape. Following the completion of coding, data were compiled and analyzed using the statistical program SPSS.
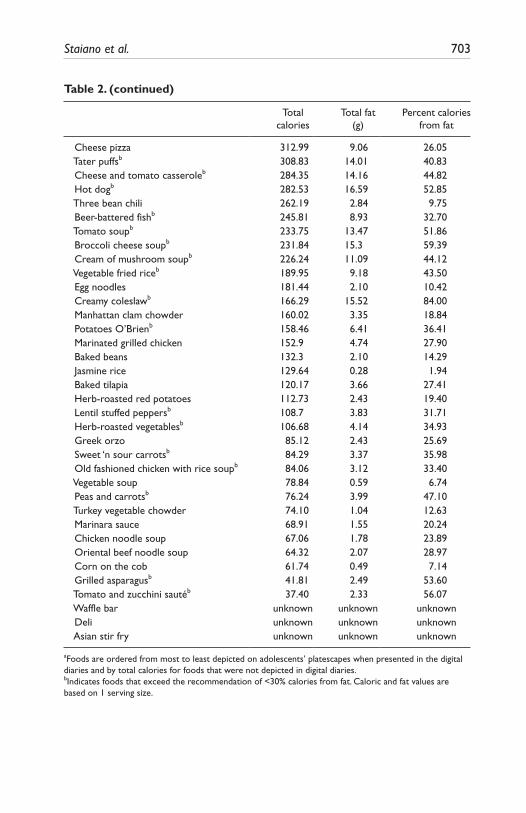
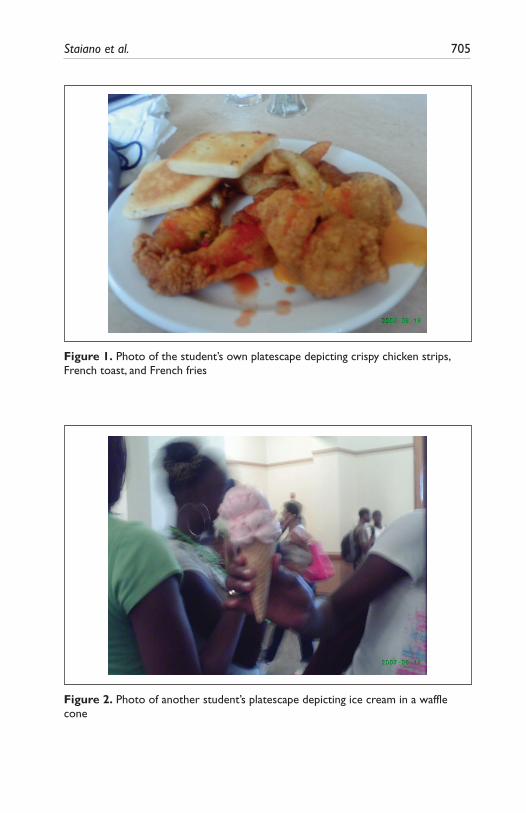
ResultsWe hypothesized that the foods depicted in students’ digital diaries would include high-caloric and high-fat content. Table 3 depicts the caloric and fat content for foods appearing on the adolescent’s platescape, on their friends’ platescapes, on the tablescape, and the combined total score. As predicted, the foods depicted in students’ digital diaries for the combined score of plates-capes and tablescapes were very high for total caloric content (M = 2019.93, SD = 1540.02) and for total grams of fat (M = 92.23, SD = 71.60). In order of most to least often depicted, the following foods were most commonly dis-played on students’ own plates: French fries, ice cream, soda, pepperoni pizza, and chicken wings. Students almost always had at least two servings of each food on their own plates. Typical platescapes are depicted in Figures 1 and 2.
Overall, the foods displayed on the tablescape were on average high in caloric and fat content. As depicted in Table 2, 50% of the food categories (7 of 14) captured in the digital diaries exceeded the USDA threshold of 30% calories from fat for school lunch foods. Of all of the food options available to students, 52.17% (36 of 69 food options) exceeded the 30% calories from fat criteria. Five food categories that were available to students were excluded from analysis because nutritional information was unavailable, as indicated in Table 2. A tablescape is depicted in Figure 3.
Table 3. Means of Caloric and Fat Content Depicted on Male (n = 6) and Female (n = 17) Own Platescapes, Friends’ Platescapes, and Tablescapes
Platescape Friends’ platescape Tablescape Total
Male Female All Male Female All Male Female All Male Female All
Caloric content
1312.62 (993.56)
838.29 (792.36)
962.03 (852.24)
90.00 (146.29)
786.24 (873.80)
604.61 (811.09)
130.23 (170.42)
567.32 (881.15)
453.30 (780.89)
1532.85 (850.17)
2191.85 (1707.27)
2019.93 (1540.02)
Fat content (g)
75.92 (64.23)
35.64 (36.81)
46.15 (47.44)
4.08 (6.48)
33.40 (39.00)
25.75 (35.91)
7.78 (11.66)
24.77 (49.97)
20.34 (36.19)
87.79 (57.22)
93.80 (77.56)
92.23 (71.60)
Note: Standard deviation indicated in parentheses. For each “All” column, the summary score is weighted by sex.
Staiano et al. 705
Figure 1. Photo of the student’s own platescape depicting crispy chicken strips, French toast, and French fries
Figure 2. Photo of another student’s platescape depicting ice cream in a waffle cone

706 Environment and Behavior 44(5)
To examine the relationship between baseline physical health and nutri-tional content depicted in the digital diaries, linear regression analysis was conducted with the baseline health measure of waist-to-hip ratio as the inde-pendent variable and nutritional content of foods as the dependent variable. Waist-to-hip ratio significantly predicted fat content on adolescents’ plates-capes, F(1, 21) = 4.602, p = .044, R2 = .180. The positive relationship indi-cated that those with higher waist-to-hip ratios at baseline depicted higher amounts of fat content on their own plate.
To examine the relationship between weight change during the 4-week program and depiction of caloric and fat content on participants’ platescape, separate linear regressions were conducted with caloric or fat content on the platescape as the independent variable and with weight change as the depen-dent variable. Weight gain was significantly predicted by both caloric content on one’s platescape, F(1, 19) = 7.333, p = .014, R2 = .278, and by fat content on one’s platescape, F(1, 19) = 10.642, p = .004, R2 = .359. Of the 23 partici-pants, 14 gained weight (3 males, 11 females), with an average weight gain of 1.02 kg. Six participants lost weight (2 males, 4 females), with an average weight loss of 1.28 kg.
Figure 3. Photo of tablescape depicting French fries
Staiano et al. 707
Discussion
This study examined the use of digital diaries as a method to capture student eating patterns and weight gain. Given the high obesity rates and poor nutri-tion typical of urban, low-income African American adolescents (Mullen & Shield, 2004), we hypothesized that students would include high-caloric and high-fat content from the cafeteria in their digital diaries, despite the avail-ability of low-caloric, low-fat, nutritious food. As expected, digital diaries contained foods with high-caloric and high-fat content. More specifically, foods with a total caloric average of 2,020 calories and a total fat average of 92 g were digitally captured. Students’ platescapes during lunch time con-sisted of food with an average of 962 calories and 46 g of fat. This caloric amount is 25.75% higher than the average caloric intake by middle and high school students at lunchtime in a school cafeteria (Newman, Guthrie, Mancino, Ralston, & Musiker, 2009). The higher than average depiction by study partici-pants may be because adolescents were exposed to an open buffet line in which they selected their own portions and could return for additional portions.
Average caloric depiction for lunchtime was also very high when com-pared with daily caloric recommendations. The USDA recommends a daily intake of 2,000 calories for a moderately active 14- to 18-year-old female and 2,400 to 2,800 calories for a moderately active male within this age range (USDHHS & USDA, 2011). The average calories depicted on the girls’ own platescapes in their digital diaries was 42% of total recommended daily caloric intake for females and 47% to 55% of the recommended daily caloric intake for males in the boys’ digital diaries. This finding is of particular con-cern considering that the depiction was only of one meal, excluding breakfast, dinner, and snacks. Moreover, the average fat content depicted on student’s own platescapes exceeded recommendations. Based on a 2,000 calorie diet, it is recommended that a 14- to 18-year-old adolescent consumes 25-35% calo-ries from fat (USDHHS & USDA, 2011), yet the average amount of fat depicted on our girls’ lunch plates was 46-64% of the recommended fat intake (based on a 2,000 average calorie daily consumption model) and a whopping 70-114% of recommended fat intake (based on a 2,400-2,800 average calorie daily consumption model) on boys’ lunch plates.
Although nutritious foods were available to the students, many of the food options at the cafeteria were high in caloric and fat content. National School Lunch Program guidelines developed by the USDA do not allow foods to exceed 30% total calories from fat (Newman et al., 2009), yet more than 50%

708 Environment and Behavior 44(5)
of the food options available to participants in the cafeteria exceeded this criteria. This finding echoes national trends in which 88% of middle and high schools serve foods that exceed the 30% maximal fat from calories recom-mended by the USDA guideline (Newman et al., 2009). Interest in these unhealthy foods was captured in the adolescents’ digital diaries, in which 3 of the 5 most frequently depicted foods exceeded the maximal calories from fat recommendation. The depiction of ice cream and French fries, two high-caloric and high-fat content foods, is particularly problematic considering these foods are available in 73% and 71% of middle- and high school cafete-rias, respectively (Newman et al., 2009). As students chose to include photos of high-caloric, high-fat foods in their digital diaries out of all the photos they had captured during the course of the study, it is apparent that students found these foods most appealing in comparison with more nutritious foods.
Although previous literature shows that low-income, urban African American adolescents often do not have access to nutritional foods, this study illustrates that students choose to eat the poor nutritional foods the most, even when healthier options were present. As the participants were from low-income homes, it is possible that they did not have access to an abundance or diversity of foods at school or at home (see the Federal Research and Action Center, 2006; Prevention Institute, 2002). Therefore, students may have compensated by eating several portions of foods in the school cafeteria during the summer program. Nonetheless, healthy options were also available at the cafeteria, including an array of fruits and vegetables.
As expected, participants who depicted higher caloric and fat content on their platescape gained more weight during the 4-week summer school pro-gram. Participants who had a higher baseline waist-to-hip ratio also depicted more fat content on their platescape than those with a lower waist-to-hip ratio. High waist circumference and high waist-to-hip ratio predict cardiovascular risk factors, including high triglyceride levels, high insulin levels, and the metabolic syndrome (Janssen et al., 2005). An effective weight loss strategy is to restrict caloric and fat intake (Spear et al., 2007), a strategy that was not being implemented at this particular cafeteria kitchenscape.
Interestingly, males depicted less fat and caloric content for their friends’ plates and tablescapes than females did. Sex differences in adolescents’ concern for others’ food choices and their food environment warrants future research.
This study was limited to capturing only adolescents’ lunchtime environ-ment, without accounting for breakfast, dinner, or snacks consumed outside of the school lunch. Even so, selections for just one meal of the day nearly met recommended amounts for an entire day’s worth of caloric and fat intake. Although the digital diaries only documented the food that participants put on

Staiano et al. 709
their plates and not what was actually consumed, those who photographed more fat and calories on their own plates were also more likely to gain weight during the summer program. Therefore, examining adolescents’ platescapes revealed a relationship between food environment and health outcomes.
Students chose what to photograph and include in their digital diaries. Because of this procedure, only platescapes and tablescapes were documented, with-out providing evidence of other environmental factors that affected adolescent food choice, such as peers, food placement, and the cafeteria layout. Examining these additional important environmental factors is an area for future research.
The kitchenscape in our study was also unlike a typical high school cafete-ria in which portions are not self-served and returns to the buffet may be restricted. A full lunch hour is also atypical of students’ lunchtime experiences during high school. Using food photography to capture more typical lunch-time experiences would provide additional examination of adolescent food environments. Nevertheless, we did capture what these students may soon be experiencing in their food environments if they enter college, and they enrolled in a program designed to prepare them for college so that outcome seems likely. Future studies could also investigate whether adolescent food patterns change as a result of digitally photographing their food choices, particularly if combined with a nutrition course about caloric intake and fat concentrations of various foods.
In conclusion, digital diaries provided a snapshot of low-income adoles-cents’ high-caloric, high-fat food environment during a summer school program in which lunch was served. School meal policies should consider the obeso-genic environments promoted during school lunchtime, including the tables-cape of all-you-can-eat buffets, the platescape of nonpartitioned plates and large trays that encourage multiple portions, and the foodscape of appealing unhealthy foods that tempt students to overconsume caloric and fat content. Our use of digital photography is a unique method to capture how adoles-cents’ perceptions of their food environment affect weight gain. Photographs reveal the environmental cues that promote excessive eating, which once identified can be altered to shape adolescents’ food choices. Digital photog-raphy may be, then, an important method to identify adolescents who are con-suming high amounts of caloric and fat content and are thus at higher risk of developing obesity and its problematic comorbidities.
Acknowledgments
We thank the students who participated in this study as well as the Meyers Institute for College Preparation program staff, particularly Ms. Charlene Brown-McKenzie, for assisting us in recruiting participants. We also thank Alex Governatori, Georgia
710 Environment and Behavior 44(5)
Papatheodorou, Alex Verdaguer, and Christine Hluchan for their assistance in con-ducting the study. We gratefully acknowledge funding by a Reflective Engagement in the Public Interest grant from Georgetown University to Dr. Sandra L. Calvert for financial support of this research.
Declaration of Conflicting Interests
The authors declared no potential conflicts of interest with respect to the research, authorship, and/or publication of this article.
Funding
The authors disclosed receipt of the following financial support for the research, authorship, and/or publication of this article:
The financial support of this research was provided by a Reflective Engagement in the Public Interest grant from Georgetown University.
References
Cole, N., & Fox, M. K. (2004). Nutrition and health characteristics of low-income populations. Volume II, WIC Program Participants and Nonparticipants (E-FAN No. 04014-2). Washington, DC: U.S. Department of Agriculture, Economic Research Service.
Cusatis, D. C., & Shannon, B. M. (1996). Influences on adolescent eating behavior. Journal of Adolescent Health, 18, 27-34.
de Castro, J. M. (1990). Social facilitation of duration and size but not rate of the spontaneous meal intake of humans. Physiology and Behavior, 47, 1129-1135.
Federal Research and Action Center. (2006). School wellness policy and practice: Meeting the needs of low-income students report. Washington, DC: Author.
Folsom, A. R., Kushi, L. H., Anderson, K. E., Mink, P. J., Olson, J. E., Hong, C. P., . . . Prineas, R. J. (2000). Associations of general and abdominal obesity with multiple health outcomes in older women. Archives of Internal Medicine, 160, 2117-2128.
Hetherington, M. M., Anderson, A. S., Norton, G. N., & Newson, L. (2006). Situ-ational effects on meal intake: A comparison of eating alone and eating with oth-ers. Physiology & Behavior, 88, 498-505.
Janssen, I., Katzmarzyk, P. T., Srinivasan, S. R., Chen, W., Malina, R. M., Bouchard, C., & Berenson, G. S. (2005). Combined influence of body mass index and waist circumference on coronary artery disease risk factors among children and adoles-cents. Pediatrics, 115, 1623-1630.
Kral, T. V. E., & Rolls, B. J. (2004). Energy density and portion size: Their indepen-dent and combined effects on energy intake. Physiology & Behavior, 82, 131-138.
Staiano et al. 711
Kuczmarski, R. J., Ogden, C., Guo, S. S., Grummer-Strawn, L. M., Flegal, K. M., Mei, Z., . . . Johnson, C. L. (2000). CDC growth charts for the United States: Methods and development. Vital Health Statistics, 246, 1-190.
Levitsky, D., & Youn, T. (2004). The more food young adults are served, the more they overeat. Journal of Nutrition, 134, 2546-2549.
McGinnis, J. M., Gootman, J. A., & Kraak, V. I. (Eds.) and the Committee on Food Marketing and the Diets of Children and Youth, Food and Nutrition Board, Board on Children, Youth, and Families, Institute of Medicine of the National Acad-emies. (2006). Food marketing to children and youth: Threat or opportunity? Washington, DC: The National Academies Press.
Mullen, M. C., & Shield, J. E. (2004). Childhood and adolescent overweight: The health professional’s guide to identification, treatment and prevention. Chicago, IL: American Dietetic Association.
Neumark-Sztainer, D., Story, M., Perry, C., & Casey, M. A. (1999). Factors influ-encing food choices of adolescents: Findings from focus-group discussions with adolescents. Journal of the American Dietetic Association, 99, 929-937.
Newman, C., Guthrie, J., Mancino, L., Ralston, K., & Musiker, M. (2009, November). Meeting total fat requirements for school lunches: Influence of school policies and characteristics (Economic Research Report, 87). Washington, DC: U.S. Depart-ment of Agriculture, Economic Research Service.
Nicklas, T. A., Yang, S., Baranowski, T., Zakeri, I., & Berenson, G. (2003). Eating patterns and obesity in children: The Bogalusa Heart Study. American Journal of Preventive Medicine, 25, 9-16.
Ogden, C. L., Carroll, M. D., Curtin, L. R., Lamb, M. M., & Flegal, K. M. (2010). Prevalence of high body mass index in US children and adolescents, 2007-2008. Journal of the American Medical Association, 303, 242-249.
Pischon, T., Boeing, H., Hoffman, K., Bergmann, M., Schulze, M. B., Overvard, K., …, Riboli, E. (2008). General and abdominal adiposity and risk of death in Europe. New England Journal of Medicine, 359, 2105-2120.
Prevention Institute. (2002). Nutrition policy profiles: Supermarket access in low-income communities report. Oakland, CA: Author.
Rosenheck, R. (2008). Fast food consumption and increased caloric intake: A system-atic review of a trajectory towards weight gain and obesity risk. Obesity Reviews, 9, 535-547.
Shide, D. J., & Rolls, B. J. (1991). Social facilitation of caloric intake in humans by friends but not by strangers. International Journal of Obesity, 15, S8.
Sobal, J., & Wansink, B. (2007). Kitchenscapes, tablescapes, platescapes, and food-scapes: Influences of microscale built environments on food intake. Environment and Behavior, 39, 124-142.
712 Environment and Behavior 44(5)
Spear, B. A., Barlow, S. E., Ervin, C., Ludwig, D. S., Saelens, B. E., Schetzina, K. E., & Taveras, E. M. (2007). Recommendations for treatment of child and adolescent overweight and obesity. Pediatrics, 120, S254-S288.
Story, M., Neumark-Sztainer, D., & French, S. (2003). Individual and environmental influences on adolescent eating behaviors. Journal of the American Dietetic Asso-ciation, 102, S40-S51.
Stunkard, A., & Mazur, A. (1978). Smorgasbord and obesity. Psychosomatic Medi-cine, 40, 173-175.
Swanson, M. (2008). Digital photography as a tool to measure school cafeteria con-sumption. Journal of School Health, 78, 432-437.
U.S. Department of Health and Human Services and U.S. Department of Agriculture. (2011). Dietary guidelines for Americans, 2010 (7th ed.). Washington, DC: U.S. Government Printing Office.
Wansink, B., & Sobal, J. (2007). Mindless eating: The 200 daily food decisions we overlook. Environment and Behavior, 39, 106-123.
Williamson, D. A., Allen, H. R., Martin, P. D., Alfonso, A., Gerald, B., & Hunt, A. (2004). Digital photography: A new method for estimating food intake in cafete-ria settings. Eating and Weight Disorders, 9, 24-28.
Young, L. R., & Nestle, M. (2002). The contribution of expanding portion sizes to the U.S. obesity epidemic. American Journal of Public Health, 92, 246-249.
Bios
Amanda E. Staiano, PhD, is now a postdoctoral research fellow in the Division of Population Science at Pennington Biomedical Research Center. She received her doc-toral degree in psychology and a master of public policy from Georgetown University. At the Children’s Digital Media Center, she examined the impact of digital media on children’s physical, cognitive, and socioemotional health.
Christina M. Baker, MA, received her master’s degree in psychology from the Catholic University of America and was a researcher at the Children’s Digital Media Center. She holds a bachelor’s degree in film and media arts from American University and has a background in film and television production, with a particular interest in children’s programming.
Sandra L. Calvert, PhD, is a professor of psychology at Georgetown University and director of the Children’s Digital Media Center. Her research, which spans the fields of psychology, communications, health, and education, seeks to improve the well-being of children by bridging the gap between knowledge generation and knowledge application.