enterprise chat and email administrator s guide to the ...€¦ · enterprise chat and email...
TRANSCRIPT

Enterprise Chat and Email Administrator’s Guide to Reports Console, Release 11.5(1)For Unified Contact Center Enterprise
August 2016
Americas HeadquartersCisco Systems, Inc.170 West Tasman DriveSan Jose, CA 95134-1706 USAhttp://www.cisco.comTel: 408 526-4000
800 553-NETS (6387)Fax: 408 527-0883
THE SPECIFICATIONS AND INFORMATION REGARDING THE PRODUCTS IN THIS MANUAL ARE SUBJECT TO CHANGE WITHOUT NOTICE. ALL STATEMENTS, INFORMATION, AND RECOMMENDATIONS IN THIS MANUAL ARE BELIEVED TO BE ACCURATE BUT ARE PRESENTED WITHOUT WARRANTY OF ANY KIND, EXPRESS OR IMPLIED. USERS MUST TAKE FULL RESPONSIBILITY FOR THEIR APPLICATION OF ANY PRODUCTS.
THE SOFTWARE LICENSE AND LIMITED WARRANTY FOR THE ACCOMPANYING PRODUCT ARE SET FORTH IN THE INFORMATION PACKET THAT SHIPPED WITH THE PRODUCT AND ARE INCORPORATED HEREIN BY THIS REFERENCE. IF YOU ARE UNABLE TO LOCATE THE SOFTWARE LICENSE OR LIMITED WARRANTY, CONTACT YOUR CISCO REPRESENTATIVE FOR A COPY.
The Cisco implementation of TCP header compression is an adaptation of a program developed by the University of California, Berkeley (UCB) as part of UCBs public domain version of the UNIX operating system. All rights reserved. Copyright 1981, Regents of the University of California.
NOTWITHSTANDING ANY OTHER WARRANTY HEREIN, ALL DOCUMENT FILES AND SOFTWARE OF THESE SUPPLIERS ARE PROVIDED "AS IS" WITH ALL FAULTS. CISCO AND THE ABOVE-NAMED SUPPLIERS DISCLAIM ALL WARRANTIES, EXPRESSED OR IMPLIED, INCLUDING, WITHOUT LIMITATION, THOSE OF MERCHANTABILITY, FITNESS FOR A PARTICULAR PURPOSE AND NONINFRINGEMENT OR ARISING FROM A COURSE OF DEALING, USAGE, OR TRADE PRACTICE.
IN NO EVENT SHALL CISCO OR ITS SUPPLIERS BE LIABLE FOR ANY INDIRECT, SPECIAL, CONSEQUENTIAL, OR INCIDENTAL DAMAGES, INCLUDING, WITHOUT LIMITATION, LOST PROFITS OR LOSS OR DAMAGE TO DATA ARISING OUT OF THE USE OR INABILITY TO USE THIS MANUAL, EVEN IF CISCO OR ITS SUPPLIERS HAVE BEEN ADVISED OF THE POSSIBILITY OF SUCH DAMAGES.
Any Internet Protocol (IP) addresses and phone numbers used in this document are not intended to be actual addresses and phone numbers. Any examples, command display output, network topology diagrams, and other figures included in the document are shown for illustrative purposes only. Any use of actual IP addresses or phone numbers in illustrative content is unintentional and coincidental.
Cisco and the Cisco logo are trademarks or registered trademarks of Cisco and/or its affiliates in the U.S. and other countries. To view a list of Cisco trademarks, go to http://www.cisco.com/go/trademarks. Third-party trademarks mentioned are the property of their respective owners. The use of the word partner does not imply a partnership relationship between Cisco and any other company. (1110R)
Enterprise Chat and Email Administrator’s Guide to Reports Console: For Unified Contact Center Enterprise. November 18, 2016
Copyright © 2006–2016, Cisco Systems, Inc. All rights reserved.
Contents
Preface .............................................................................................................................................................. 7
About This Guide . . . . . . . . . . . . . . . . . . . . . . . . . . . . . . . . . . . . . . . . . . . . . . . . . . . . . . . . . . . . . . . . . . . . . . 8
Obtaining Documentation and Submitting a Service Request . . . . . . . . . . . . . . . . . . . . . . . . . . . . . . . . . . . . 8
Documentation Feedback . . . . . . . . . . . . . . . . . . . . . . . . . . . . . . . . . . . . . . . . . . . . . . . . . . . . . . . . . . . . . . . . 8
Field Alerts and Field Notices . . . . . . . . . . . . . . . . . . . . . . . . . . . . . . . . . . . . . . . . . . . . . . . . . . . . . . . . . . . . 9
Document Conventions. . . . . . . . . . . . . . . . . . . . . . . . . . . . . . . . . . . . . . . . . . . . . . . . . . . . . . . . . . . . . . . . . . 9
Other Learning Resources. . . . . . . . . . . . . . . . . . . . . . . . . . . . . . . . . . . . . . . . . . . . . . . . . . . . . . . . . . . . . . . . 9
Online Help . . . . . . . . . . . . . . . . . . . . . . . . . . . . . . . . . . . . . . . . . . . . . . . . . . . . . . . . . . . . . . . . . . . . . . . . 9
Document Set . . . . . . . . . . . . . . . . . . . . . . . . . . . . . . . . . . . . . . . . . . . . . . . . . . . . . . . . . . . . . . . . . . . . . 10
Chapter 1: Console Basics........................................................................................................................... 11
Key Terms. . . . . . . . . . . . . . . . . . . . . . . . . . . . . . . . . . . . . . . . . . . . . . . . . . . . . . . . . . . . . . . . . . . . . . . . . . . 12
Available Templates . . . . . . . . . . . . . . . . . . . . . . . . . . . . . . . . . . . . . . . . . . . . . . . . . . . . . . . . . . . . . . . . . . . 13
Elements of the Console . . . . . . . . . . . . . . . . . . . . . . . . . . . . . . . . . . . . . . . . . . . . . . . . . . . . . . . . . . . . . . . . 14
Chapter 2: Working With Reports............................................................................................................... 15
About Reports . . . . . . . . . . . . . . . . . . . . . . . . . . . . . . . . . . . . . . . . . . . . . . . . . . . . . . . . . . . . . . . . . . . . . . . . 16
Creating Reports . . . . . . . . . . . . . . . . . . . . . . . . . . . . . . . . . . . . . . . . . . . . . . . . . . . . . . . . . . . . . . . . . . . . . . 16
Modifying Reports . . . . . . . . . . . . . . . . . . . . . . . . . . . . . . . . . . . . . . . . . . . . . . . . . . . . . . . . . . . . . . . . . . . . 18
Deleting Reports . . . . . . . . . . . . . . . . . . . . . . . . . . . . . . . . . . . . . . . . . . . . . . . . . . . . . . . . . . . . . . . . . . . . . . 19
Running Saved Reports. . . . . . . . . . . . . . . . . . . . . . . . . . . . . . . . . . . . . . . . . . . . . . . . . . . . . . . . . . . . . . . . . 19
Saving Report Outputs . . . . . . . . . . . . . . . . . . . . . . . . . . . . . . . . . . . . . . . . . . . . . . . . . . . . . . . . . . . . . . . . . 19
Managing Report History . . . . . . . . . . . . . . . . . . . . . . . . . . . . . . . . . . . . . . . . . . . . . . . . . . . . . . . . . . . . . . . 20
Viewing Report History . . . . . . . . . . . . . . . . . . . . . . . . . . . . . . . . . . . . . . . . . . . . . . . . . . . . . . . . . . . . . 20
Deleting Report History . . . . . . . . . . . . . . . . . . . . . . . . . . . . . . . . . . . . . . . . . . . . . . . . . . . . . . . . . . . . . 20
Scheduling Reports . . . . . . . . . . . . . . . . . . . . . . . . . . . . . . . . . . . . . . . . . . . . . . . . . . . . . . . . . . . . . . . . . . . . 20
Sending Notifications . . . . . . . . . . . . . . . . . . . . . . . . . . . . . . . . . . . . . . . . . . . . . . . . . . . . . . . . . . . . . . . . . . 22
Setting Permissions on Reports. . . . . . . . . . . . . . . . . . . . . . . . . . . . . . . . . . . . . . . . . . . . . . . . . . . . . . . . . . . 23
Contents 3

Chapter 3: Agent Performance Reports..................................................................................................... 25
Notes . . . . . . . . . . . . . . . . . . . . . . . . . . . . . . . . . . . . . . . . . . . . . . . . . . . . . . . . . . . . . . . . . . . . . . . . . . . . . . . 26
Serviced Chats. . . . . . . . . . . . . . . . . . . . . . . . . . . . . . . . . . . . . . . . . . . . . . . . . . . . . . . . . . . . . . . . . . . . . 26
Abandoned Chats . . . . . . . . . . . . . . . . . . . . . . . . . . . . . . . . . . . . . . . . . . . . . . . . . . . . . . . . . . . . . . . . . . 26
Agent Availability for Chat Report. . . . . . . . . . . . . . . . . . . . . . . . . . . . . . . . . . . . . . . . . . . . . . . . . . . . . . . . 26
Report Output . . . . . . . . . . . . . . . . . . . . . . . . . . . . . . . . . . . . . . . . . . . . . . . . . . . . . . . . . . . . . . . . . . . . . 26
Level 1 . . . . . . . . . . . . . . . . . . . . . . . . . . . . . . . . . . . . . . . . . . . . . . . . . . . . . . . . . . . . . . . . . . . . . . . . 27
Level 2 . . . . . . . . . . . . . . . . . . . . . . . . . . . . . . . . . . . . . . . . . . . . . . . . . . . . . . . . . . . . . . . . . . . . . . . . 27
Agent Chat Productivity by Queue Report . . . . . . . . . . . . . . . . . . . . . . . . . . . . . . . . . . . . . . . . . . . . . . . . . . 28
Report Output . . . . . . . . . . . . . . . . . . . . . . . . . . . . . . . . . . . . . . . . . . . . . . . . . . . . . . . . . . . . . . . . . . . . . 28
Level 1 . . . . . . . . . . . . . . . . . . . . . . . . . . . . . . . . . . . . . . . . . . . . . . . . . . . . . . . . . . . . . . . . . . . . . . . . 28
Level 2 . . . . . . . . . . . . . . . . . . . . . . . . . . . . . . . . . . . . . . . . . . . . . . . . . . . . . . . . . . . . . . . . . . . . . . . . 29
Level 3 . . . . . . . . . . . . . . . . . . . . . . . . . . . . . . . . . . . . . . . . . . . . . . . . . . . . . . . . . . . . . . . . . . . . . . . . 30
Level 4 . . . . . . . . . . . . . . . . . . . . . . . . . . . . . . . . . . . . . . . . . . . . . . . . . . . . . . . . . . . . . . . . . . . . . . . . 31
Agent Efficiency Report . . . . . . . . . . . . . . . . . . . . . . . . . . . . . . . . . . . . . . . . . . . . . . . . . . . . . . . . . . . . . . . . 32
Report Output . . . . . . . . . . . . . . . . . . . . . . . . . . . . . . . . . . . . . . . . . . . . . . . . . . . . . . . . . . . . . . . . . . . . . 32
Level 1 . . . . . . . . . . . . . . . . . . . . . . . . . . . . . . . . . . . . . . . . . . . . . . . . . . . . . . . . . . . . . . . . . . . . . . . . 33
Agent Login Summary Report . . . . . . . . . . . . . . . . . . . . . . . . . . . . . . . . . . . . . . . . . . . . . . . . . . . . . . . . . . . 34
Report Output . . . . . . . . . . . . . . . . . . . . . . . . . . . . . . . . . . . . . . . . . . . . . . . . . . . . . . . . . . . . . . . . . . . . . 34
Level 1 . . . . . . . . . . . . . . . . . . . . . . . . . . . . . . . . . . . . . . . . . . . . . . . . . . . . . . . . . . . . . . . . . . . . . . . . 34
Level 2 . . . . . . . . . . . . . . . . . . . . . . . . . . . . . . . . . . . . . . . . . . . . . . . . . . . . . . . . . . . . . . . . . . . . . . . . 35
Level 3 . . . . . . . . . . . . . . . . . . . . . . . . . . . . . . . . . . . . . . . . . . . . . . . . . . . . . . . . . . . . . . . . . . . . . . . . 35
Level 4 . . . . . . . . . . . . . . . . . . . . . . . . . . . . . . . . . . . . . . . . . . . . . . . . . . . . . . . . . . . . . . . . . . . . . . . . 36
Agent Work Summary Report . . . . . . . . . . . . . . . . . . . . . . . . . . . . . . . . . . . . . . . . . . . . . . . . . . . . . . . . . . . 37
A Note About Turnaround Time . . . . . . . . . . . . . . . . . . . . . . . . . . . . . . . . . . . . . . . . . . . . . . . . . . . . . . . 37
Report Output . . . . . . . . . . . . . . . . . . . . . . . . . . . . . . . . . . . . . . . . . . . . . . . . . . . . . . . . . . . . . . . . . . . . . 37
Level 1 . . . . . . . . . . . . . . . . . . . . . . . . . . . . . . . . . . . . . . . . . . . . . . . . . . . . . . . . . . . . . . . . . . . . . . . . 38
Level 2 . . . . . . . . . . . . . . . . . . . . . . . . . . . . . . . . . . . . . . . . . . . . . . . . . . . . . . . . . . . . . . . . . . . . . . . . 39
Level 3 . . . . . . . . . . . . . . . . . . . . . . . . . . . . . . . . . . . . . . . . . . . . . . . . . . . . . . . . . . . . . . . . . . . . . . . . 39
Chapter 4: Callback Volume Report .......................................................................................................... 40
Callback Volume Report. . . . . . . . . . . . . . . . . . . . . . . . . . . . . . . . . . . . . . . . . . . . . . . . . . . . . . . . . . . . . . . . 41
Level 1. . . . . . . . . . . . . . . . . . . . . . . . . . . . . . . . . . . . . . . . . . . . . . . . . . . . . . . . . . . . . . . . . . . . . . . . . . . 41
Chapter 5: Classification Reports............................................................................................................... 42
Activity and Case Classification Report . . . . . . . . . . . . . . . . . . . . . . . . . . . . . . . . . . . . . . . . . . . . . . . . . . . . 43
Report Output . . . . . . . . . . . . . . . . . . . . . . . . . . . . . . . . . . . . . . . . . . . . . . . . . . . . . . . . . . . . . . . . . . . . . 43
4 Enterprise Chat and Email Administrator’s Guide to Reports Console

Level 1 . . . . . . . . . . . . . . . . . . . . . . . . . . . . . . . . . . . . . . . . . . . . . . . . . . . . . . . . . . . . . . . . . . . . . . . . 43
Important Things to Note . . . . . . . . . . . . . . . . . . . . . . . . . . . . . . . . . . . . . . . . . . . . . . . . . . . . . . . . . . . . 44
Chapter 6: Contact Center Trend Reports.................................................................................................. 46
Case Volume Report . . . . . . . . . . . . . . . . . . . . . . . . . . . . . . . . . . . . . . . . . . . . . . . . . . . . . . . . . . . . . . . . . . . 47
Report Output . . . . . . . . . . . . . . . . . . . . . . . . . . . . . . . . . . . . . . . . . . . . . . . . . . . . . . . . . . . . . . . . . . . . . 47
Level 1 . . . . . . . . . . . . . . . . . . . . . . . . . . . . . . . . . . . . . . . . . . . . . . . . . . . . . . . . . . . . . . . . . . . . . . . . 47
Email Volume Report . . . . . . . . . . . . . . . . . . . . . . . . . . . . . . . . . . . . . . . . . . . . . . . . . . . . . . . . . . . . . . . . . . 48
A Note About Moving Average . . . . . . . . . . . . . . . . . . . . . . . . . . . . . . . . . . . . . . . . . . . . . . . . . . . . . . . 48
Report Output . . . . . . . . . . . . . . . . . . . . . . . . . . . . . . . . . . . . . . . . . . . . . . . . . . . . . . . . . . . . . . . . . . . . . 48
Level 1 . . . . . . . . . . . . . . . . . . . . . . . . . . . . . . . . . . . . . . . . . . . . . . . . . . . . . . . . . . . . . . . . . . . . . . . . 49
Chapter 7: Service Level Performance Reports....................................................................................... 50
Notes . . . . . . . . . . . . . . . . . . . . . . . . . . . . . . . . . . . . . . . . . . . . . . . . . . . . . . . . . . . . . . . . . . . . . . . . . . . . . . . 51
Age Buckets . . . . . . . . . . . . . . . . . . . . . . . . . . . . . . . . . . . . . . . . . . . . . . . . . . . . . . . . . . . . . . . . . . . . . . 51
Calculating Age. . . . . . . . . . . . . . . . . . . . . . . . . . . . . . . . . . . . . . . . . . . . . . . . . . . . . . . . . . . . . . . . . . . . 51
Case Age Report . . . . . . . . . . . . . . . . . . . . . . . . . . . . . . . . . . . . . . . . . . . . . . . . . . . . . . . . . . . . . . . . . . . . . . 51
Report Output . . . . . . . . . . . . . . . . . . . . . . . . . . . . . . . . . . . . . . . . . . . . . . . . . . . . . . . . . . . . . . . . . . . . . 52
Level 1 . . . . . . . . . . . . . . . . . . . . . . . . . . . . . . . . . . . . . . . . . . . . . . . . . . . . . . . . . . . . . . . . . . . . . . . . 52
Email Age by Alias Report . . . . . . . . . . . . . . . . . . . . . . . . . . . . . . . . . . . . . . . . . . . . . . . . . . . . . . . . . . . . . . 52
Report Output . . . . . . . . . . . . . . . . . . . . . . . . . . . . . . . . . . . . . . . . . . . . . . . . . . . . . . . . . . . . . . . . . . . . . 53
Level 1 . . . . . . . . . . . . . . . . . . . . . . . . . . . . . . . . . . . . . . . . . . . . . . . . . . . . . . . . . . . . . . . . . . . . . . . . 53
Email Age by Queue Report . . . . . . . . . . . . . . . . . . . . . . . . . . . . . . . . . . . . . . . . . . . . . . . . . . . . . . . . . . . . . 54
Report Output . . . . . . . . . . . . . . . . . . . . . . . . . . . . . . . . . . . . . . . . . . . . . . . . . . . . . . . . . . . . . . . . . . . . . 54
Level 1 . . . . . . . . . . . . . . . . . . . . . . . . . . . . . . . . . . . . . . . . . . . . . . . . . . . . . . . . . . . . . . . . . . . . . . . . 54
Chapter 8: Survey Reports............................................................................................................................ 55
Chat Survey. . . . . . . . . . . . . . . . . . . . . . . . . . . . . . . . . . . . . . . . . . . . . . . . . . . . . . . . . . . . . . . . . . . . . . . . . . 56
Report Output . . . . . . . . . . . . . . . . . . . . . . . . . . . . . . . . . . . . . . . . . . . . . . . . . . . . . . . . . . . . . . . . . . . . . 56
Level 1 . . . . . . . . . . . . . . . . . . . . . . . . . . . . . . . . . . . . . . . . . . . . . . . . . . . . . . . . . . . . . . . . . . . . . . . . 56
Chapter 9: Workforce Scheduling Reports.............................................................................................. 58
A Note About Service Level and Response Time . . . . . . . . . . . . . . . . . . . . . . . . . . . . . . . . . . . . . . . . . . . . 59
Chat Volume by Queue Report . . . . . . . . . . . . . . . . . . . . . . . . . . . . . . . . . . . . . . . . . . . . . . . . . . . . . . . . . . . 59
Report Output . . . . . . . . . . . . . . . . . . . . . . . . . . . . . . . . . . . . . . . . . . . . . . . . . . . . . . . . . . . . . . . . . . . . . 60
Level 1 . . . . . . . . . . . . . . . . . . . . . . . . . . . . . . . . . . . . . . . . . . . . . . . . . . . . . . . . . . . . . . . . . . . . . . . . 60
Contents 5
Level 2 . . . . . . . . . . . . . . . . . . . . . . . . . . . . . . . . . . . . . . . . . . . . . . . . . . . . . . . . . . . . . . . . . . . . . . . . 62
Level 3 . . . . . . . . . . . . . . . . . . . . . . . . . . . . . . . . . . . . . . . . . . . . . . . . . . . . . . . . . . . . . . . . . . . . . . . . 62
Level 4 . . . . . . . . . . . . . . . . . . . . . . . . . . . . . . . . . . . . . . . . . . . . . . . . . . . . . . . . . . . . . . . . . . . . . . . . 63
Chat Volume by Referrer URL. . . . . . . . . . . . . . . . . . . . . . . . . . . . . . . . . . . . . . . . . . . . . . . . . . . . . . . . . . . 65
Report Output . . . . . . . . . . . . . . . . . . . . . . . . . . . . . . . . . . . . . . . . . . . . . . . . . . . . . . . . . . . . . . . . . . . . . 65
Level 1 . . . . . . . . . . . . . . . . . . . . . . . . . . . . . . . . . . . . . . . . . . . . . . . . . . . . . . . . . . . . . . . . . . . . . . . . 66
Level 2 . . . . . . . . . . . . . . . . . . . . . . . . . . . . . . . . . . . . . . . . . . . . . . . . . . . . . . . . . . . . . . . . . . . . . . . . 68
Level 3 . . . . . . . . . . . . . . . . . . . . . . . . . . . . . . . . . . . . . . . . . . . . . . . . . . . . . . . . . . . . . . . . . . . . . . . . 68
Level 4 . . . . . . . . . . . . . . . . . . . . . . . . . . . . . . . . . . . . . . . . . . . . . . . . . . . . . . . . . . . . . . . . . . . . . . . . 69
Email Snapshot by Agent Report . . . . . . . . . . . . . . . . . . . . . . . . . . . . . . . . . . . . . . . . . . . . . . . . . . . . . . . . . 71
Report Output . . . . . . . . . . . . . . . . . . . . . . . . . . . . . . . . . . . . . . . . . . . . . . . . . . . . . . . . . . . . . . . . . . . . . 71
Level 1 . . . . . . . . . . . . . . . . . . . . . . . . . . . . . . . . . . . . . . . . . . . . . . . . . . . . . . . . . . . . . . . . . . . . . . . . 71
Email Snapshot by Queue Report . . . . . . . . . . . . . . . . . . . . . . . . . . . . . . . . . . . . . . . . . . . . . . . . . . . . . . . . . 71
Report Output . . . . . . . . . . . . . . . . . . . . . . . . . . . . . . . . . . . . . . . . . . . . . . . . . . . . . . . . . . . . . . . . . . . . . 72
Level 1 . . . . . . . . . . . . . . . . . . . . . . . . . . . . . . . . . . . . . . . . . . . . . . . . . . . . . . . . . . . . . . . . . . . . . . . . 72
Email Volume by Alias Report . . . . . . . . . . . . . . . . . . . . . . . . . . . . . . . . . . . . . . . . . . . . . . . . . . . . . . . . . . . 72
Report Output . . . . . . . . . . . . . . . . . . . . . . . . . . . . . . . . . . . . . . . . . . . . . . . . . . . . . . . . . . . . . . . . . . . . . 72
Level 1 . . . . . . . . . . . . . . . . . . . . . . . . . . . . . . . . . . . . . . . . . . . . . . . . . . . . . . . . . . . . . . . . . . . . . . . . 73
Level 2 . . . . . . . . . . . . . . . . . . . . . . . . . . . . . . . . . . . . . . . . . . . . . . . . . . . . . . . . . . . . . . . . . . . . . . . . 75
Email Volume by Queue Report . . . . . . . . . . . . . . . . . . . . . . . . . . . . . . . . . . . . . . . . . . . . . . . . . . . . . . . . . . 75
Report Output . . . . . . . . . . . . . . . . . . . . . . . . . . . . . . . . . . . . . . . . . . . . . . . . . . . . . . . . . . . . . . . . . . . . . 75
Level 1 . . . . . . . . . . . . . . . . . . . . . . . . . . . . . . . . . . . . . . . . . . . . . . . . . . . . . . . . . . . . . . . . . . . . . . . . 75
Level 2 . . . . . . . . . . . . . . . . . . . . . . . . . . . . . . . . . . . . . . . . . . . . . . . . . . . . . . . . . . . . . . . . . . . . . . . . 77
6 Enterprise Chat and Email Administrator’s Guide to Reports Console
Preface
About This Guide
Obtaining Documentation and Submitting a Service Request
Documentation Feedback
Field Alerts and Field Notices
Document Conventions
Other Learning Resources
Welcome to the Enterprise Chat and Email (ECE) feature, which provides multichannel interaction software used by businesses all over the world as a core component to the Unified Contact Center Enterprise product line. ECE offers a unified suite of the industry’s best applications for chat and email interaction management to enable a blended agent for handling of web chat, email and voice interactions.
About This Guide
Enterprise Chat and Email Administrator’s Guide to Reports Console introduces you to the Reports Console and helps you understand how to use it to accomplish your reporting and analysis tasks. It is meant for installations that are integrated with Cisco Unified Contact Center Enterprise (Unified CCE).
This guide provides details about historical reports available in the Reports Console of ECE. Real-time reports are available through Cisco Unified Intelligence Center (CUIC) when integrated with Unified CCE. Integrated customers should use CUIC for real-time reports, and the Reports Console in ECE for historical reports.
The following ECE reports are also available in the Cisco Unified Intelligence Center:
Chat Volume by Queue
Email Volume By Queue
Agent Work Summary
For descriptions of the reports available in Cisco Unified Intelligence Center see the User Guide for the Cisco Unified Intelligence Center Reporting Application or the Online Help.
Obtaining Documentation and Submitting a Service Request
For information on obtaining documentation, using the Cisco Bug Search Tool (BST), submitting a service request, and gathering additional information, see What's New in Cisco Product Documentation, at: http://www.cisco.com/c/en/us/td/docs/general/whatsnew/whatsnew.html.
Subscribe to What's New in Cisco Product Documentation, which lists all new and revised Cisco technical documentation as an RSS feed and delivers content directly to your desktop using a reader application. The RSS feeds are a free service.
Documentation Feedback
To provide comments about this document, send an email message to the following address: [email protected]
We appreciate your comments.
8 Enterprise Chat and Email Administrator’s Guide to Reports Console

Field Alerts and Field Notices
Cisco products may be modified or key processes may be determined to be important. These are announced through use of the Cisco Field Alerts and Cisco Field Notices. You can register to receive Field Alerts and Field Notices through the Product Alert Tool on Cisco.com. This tool enables you to create a profile to receive announcements by selecting all products of interest.
Log into www.cisco.com and then access the tool at http://www.cisco.com/cisco/support/notifications.html
Document Conventions
This guide uses the following typographical conventions..
Document conventions
Other Learning Resources
Various learning tools are available within the product, as well as on the product CD and our web site. You can also request formal end-user or technical training.
Online HelpThe product includes topic-based as well as context-sensitive help.
Online help options
Convention Indicates
Italic Emphasis.
Or the title of a published document.
Bold Labels of items on the user interface, such as buttons, boxes, and lists.
Or text that must be typed by the user.
Monospace The name of a file or folder, a database table column or value, or a command.
Variable User-specific text; varies from one user or installation to another.
Use To view
Help button Topics in Enterprise Chat and Email Help; the Help button appears in the console toolbar on every screen.
F1 keypad button Context-sensitive information about the item selected on the screen.
Preface 9
Document SetThe Enterprise Chat and Email documentation is available in the Documents folder on the product CD. The latest versions of all Cisco documentation can be found online at http://www.cisco.com
The document set contains the following guides:
System Requirements for Enterprise Chat and Email
Enterprise Chat and Email Installation Guide
Enterprise Chat and Email Browser Settings Guide
User guides for agents and supervisors
Enterprise Chat and Email Agent’s Guide
Enterprise Chat and Email Supervisor’s Guide
User guides for administrators
Enterprise Chat and Email Administrator’s Guide to Administration Console
Enterprise Chat and Email Administrator’s Guide to Routing and Workflows
Enterprise Chat and Email Administrator’s Guide to Chat and Collaboration Resources
Enterprise Chat and Email Administrator’s Guide to Email Resources
Enterprise Chat and Email Administrator’s Guide to Reports Console
Enterprise Chat and Email Administrator’s Guide to System Console
Enterprise Chat and Email Administrator’s Guide to Tools Console
10 Enterprise Chat and Email Administrator’s Guide to Reports Console

Console Basics
Key Terms
Available Templates
Elements of the Console

Good customer interaction metrics and analytics mean competitive advantages for the entire company. Enterprise Chat and Email has a console specially for working with reports, which contains templates to help you create reports to:
Monitor service levels and response cycles to ensure customer satisfaction.
Evaluate contact center operations and tune them for greater efficiency.
Understand service activity volume trends in the contact center.
Forecast workload and staffing requirements.
Evaluate the performance of agents in your team and, if you are an agent, your own performance.
Gain business insight from service interactions by analyzing the kinds of problems being reported.
View comprehensive information about your team members.
In this chapter, we look at reports basics—key concepts, how many templates, and where are they found.
Key Terms
Reports Console
A management console, the Reports Console is designed specially for managers, supervisors, and business analysts to track and analyze various aspects of their operations.
Agent Console
A service console, the Agent Console is the workspace of customer service agents. Three of the Agent Performance report templates—Agent Availability for Chat, Agent Efficiency, and Agent Login Summary—are available in this console for agents to evaluate their own performance.
Report
A report contains historical data, recorded by the system, about a particular facet of your service organization.
Reports are created from templates—all templates are available in the Reports Console, and three of them are also available in the Agent Console. While creating the report, you specify the time period and business objects to be covered by the report. You can save a report and run it later or scheduled it to run automatically. Report results are displayed in your web browser, and can be saved as PDF or Excel sheets. Reports can also be distributed as email attachments.
Report templates
A report is created from a template. The console contains different types of report templates, grouped by function into eight sets. You can create any number of reports from a template. And, though you can delete reports, you will not be able to delete templates—so you do not run the risk of losing a template.
12 Enterprise Chat and Email Administrator’s Guide to Reports Console

Available Templates
The report templates are:
1. Agent Performance
a. Agent Availability for Chat
b. Agent Chat Productivity by Queue
c. Agent Efficiency
d. Agent Login Summary
e. Agent Work Summary
2. Callback
a. Callback Volume Report
3. Classification
a. Activity and Case Classification
4. Contact Center Trend
a. Case Volume
b. Email Volume
5. Service Level Performance
a. Case Age
b. Email Age by Alias
c. Email Age by Queue
6. Surveys
a. Chat Survey
7. Workforce Scheduling
a. Chat Volume by Queue
b. Chat Volume by Referrer URL
c. Email snapshot by Agent
d. Email snapshot by Queue
e. Email Volume by Alias
f. Email Volume by Queue
Available Templates 13
Elements of the Console
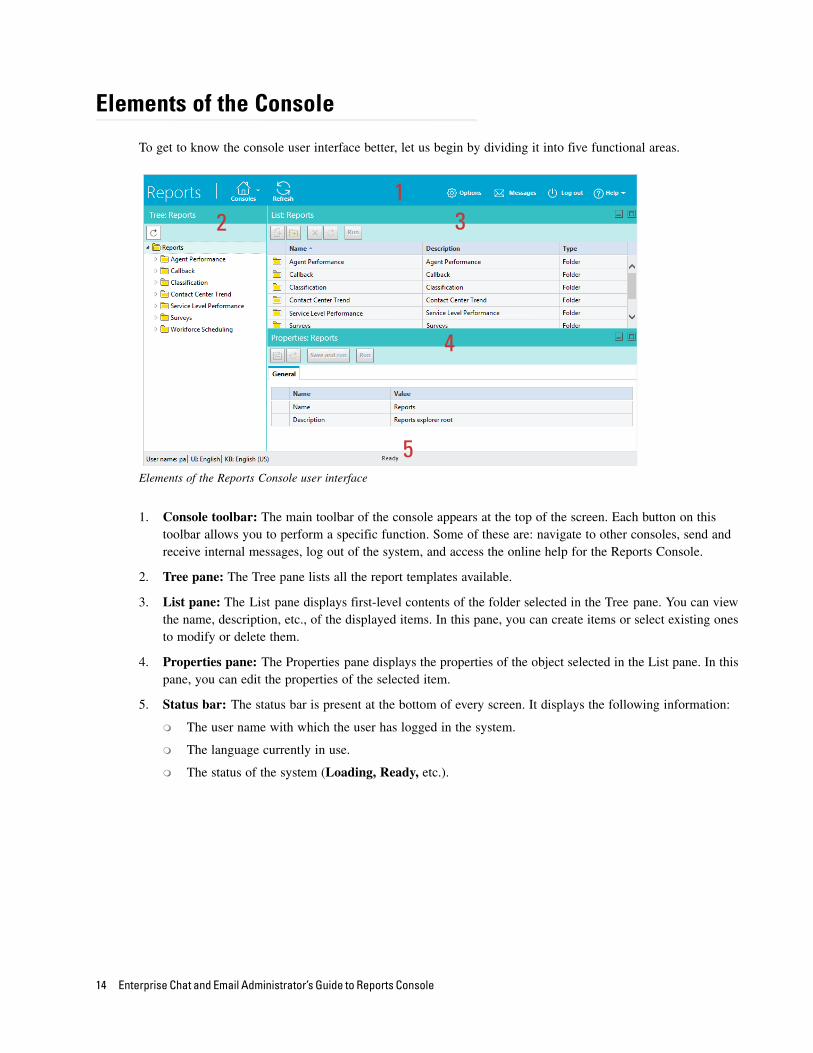
To get to know the console user interface better, let us begin by dividing it into five functional areas.
Elements of the Reports Console user interface
1. Console toolbar: The main toolbar of the console appears at the top of the screen. Each button on this toolbar allows you to perform a specific function. Some of these are: navigate to other consoles, send and receive internal messages, log out of the system, and access the online help for the Reports Console.
2. Tree pane: The Tree pane lists all the report templates available.
3. List pane: The List pane displays first-level contents of the folder selected in the Tree pane. You can view the name, description, etc., of the displayed items. In this pane, you can create items or select existing ones to modify or delete them.
4. Properties pane: The Properties pane displays the properties of the object selected in the List pane. In this pane, you can edit the properties of the selected item.
5. Status bar: The status bar is present at the bottom of every screen. It displays the following information:
The user name with which the user has logged in the system.
The language currently in use.
The status of the system (Loading, Ready, etc.).
5
4
2 31
14 Enterprise Chat and Email Administrator’s Guide to Reports Console

Working With Reports
About Reports
Creating Reports
Modifying Reports
Deleting Reports
Managing Report History
Scheduling Reports
Sending Notifications
Setting Permissions on Reports
In this chapter we will work on how to create and run the reports. Most of the options available for configuring reports using the different templates are same, except for some reports.
About Reports
A highly specialized workspace for managers, supervisors, and business analysts, the Reports Console contains all the tools you need to measure performance and gain business insight from service interactions.
In this console, you can:
Create reports based on templates.
Save reports for later use, or schedule them to run at a specified time.
Run saved reports.
View report results; most reports have more than one level of information.
Save results in Adobe Acrobat (.pdf) or Microsoft Excel (.xls) files for future use.
Creating Reports
Using the reports templates you can create as many reports criteria as you want. The options available for configuring a report are different for different templates. In this section, we will provide a comprehensive overview of the different options available for different reports.
To create a report:
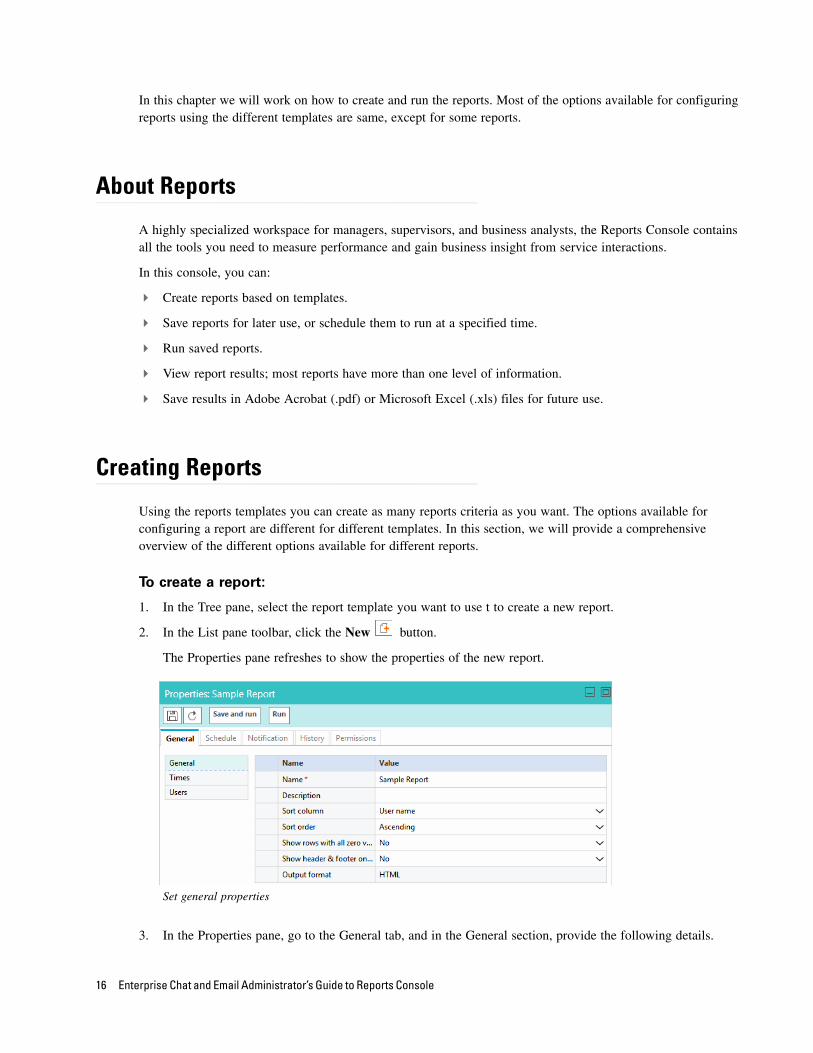
1. In the Tree pane, select the report template you want to use t to create a new report.
2. In the List pane toolbar, click the New button.
The Properties pane refreshes to show the properties of the new report.
Set general properties
3. In the Properties pane, go to the General tab, and in the General section, provide the following details.
16 Enterprise Chat and Email Administrator’s Guide to Reports Console

Name: Type a name for the report.
Description: Type a brief description.
Sort column: From the dropdown list select the sort column for the report. The options available can vary depending on the report template you are using to create the report.
Sort Order: From the dropdown list select the sort order. The options available are descending and ascending.
Show rows with all zero values: With this option, you can decide if you want to see the rows which have all the values as zero. The available options are Yes and No.
Show only summary: With this option you can decide if you want to see the full report or just the summary. Generating a drilldown takes time, so if you do not want to go into the details, you can run the report just with the summary. The available options are Yes and No. By default No is selected.
Output format: The output format for all reports is HTML. This field cannot be edited.
4. Next, on the General tab, go to the Times section. You can run the report for absolute time range or relative time range.
Set time properties
Select one of the following options.
Absolute time range: To see a report for activities between specified dates and times, select the Report on Activity that occurred between the following times option. Then, specify the start time and date and end time and date. Finally from the dropdown list, select the time zone. For the Email Volume report, the start time and end time is set to 12 AM and it cannot be changed.
Note: The options available in the General section can vary depending on the report template you are
using to creating the report. This section explains all the options available in different templates.
Note: The options available in the Times section can vary depending on the report template you are
using to creating the report. This section explains all the options available in different templates.
Creating Reports 17
Relative time range: Select the Report on activity that occurred between the period prior to the report began option. This is the best option to use when you are scheduling reports.
Next, in the Relative to the time that the report is run, report over the previous option, specify the time for which you want to run the report. The options available are hours, days, weeks, months, quarters, and years.
In some reports there is an option to select the length of time segment. For example, you are running a report for 10 days, you can set the report to be divided in time segment of two days. The data displayed in the report is broken down by the time segment chosen in this option. Note that the system prevents you from selecting a very narrow time segment (such as hours or days) when the specified time range covers a larger span (for example, a year) as this combination would result in a data set that is virtually unusable.
In the Email Snapshot by Agent and Email Snapshot by Queue reports, you can choose to view the data for the last 12 days, weeks, or month from the current date or from a specified date. You can also specify the time of the day when the snapshot should be taken.
In the Agent Work Summary report, you also need to specify the turnaround time for emails.
For some reports, you need to specify how service levels are to be computed. You can either use the system specified service levels, or you can specify the service level and select the hours that users work. Choose 24 hours or use business calendar hours.
For other reports, you may need to specify the service levels. You may choose to Use the system service levels (SLAs) or you may choose to Use a specific service level. A service level is the pre-set standard for the completion of an activity.
5. In the General tab, in addition to setting the general and times properties, you have to select the objects for which you want to run the report. The availability of this option depends on the report template you are using. The objects available can be users, queues, aliases, departments etc. For example, for the Agent Efficiency report, you need to select the users, and for the Email Volume by Queue report, you need to select the queues.
6. Click the Save button to save the report. If you do not want to save the report and just want to run it, click the Run button. And, if you want to save and run the report, then click the Save and Run button.
Modifying Reports
You can edit various parameters of a report when required.
To edit a report:
1. In the Tree pane, select a report template from the Reports folder.
2. In the List pane, select the report you want to edit.
3. In the Properties pane, make the necessary modifications.
4. Click the Save button. To save and run the report, click the Save and run button.
18 Enterprise Chat and Email Administrator’s Guide to Reports Console
Deleting Reports
You can delete only those reports for which you have delete permissions.
To delete a report:
1. Select a report from the List pane. You can select multiple reports for deletion.
2. In the List pane toolbar, click the Delete button.
3. A message appears asking to confirm the deletion. Click Yes to delete the selected reports.
Running Saved Reports
You can run the reports saved earlier.
To run saved reports:
1. From the List pane, select a report.
2. In the List pane or Properties pane toolbar, click the Run button. If you have made changes to the report, click the Save and run button to save and run the report.
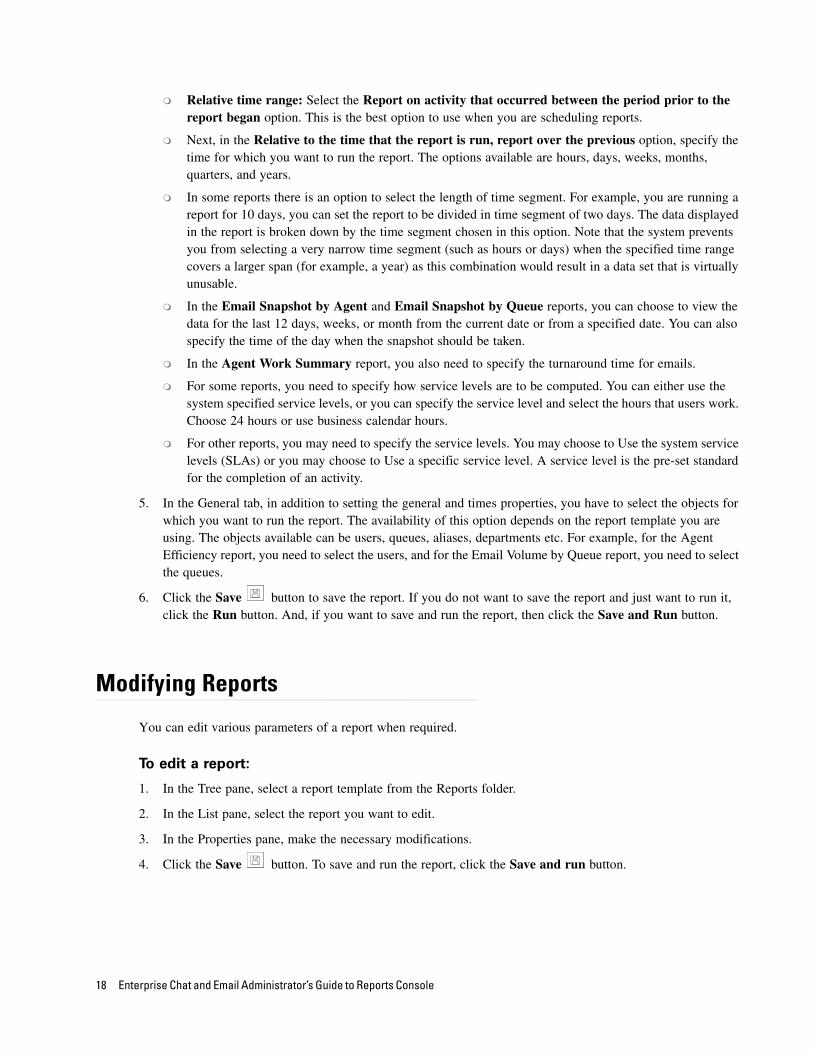
Saving Report Outputs
You can save the report output on your local machine for future reference. Reports can be saved in Microsoft Excel (.xls) or Adobe Acrobat PDF format.
To save a report output:
1. Run the report.
2. In the report output window, click the Save As button.
3. In the Save report as window, select the format in which you want to save the report and click the OK button. The options available are Adobe Acrobat PDF and Microsoft Excel.
Save the report output
4. Save the report on your local machine.
Deleting Reports 19

Managing Report History
Viewing Report HistoryEvery time a report is run, a version of the report is created. These versions are available for viewing in the Properties pane, in the History tab.
To view the versions of the report:
1. From the List pane select a report.
2. In the Properties pane, go to the History tab. In the History tab you can see all the versions of the report listed in descending order, the date and time at which the report was run, and the number of pages of the report.
View the versions of the report
3. Select the version of the report you want to view. You can select multiple versions at a time.
4. In the History tab toolbar, click the View version button. It opens the selected version of the report.
Deleting Report HistoryIf you do not want to keep any version of the report, you can delete it.
To delete a versions of the report:
1. Select the version of the report you want to delete. You can select multiple versions at a time.
2. In the History tab toolbar, click the Delete button.
3. A message appears asking to confirm the deletion. Click Yes to delete the selected versions.
Scheduling Reports
Once you have created a criteria for running the report you can schedule it to run automatically in future. The reports runs automatically on the scheduled times and, using the Notification tab, you can send the run reports
20 Enterprise Chat and Email Administrator’s Guide to Reports Console
to the concerned people. While scheduling the report you can also specify the time range for which the schedule should be effective.
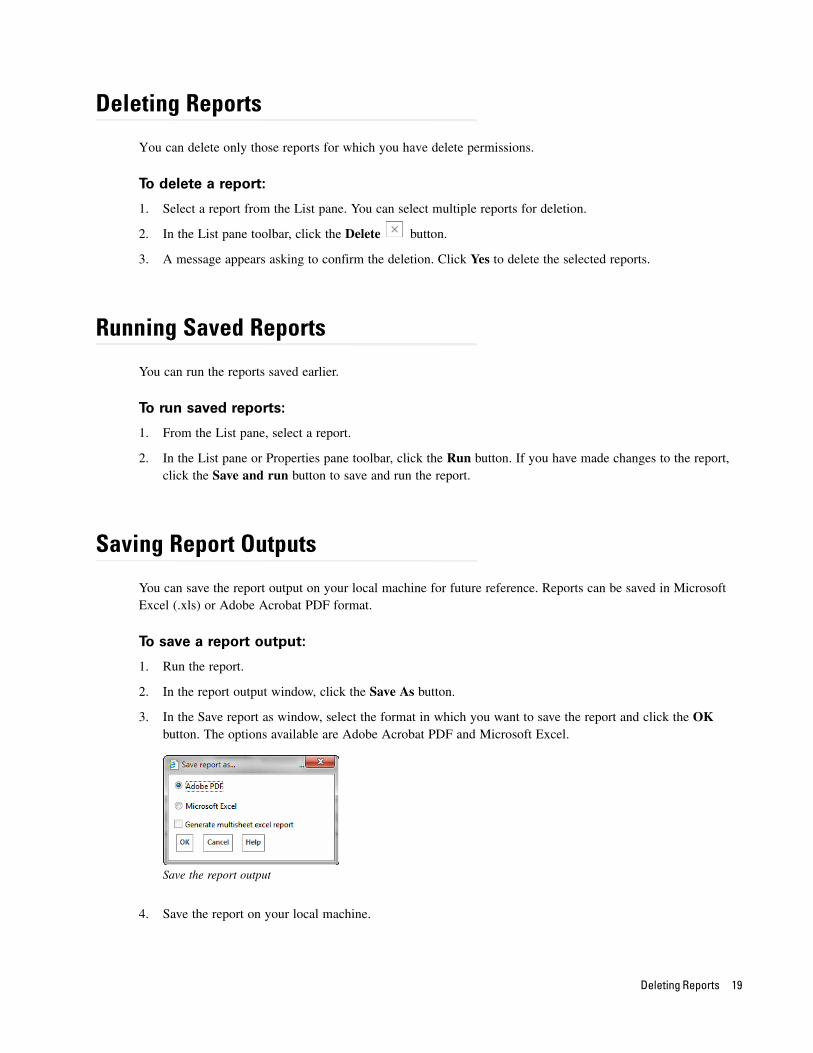
To schedule a report:
1. In the List pane, select a report.
2. In the Properties pane, go to the Schedule tab and provide the following details.
Select when the report should run: By default On demand (unscheduled) is selected. You can select from one of the following options.
On demand (unscheduled)
Every n days
Daily
Weekly, on a specified day
Monthly, on a specified day
Schedule a report
On the days that the report runs: Specify the time at which the report should run on the scheduled date. The following options are available.
Run the report once at the specified time
Run the report every n hours starting at the specified time Select the duration when this schedule will be in effect: Specify a start date and end date for the
schedule to run.
Important: If you are creating a new report, the Schedule tab becomes available only after you
save the criteria set for running the report.
Scheduling Reports 21
Start date: Specify the date when the report schedule will get effective.
End date: Specify the date when the report schedule will get ineffective.
For example: You schedule a report to run every four days at 7 PM from 8/23/2016 to 9/23/2016. This report will run automatically on every fourth day at 7 PM from 8/23/2016 to 9/23/2016.
Sending Notifications
For the scheduled reports, a notification can be sent out to the concerned people that a report has been run. You can send notification to internal users and also to external email addresses. Along with the notification, the report is also attached.
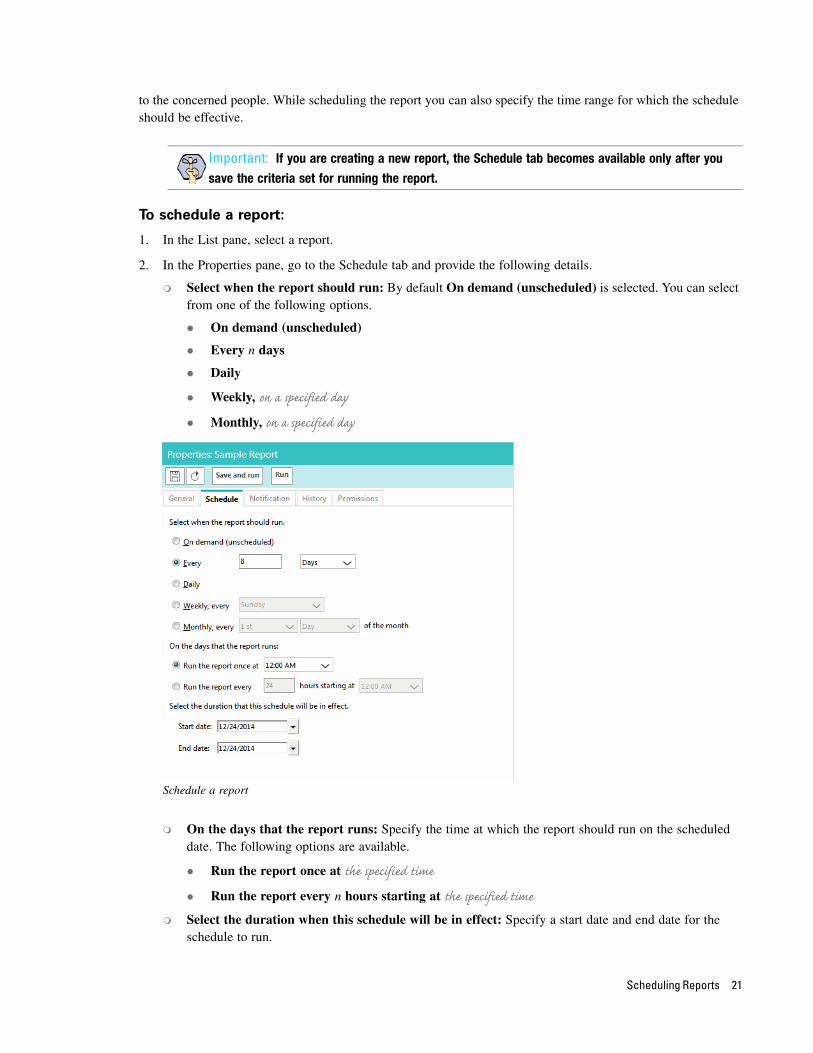
To send a notification:
1. In the List pane, select a report.
2. In the Properties pane, go to the Notification tab and provide the following details.
To: In the field, click the Assistance button. In the Address Book window that appears select the internal users in the Recipients tab. In the Selected recipients list, specify if you want to send an internal message, an email, or both of them. If you want to send the report to some external email addresses, then provide the email addresses in the External Email Address tab.
Subject: Type a subject for the notification.
Text box: Type a message in the text box. You can use the text box toolbar to edit the text. The text of notification emails can contain only 1,500 characters or less.
Set the notification properties
Important: Notifications are sent only for scheduled reports.
22 Enterprise Chat and Email Administrator’s Guide to Reports Console

The report notification displays the name of the report, the time when it is run, and the link to the report output. From the report notification emails only the first level of the reports is available. To access the next levels, you need to login to the application.
Sample report notification message
3. Click the Save button.
Setting Permissions on Reports
You can give permissions to other users to view, run, edit, delete, or schedule the reports created by you. Permissions can be given only to users created in ECE who have the following actions assigned to them:
Report - View
Report - Run
Report - Edit
Report - Delete
Report - Schedule
To give permissions:
1. In the List pane select the report on which you want to give permissions.
Setting Permissions on Reports 23

2. In the Properties pane, go to the Permissions tab and do the following:
Give permissions to users
a. From Types select the users to whom you want to give permissions on the reports.
b. Select the permissions you want to give to the users. You can give the following permissions.
View
Run
Edit
Delete
Schedule
You can give permissions to the users in two ways:
You can give each permission to each user individually.
You can use the Select all button to give a permission to all the users at one time.
For example: You have to give view permission to all the users. Instead of selecting the permission for each user you can select the permission, and use the Select all button to give permission to all the users.
c. Click the Save button.
24 Enterprise Chat and Email Administrator’s Guide to Reports Console

Agent Performance Reports
Notes
Agent Availability for Chat Report
Agent Chat Productivity by Queue Report
Agent Efficiency Report
Agent Login Summary Report
Agent Work Summary Report

Agent Performance reports are designed to help you track, analyze, and improve agent performance.
Enterprise Chat and Email contains templates for five types of agent performance reports:
1. Agent Availability for Chat
2. Agent Chat Productivity by Queue
3. Agent Efficiency
4. Agent Login Summary
5. Agent Work Summary
Notes
The following terms are common to Agent Performance reports:
Serviced ChatsServiced chats were chat activities that an agent worked on at least once. A chat is considered “Serviced” when the activity status is changed to Assigned - In Progress at least once. This occurs when the agent selects the activity in the Chat Inbox for the first time.
Abandoned ChatsAbandoned chats are chat activities the customer left before an agent joined the chat session. A chat is considered “Abandoned” if the customer leaves the chat session before the activity status is changed to Assigned - In Progress for the first time, which occurs when the agent selects the activity in the Chat Inbox for the first time
Agent Availability for Chat Report
This report provides data about the length of time the chat agents are available to receive chats during the time in which they are logged in. This report helps managers to understand how much of the total logged in time of agents is used to service chats.
Report OutputThis section describes the details for each column in the various levels of the report along with any formulas that are used to calculate values. Unless specified otherwise, only actions that occur within the reporting period are included in the output.
This report has two levels:
Level 1: Displays data for all selected agents for the reporting time period. (page 27)
26 Enterprise Chat and Email Administrator’s Guide to Reports Console

Level 2: Displays the data for a selected user, broken down by time interval. (page 27)
Level 1Level 1 displays the following information:
User name: User names of the agents for whom the report is run.
Time:
Logged On: The total time the user was logged into the application.
Available For Chat: The time for which the agent was available for servicing chats. This is the time for which the agent’s availability indicator shows him available for chats.
Not Available For Chat: The time for which the agent was logged in the application but was unavailable for chats.
Time Not Available for Chat = Time Logged On - Time Available for Chat
Percentage Availability For Chat: Out of the total logged-in time, the percentage of time the agent was available for chats.
Percentage Availability for Chat = (Time Availability for Chat (in seconds)/
Time Logged On (in seconds)) *100
Level 1 of a sample Agent Availability for Chat report
Level 2Level 2 displays the time interval break up of the report for the selected user. To drill down to this level of report, click on the user name in Level 1.
Level 2 displays the following information:
Interval Start: The starting point of the desired interval for the reporting period. Intervals of the reporting period can be hours, days, weeks, etc.
For information on the measurements of the other columns, see Level 1.
Agent Availability for Chat Report 27

Level 2 of a sample Agent Availability for Chat report
Agent Chat Productivity by Queue Report
This report measures the volume of chats handled by agents in each queue and the time taken for handling chats. This report helps supervisors measure the productivity of agents, identify agents who are highly productive, and focus training efforts on agents who are not as productive.
Report OutputThis section describes the details for each column in the various levels of the report along with any formulas that are used to calculate values. Unless specified otherwise, only actions that occur within the reporting period are included in the output.
This report has four levels.
Level 1: Displays data for all selected agents for the reporting time period. (page 28)
Level 2: Displays the data for a selected queue, broken down by time interval. (page 29)
Level 3: Display details of all activities for the selected time interval. (page 30)
Level 4: Displays details of the selected activity. The objective is to help the supervisor examine the chat transcript of any specific activity. (page 31)
Level 1Level 1 displays the following information:
Queue: Name of the queue for which the selected users have worked during the reporting time period.
Chats serviced:
Assign: Number of chats, which were directly assigned to the agent by the system, from an entry point. Chats can be assigned through either Push or Pull.
Transfer: Number of chats that were transferred to the agent. This includes only those chats that were transferred from one agent to another. If an agent transfers a chat to a queue or department and another agent is assigned that chat, this chat will not be counted in transferred chats activity. It will be counted in the assigned chats.
28 Enterprise Chat and Email Administrator’s Guide to Reports Console

Conference: Number of chats in which the agent was conferenced.
Total: Total number of chats serviced by the agent.
Total = Assign + Transfer + Conference
Average Time:
Work: Work time is defined as the time agent spends in servicing chat activities. This is not the time for which the chat stays in the agents inbox, but the time for which the agent works on the activity. For example the agent is servicing two chats at a time and both the activity stays in the agent’s inbox for 10 minutes and the time for which the agent has serviced each of the chat is five minutes, the work time for each activity will be five minutes. This does not include the chats in the Completed or Monitor folders. Total work time is the sum of all work times for all chat activities serviced by the agent for the queue in the reporting time period.
Average work time = Total Work Time / Total chats serviced
Wrap: Wrap time for a chat activity is defined as the time agent spends in doing post chat work after the customer has exited the chat. This is the time the agents focus is on a chat in the Current folder (not completed or monitor folders), after the customer exits the chat and before the agent completes the activity. Total wrap time is the sum of all wrap times for chat activities serviced by the agent for the queue. If the agent leaves the chat before the customer exits the chat, the wrap time for the activity is zero.
Average wrap time = Total wrap time / Total chats serviced
Handle: Average handle time for all the activities worked on. As the wrap time for email activities is always zero, the work time and handle time is the same.
Average Handle Time = (Total work time + Total wrap time) / Total chats
serviced
Level 1 of a sample Chat Productivity by Queue report
Level 2Level 2 displays the data for a selected queue, broken down by time interval. To drill down to this level of report, click on the queue name in Level 1.
Level 2 displays the following information:
Interval Start: The starting point of the desired interval for the reporting period. Intervals of the reporting period can be hours, days, weeks, etc.
Agent Chat Productivity by Queue Report 29

For information on the measurements of the other columns, see Level 1.
Level 2 of a sample Chat Productivity by Queue report
Level 3Level 3 displays the details of all activities for the selected time interval. To drill down to this level, click on a time interval in Level 2.
Level 3 displays the following information:
Activity ID: Activity ID of the chat.
Activity Start: Date and time when activity was created.
Activity End: Date and time when the chat activity was completed.
Wait Time: Time between activity creation and start of service i.e. when activity status changed to Assigned - In progress the first time.
Wait time = Service start time - Activity creation time
Chat Duration: Duration of the chat. The chat duration includes the wait time, actual time that an agent spent chatting with the customer, and the wrap-up time after customer left the session.
Chat duration = Activity completion time - Activity creation time
Abandoned/ Serviced: This field displays if the chat activity was abandoned or serviced by agent. This field will display N/A if the chat was ended, i.e. the agent completed the chat or the customer exited the chat. If the chat is not ended at the reporting time, the column will be blank.
Important: In case of chats that have still not been completed, all fields, except for Activity ID
and Activity Start, will be blank.
30 Enterprise Chat and Email Administrator’s Guide to Reports Console

Completed By: If the chat is serviced and completed by the agent, this column shows the user name of the agent who completed the activity. If the agent clicks the Leave button and leaves the chat, before the customer exited from the session, or if the chat gets abandoned, this column shows the value System.
Level 3 of a sample Chat Productivity by Queue report
Level 4Level 4 displays the details of the selected activity. To drill down to this level, click on an activity ID in Level 3.
Level 4 displays the following information:
Chat Transcript:
Time Stamp: Time at which the chat message was sent.
Chat By: Name of the agent or the customer who sent the message. For the messages generated by the system the column shows the value System. For example, the message, A representative will be with you in about a minute, is a system generated message.
Message: Message sent.
Notes:
Time Stamp: Time when the note was created.
Created By: User name of the user who created the note.
Notes: Content of the note.
General Attributes:
Activity ID: Activity ID of the chat.
Case ID: Case ID of the chat.
Type: Type of activity will be Chat.
Mode: Mode will be Inbound.
Sub Type: Sub type will be General.
Date Created: Date and time when the activity was created.
Waiting Time: Time for which the customer waited before being serviced.
Activity Duration: Duration of the activity.
Subject: This is the first message sent by the customer.
Important: Level 4 drilldown is not available for chats that have not been completed.
Agent Chat Productivity by Queue Report 31

Priority: Priority of the activity.
Queue Name: Name of the original queue where the activity got routed to for the first time.
Referrer Name: Name of the referrer URL.
Customer Name: Full name of the customer i.e. first name, middle name, and last name.
Email address: Email address of the customer, to which the transcript was sent. If no transcript was sent, this column will show the last updated email address of the customer.
Follow-up email sent (Y/N): This column shows whether chat transcript was emailed to the customer.
Customer OS / Browser details: Customer’s browser details.
Web collaboration mode: Basic.
Category: Categories assigned to the activity.
Resolution code: Resolution codes assigned to the activity.
Level 4 of a sample Chat Productivity by Queue report
Agent Efficiency Report
This report provides insight in the efficiency of agents in handling the activities and cases assigned to them. It answers the following questions for the reporting period:
How many emails are assigned to agents?
How many are transferred, closed, or completed?
How many of the closed items are being reopened?
Report OutputThis section describes the details for each column in the various levels of the report along with any formulas that are used to calculate values. Unless specified otherwise, only actions that occur within the reporting period are included in the output.
This report has one level.
32 Enterprise Chat and Email Administrator’s Guide to Reports Console

Level 1Level 1 displays the following information:
User Name: User names of the agents.
Activities:
Assigned to Agent: Activities assigned to the agent.
Activities Assigned = Activities pushed from queues to agent + Activities assigned to agent directly from workflows + Activities transferred to agent from other queues and departments + Activities pulled by agent + Activities composed by agent
Transferred Out by Users: Activities transferred out of the agent’s inbox by the agent. Note that this includes activities transferred to a queue, user, or department.
Transferred Out by Workflow: Activities transferred out of the agent’s inbox by workflows.
Transferred Out by Workflow = Activities transferred out by Alarm workflows + Activities pushed back to the queue by the system
Completed: Activities completed by the agent.
Cases
Open At Start: Number of cases that were open and assigned to the agent at the start of the reporting period.
Assigned: Number of cases that were assigned to the agent.
Closed: Number of cases that were closed by the agent.
Reopened: Out of the cases closed by the agent in the reporting period, the number of cases that were reopened by the time the report was run.
Percentage Closed: Percentage of all open and assigned cases that were closed by the agent.
Percentage Closed = 100 * Closed / (Open At Start + Assigned)
Percentage Reopened: Percentage of cases closed during the reporting period that were reopened by the time the report was run.
Percentage Reopened = 100 * Reopened / Closed
A sample Agent Efficiency report
Agent Efficiency Report 33
Agent Login Summary Report
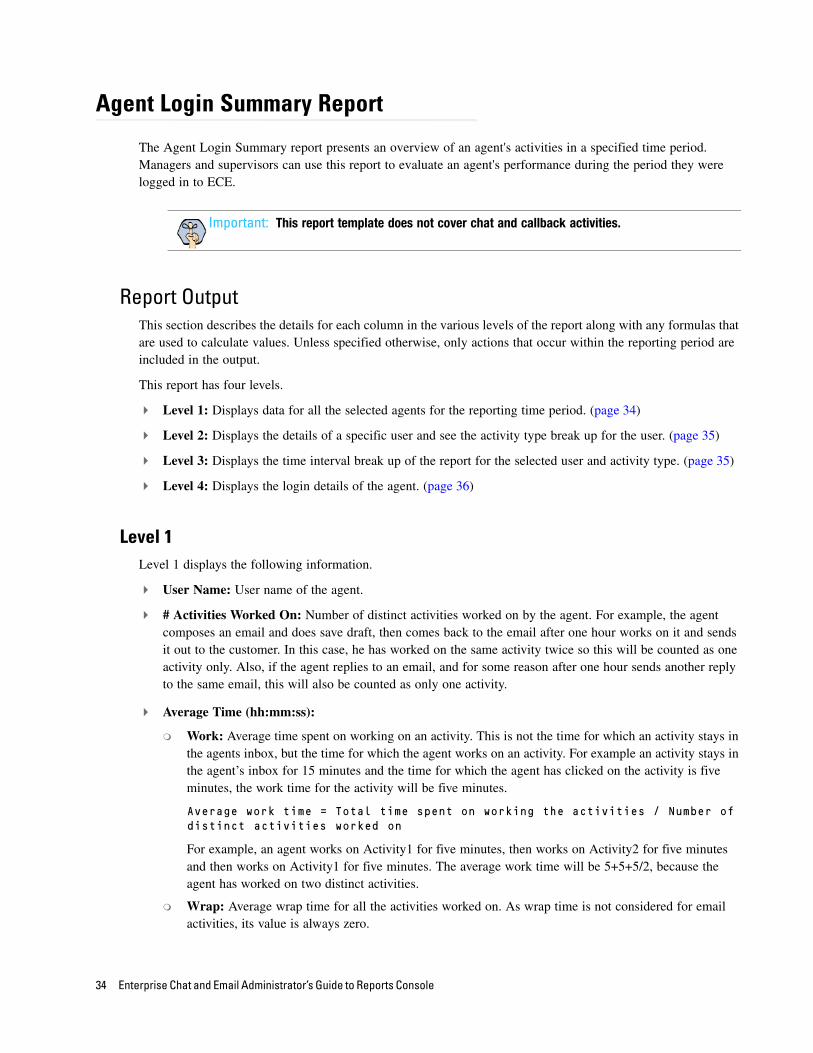
The Agent Login Summary report presents an overview of an agent's activities in a specified time period. Managers and supervisors can use this report to evaluate an agent's performance during the period they were logged in to ECE.
Report OutputThis section describes the details for each column in the various levels of the report along with any formulas that are used to calculate values. Unless specified otherwise, only actions that occur within the reporting period are included in the output.
This report has four levels.
Level 1: Displays data for all the selected agents for the reporting time period. (page 34)
Level 2: Displays the details of a specific user and see the activity type break up for the user. (page 35)
Level 3: Displays the time interval break up of the report for the selected user and activity type. (page 35)
Level 4: Displays the login details of the agent. (page 36)
Level 1Level 1 displays the following information.
User Name: User name of the agent.
# Activities Worked On: Number of distinct activities worked on by the agent. For example, the agent composes an email and does save draft, then comes back to the email after one hour works on it and sends it out to the customer. In this case, he has worked on the same activity twice so this will be counted as one activity only. Also, if the agent replies to an email, and for some reason after one hour sends another reply to the same email, this will also be counted as only one activity.
Average Time (hh:mm:ss):
Work: Average time spent on working on an activity. This is not the time for which an activity stays in the agents inbox, but the time for which the agent works on an activity. For example an activity stays in the agent’s inbox for 15 minutes and the time for which the agent has clicked on the activity is five minutes, the work time for the activity will be five minutes.
Average work time = Total time spent on working the activities / Number of distinct activities worked on
For example, an agent works on Activity1 for five minutes, then works on Activity2 for five minutes and then works on Activity1 for five minutes. The average work time will be 5+5+5/2, because the agent has worked on two distinct activities.
Wrap: Average wrap time for all the activities worked on. As wrap time is not considered for email activities, its value is always zero.
Important: This report template does not cover chat and callback activities.
34 Enterprise Chat and Email Administrator’s Guide to Reports Console
Handle: Average handle time for all the activities worked on. As the wrap time for email activities is always zero, the work time and handle time will be the same.
Average handle time = Total work time + Total wrap time / Number of distinct activities worked on
Time (hh:mm:ss):
Cumulative Handle Time: The total handle time for all the activities worked on by the user.
Logged On Time: Total time the agent was logged in to the application.
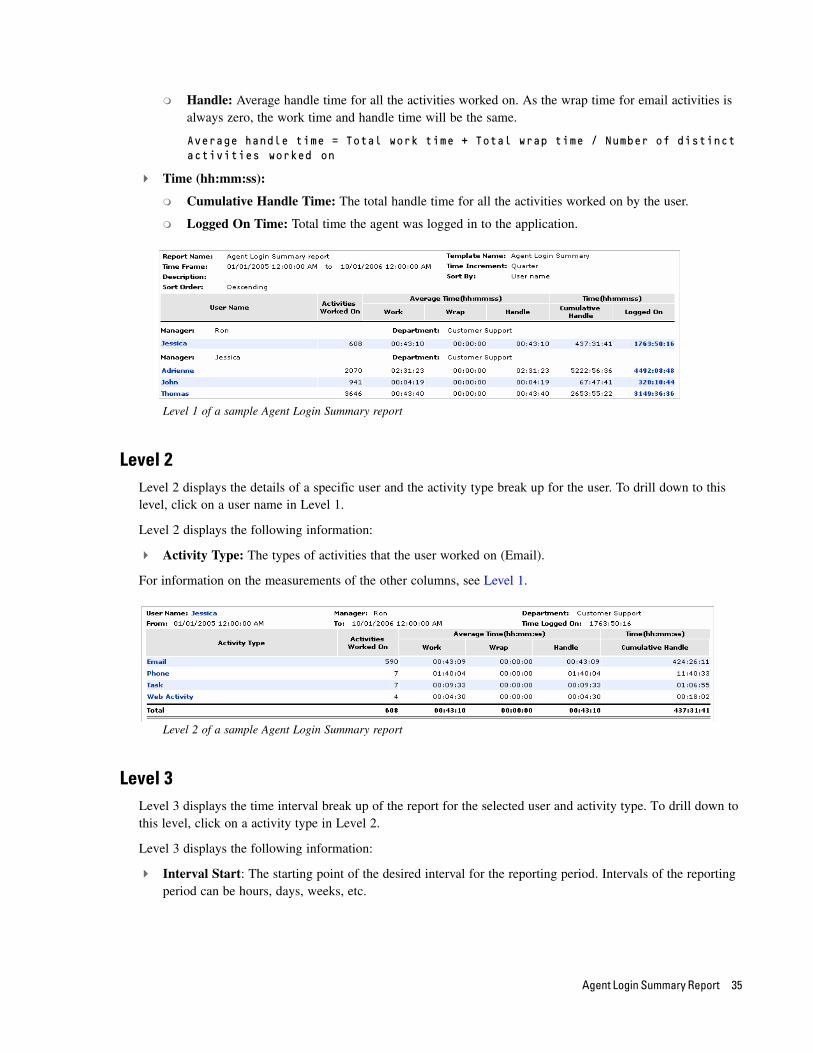
Level 1 of a sample Agent Login Summary report
Level 2Level 2 displays the details of a specific user and the activity type break up for the user. To drill down to this level, click on a user name in Level 1.
Level 2 displays the following information:
Activity Type: The types of activities that the user worked on (Email).
For information on the measurements of the other columns, see Level 1.
Level 2 of a sample Agent Login Summary report
Level 3Level 3 displays the time interval break up of the report for the selected user and activity type. To drill down to this level, click on a activity type in Level 2.
Level 3 displays the following information:
Interval Start: The starting point of the desired interval for the reporting period. Intervals of the reporting period can be hours, days, weeks, etc.
Agent Login Summary Report 35

For information on the measurements of the other columns, see Level 1.
Level 3 of a sample Agent Login Summary report
Level 4Level 4 displays the login details of the agent. To drill down to this level, click on a time stamp in the Logged On column of Level 1.
Level 4 displays the following information:
Login Time: Date and time of login.
Logout Time: Date and time of logout.
Reason: Reason for logout. The reasons for logout can be one of the following:
Logout: Agent clicks the Logout button and logs out of the application.
Timeout: Agent does not logout of the application but his login is timed out because of inactivity. In this case, the Logged on time will also include the inactive time.
Forced Logout: Someone else logged in with the same user name and the agent is forced to logout.
Time Logged On: Time for which the agent was logged on.
Level 4 of a sample Agent Login Summary report
Agent Work Summary Report
The rate at which agents are able to process Email activities. Chat activities and activities that are in the supervisory loop are not included. For information about the handling of chats, use the Agent Chat Productivity
36 Enterprise Chat and Email Administrator’s Guide to Reports Console

by Queue Report.
This report gives you an in-depth understanding of the rate of processing of activities by agents. Note that activities in the supervisory loop are not considered in this report.
A Note About Turnaround TimeAn activity assigned to agent is considered to be turned around by the agent once the agent performs any of the following actions manually on that activity send, send and complete, complete and transfer.
Turnaround time for an activity is the time measured from the point the activity got assigned to the agent, till the point it was turned around by the agent. This can be measured in business hours or the 24 hour format.
Average turn around time is the total turnaround time (for all the turned around activities) divided by the number of activities turned around.
Note that the number of activities turned around is not displayed in the report.
It can happen that an activity which is turned around by the agent (say by transferring to a queue) is reassigned to him. If the agent turns it around a second time (say by completing), the number of activities turned around for the agent is two i.e. same activity can be turned around more than once by the same agent.
Action by rules to move an activity out of agent inbox (auto pushback/transfer by alarm workflows) are not considered in counting turned around activities.
If agent1 composes an activity and assigns it to agent2. Agent2 completes the activity. In this case this activity is considered as turned around by agent2, but is not considered as a turned around activity for agent1.
With this report you can also calculate the percentage of activities that meet a specific turnaround time. For example: While configuring the report you specify the turnaround time for email to be one hour. The column, percentage meeting turn around time, in the report will show the percentage of emails that were turned around in one hour.
Report OutputThis section describes the details for each column in the various levels of the report along with any formulas that are used to calculate values. Unless specified otherwise, only actions that occur within the reporting period are included in the output.
This report has three levels.
Level 1: Displays data for all selected agents for the reporting time period. (page 38)
Level 2: Displays the data for a selected user, broken down by activity type. (page 39)
Level 3: Displays the data for the selected user and activity type, broken down by time interval. (page 39)
Level 1Level 1 of the Agent Work Summary report is also available in the Cisco Unified Intelligence Center.
Level 1 displays the following:
User Name: User name of the agent.
Agent Work Summary Report 37

Assigned: Number of activities assigned to the agent.
Assigned = Activities assigned by inbound and transfer workflows + Activities transferred manually by other users
Pulled: Number of activities picked and pulled by the agent.
Worked on: Total number of distinct activities selected at least once in the Agent Console.
Composed: Number of activities created by the agent by selecting a New Activity Shortcut.
Replied: Number of replies sent by the agent.
Completed: Number of activities completed by the agent by clicking the Send and Complete or Complete buttons.
Transferred To Users: Number of activities transferred by the agent to other users.
Transferred To Queues: Number of activities transferred by the agent to other queues.
Transferred To System/Departments: Number of activities transferred by the agent to the system user or to other departments.
Transferred by Workflow: Number of activities transferred by workflow.
Transferred by Workflow = Activities automatically pushed back from the agent's inbox + Activities transferred by alarm rules.
Average Turnaround Time: Turnaround time for an activity is the time period between the time at which the activity was assigned to the agent and the time at which the agent performed one of the following actions for that activity: Send, Send and Complete, Complete, or Transfer. For more details, see “A Note About Turnaround Time” on page 37.
Average turnaround time = Total turnaround time/Total number of activities turned around
Level 1 of a sample Agent Work Summary report
Level 2Level 2 shows the details of a specific user and an activity-type break down for the user. To drill down to this level, click on a user name in Level 1.
Level 2 displays the following information:
Activity Type: The types of activities that the user worked on (Email).
38 Enterprise Chat and Email Administrator’s Guide to Reports Console
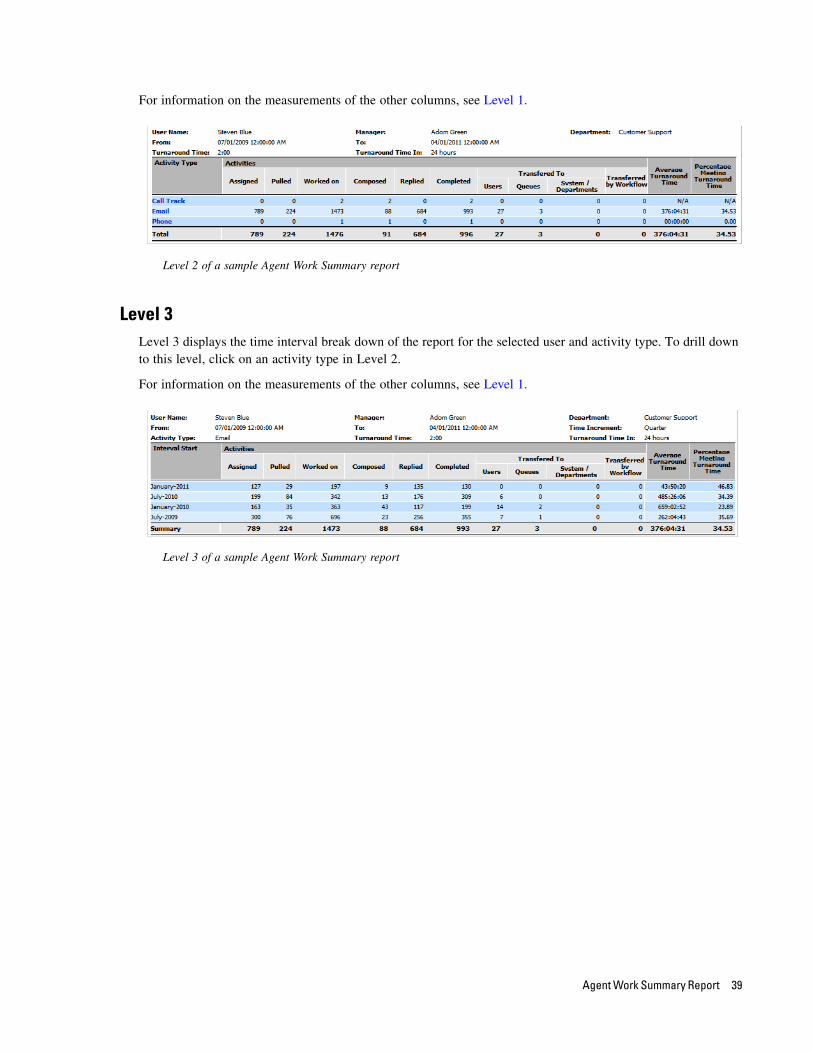
For information on the measurements of the other columns, see Level 1.
Level 2 of a sample Agent Work Summary report
Level 3Level 3 displays the time interval break down of the report for the selected user and activity type. To drill down to this level, click on an activity type in Level 2.
For information on the measurements of the other columns, see Level 1.
Level 3 of a sample Agent Work Summary report
Agent Work Summary Report 39

Callback Volume Report
Callback Volume Report
The Callback reports provide information on the callback activities.
Enterprise Chat and Email contains one template for callback reports:
Callback Volume Report
Callback Volume Report
This report provides a complete list of Callback requests that were placed during the time period selected for the report. The report includes both callback and delayed callback requests.
This report has only 1 level.
Level 1Level 1 displays the following information.
Date: Date on which the web form submission was made.
Caller Name: Name of the customer.
Phone #: The phone number entered in the web form as the number to which the call is to be made.
Delayed minutes: The delay period (in minutes) that is specified in the web form as the period of time the system should wait before placing the call to the customer. This applies to delayed callback requests only. The number will be zero for a regular web callback and will be greater than zero for delayed callback.
Disposition: Current state of the request.
Failed: Number of calls that were attempted, but failed to get connected to the customer’s phone number.
Timeout: Number of calls that timed out before the call could be completed.
Completed: Number of calls that were successfully handled.
Abandoned: Number of calls that failed for reasons other than a failure to connect or a timeout.
Callback Volume Report 41

Classification Reports
Activity and Case Classification Report

Classification reports are useful for identifying customer service trends in the contact center.
ECE contains one template for classification reports:
Activity and Case Classification Report
Activity and Case Classification Report
This report presents the average handle and resolution time, number of transferred activities, and the count for each classification and sub-classification. It also provides the percentage of cases in each classification. This report helps in identifying the types of issues faced by customers based on classifications. Managers can identify the issues that occur repeatedly and are critical. While configuring the report, managers can choose to include or exclude classifications that have been deleted from the system.
Here are a few examples of how the information outlined in this report can be used:
Staff can be trained to deal with specific types of issues.
Articles with solution to the problem can be put on the self-service website so that the customers can use them. This will reduce the load on the contact center.
Issues can be identified as critical and prioritized to resolve it.
Report OutputThis section describes the details for each column in the various levels of the report along with any formulas that are used to calculate values. Unless specified otherwise, only actions that occur within the reporting period are included in the output.
This report has one level.
Level 1Level 1 displays the following information:
A sample Activity and Case Classification report
Classification: Names of categories and resolution codes. If a report is run for a classification, which has sub-classifications, then the report shows both classifications and sub-classifications.
Activity and Case Classification Report 43

For example: In the window below, if Digital video recorders is selected, the report will be run for Digital Video Recorders and its sub-classification DVRs.
Sample classification
Activities Classified: Number of activities classified.
Cases Classified: A case cannot be classified on its own, but when an activity associated with a case is assigned a classification, the case is also assigned that classification.
New: Number of new cases which got this classification. New case means the case created in reporting time period.
Existing: Number of existing cases which got this classification. Existing case means the case created before the reporting time period.
Percentage Cases Classified: Percentage of cases classified in a category or resolution code.
Percentage cases classified = 100 * Cases classified (New + Existing) / Summary cases classified (New + Existing)
Important Things to NoteHere is some additional information to help understand the values in the Activities classified and Cases classified columns.
In the table above:
5 activities get classified as Laptops and HP
Classification Activities classified Cases Classified Existing Percentage Cases Classified
Laptops 10 10 50
HP 5 5 50
Printers 10 10 100
Cartridge 5 5 100
Summary 15 15
44 Enterprise Chat and Email Administrator’s Guide to Reports Console
5 activities get classified as HP and Printers
5 activities get classified as Cartridges
Let us try to understand the values in the columns Activities classified and Cases classified and the row Summary:
1. When the agents assigns category Laptop and HP to an activity, HP count goes up by one and Laptop count will go up by two in the Activities classified and Cases Classified column.
Five activities gets classified as HP and Laptops and five activities get classified as HP. The count of HP will increase +5 and count of Laptop will increase +10, as the activities classified as HP will also get classified as Laptop.
2. The Summary column shows the total number of distinct activities.
Total number of distinct activities is 15.
3. If an activity gets classified and then declassified, within a reporting time period then the activity is not shown in the report.
4. If a case is already classified before the time period and no classification happens in the reporting time period, then this case is not shown in the report.
5. If activity in a case is assigned category A before the reporting time period, and during the reporting time period another activity in the case is assigned category B, then Case and Activity count will be incremented for category B only.
Activity and Case Classification Report 45
Contact Center Trend Reports
Case Volume Report
Email Volume Report

Contact center trend reports help managers identify the volume of requests handled by the contact center.
The contact center trend reports templates are:
1. Case volume
2. Email volume
Case Volume Report
This report provides managers information about the rate of creation of cases in each department and case closure rate and measure the overall effectiveness of the contact center. Managers can use this report to help reduce the number of case reopens, reduce the number of activities in the case and keep a check on the percentage of cases not meeting set resolution times.
Report OutputThis section describes the details for each column in the various levels of the report along with any formulas that are used to calculate values. Unless specified otherwise, only actions that occur within the reporting period are included in the output.
This report has one level.
Level 1Level 1 displays the following information:
Date: Displays the date for each day within the reporting time period.
Cases:
New: Number of new cases created in the department. A case belongs to a department, if the first activity of the case belongs to the department. For example, Activity1 comes in Department1 and a new case is associated to the activity. Activity2 belonging to the same case comes in Department1 and is transferred to Department2. The case will belong to Department1, although an activity of the case belongs to Department2.
Closed: Number of cases closed in the department.
Reopened: Out of the cases closed by the agent in the reporting period, the number of cases that were reopened in the reporting period. If a case is closed and reopened multiple times in a time period, each of those close and reopen events get reported, if they fall within the reporting time period.
For example: You run a report on 15 September for the time period of 1 August to 30 August.
A case was opened on 27th August and closed on 28th August and reopened on 29th August.
A case was opened on 2nd August and closed on 4th August and reopened on 6th August and closed on 7th August.
A case was opened on 27th August closed on 28th August and reopened on 5th September.
Except for the case that got reopened on fifth September all other cases will get counted in this report.
Case Volume Report 47

Percentage Within Service Level: Out of the cases that got closed in the reporting time period, percentage of cases that were closed within the service level.
Average:
Resolution time: Average resolution time for the cases closed in business or 24 hours format.
Activity per Case: Average number of activities per case that have been closed.
A sample Case Volume report
Email Volume Report
Managers and supervisors can use this report to understand the daily volume of email activities coming in and going out of the service organization over the reporting period, and the moving average for the specified number of days. This report allows executive management to spot trends in email volumes over a period of time.
A Note About Moving AverageThe average number of activities received over a specified time period. For example, if you are calculating the moving average for received emails for the reporting period from August 10 to August 30, and the number of days for which you are calculating moving average is five days, the moving average column for received emails for August 15 will be the total number of incoming emails from August 10 to August 14, divided by five. Likewise, the moving average for August 16 will be the total number of incoming emails from August 11 to August 15 divided by five.
Report OutputThis section describes the details for each column in the various levels of the report along with any formulas that are used to calculate values. Unless specified otherwise, only actions that occur within the reporting period are included in the output.
The report has only one level.
Important: For the percentage and average columns, the number of cases closed will mean the
number of cases, which got closed in the time period and never got opened till the time the report
is run.
48 Enterprise Chat and Email Administrator’s Guide to Reports Console

Level 1Level 1 displays the following information:
Date: Displays the date for each day within the reporting time period.
Received Emails:
#: Number of incoming emails for the alias.
Moving Avg.: Moving average for the number of incoming emails.
Compose:
#: Number of composed emails for the alias.The emails have to be sent out by dispatcher, for this column to be incremented.
Moving Avg.: Moving average for the number of composed email activities. For more details, see “A Note About Moving Average” on page 48.
Outgoing Emails:
Manual Replies:
#: Number of manual email replies for the alias. The emails have to be sent out by dispatcher, for this column to be incremented.
Moving Avg.: Moving average for the number of manual email replies. For more details, see “A Note About Moving Average” on page 48.
Auto Replies:
#: Number of automatic email replies for the alias. The emails have to be sent out by dispatcher, for this column to be incremented.
Moving Avg.: Moving average for the number of automatic email replies. For more details, see “A Note About Moving Average” on page 48.
A sample Email Volume report
Email Volume Report 49
Service Level Performance
Reports
Notes
Case Age Report
Email Age by Alias Report
Email Age by Queue Report

Service levels are important indicators of the quality of customer service provided by the organization. Supervisors and members of the executive management use these reports to measure response times in the contact center.
The Service Level Performance report templates are:
1. Case Age
2. Email Age by Alias
3. Email Age by Queue
Notes
Below are some key terms that are important to remember when managing Service Level Performance reports.
Age BucketsThe service level performance reports displays the age of cases and emails in the system, separated into discrete brackets, named age buckets, provided by the system. Using these age buckets, you can find cases and emails that belong to different ages. For example, you can run a report to see the number of cases which have an age of 8 to 12 hours or 12 to 16 hours.
There are 36 age buckets available in the system. You can use a maximum of 12 age buckets in one report.
Calculating AgeThe age of cases and emails are calculated based on configuration for either business calendar hours or 24 hours.
For example: A new case is opened in the system at 9 pm, but the department in which it came to has their business calendar set for 9 am to 5 pm with their reports run at 9:30 am.
If you are calculating age using 24 hours, the age of the case will be 12 hours and 30 minutes.
If you are calculating age using the business hours calendar, the age of the case will be 30 minutes.
Case Age Report
This report is used to calculate the number of open cases in the system and their age.
Managers can track issues that are aging beyond limits set by the service organization and can take action to improve case resolution time.
Notes 51

Report OutputThis section describes the details for each column in the various levels of the report along with any formulas that are used to calculate values. Unless specified otherwise, only actions that occur within the reporting period are included in the output.
This report has one level.
Level 1Level 1 displays the following information:
Department: Names of the departments for which the report is run.
Cases:
Open: Number of open cases in the department. A case belongs to a department if the first activity of the case belongs to the department. For example, Activity1 comes in Department1 and a new case is associated with the activity. Activity2 belonging to the same case comes in Department1 and is transferred to Department2. In this case the case will belong to Department1 although an activity of the case belongs to Department2.
Average Age (hh:mm): Average age of open cases in business hours or 24 hours. For more information about this figure, see “Notes” on page 51.
Age: Number of open cases that belong to the specified age range. The case age is calculated in business calendar hours or 24 hours, depending on what has been specified while running the report. The number of columns in this section vary, depending on the number of age buckets selected for the report. For more information about this figure, see “Notes” on page 51.
A sample Case Age report
Email Age by Alias Report
This report is used as a planning aid by supervisors and resource schedulers. This report will provide the age of open email activities for each alias. This will help users to track activities which are aging beyond the limits set by the service organization and take effective action.
52 Enterprise Chat and Email Administrator’s Guide to Reports Console

Report OutputThis section describes the details for each column in the various levels of the report along with any formulas that are used to calculate values. Unless specified otherwise, only actions that occur within the reporting period are included in the output.
This report has one level.
Level 1Level 1 displays the following information:
Alias: Lists the aliases selected for running the report.
Email:
Open: Number of emails open at the time the report is run.
Average Age (hh:mm): Average age of open email activities. The email age is calculated in business calendar hours or 24 hours depending on what has been specified while running the report. For more details, see “Notes” on page 51.
Age: Number of open emails that belong to the specified age range. The email age is calculated in business calendar hours or 24 hours depending on what has been specified while running the report. The number of columns in this section vary, depending on the number of age buckets selected for the report. For more details, see “Notes” on page 51.
A sample Email Age by Alias report
Email Age by Alias Report 53

Email Age by Queue Report
This report is used as a planning aid by supervisors and resource schedulers. It provides an accurate picture of the age of open email activities in the queue. This helps to track queues in which activities are aging beyond the limits set by the service organization, and take effective action.
Report OutputThis section describes the details for each column in the various levels of the report along with any formulas that are used to calculate values. Unless specified otherwise, only actions that occur within the reporting period are included in the output.
This report has one level.
Level 1Level 1 displays the following information.
Queue: Names of the queues for which the report is run.
Email:
Open: Number of email activities which are open, at the time the report is run.
Average Age (hh:mm): Average age of open email activities. The email age is calculated in business calendar hours or 24 hours, depending on what has been specified while running the report. For more information, see “Notes” on page 51.
Age: Number of open emails that belong to the specified age range. The email age is calculated in business calendar hours or 24 hours, depending on what has been specified while running the report. The number of columns in this section vary, depending on the number of age buckets selected for the report. For more details, see “Notes” on page 51.
A sample Email Age by Queue report
54 Enterprise Chat and Email Administrator’s Guide to Reports Console

Survey Reports
Chat Survey
Survey reports help supervisors and analysts review the performance of agents when they are interacting directly with customers. Surveys measure the performance of an agent from the customer's point of view, giving analysts immediate impressions from the public.
The Survey report templates available include:
Chat Survey
Chat Survey
The Chat Survey report measures the details of chats that were serviced and abandoned through the customer's perspective. It gives supervisors and analysts a method of correlating chat duration for chats surveyed with question values and comments to analyze individual agent performance.
When a chat interaction between a customer and agent ends, the customer is prompted with a survey which allows them to answer several questions with a simple rating system, as well as leave comments for additional feedback. This report measures the responses and ratings from customers.
Report OutputThis section describes the details for each column in the various levels of the report along with any formulas that are used to calculate values. Unless specified otherwise, only actions that occur within the reporting period are included in the output.
This report has one level.
Level 1 Level 1 displays the following information:
User Name: The user name of the agent who serviced the chat. In the event the chat activity was abandoned, the user name Not assigned is used.
Activity ID: The activity ID.
Chat Start: The date and timestamp when the chat activity was created.
Wait Time: The length of time a visitor had to wait for their chat activity to be assigned to an available agent.
Wait Time = Service start time - Activity creation time.
(Service start time refers to the time when activity status got changed to Assigned - In Progress the first time.)
Chat Duration: The length of time the chat activity was active. This also includes Wrap Time
Chat Duration = Activity completion time - Activity creation time.
Abandoned: This column indicates whether the chat was abandoned. Valid values are:
Yes: The chat was abandoned.
No: The chat was not abandoned; it was serviced.
56 Enterprise Chat and Email Administrator’s Guide to Reports Console
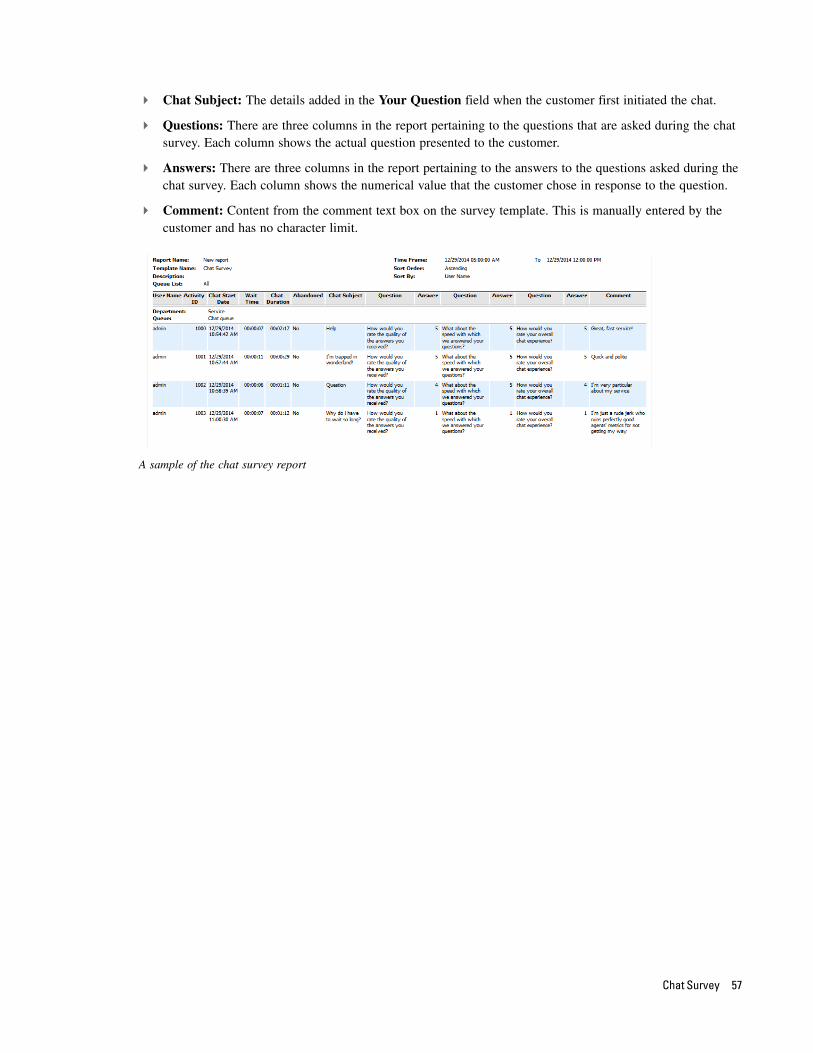
Chat Subject: The details added in the Your Question field when the customer first initiated the chat.
Questions: There are three columns in the report pertaining to the questions that are asked during the chat survey. Each column shows the actual question presented to the customer.
Answers: There are three columns in the report pertaining to the answers to the questions asked during the chat survey. Each column shows the numerical value that the customer chose in response to the question.
Comment: Content from the comment text box on the survey template. This is manually entered by the customer and has no character limit.
A sample of the chat survey report
Chat Survey 57
Workforce Scheduling Reports
A Note About Service Level and Response Time
Chat Volume by Queue Report
Chat Volume by Referrer URL
Email Snapshot by Agent Report
Email Snapshot by Queue Report
Email Volume by Alias Report
Email Volume by Queue Report

Supervisors, administrators, and other resource planners generate Workforce Scheduling Reports.
These reports provide information on email processing such as daily email arrival and handling rates, percentage of email responses meeting service levels, and age distribution of responded emails. Resource planners can use this information to base decisions on switching agents between queues at different times to meet required service levels.
The Workforce Scheduling report templates are:
Chat Volume by Queue
Chat Volume by Referrer URL
Email Snapshot by Agent Report
Email Snapshot by Queue Report
Email Volume by Alias
Email Volume by Queue
A Note About Service Level and Response Time
Some customers may be more valuable to your company than others. Service levels enable you to define the importance of a particular customer, thereby directing agents to respond immediately to customers with high importance. For this, you can assign service levels to your customers and use them in your workflows.
While configuring workforce scheduling reports, you can either specify a service level, or you can use the system service level for computing the emails that were responded with in service level. If you use the system service level, then the response time is also measured using the work times specified at the system level. But, if you specify a service level while configuring the reports, then you have to specify if you want to calculate the response time using 24 hours or business hours calendar.
In these reports you can also specify a service level and calculate the percentage of emails that meet the specified service level.
Chat Volume by Queue Report
This report measures the rate at which chat activities come into a queue, the rate at which they are assigned to the agents, and the percentage of activities in the queue that meet service levels. For resource schedulers, this gives a good indication of the specific queues where the service standards are not satisfactory.
Important: For chat activities, service level cannot be set at system level. You have to specify the
service level while configuring the reports.
A Note About Service Level and Response Time 59
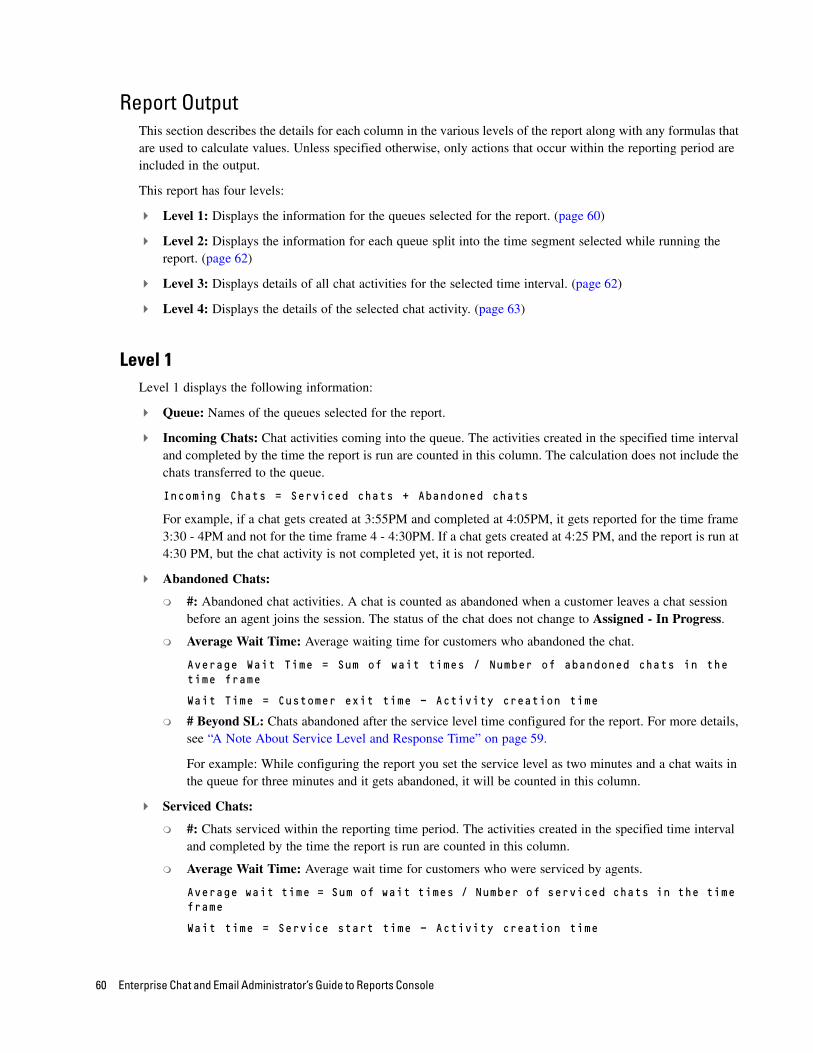
Report OutputThis section describes the details for each column in the various levels of the report along with any formulas that are used to calculate values. Unless specified otherwise, only actions that occur within the reporting period are included in the output.
This report has four levels:
Level 1: Displays the information for the queues selected for the report. (page 60)
Level 2: Displays the information for each queue split into the time segment selected while running the report. (page 62)
Level 3: Displays details of all chat activities for the selected time interval. (page 62)
Level 4: Displays the details of the selected chat activity. (page 63)
Level 1Level 1 displays the following information:
Queue: Names of the queues selected for the report.
Incoming Chats: Chat activities coming into the queue. The activities created in the specified time interval and completed by the time the report is run are counted in this column. The calculation does not include the chats transferred to the queue.
Incoming Chats = Serviced chats + Abandoned chats
For example, if a chat gets created at 3:55PM and completed at 4:05PM, it gets reported for the time frame 3:30 - 4PM and not for the time frame 4 - 4:30PM. If a chat gets created at 4:25 PM, and the report is run at 4:30 PM, but the chat activity is not completed yet, it is not reported.
Abandoned Chats:
#: Abandoned chat activities. A chat is counted as abandoned when a customer leaves a chat session before an agent joins the session. The status of the chat does not change to Assigned - In Progress.
Average Wait Time: Average waiting time for customers who abandoned the chat.
Average Wait Time = Sum of wait times / Number of abandoned chats in the time frame
Wait Time = Customer exit time - Activity creation time
# Beyond SL: Chats abandoned after the service level time configured for the report. For more details, see “A Note About Service Level and Response Time” on page 59.
For example: While configuring the report you set the service level as two minutes and a chat waits in the queue for three minutes and it gets abandoned, it will be counted in this column.
Serviced Chats:
#: Chats serviced within the reporting time period. The activities created in the specified time interval and completed by the time the report is run are counted in this column.
Average Wait Time: Average wait time for customers who were serviced by agents.
Average wait time = Sum of wait times / Number of serviced chats in the time frame
Wait time = Service start time - Activity creation time
60 Enterprise Chat and Email Administrator’s Guide to Reports Console

Service start time refers to the time when activity status was changed to Assigned - In Progress the first time.
Average Chat Duration: Average chat duration for all serviced chat activities.
Average chat duration = Sum of chat durations / Number of serviced chats in the time frame
Chat Duration = Activity completion time - Activity creation time
% Closed By Agent: The percentage of activities completed by an agent out of all chats that were serviced and completed within the specified time frame. This column does not include the activities completed by the customer or system.
% Closed by Agent = (Chats completed by agents / Total serviced chats) * 100
For example, assume there are 10 serviced chats; of those serviced chats, there are:
Two chats where the agent clicks the Leave button while the customer is still in the session, and the customer completes the activity at a later point in time.
Three chats where the agent clicks the Complete button (from the Current or My Monitor folder) while the customer is still in the session.
Five chats where the customer clicks the Exit button and the agent completes the activity (from the Current or My Monitor folder) at a later point in time.
% Closed by agent = 100 *(3 + 5) / 10 = 80%
# Within SL: Displays the number of chats that were serviced within the report’s configured service level time. For more details, see “A Note About Service Level and Response Time” on page 59.
For example, while configuring the report you set the service level as two minutes. Any chat, which waits in the queue for less than two minutes before getting serviced, is counted in this column.
% Within SL: The percentage of chats serviced within the service level out of all serviced and completed chats that were created within the specified time frame. The value in this field can vary based on the way you configure your report criteria. While calculating the percentage within service level, you can either include or exclude the abandoned chats.
% within SL = (Chats serviced within SL / Total number of chats) * 100
If you exclude abandoned chats from the service level computation:
% within SL: The percentage of chats serviced within the service level out of all serviced and completed chats that were created within the specified time frame.
If you include abandoned chats in the service level computation:
% within SL: The percentage of chats serviced within the service level out of all incoming chats that were created within the specified time frame.
For Example, there are a total 20 incoming chats. Of those 20 chats, 10 are abandoned and 10 are serviced. Of the 10 serviced chats, five are serviced within the service level. And, out of the 10 abandoned chats, eight are abandoned beyond the service level.
The % within SL is calculated as:
Do not include abandoned chats in service level: % within SL = 5/10 * 100
Include abandoned chats in service level: % within SL = 5/20 * 100
Chat Volume by Queue Report 61

Level 1 of a sample Chat Volume by Queue report
Level 2Level 2 displays the information for each queue split into the time segment selected while running the report. To drill down to this level, click a queue name in Level 1.
Level 2 displays the following information:
Interval Start: The starting point of the desired interval for the reporting period. Intervals of the reporting period can be hours, days, weeks, etc.
For information on the measurements of the other columns, see Level 1.
Level 2 of a sample Chat Volume by Queue report
Level 3Level 3 displays the list of chat activities handled in a selected time interval. To drill down to this level, click an interval start date in Level 2.
Level 3 displays the following information.
Activity ID: Activity ID of the chat.
Activity Start: Date and time when the activity was created.
Activity End: Date and time when the activity was completed.
Wait Time: Time between activity creation and start of service i.e. when activity status changes to Assigned - In progress the first time.
62 Enterprise Chat and Email Administrator’s Guide to Reports Console

Wait time = Service start time - Activity creation time
Chat Duration: Duration of the chat. It includes the wait time, actual time that an agent spent chatting with the customer, and the wrap-up time after customer left the session.
Chat Duration = Activity completion time - Activity creation time
Abandoned/Serviced: This column displays information on whether or not the chat was serviced within its SL, or if it was abandoned. The possible values for this column are:
Serviced within SL: The activity was serviced and completed within the service level established for that queue.
Serviced beyond SL: The activity was serviced and completed after the service level established for that queue.
Abandoned: The activity is considered as abandoned when a customer leaves a chat session before an agent joins the session.
Completed By: If the agent completes the chat, this column shows the user name of the agent. If the agent clicks the Leave button and leaves the chat before the customer exits from the session, or if the chat gets abandoned, this column shows the value System.
Level 3 of a sample Chat Volume by Queue report
Level 4Level 4 displays the details of the selected chat activity. To drill down to this level, click an activity ID in Level 3.
Level 4 displays the following information:
Chat Transcript:
Time Stamp: Time at which the chat message was sent.
Chat By: Name of the agent or the customer who sent the message. For a system generated message, the column shows the value System. For example, the message, A representative will be with you in about a minute, is a system generated message.
Message: Content of the message sent by the customer or agent.
Chat Volume by Queue Report 63

Level 4 of a sample Chat Volume by Queue report
Notes:
Time Stamp: Date and time when note was created.
Created By: User name of the user who created the note.
Notes: Content of the note.
General Attributes:
Activity ID: Activity ID of the chat.
Case ID: Case ID of the chat.
Type: Type of activity is Chat.
Mode: Mode is Inbound.
Sub Type: Sub type is General.
Date Created: Date and time at which the activity was created.
Waiting Time: Time for which the customer waited before being serviced.
Activity Duration: Duration of the activity.
Subject: This is the first message sent by the customer.
Priority: Priority of the activity.
Queue Name: Name of the original queue where the activity got routed to for the first time.
Referrer Name: Name of the referrer URL.
Customer Name: Full name of the customer i.e. first name, middle name, and last name.
Email address: Email address of the customer, to which the transcript was sent. If no transcript was sent, this column will show the last updated email address of the customer.
Follow-up email sent (Y/N): This column shows whether chat transcript was emailed to the customer.
Customer OS / Browser details: Customer’s browser details.
Web collaboration mode: Basic
Category: Categories assigned to the activity.
Resolution code: Resolution codes assigned to the activity.
64 Enterprise Chat and Email Administrator’s Guide to Reports Console
Level 4 of a sample Chat Volume by Queue report
Chat Volume by Referrer URL
This report displays a referrer-URL wise report of chat activity and allows managers to track the referrer URLs (sections of the website) from which Chat help was requested the most. By comparing web site logs with this report, managers and site designers can understand usage characteristics of the web site from which live help is sought. For example, if one particular section of the web site is driving most of live help traffic, it might indicate usability related issues with that section.
Report OutputThis section describes the details for each column in the various levels of the report along with any formulas that are used to calculate values. Unless specified otherwise, only actions that occur within the reporting period are included in the output.
This report has four levels:
Level 1: Displays the information for the complete reporting period for the departments selected for the report. (page 66)
Level 2: Displays the information for each referrer URL split into the time segment selected while running the report. (page 68)
Level 3: Display details of all activities for the selected time interval. (page 68)
Level 4: Displays details of the selected activity. (page 69)
Important: This template is available only if your installation includes .
Chat Volume by Referrer URL 65

Level 1Level 1 displays the following information:
Referrer Name: Name of the referrer URL.
Incoming Chats: Chat activities coming in the queue. The activities created in the specified time interval and completed by the time the report is run are counted in this column. The calculation does not include the chats transferred to the queue.
Incoming chats = Serviced chats + Abandoned chats
For example, if a chat gets created at 3:55PM and completed at 4:05PM, it gets reported for the time frame 3:30 - 4PM and not for the time frame 4 - 4:30PM. If a chat gets created at 4:25 PM, and the report is run at 4:30 PM, but the chat activity is not completed yet, it doesn't get reported.
Abandoned Chats:
#: Abandoned chat activities. A chat is counted as abandoned when a customer leaves a chat session before an agent joins the session. The status of the chat does not change to Assigned - In Progress.
Average Wait Time: Average waiting time for customers who abandoned the chat.
Average Wait Time = Sum of wait times / Number of abandoned chats in the time frame
Wait Time = Customer exit time - Activity creation time
# Beyond SL: Chats abandoned after the service level time configured for the report. For more details, see “A Note About Service Level and Response Time” on page 59.
For example: If, while configuring the report, you set the service level to two minutes and a chat waits in the queue for three minutes before getting abandoned, it will be counted in this column.
Serviced Chats:
#: Chats serviced within the reporting time period. Activities created in the specified time interval and completed by the time the report is run are counted in this column.
Average Wait Time: Average wait time for customers who were serviced by agents.
Average wait time = Sum of wait times / Number of serviced chats in the time frame
Wait time = Service start time - Activity creation time
“Service start time” refers to the time when activity status got changed to Assigned - In Progress the first time.
Average Chat Duration: Average chat duration for all serviced chat activities.
Average Chat Duration = Sum of chat durations / Number of serviced chats in the time frame
Chat Duration = Activity completion time - Activity creation time
% Closed By Agent: The percentage of activities completed by an agent out of all chats that were serviced and completed within the specified timeframe. This column does not include activities completed by the customer or system.
% closed by agent = 100 * Chats completed by agents / Total serviced chats
For example: Assume there are 10 serviced chats; out of the 10 serviced chats, there are:
Two chats where the agent clicks the Leave button even while the customer is still in the session, and the customer completes the activity at a later point of time.
66 Enterprise Chat and Email Administrator’s Guide to Reports Console

Three chats where the agent clicks the Complete button (from the Current or My Monitor folders) even while the customer is still in the session.
Five chats where the customer clicks the Exit button and the agent completes the activity (from the 'Current' or 'My Monitor' folders) at a later point of time.
% Closed By Agent = 100 * (3 + 5) / 10 = 80%
# Within SL: Chats serviced within the service level time configured for the report. Out of all the completed chats that were created within the specified time frame, the number of chats that were serviced within the service level cutoff time. For more details, see “A Note About Service Level and Response Time” on page 59.
For example, while configuring the report you set the service level as two minutes. Any chat, which waits in the queue for less than two minutes before getting serviced, is counted in this column.
% Within SL: The value in this field can vary based on the way you configure your report criteria. While calculating the percentage within service level, you can either include or exclude the abandoned chats. For more details, see “A Note About Service Level and Response Time” on page 59.
% within SL = 100 * Chats serviced within SL / Total number of chats
If you exclude abandoned chats from the service level computation:
% within SL: The percentage of chats serviced within the service level out of all serviced and completed chats that were created within the specified time frame.
If you include abandoned chats in the service level computation:
% within SL: The percentage of chats serviced within the service level out of all incoming chats that were created within the specified time frame.
For example: there are a total of 20 incoming chats. Out of those 20 chats, 10 are abandoned and 10 are serviced. Out of the 10 serviced chats, five are serviced within the service level. And, out of the 10 abandoned chats, eight are abandoned beyond the service level.
The % within service level is calculated as:
Include abandoned chats in service level: % within SL = (5/20) * 100
Exclude abandoned chats in service level: % within SL = (5/10) * 100
Level 1 of a sample Chat Volume by Referrer URL report
Chat Volume by Referrer URL 67

Level 2Level 2 displays the information for each referrer split into the time segment selected while running the report. To drill down to this level, click a referrer URL in Level 1.
Level 2 displays the following information:
Interval Start: The starting point of the desired interval for the reporting period. Intervals of the reporting period can be hours, days, weeks, etc.
For information on the measurements of the other columns, see Level 1.
Level 2 of a sample Chat Volume by Referrer URL report
Level 3Level 3 displays the list of chat activities handled in a selected time interval. To drill down to this level, click an interval start date in Level 2.
Level 3 displays the following information:
Activity ID: Activity ID of the chat.
Activity Start: Date and time when activity was created.
Activity End: Date and time when activity was completed.
Wait Time: Time between activity creation and start of service i.e. when activity status changed to Assigned - In progress the first time.
Wait Time = Service start time - Activity creation time
Chat Duration: Duration of the chat. It includes the wait time, actual time that an agent spent chatting with the customer, and the wrap-up time after the customer left the session.
Chat Duration = Activity completion time - Activity creation time
Abandoned/Serviced: This column displays information on whether or not the chat was serviced within its SL, or if it was abandoned. The possible values for this column are:
Serviced within SL: The activity was serviced and completed within the service level established for that queue.
Serviced beyond SL: The activity was serviced and completed after the service level established for that queue.
Abandoned: The activity is considered as abandoned when a customer leaves a chat session before an agent joins the session.
68 Enterprise Chat and Email Administrator’s Guide to Reports Console

Completed By: If the agent completes the chat, this column shows the user name of the agent. If the agent clicks the Leave button and leaves the chat before the customer exits from the session, or if the chat gets abandoned, this column shows the value System.
Level 3 of a sample Chat Volume by Referrer URL report
Level 4Level 4 displays the details of the selected chat activity. To drill down to this level, click an activity ID in Level 3.
Level 4 displays the following information:
Chat Transcript:
Time Stamp: Time at which the chat message was sent.
Chat By: Name of the agent or the customer who sent the message. For a system generated message, the column shows the value System. For example, the message, A representative will be with you in about a minute, is a system generated message.
Message: Content of the message sent by the customer or agent.
Level 4 of a sample Chat Volume by Referrer URL report
Notes:
Time Stamp: Date and time when note was created.
Created By: User name of the user who created the note.
Notes: Content of the note.
General Attributes:
Chat Volume by Referrer URL 69
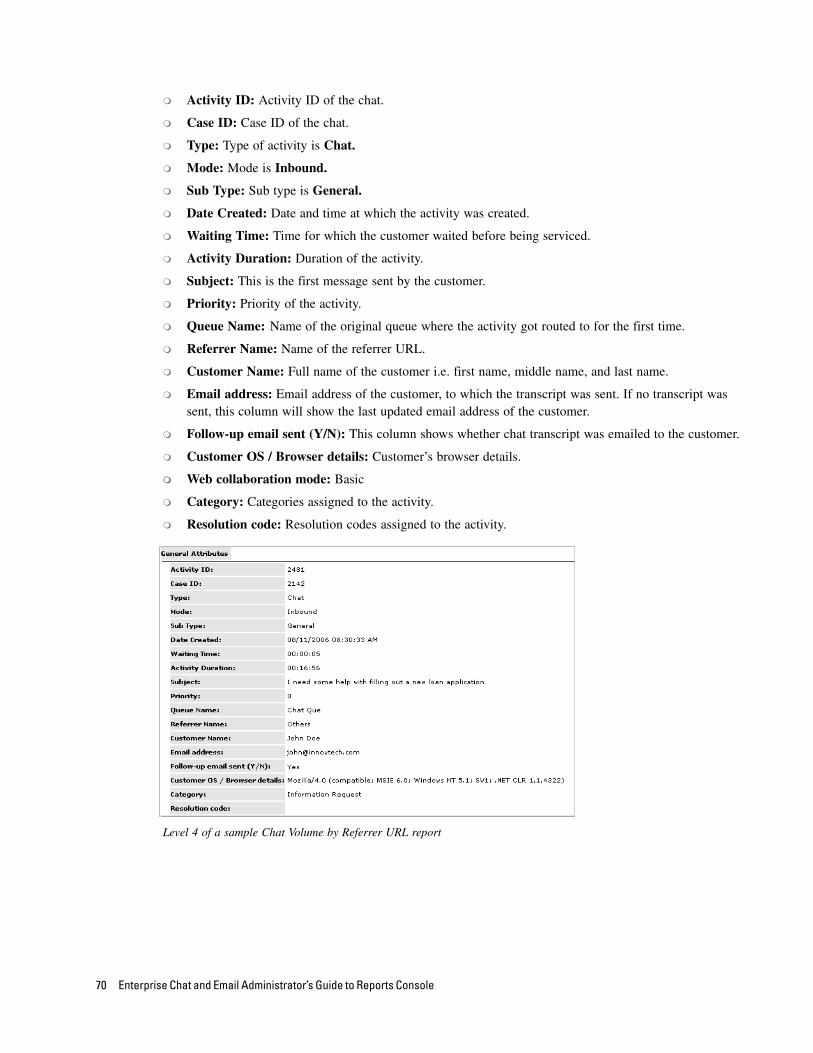
Activity ID: Activity ID of the chat.
Case ID: Case ID of the chat.
Type: Type of activity is Chat.
Mode: Mode is Inbound.
Sub Type: Sub type is General.
Date Created: Date and time at which the activity was created.
Waiting Time: Time for which the customer waited before being serviced.
Activity Duration: Duration of the activity.
Subject: This is the first message sent by the customer.
Priority: Priority of the activity.
Queue Name: Name of the original queue where the activity got routed to for the first time.
Referrer Name: Name of the referrer URL.
Customer Name: Full name of the customer i.e. first name, middle name, and last name.
Email address: Email address of the customer, to which the transcript was sent. If no transcript was sent, this column will show the last updated email address of the customer.
Follow-up email sent (Y/N): This column shows whether chat transcript was emailed to the customer.
Customer OS / Browser details: Customer’s browser details.
Web collaboration mode: Basic
Category: Categories assigned to the activity.
Resolution code: Resolution codes assigned to the activity.
Level 4 of a sample Chat Volume by Referrer URL report
70 Enterprise Chat and Email Administrator’s Guide to Reports Console

Email Snapshot by Agent Report
This report measures the number of emails that are open, not completed, when the snapshot is taken. Information is displayed for each agent for a maximum of 12 units. Each unit is either a day, a week, or a month.
Run this report at different times of the day to see trends in email volume over the course of a typical work day.
Report OutputThis section describes the details for each column in the various levels of the report along with any formulas that are used to calculate values. Unless specified otherwise, only actions that occur within the reporting period are included in the output.
This report has one level.
Level 1It displays the following information:
User: The name of the agent within the selected departments.
Open Emails: Email activities that are not in the Completed status when the snapshot is taken, separated by the selected units (day, week, month).
Sample email snapshot by agent report
Email Snapshot by Queue Report
This report measures the number of open and unassigned email activities when the snapshot is taken. Information is displayed for each queue for a maximum of 12 units. Each unit is either a day, a week, or a month. The portion of these emails that have not yet been assigned to agents is also shown.
Run this report at different times of the day to see trends in email volume over the course of a typical work day.
Email Snapshot by Agent Report 71

Report OutputThis section describes the details for each column in the various levels of the report along with any formulas that are used to calculate values. Unless specified otherwise, only actions that occur within the reporting period are included in the output.
This report has one level.
Level 1It displays the following information:
Queue: The queue in which the open emails are located.
Open and Unassigned Emails:
O (Open): An email activity that is not in the Completed status.
U (Unassigned): An email that is in the queue, but not assigned to a user.
Sample email snapshot by queue report
Email Volume by Alias Report
This report is used by supervisors and resource schedulers to get pertinent information on email arrival rate, email handling rate, and percentage of emails meeting service levels. Resource planners can move resources between queues at different times to meet the service levels required from the information.
Report OutputThis section describes the details for each column in the various levels of the report along with any formulas that are used to calculate values. Unless specified otherwise, only actions that occur within the reporting period are included in the output.
This report has two levels.
72 Enterprise Chat and Email Administrator’s Guide to Reports Console

Level 1: Displays the information for the complete reporting period for the aliases selected for the report. (page 73)
Level 2: Displays the information for each alias split into the time segment selected while running the report. (page 75)
Level 1Level 1 displays the following information.
Alias: Name of the alias.
Email:
At Start: Number of open email activities for the alias, at the start of the reporting period.
Incoming Mails:
New/No Case: Number of incoming email activities for the alias, which resulted in the creation of a new case or no case.
Existing Case: Number of incoming email activities for the alias, which were associated with an existing case.
Delivery Excep. Mails: Number of undelivered email activities for the alias. An undeliverable mail is one that is sent out by the dispatcher, but is bounced back by the exchange server since it could not be delivered for various reasons. As a result, the email may become associated with a new case, existing case, or no case.
Auto Ack.: Number of auto-acknowledgements sent from the alias.
Auto Reply: Number of auto-replies sent from the alias.
Manual Reply: Number of manual replies sent from the alias. This column counts each email in the group reply individually. For example, if you send a group reply for five emails, the count of this column will go up by five. Forwarded or redirected emails are not counted in this column.
Response: Number of responses sent from the alias. Response is the first manual email reply to an incoming email.
Compose: Number of composed emails sent out from the alias. An email can be composed in the Agent Console and sent directly to an email address through the alias.
Completed: Number of completed email activities for the alias. This column counts the incoming emails, emails created from the create object node, and composed emails.
Assigned: Number of emails assigned to an agent, but not completed at the end of the reporting time period. This column counts the incoming emails, emails created from the create object node, and composed emails.
Unassigned: Number of emails not assigned to any agent at the end of the reporting time period. This column counts the incoming emails, emails from create object node, and composed emails.
Open: Number of open emails at the end of the reporting time period. This column counts the incoming emails, emails created from the create object node, and composed emails.
Percentage Emails:
Responded Within SL: The percentage of responses that met the specified service level out of all the email responses from the alias. For more details, see “A Note About Service Level and Response Time” on page 59.
Email Volume by Alias Report 73
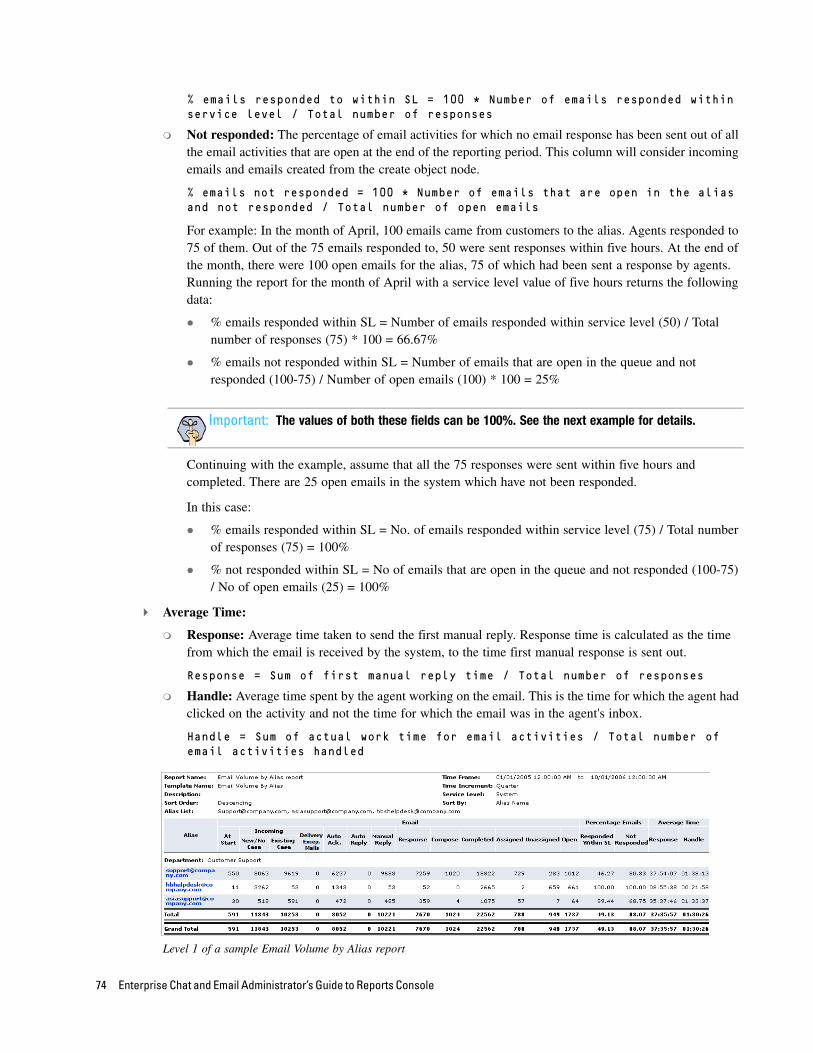
% emails responded to within SL = 100 * Number of emails responded within service level / Total number of responses
Not responded: The percentage of email activities for which no email response has been sent out of all the email activities that are open at the end of the reporting period. This column will consider incoming emails and emails created from the create object node.
% emails not responded = 100 * Number of emails that are open in the alias and not responded / Total number of open emails
For example: In the month of April, 100 emails came from customers to the alias. Agents responded to 75 of them. Out of the 75 emails responded to, 50 were sent responses within five hours. At the end of the month, there were 100 open emails for the alias, 75 of which had been sent a response by agents. Running the report for the month of April with a service level value of five hours returns the following data:
% emails responded within SL = Number of emails responded within service level (50) / Total number of responses (75) * 100 = 66.67%
% emails not responded within SL = Number of emails that are open in the queue and not responded (100-75) / Number of open emails (100) * 100 = 25%
Continuing with the example, assume that all the 75 responses were sent within five hours and completed. There are 25 open emails in the system which have not been responded.
In this case:
% emails responded within SL = No. of emails responded within service level (75) / Total number of responses (75) = 100%
% not responded within SL = No of emails that are open in the queue and not responded (100-75) / No of open emails (25) = 100%
Average Time:
Response: Average time taken to send the first manual reply. Response time is calculated as the time from which the email is received by the system, to the time first manual response is sent out.
Response = Sum of first manual reply time / Total number of responses
Handle: Average time spent by the agent working on the email. This is the time for which the agent had clicked on the activity and not the time for which the email was in the agent's inbox.
Handle = Sum of actual work time for email activities / Total number of email activities handled
Level 1 of a sample Email Volume by Alias report
Important: The values of both these fields can be 100%. See the next example for details.
74 Enterprise Chat and Email Administrator’s Guide to Reports Console

Level 2Level 2 displays the information for each alias split into the time segment selected while running the report. To drill down to this level, click an alias in Level 1.
Interval Start: The starting point of the desired interval for the reporting period. Intervals of the reporting period can be hours, days, weeks, etc.
For information on the measurements of the other columns, see Level 1.
Level 2 of a sample Email Volume by Alias report
Email Volume by Queue Report
This report provides information about the number of emails that are received for each queue and the rate at which they are handled by the system and agents. It also shows the percentage of emails that were processed within the selected service level, as well as the average response and handle times.
Report OutputThis section describes the details for each column in the various levels of the report along with any formulas that are used to calculate values. Unless specified otherwise, only actions that occur within the reporting period are included in the output.
This report has two levels.
Level 1: View data for all selected queues for the reporting time period. (page 75)
Level 2: View data for a selected queue, broken down by time interval. (page 77)
Level 1Here are the details for each column in the report along with any formulas that are used to calculate values. Unless specified otherwise, only actions that occur within the reporting period are included in the output.
Queue: Name of the queue.
Incoming - New/No Case: An email that has come into the queue and is associated with a new case or not associated with any case.
Incoming - Existing Case: An email that has come into the queue and is associated with an existing case.
Email Volume by Queue Report 75

Incoming Delivery Exception Mails: An undelivered email that has come into the queue as a result of a delivery exception. An undeliverable mail is the one that gets sent out by the dispatcher but is bounced back by the exchange server since it could not be delivered for various reasons. The email might get associated with a new case, existing case, or no case.
Transfer In: An email that has been transferred into this queue from other queues and departments. The transfer may have been performed either by users or by workflows.
For an activity to be considered as transferred in, the destination queue should be different from the source queue. Transfer in count is incremented when a user transfers an activity from Queue 1 to Queue 2 manually or by alarm workflow rules. The count in this column is not incremented when a user transfers assigned activity back to the original source queue.
For example, if the agent pulls an activity from Queue 1 and transfers it back to Queue 1, then it is not counted in this column.
Transfer Out: An email that has been transferred from this queue into another queue or department. The transfer may have been performed either by users or by workflows. For an activity to be considered as transferred out, the destination queue should be different from the source queue.
Auto Reply: An email sent to the customer automatically by a workflow as the first response to an incoming email from the customer. This does not include auto-acknowledgements.
Manual Reply: An email sent to the customer by a user from the Agent Console as a response to an incoming email from the customer. Note that this does not include emails that were forwarded or redirected from the Agent Console.
First Manual Reply: The initial message sent by an agent in response to a customer’s query. All future responses by the agent or customer in relation to this mail thread are not counted in this metric.
Completed: An email that has been completed either by a user or by a workflow. Note that an email that has been composed, saved, and transferred into this queue is also counted in this calculation.
Percentage First Manual Replies within SL: Out of all the first manual replies, the percentage of first manual replies that were sent within the specified service level.
% First Manual Replies within SL = 100 * No. of first manual replies within Service level / Total number of first manual replies
Average First Manual Reply Time: The average time taken for the first manual reply to be sent since the activity first came into the system.
First manual reply time = Time when first manual reply is sent out by dispatcher – Time when activity is created
Average First Manual Reply Time = Sum of first manual reply time / Total number
of first manual replies
Average Handle Time: The average time taken by the agent to handle an activity in the reporting time period. This is not the time for which the activity stays in the agents inbox, but the time for which the agent worked on the activity.
For example: An activity stays in the agent’s inbox for 15 minutes and the time for which the agent has clicked on the activity is five minutes. The handle time for the activity is five minutes. This time is calculated in seconds.
Average Handle Time = Sum of actual handle time for email activities / Total number of email activities handled
76 Enterprise Chat and Email Administrator’s Guide to Reports Console
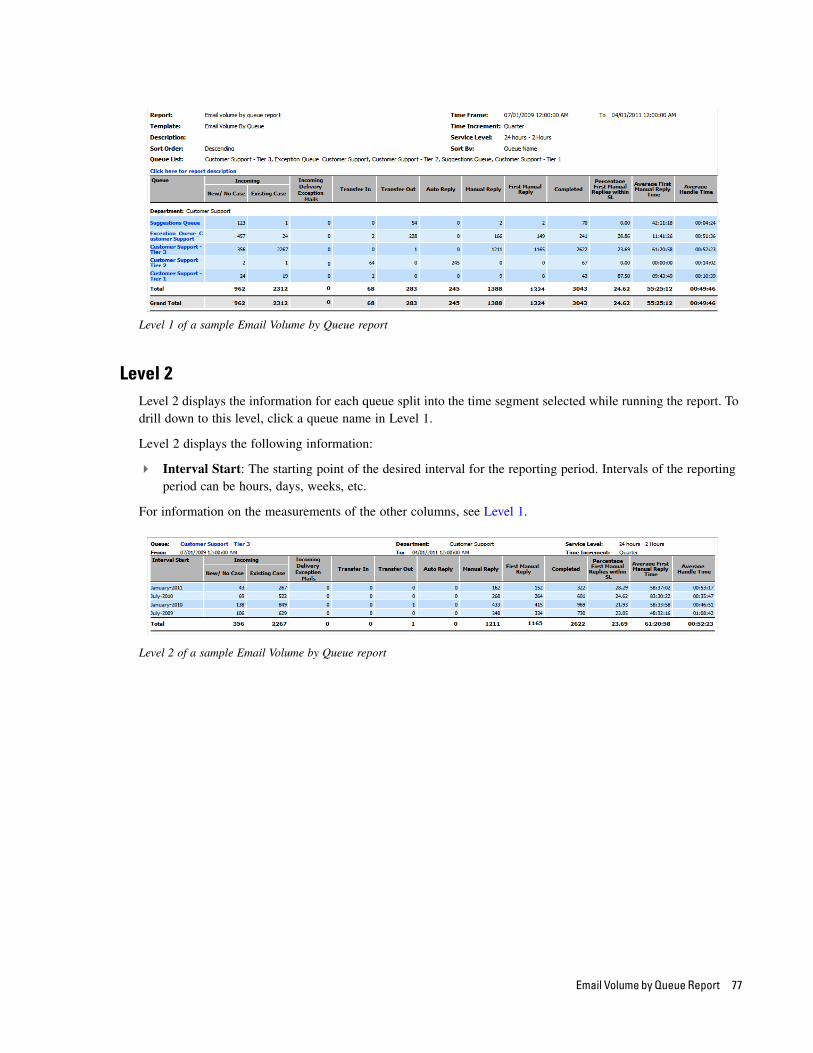
Level 1 of a sample Email Volume by Queue report
Level 2Level 2 displays the information for each queue split into the time segment selected while running the report. To drill down to this level, click a queue name in Level 1.
Level 2 displays the following information:
Interval Start: The starting point of the desired interval for the reporting period. Intervals of the reporting period can be hours, days, weeks, etc.
For information on the measurements of the other columns, see Level 1.
Level 2 of a sample Email Volume by Queue report
Email Volume by Queue Report 77