engineering social sciences sdm and engineering … · sdm and engineering systems grappling with...
TRANSCRIPT

SDM and Engineering SystemsSDM and Engineering Systems
Grappling with Intertwined Technological and Grappling with Intertwined Technological and Social ComplexitySocial Complexity
Prof. Olivier L. de WeckAssociate Head
MIT Engineering Systems [email protected]
October 22, 2009
1
EngineeringManagement
Social Sciences
System Design and Management and Engineering Systems: Grappling with Intertwined Technological and Social ComplexityProf. Olivier L. de WeckAssociate Director of the MIT Engineering Systems Division (ESD)In this opening talk I will discuss and list some of the most pressing societal challenges we face today and argue that their solution requires both systems thinking as well as new methods and tools for dealing with intertwined technological and social complexity. These challenges include the provisioning of clean energy and mitigation of climate change, the revision of our health care system to maximize value as well as the renewal of our critical infrastructures including more efficient transportation and global logistics. All of these domains are in need of technological innovation, and such innovation is indeed happening. I will show specific examples of new technologies that have the potential for substantial impact such as on‐board hydrogen fuel reformers and real time RFID monitoring and management of systems via the internet. However, by themselves such technologies cannot solve the challenges we face. Only once they are fully embedded into their host systems do they gain the potential to deliver value. This requires a broader perspective including issues of technology infusion and engineering change, costs and benefits, social acceptance and incentives as well as the role of government regulations and standards. Thus, the higher the level of abstraction, the more intertwined the technological, social and managerial dimensions of the problem will be. This is the overall challenge we face today and the main theme of this year's conference. I will close with a discussion of the role of System Design and Management in the context of Engineering Systems. Engineering Systems are the complex networks of artifacts and people that fulfill some of the most important functions in society today and we are striving towards better ways of modeling, analyzing, designing and management these systems in the future 1

Recent News Items
2
Power Outages
ServersFarms
IntelligentTransportation
GPSNavigation
UrbanCongestion
Texting while driving
AutomobileAccidents
Plug In Hybrids
Energy-Box
BetterPlace
Technology
NetworksHumans
Regulations
EconomicsEmergent BehaviorsNY Times blog
Wall Street Journal
WiredCNN
Lets’s get started with some items that you may have heard in the news before. It seems that for every positive there is a negative or at least an unintended consequence. What are the common elements in these various systems? People, technologies, networks and regulations. These systems exhibit emergent behaviors, i.e. behavior that is not obvious based on a linear addition of individual elements. Some of these behaviors add value and help fulfill societal needs, others destroy value.
2

19th Century
Timeline
20th Century
21st Century
22nd Century ?
Industrial Revolution
“Great Inventions”
Automobile(1880)
Telephone(1876)
Lightbulb(1870)
Other “spines”
Aircraft (1903)AirportsAir Transport
Vaccines (1796)HospitalsHealth CareSystem
Etc…Highways(1950)
PSTN(1880)
ElectricalPowerGrid
EngineeringSystems
GPS, SMS
Plug‐Ins, Outages …
Servers, E‐box
World Population
1 Billion
18th Century0.7 Billion
2.5 Billion
6.5 Billion
10+ Billion?
Transportation(2000+)
Communications(2000+) Energy
(2000+)Air
Internet
Rail
Satellites
Nuclear
Solar, Wind
How did we get here? We are just starting a book on Engineering Systems sponsored by the MIT Press and this is the main storyline. The story starts in the 18th century with the industrial revolution and the 19th century with the “great inventions” like the car, the telephone and the incandescent lightbulb. Over the course of the 20thcentury these led to systems that had a very specific purpose and started to scale in size as the world population grew from below 1 billion to over 5 billion. At the end of the 20th century we had more choices, so we started talking about the transportation system, communications infrastructure, energy generation and distribution etc… A new phenomenon in the 21st century is that these “single purpose” systems started interacting with each other in new ways. Communications supports better transportation, transportation requires energy, energy can be better channeled thanks to real time communications. These interactions are not only value added but are also causing unexpected vulnerabilities and interactions and depends on our human behaviors and social norms. The regulatory frameworks that were stable and worked well for the single purpose systems of the 20th century are now largely obsolete. How do we deal with privacy and the internet? Vulnerability to targeted attack of critical nodes? Dynamic pricing of electricity? This is the brave new world of ENGINEERING SYSTEMS. The vertical lines are what we call the three spines. Of course there are other spines like the health care system where one could argue that vaccination was one of the key inventions (along with surgical techniques), leading to infrastructure like hospitals. We will talk about Air Transportation in just a minute. The challenge now is that the classical research disciplines like engineering, economics, social sciences in isolation are ill‐equipped to help us model, understand, manage and design these Engineering Systems better. So what is the formal definition of Engineering Systems?
3

What is/are Engineering Systems?
A Class of SystemsEngineering systems are
characterized by a high degree of technical and social complexity and they aim at fulfilling important functions in society.
Emerging Field of ResearchEngineering systems research
is problem‐oriented, developing and employing multiple methodologies, and balances quantitative and qualitative arguments.
4
Domains
Extended EnterprisesCritical InfrastructuresEnergy and SustainabilityHealth Care Delivery
Approaches
Humans and TechnologyUncertainty and DynamicsDesign and ImplementationNetworks and FlowsPolicy and Standards
We embrace a dual definition of “Engineering Systems” as both a class of complex systems that are characterized by a high degree of technical and social complexity as well as an emerging field of research. In 2003 the NAE released a book entitled “A Century of Innovation: Twenty Engineering Achievements That Transformed Our Lives”. Many of these 20th century systems including the aircraft, automobile, health technologies, the internet and so forth deliver essential functions to society. However it is not only the technology but also the social elements and processes that are integral to value delivery. In addition to technological complexity there is intertwined social complexity where humans act as beneficiaries, operators, designers and builders of these systems. While there are many such systems we in ESD have chosen to focus on the 4 types of domains systems, listed below. The dual definition of Engineering Systems also refers to an emerging field of research where problems that cannot be solved by considering either the technology alone or the social aspects alone are tackled. In terms of general approaches (collections of related methods) we are employing a number of them including study of the human/technology interface, the management of uncertainty and dynamics of systems, their design and implementation across the lifecycle, modeling systems as interacting networks with multiple types of flows as well as bringing in policy and standards into the design space. I will use the “arrow symbol” to highlight methods that we will encounter later on.
4
Flights / Aircraft flows
Latent Demand
Infrastructure
Passenger Flows
Spatial Decomposition
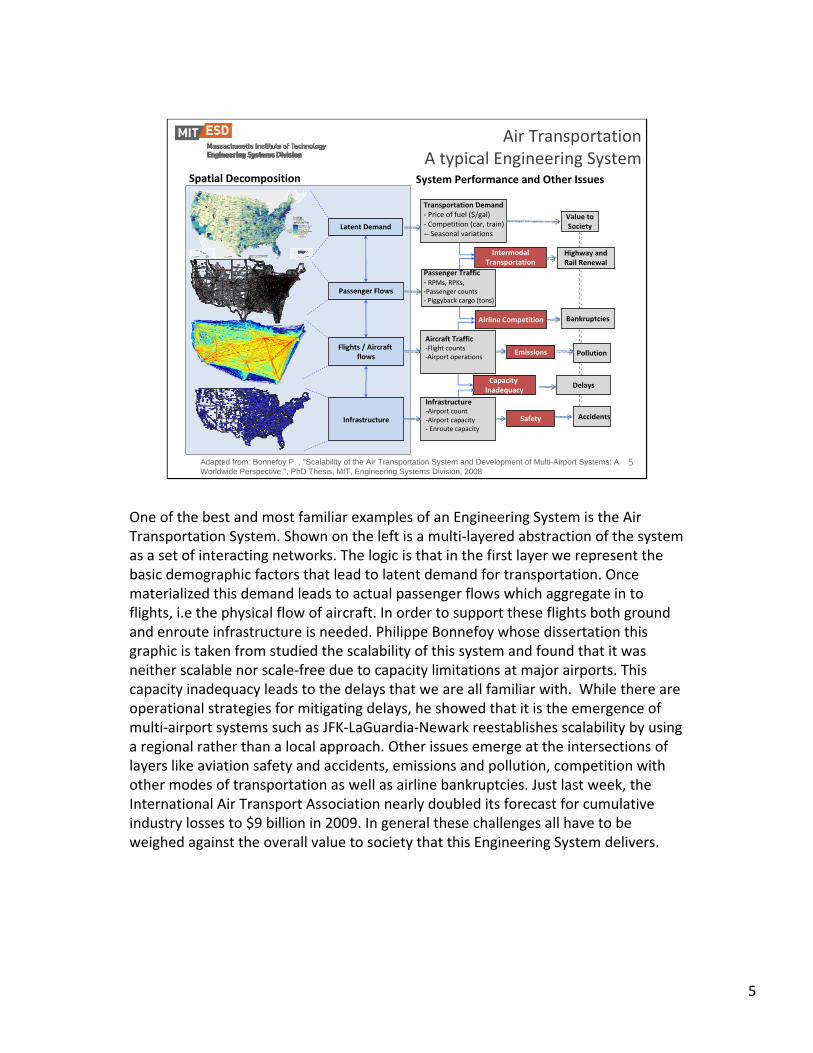
Air Transportation A typical Engineering System
Adapted from: Bonnefoy P. , "Scalability of the Air Transportation System and Development of Multi-Airport Systems: A Worldwide Perspective ", PhD Thesis, MIT, Engineering Systems Division, 2008
System Performance and Other Issues
5
Capacity Inadequacy
Passenger Traffic‐ RPMs, RPKs, ‐Passenger counts‐ Piggyback cargo (tons)
Aircraft Traffic‐Flight counts‐Airport operations
Infrastructure‐Airport count‐Airport capacity‐ Enroute capacity
IntermodalTransportation
Transportation Demand‐ Price of fuel ($/gal)‐ Competition (car, train)‐‐ Seasonal variations
Airline Competition
Emissions
Safety Accidents
Value toSociety
Highway andRail Renewal
Delays
Pollution
Bankruptcies
One of the best and most familiar examples of an Engineering System is the Air Transportation System. Shown on the left is a multi‐layered abstraction of the system as a set of interacting networks. The logic is that in the first layer we represent the basic demographic factors that lead to latent demand for transportation. Once materialized this demand leads to actual passenger flows which aggregate in to flights, i.e the physical flow of aircraft. In order to support these flights both ground and enroute infrastructure is needed. Philippe Bonnefoy whose dissertation this graphic is taken from studied the scalability of this system and found that it was neither scalable nor scale‐free due to capacity limitations at major airports. This capacity inadequacy leads to the delays that we are all familiar with. While there are operational strategies for mitigating delays, he showed that it is the emergence of multi‐airport systems such as JFK‐LaGuardia‐Newark reestablishes scalability by using a regional rather than a local approach. Other issues emerge at the intersections of layers like aviation safety and accidents, emissions and pollution, competition with other modes of transportation as well as airline bankruptcies. Just last week, the International Air Transport Association nearly doubled its forecast for cumulative industry losses to $9 billion in 2009. In general these challenges all have to be weighed against the overall value to society that this Engineering System delivers.
5

Engineering Systems Classification
Magee C. and de Weck O. L., “Complex System Classification”, Fourteenth Annual International Symposium of the InternationalCouncil on Systems Engineering (INCOSE), Toulouse, France, June 20-24, 2004 – best paper award
Functional Classification
6
OperandProcess
Matter Energy Information Money HumansAnimals
TransformProcess
AgriculturalProduction
Wind PowerGeneration
Mass GeneralHospital
TransportDistribute
Water Management
Smart Electric Grids
Scientific Spacecraft
Air TransportSystem
StoreHouse
BatteriesStorage Systems
ExchangeTrade
Electronic Medical Records
ControlRegulate
Climate Change Policy
U.S. FederalReserve
Senior DriverCertification
adapted from Table 10
In 2004 Chris Magee and I wrote an INCOSE paper that attempted to find a useful taxonomy, a classification scheme, for Engineering Systems. In this search we read a large number of papers on complex systems and their attributes going back as far as the so called “General Systems Theory” of the 1950s. We also polled faculty colleagues to send us specific example of systems they considered to be “Engineering Systems”. All in all we received close to 100 suggestions and we subsequently attempted to classify them using a number of attributes such as those shown here. The most useful, we thought, was to classify Engineering Systems in terms of their functional type. This can be expanded as a matrix by showing both the main process as well as the main operand upon which the system operates. For example in red is the Air Transport system we already discussed. Its function is to transport or distribute both cargo (matter) as well as humans and occasionally animals. Some other systems that will be discussed here are shown in bold. Traditional engineering artifacts cover mainly the gray portion of this matrix, i.e. the transformation, transportation of storage of matter, information and energy. There is one point were we did not achieve full closure and this pertains to the question as to whether monetary value and living organisms ought to be broken out separately as is shown here. We also found that the broader the system boundary of an Engineering System was defined the more cells in the matrix it would encompass.
6

Sample Engineering Systems Problems, Methods and Results
1 Quantifying Rates of Technological Progress2 Designing for Technology Infusion and Change3 Change Propagation Analysis4 Assessing Driving Performance of Seniors5 Predicting Impact of Policy on Climate Change
more technicalcomplexity
more socialcomplexity
7
12
34
5
industry
technologyproductsvehicles
infrastructuresnature
policygovernment
people
I will now be discussing examples of Engineering Systems research problems, methods and results in a hopefully somewhat coherent context. I used three criteria for selection of the problems and methods that will be highlighted:
1.Representative of Engineering Systems domains and approaches2.Spanning the spectrum from more technological to more social complexity3.Mainly work that has been published and has been recognized as being of value
The graphic shows 5 research problems and how they relate to each other. The first is the question of how to quantify technological progress, i.e. the rate of innovation for some of the functional categories we discussed before. The second is a method for analyzing the infusion of new technologies into parent systems and products under uncertainty. The third vignette discusses new ways for modeling safety as a property that involves both technology and human organizations. In 4 we will look at the technology/human interface and the way in which driving performance may be affected by age and cognitive loading. Finally 5 is perhaps the problem that is largest in scope and has the most social complexity, i.e. the modeling of policy impact on climate change. Note that people are at the center of all these problems either as innovators, designers, operators or decision makers.
7

1 ‐ Quantifying Technological Progress
8
ProblemQuantifying technological progress over long time periods (100 years+) independently of specific artifacts. Identifying fundamental limits.
ResultApproach to study of technological change by examining the time dependence of Functional Performance Metrics (FPM). Interlinked “S”-curves.
ImpactConfirmation of continuous exponential progress for both information and energy technologies but at different rates. Received 2006 Elsevier Prize.
Storing information [Mbits/cm3] – 20.8+/-1.6% p.a. Storing Energy [Wh/kg] – 3.7+/-0.4% p.a.
Functional ClassificationEmpirical Data CollectionStatistical Analysis
H. Koh, C. Magee, “A functional approach for studying technological progress: Extension to energy technology”, Technological Forecasting & Social Change, 75 (2008) 735-758
Chris Magee and Heebyung Koh developed a functional approach to quantifying technological process over a long time period, essentially since the beginning industrial revolution. They first gathered a large database for each of the three functions “storing, transporting and transforming” and then defined so called Functional Performance Metrics (FPMs) that would capture engineering tradeoffs and constraints. The FPMs are typically expressed as ratios of performance over mass, volume or cost. Shown here is a comparison of the evolution of information storage in units of Mbits/cm^3 and energy storage in units of Wh/kg over the last 120 years. They found that technological progress was essentially continuous, however that the leading technological artifact or concept could switch and that saturation could occur for particular concepts. They stressed the importance of using a semi‐logarithmic representation rather than a linear one. They also quantified the rate of progress and showed that information technologies have been progressing at a much higher rate – about 20% per year – compared to energy‐related technologies which only progress at ~4% per year within a 95% confidence interval. They hypothesize that this is due to the inherent loss mechanisms and efficiency constraints of energy systems which information systems are not subject to (Shannon’s law). It is interesting to note that capacitors are slated to overtake chemical batteries and flywheels as a means of energy storage by 2040 if current trends hold. The methods used in this research are essentially functional classification, empirical data collection and statistical analysis.
8

9
9
Smaling R., de Weck O., “Assessing Risks and Opportunities of Technology Infusion in System Design”, Systems Engineering, 10(1), 1‐25, Spring 2007
Design Structure Matrix (DSM)Multi-objective OptimizationNPV AnalysisScenario Planning
Problem Quantify risks and opportunities of infusing new technologies into existing baseline or legacy systems and products
ResultA framework for quantifying the potential benefits of a set of technology infusion concepts and weighing those against their technology invasiveness with respect to a host system using ΔDSM’s and fuzzy Pareto frontiers
ImpactApplied to Arvin Meritor’s hydrogen-enhanced internal combustion engine (Plasmatron) product, currently being implemented at Xerox (iGen4 production printing system) and others, Best paper award 2007 in Systems Engineering
2 Designing for Technology Infusion
Most technologies don’t have value in isolation, but only deliver benefits once they are embedded in a host system. This research strives to establish a rigorous quantifiable relationship between technology development, technology infusion and the societal impact of technology. This work was motivated by the development of a plasma fuel reformer that takes in air, fuel (usually high octane gasoline) and electrical energy to create a hydrogen rich gas. This hydrogen enriched gas can then be injected into the inlet manifold of an internal combustion engine in order to act as an octane enhancer. This allows to run the engine lean of stochiometry, leading to better fuel economy and – hopefully – lower NOx emissions. We found that a boosted concept using a nominal compression ratio, air dilution and down-sized engine was superior across a wide range of technological, economic and regulatory regimes. The technology infusion methodology developed here quantifies both the invasiveness of the technology in the context of the host system using a so called Delta-Design Structure Matrix (DSM), as well as the potential benefits. This approach has subsequently been applied to other domains such as Xerox’ new family of digital printing systems. The main methods that apply here are DSM, Multi-Objective Optimization, Discounted Cash-flow analysis and scenario planning.

10
3‐ Change Propagation Analysis
12
34
56
7
8
910
11
12
13
14
15
16
17
18
19
20
21
22
23
24
25
26 27
28
29
30
31
3233
34
35
36
37
38
39
40
41
42
43
44
45
46
Affected by 87CR (26%)
Unaffected (74%)Work sponsored by Raytheon Integrated Defense Systems
Research with Monica Giffin, Mike Pasqual and Gergana BounovaSystem Network
Here is a Netdraw/Matlab rendering of the system network. The direction of each edges is not indicated.
It is a complex, hub‐and‐spoke‐like network.
The nodes are numbered as in the dataset. Only 26% of the areas (shown in pink) were involved in the 87 CR dataset.

11
1
2
3
45
67
8
9
10
11
1213
14
15
16
1718
19
20
2122 2324
25
2627
28
29
30
31
32
33
34
35
36
37
38
394041
42
43
4445
46
47
48
49
50
51
52
53
5455
56
57
58
59 60
61
62
63
64
65
66
67
68
69
70
71
72
7374
7576 77
78
79
80
81
8283
8485
86
87
Process Network Drawing
Pending (5%)
Implemented (61%)
Rejected (24%)
Unknown (10%)
Here is a Netdraw/Matlab rendering of the process network. The direction of each edges is not indicated.
It is a fairly linearly‐shaped network.
The nodes are numbered in order of their submission. They are also color‐coded to representing the status of each node (CR). Like‐nodes seem to be connected to each other

12
-1
5
8
13
15
17
19
21
22
30
4143
73
79
87
106
121
122
140
168
176
177
178183
195
204
222
234
244
248
251
260
261
264
275276
294
296
299
301
302
309
310
311
318
321
343
376
421
2002
Social Network Drawing
Submitter (67%)
Assignee Only (33%)
Quality engineer (‐1)
Engineer (<1000)Admins (1000s)
Companies (2000s)
Number Legend
Here is a Netdraw/Matlab rendering of the social network. The direction of each edges is not indicated.
The nodes are numbered with the following scheme. (‐1) is a quality engineer. Numbers <1000 are engineers. Numbers in the 1000s are administrators. Numbers in the 2000s are companies. The cyan nodes represent those people who submitted at least one CR. The yellow node represent those people who are only associated with CRs as assignees.
The disconnected cyan nodes (321, 309, 30, etc) are submitters who proceeded to implement their own CR (with no one else involved); hence these nodes have no neighbors. The one disconnected yellow node (421) is an assignee to a CR whose submitter was unknown.

13
Three‐Layered Network
People
Process
Product
Pending
Implemented
Rejected
Unknown
Submitter
Assignee Only
Affected by 87CR
Unaffected
Here is Netdraw/Matlab rendering of the three‐layered network. The color coding scheme for the node is the same as before. Intra‐layer edges are light gray, while inter‐layer edges are black.

Drivers of complexity
• Number and types of components• Interfaces between components
– Physical interfaces– Mass, Energy and Information Flows
• System architecture– Relative arrangement of components defines system architecture (loops, buses, modules ..)
– Drives system integration effort• Multi‐Level Network Analysis of Complexity (3Ps)
– Product/Physical System– Processes/Management– People/Organization
EngineeringManagementSocial Sciences

4‐ Assessing Driving Performance of Seniors
15
Bryan Reimer* Ph.D., Bruce Mehler M.A., Joseph F. Coughlin Ph.D., Ying Wang B.S., Lisa A. D’Ambrosio Ph.D., et al., “A Comparison of the Effect of a Low to Moderately Demanding Cognitive Task on Simulated Driving Performance and Heart Rate in Middle Aged and Young Adult Drivers”, IEEE International Conference on Cyberworlds, 2008
Problem Quantify the driving Performance of individuals under different cognitive task loading and demographic factors
ResultA model for driver performance under off-nominal conditions including impairment by secondary tasks. Demonstrated that Young (19-23) and Older (51-66) drivers performed equally well but use different adaptation.
ImpactEstablish scientific connection between personal mobility and ageing. Impact on population through Hartford “campaign” to educate families and older drivers
SimulationHuman ExperimentsSurveys
N=37
AgeLab
The AgeLab – under the leadership of Dr. Joe Coughlin ‐ studies who humans age and how this process affects their health, wellbeing and also their personal mobility. In this research a number of individuals are brought in and are asked to perform a driving simulation in a fixed simulator we lovingly call “Miss Daisy”. The problem that is addressed here is that humans do not perform as well when they are distracted by secondary tasks – such as making telephone calls – that will add to their cognitive load and that this may be influenced by their age and gender among other factors. The results obtained here for a sample of 37 individuals in two groups (Younger 19‐23 years, Older 51‐66 years). Test subjects were asked to place a call to a doctorsoffice using a hands free phone system during P2. It was found that both groups performed the cognitive task equally well but that they managed the extra cognitive load in quite different ways. While the older drivers maintained a relatively steady pace throughout, they drove slower and made longer pauses at stop‐lights. Their heart‐rate remained steady throughout. Younger drivers on the other hand seemed to drive faster overall and needed to modulate their behavior more strongly when cognitive task load increased as reflected both by their longer pauses and higher heart rate during P2. Work is ongoing in also testing the older population >70 where driving performance may be a bigger issue. This research has also had an impact on the broader conversation amongst generations as exemplified by the recent campaign funded by the Hartford insurance company. The methods used here include simulation, human experiments and social science methods like controlled surveys.
15

5‐ Impact of Policy on Climate Change
16
Problem Modeling the impact of different Greenhouse gas (GHG) stabilization policies on Earth’s surface temperature in the next century
ResultDeveloped a model of Earth’s temperature evolution which is scientifically grounded both in Earth Science and Policy. Quantified probabilities of rise between 1-8 deg C.
ImpactComparison of three major policies and characterization of their probability density functions. Communication about the severity of the threat using “roulette wheel” representation.
Climate ModelingSimulationDesign of ExperimentsPolicy Analysis
Webster, M.D., Forest C, Reilly J., Babiker M., Kicklighter D., Mayer M., Prinn R., Sarofim M., Sokolov A., Stone P., Wang C., Uncertainty Analysis of Climate Change and Policy Response, Climatic Change, 61(3) 295-320, 2003
MIT Joint Program on the Science and Policy of Global Change
MIT IntegratedGlobal SystemsModel (IGSM)
Prof. Mort Webster and his colleagues in EAPS are quantifying the impact of greenhouse gas emissions policy on future global warming under multi‐domain uncertainty. The bedrock of the work is MIT Integrated Global System Model which has been developed for over a decade. The Earth System part of the model captures all major sources of anthropogenic emissions, climate sensitivity, heat taken up by the oceans and other factors such as land use change. By relating the Human Activity model and the Earth system model to each other through very extensive Monte‐Carlo experiments a variety of important output parameters such as mean Earth surface temperatures can be estimated. These results are probabilistic. Different policies can be turned “on” and “off” and their impact can be assessed through simulation. The researchers created a pair of 'roulette wheels.’ as an alternative means of presenting the results to policy makers and the public. The wheel on the right depicts their estimate of the range of temperature change over the next 100 years if no policy change is enacted on curbing greenhouse gas emissions. The wheel on the left assumes that aggressive policy, corresponding to a CO2 concentration of roughly 550 ppm is enacted. While other climate models exist, the MIT model is the only one that interactively includes detailed treatment of possible changes in human activities as well ‐ such as the degree of economic growth, with its associated energy use, in different countries. This research has received wide press coverage and serves as a renewed wake‐up call to policy makers. The methods used are climate modeling,simulation, DOE and policy analysis.
16

17
Research Methods OverviewEngineering Systems / SDM
Deduction
TheoreticalMethodsEmpirical
MethodsInduction
“Ping‐Pong”
Grounded TheoryInterviewsSurveysHuman Experiments“System” Experiments*StatisticsAccident InvestigationsSensor Networks
Object‐ProcessModeling (OPM)
Abstract AlgebraDiscrete Event SimulationAgent Based Modeling
Network/Graph TheorySystem OptimizationReal Options in DesignSystem Dynamics
Control TheoryPolicy Analysis
* e.g. “Green Islands” project in the Azores (MIT Portugal Program)
Both empirical methods and theoretical methods are used in concert with each other. Empiricism emphasizes scientific knowledge that is closely related to evidence, especially as discovered in experiments. It also includes observations of the natural world –and in our case the artificial, man‐made parts of the world. A list of empirical methods is shown in blue on the left. Engineering Systems also works on theoretical methods like the ones listed on the right side. However, we always strive to verify theoretical models or results against empirical data leading to a constant “ping pong” game between observation and modeling through induction and deduction. Some research in complex systems such as the popular “network science”abstracts systems to the point where a binary adjacency matrix is all that is known about the system. Fundamental laws and statements are then derived for these “complex systems”, and these are often contrasted to random networks. We are somewhat skeptical that this will lead to deeper insights, but perhaps there is a path forward by enriching simple network models through things like node and edge attributes, time‐dependencies and bringing in multiple interacting layers. One of the fundamental challenges of Engineering Systems research is that it is not generally possible to conduct full‐blown physical experiments in a neatly contained university laboratory space. So, rather than putting the laboratory in the university we often put the university in the real world laboratory. Again, as AgeLab and others – such as the Humans and Automation Lab directed by Missy Cummings ‐ have demonstrated, we can combine both university laboratory and field work in new and powerful ways.
17

Progress
• Some emerging principles and methods for Engineering Systems analysis, design and management– Systems and enterprise architecting (OPN/OPM) – Crawley, Nightingale …
– Designing systems for evolution (changeability), safety, survivability … ‐ de Weck, Leveson, Hastings, Rhodes …
– Emerging principles, e.g. Trees versus Layers, Law of unintended consequences, Network coalescence versus aggregation …Moses …
• Impact on Real World– Resilient Enterprise (disruptions in global manufacturing and logistics) ‐ Sheffi
– Flu Preparedness (Flu 101)– Larson
18
ESD Total Credit Hours 1999‐2008
0
5000
10000
15000
20000
25000
1999 2000 2001 2002 2003 2004 2005 2006 2007 2008
The number of credit units inEngineering Systems subjects at MIT has increased 4-fold in the last decade.
Source: Office of the Provost
Has there been progress since 2004? Of course I am biased about this, but I am very encouraged by what has occurred and where we are headed. There are a number of generically applicable methods and tools emerging such as the ones I discussed (FPMs, TIA, STAMP …) and those that I did not discuss such as OPN/OPM. We also have a much better understanding of the “Illities” such as designing systems for lifecycle properties such as changeability, safety, survivability etc.. And … dare I say it … there are emerging principles such as what Dick Larson call’s the Law of Unintended Consequences. Also, there is evidence of making an impact in the real world and while scientific papers and citation counts are important they are not the only measure of impact. Examples of impactful Engineering Systems research that I did not mention are Yossi Sheffi’s work on Enterprise Resilience and research on flu preparedness and flu vaccine supply chains. There are others and I apologize that I don’t have more time to be comprehensive. We can also measure the impact of Engineering Systems in our student body. This chart shows the increase in the number of total credit hours taken in ESD subjects by MIT students over the last decade. This is not what we offer this is what is actually taken, this is instantiated “market demand”. We have seen a 4‐fold increase from about 5,000 credt units to over 22,000 credit units per academic year. The recent flattening is not due to slowing interest but to our limited capacity.
18

Future Research in Engineering Systems
• Developing and refining a unified approach for modeling complex engineering systems including their technological, social and natural components– Object‐Process‐Methodology, SysML, Network
Science, Agent‐based Modeling, Matrix Methods, System Dynamics
• Multi‐layer network modeling– Recall Air Transportation Example. Most systems can
be represented as interacting layers: social/organizational, technological, process‐layer
• Bayesian Learning in Policy Design and Analysis– Treating policy as a control problem where not the
control inputs (=actuator commands) are fixed, but the desired outcomes
• Systems Architecture for Lifecycle (“Illities”)– Making causal connections between system form‐function
patterns (e.g. modularity) and quantifying their lifecycle properties explicitly, e.g. evolvability, safety, sustainabilityetc… 19
Domains
Extended EnterprisesCritical InfrastructuresEnergy and SustainabilityHealth Care Delivery
I did want to give the impression that Engineering Systems is a mature field. On the contrary we are just at the beginning. And just as the variety of methods I described there are many opinions as to where we could or should go. In terms of the four domains we will continue to deepen in the first three, but we see “health care as a system” as an important one where Engineering Systems can make an important contribution. While we already have a number of activities in this area we will need to attract resources and new faculty in this area as well as develop synergies among these projects. Methodologically I list four areas of interest: (i) developing a unified language for modeling complex systems, (ii) multilayer network modeling, whereby usually at least three layers are present including a technology layer a social layer and a sort of “process” layer that connects them. Policy Design has tended to be staticand the concept of Bayesian Learning seems important to adapt and adjust policy as future uncertainty reveals itself. Finally we are not yet done with understanding systems architecting for lifecycle. In particular the role of system structure and modularity (or decomposability) seems to be coming back as a central issue.
19

Questions?
20
Network plot of largest change network of 2579 associated change requests in sensor system design
(Sponsor: Raytheon Integrated Defense Systems)
Giffin M., de Weck O., Bounova G., Keller R., Eckert C., Clarkson J., “Change Propagation Analysis in Complex Technical Systems”, Journal of Mechanical Design, 131 (8), August 2009
I would like to leave you with this picture that represents a network of ~2600 changes in the design of a complex radar system at Raytheon Integrated Defense Systems based on Monica Giffin’s SDM thesis. This is joint work with John Clarkson who will speak later. We were stunned to find this and the mechanism that gave rise to this complex network … but this will be for another day. Thank you for your attention and I would be happy to answer any questions.
20