energy in the mediterranean region: situation and prospects dr houda ben jannet allal, ome general...
TRANSCRIPT

ENERGY IN THE MEDITERRANEAN REGION:ENERGY IN THE MEDITERRANEAN REGION:
Situation and prospectsSituation and prospects
Dr Houda BEN JANNET ALLAL, OMEDr Houda BEN JANNET ALLAL, OME
General overview of renewable energy and General overview of renewable energy and energy efficiency in Southern and Eastern energy efficiency in Southern and Eastern
Mediterranean countriesMediterranean countries
Dr Houda BEN JANNET ALLAL, OMEDr Houda BEN JANNET ALLAL, OME

• OME
• Context
• Present situation and prospects
• Conclusion

Missions & Objectives
- Reference on Mediterranean Energy Issues
- Expertise
- Studies and Publications
- Mediterranean Energy Database & Scenarios
-Promoting Cooperation & Partnership
- Mutual Technical Assistance between Members
- Capacity building
- Communication and Events
Think TankThink Tank
Consulting & AdviceConsulting & Advice
Monitoring & ScenariosMonitoring & Scenarios
Cooperation & PartnershipCooperation & Partnership
“OME makes things happen”
ObjectivesObjectives

Demography in the Mediterranean Basin
Source: Plan Bleu, OME
0
50
100
150
200
250
300
350
400
1950 1970 1980 1990 2000 2010 2020
mill
ions
inh
ab
itants
SEMCs
NMCs

Population in the MCs (145 M in 2006)
Algeria23%
Egypt49%
Morocco21%
Tunisia7%
The MCs population grew at 1.7%/y between 2000-2006.
Annual growth by country is 1% for Tunisia, 1.2% for Morocco, 1.6% for Algeria & 2% for Egypt.
During the period 2000-2006, population increased from 132 to 145 M & the urban pop. from 67 to 76 M. These increases represent 13 M more inhabitants, & 9.4 M more people in the cities.
Demography

Urbanization rate in the MCs increased from 50.5% to 51.9% between 2000 & 2006.
Currently, the urban rate varies from about 43% in Egypt to 65.3 % in Tunisia (63.3 % in Algeria & 55.5 % in Morocco).
0
10
20
30
40
50
60
70
share (%)of Total Pop
2000 2001 2002 2003 2004 2005 2006
Urban Population (Share of the Total)
Algeria
Egypt
Morocco
Tunisia
Urban Population (share of the total)

Economic Development in the Mediterranean
0
1000
2000
3000
4000
5000
6000
7000
1971 1980 1990 2000 2005 2010 2020
SEMCs
NMCs
1971-2000Avg. growth per year
Total MED. 2.9%NMCs 2.7%; SEMCs 3.7%
2000-2005Avg. growth per year:
Total MED. 2.1%NMCs 1.7%; SEMCs 3.8%
2005-2020Average growth per year:
Total MED. 3.0%NMCs 2.5%; SEMCs 4.9%
GD
P u
sin
g e
xc
ha
ng
e r
ate
s (
bil
lio
n $
20
00
)
88%
12%
87%
13%
86%
14%
84%
16%
83%
17%
81%
19%
77%
23%

GDP (in $2000) in the MCs (257 b$ in 2006)
Algeria27%
Egypt47%
Morocco16%
Tunisia10%
Economic Growth
GDP & GDP per capita are steadily increasing in all MCs. GDP of the MCs amounts to 257b$.
Annual growth rate is 4.5% for all MCs (3.8% in Egypt, 4.2% in Morocco, 4.9% in Algeria & 7% in Tunisia).
Tunisia & Algeria recorded the strongest economic growth between 2000 and 2006.
GDP per capita is higher for Tunisia and Algeria, followed by Egypt and Morocco. Growth of GDP/capita depends also on population growth.
0
500
1000
1500
2000
2500
3000
2000 2001 2002 2003 2004 2005
Year
GDP per capita (in $2000 per capita)Algeria
Egypt
Morocco
Tunisia

From large exporter to totally importer countries
The SMCs are unequally endowed with hydrocarbon resources
Range between large exporters to totally importers
Two countries (Algeria & Egypt) are high energy exporters and two countries (Tunisia & Morocco) are net energy importers
It is nowadays widely recognised that energy will continue to play an important role in all the MCs, importers or exporters of energy.
The national energy policies are largely linked to the energy resources available in each of these countries

Oil (Mt) & Gas (bcm) Reserves
Gas ReservesOil ReservesSource: Reserves from BP & CEDIGAZ
Total Oil Reserves = 6145 Mt
4580
1500 1870
370
Total Gas Reserves = 8340 bcm
1400 3900
445
400

Oil Exports in the MCs ( 87 Mtoe in 2006)
Algeria96%
Egypt4%
Gas Exports in the MCs ( 70 Mtoe in 2006)
Algeria80%
Egypt20%
Oil Imports in the MCs (9 Mtoe in 2006)
Morocco91%
Tunisia9%
AlgeriaEgypt

Primary energy consumption (113 Mtoe in 2006)
Algeria32%
Egypt49%
Morocco12%
Tunisia7%
Oil45%
N.Gas 46%
Coal5%
Hydro 3%
RE1%
The 145-million population in MCs is consuming 112 Mtoe of primary energy (of wh. 53 Mtoe of gas, 52 Mtoe oil & 6 Mtoe coal) & 154 TWh of electricity.
Number of customers in residential sector is 26.6 million for electricity and 2.5 million for natural gas.
Although the global electrification rate reached 96.6%, about 6-10 million of persons still have no access to electricity.
Efforts are deployed in the renewable energy sector in the MCs particularly in wind and solar energy and PV installations for electrification of remote villages, isolated rural households and rural schools.

0
20000
40000
60000
80000
100000
120000
2000 2001 2002 2003 2004 2005 2006
Primary Energy Consumption by Source (in 1000 toe)
RE
Hydro
N.Gas
Oil
Coal

Coal7% Oil
10%
Hydro8%
RE1%
N. Gas74%
Algeria20%
Egypt61%
Morocco11%
Tunisia8%
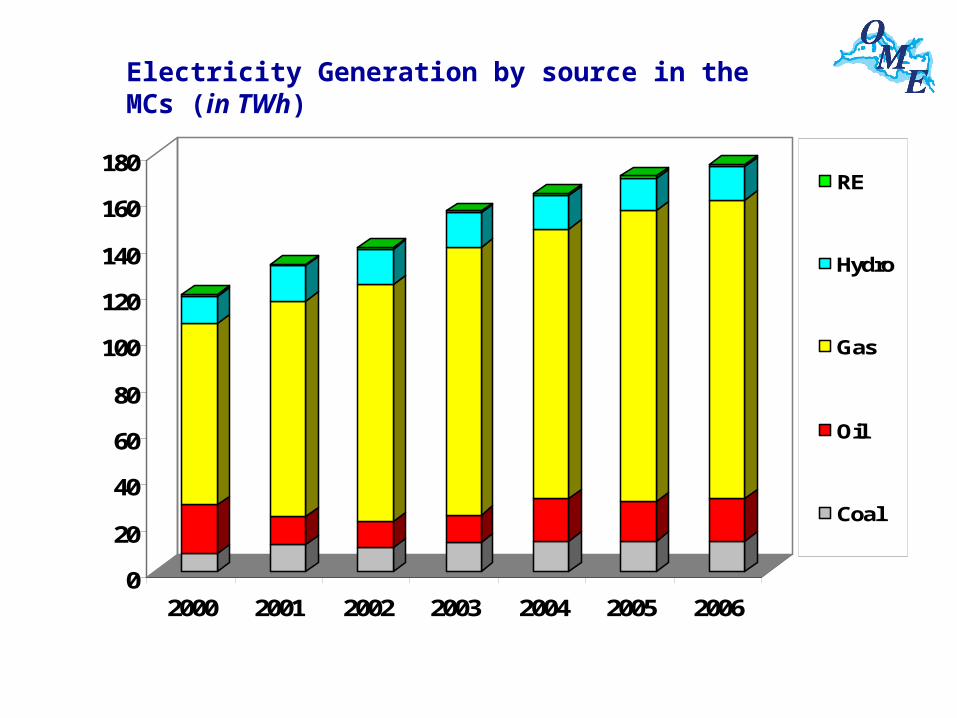
Electricity production in the MCS (175 TWh in 2006)
0
20
40
60
80
100
120
140
160
180
2000 2001 2002 2003 2004 2005 2006
RE
Hydro
Gas
Oil
Coal
Electricity Generation by source in the MCs (in TWh)

0
10
20
30
40
50
60
70
80
90
100
2000 2001 2002 2003 2004 2005 2006
RURAL ELECTRIFICATION RATE
Algeria
Egypt
Morocco
Tunisia
(%)
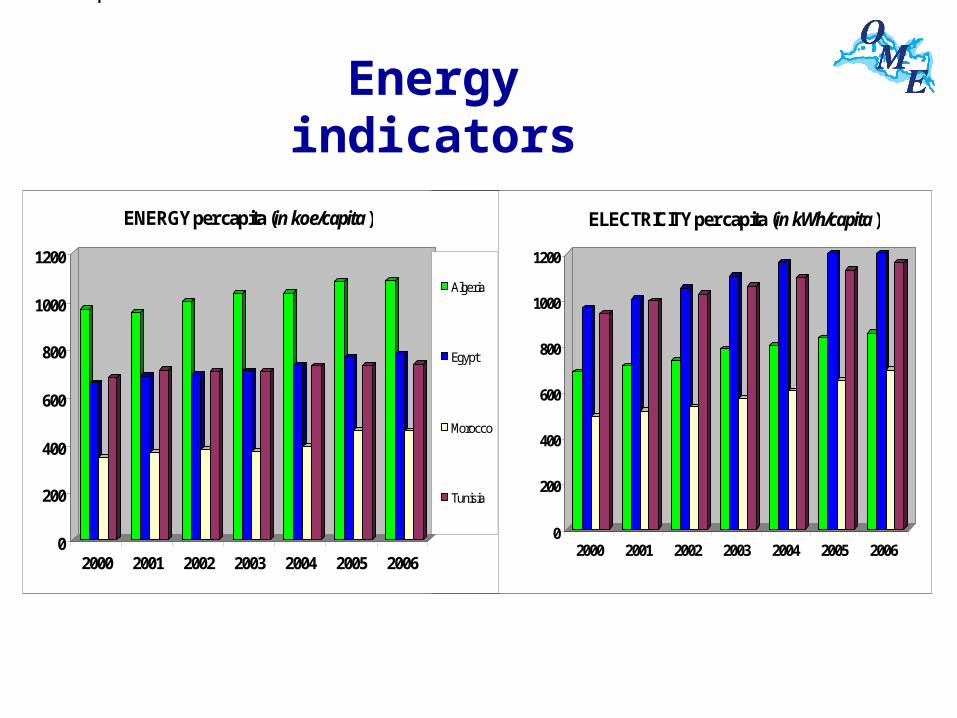
kWh/capita
0
200
400
600
800
1000
1200
2000 2001 2002 2003 2004 2005 2006
ELECTRICITY per capita (in kWh/capita)
0
200
400
600
800
1000
1200
2000 2001 2002 2003 2004 2005 2006
ENERGY per capita (in koe/capita)
Algeria
Egypt
Morocco
Tunisia
Energy indicators
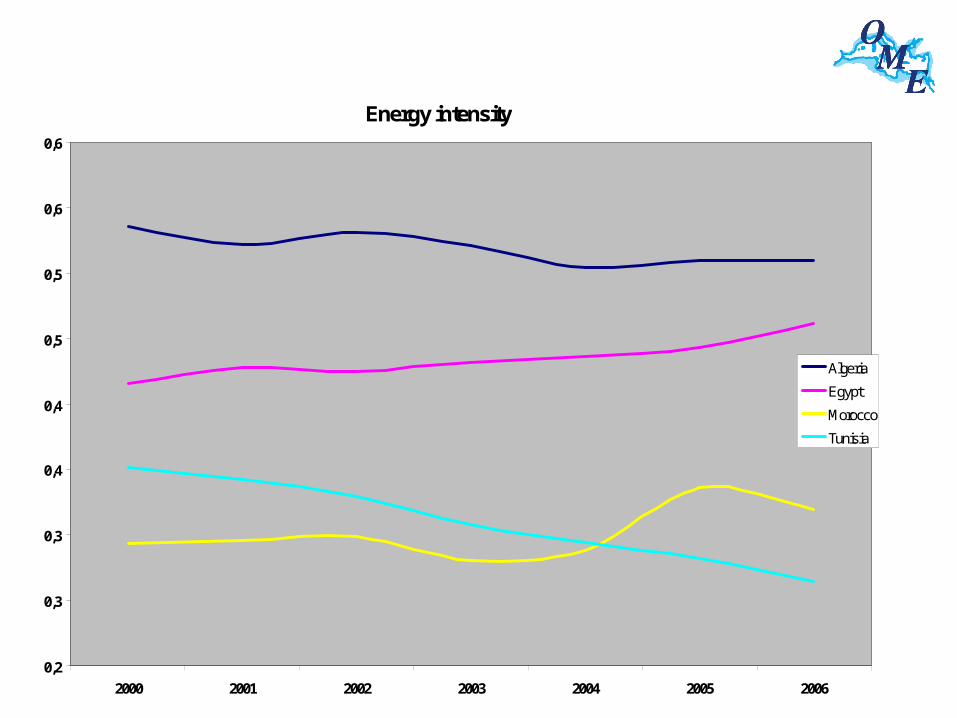
Energy intensity
0,2
0,3
0,3
0,4
0,4
0,5
0,5
0,6
0,6
2000 2001 2002 2003 2004 2005 2006
Algeria
Egypt
Morocco
Tunisia
toe/GDP $2000

Electricity intensity
0,04
0,09
0,14
0,19
0,24
0,29
0,34
2000 2001 2002 2003 2004 2005
Algeria
Egypt
Morocco
Tunisia
kWh/GDP PPP

Source: OME
RE in SEMCs: high potential but relatively modest present situation
RE installed capacity 2006 in the SEMCs (excluding large hydro) MW
Algeria Egypt Libye Morocco Tunisia Turkey Small hydro (321 MW)
85 - 30 30 176
Wind (410 MW) 0.5 225 114* 20 50 PV systems (13.3 MW)
1 3 1 6 2 0.3
Geothermal 20.4 Biomass 36 0.1 Source: OME * 2007 data (60 MW have been inaugurated on April 2007)
Characteristics of wind resources in the Southern and Eastern Mediterranean countries
Algeria Egypt Libya Morocco Tunisia Turkey Wind speed (m/s)
2 - 6 6 - 11 5 – 10.5
8 - 11 7 - 10 5-11
Wind potential (MW)
Na 20 000 Na 6000 2000 88000 (technical) and 10000 to 12000
economic

0
100000
200000
300000
400000
500000
600000
700000
800000
900000
m2
2000 2001 2002 2003 2004 2005 2006
Tunisia
Morocco
Egypt
Algeria
Solar Water Heating (825 000 m2 in 2006)
Egypt70%
Morocco11%
Tunisia19%
Algeria
Solar Water Heating (m2)

PV capacity in the MCs (26 MWp in 2006)
Algeria9%
Egypt20%
Morocco63%
Tunisia8%
Nb of HH with PV systems PV (54856 in 2006)
Algeria2%
Egypt8%
Morocco69%
Tunisia21%

Wind installed capacity (304 MW in 2006)
Egypt76%
Morocco18%
Tunisia6%
Algeria
0
50
100
150
200
250
300
350
MW
2000 2001 2002 2003 2004 2005 2006
Tunisia
Morocco
Egypt
Algeria
Wind Capacity Installed (MW)
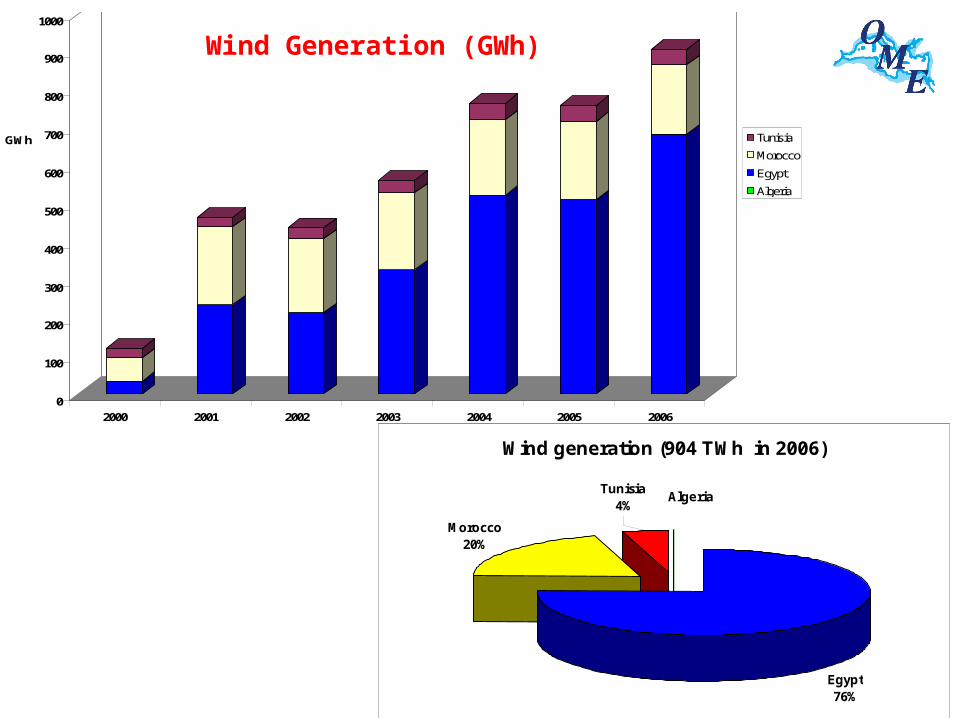
Wind generation (904 TWh in 2006)
Egypt76%
Morocco20%
AlgeriaTunisia
4%
0
100
200
300
400
500
600
700
800
900
1000
GWh
2000 2001 2002 2003 2004 2005 2006
Tunisia
Morocco
Egypt
Algeria
Wind Generation (GWh)

Hydro Generation in the MCs (14.5 TWh in 2006)
Egypt87%
Morocco11%
Tunisia1%
Algeria1%
0
2000
4000
6000
8000
10000
12000
14000
16000
18000
GWh
2000 2001 2002 2003 2004 2005 2006
Tunisia
Morocco
Egypt
Algeria
Hydro Generation (in GWh)

0%
10%
20%
30%
40%
50%
60%
70%
80%
90%
100%
1971 1980 1990 1995 2000 2005 2010 2020
NMC Importers
SEMC Importers
Global Energy Dependency (%)
0%
20%
40%
60%
80%
100%
1971 1980 2000 2005 2010 2020
NMC Importers
SEMC Importers
Natural Gas Dependency (%)
40%
50%
60%
70%
80%
90%
100%
1971 1980 2000 2005 2020
NMC Importers
SEMC Importers
Oil Dependency (%)
Energy dependency is increasing …

Source : UNF, Sigma XI, 2007
The region is also facing climate change problems …

Source : IPCCC, 2007 WGI
…which are expected to be more challenging in the future

0
500
1000
1500
2000
2500
2000 2001 2002 2003 2004 2005
CO2 emissions per capita (in kg CO2)
0
50
100
150
200
250
300
2000 2001 2002 2003 2004 2005
Energy related CO2 emissions (in Mt CO2)
Tunisia
Morocco
Egypt
Algeria
CO2 emissions in the MCs (273 Mt in 2006)
Algeria29%
Egypt50%
Morocco13%
Tunisia8%
Energy related CO2 emissions in the MCs (in Mt)

Source: OME
CO2 Emissions from Energy Consumption in the Mediterranean
0
500
1000
1500
2000
2500
3000
1971 1980 1990 2000 2005 2010 2020
SEMCs
NMCs
CO
2 E
mis
sio
ns
(in
Mt
CO
2)
89%
11%
84%
16%
74%
26%
68%
32%
67%
33%
62%
38%
55%
45%

“On current trends, we are on course for an unstable, dirty & expensive energy future” quote from IEA Executive Director

• A more sustainable future is needed• A more sustainable future is possible• High potential for energy efficiency• Renewable energy have also an important role to play• OME is working on these issues through its RESDC

No single solution….a portfolio of technologies is required
Solutions depend on …
Countries,Resources,
Needs,Choices,Market,Timing,
Infrastructure …
Efficiency in buildings, Industry and End-Use
products
Energy efficiency in the transport sector
Advanced power generation and grid
Renewable energy technologies
Biomass, CHP
CO2 Capture and Storage

• Barriers need to be removed, particularly – Institutional and legal barriers: in most of the countries, there is no institutional and regulatory
framework specific to RE
– Competing resources: RE are competing with conventional energies relatively abundant, widely deployed and subsidised in several countries of the region. But, RE are most often already competitive in isolated rural areas

• Regional and international context is favourable – Regional: EC, EIB, MEDREP, MEDENER, MEDITEP, OME– Kyoto Protocol: the Clean Development Mechanism, an opportunity not yet fully exploited– The Mediterranean Strategy for Sustainable Development: a framework in favour to RE and EE – RE perspectives are encouraging

Source: OME
RE perspectives are encouraging in the SEMCs
Orientations for RE in the SEMCs
Algeria Egypt Libya Morocco Tunisia Turkey RE specific law
Yes Ongoing No Ongoing Yes Yes
Targets
(not mandatory)
5% of power
generation based on
solar energy by
2010
20% RE share in
electricity demand by 2020
6% of RE share in
electricity demand by 2020
RE: 10% share in
TPES and 20% in
electricity generation by 2012
Yes, by technology
(wind, SWH, …)
2006-2012: + 926 MW
RE
2010-2015: + 625 MW
Feed in tariffs Yes Yes No No No Yes RE funds Yes Foreseen RE subsidies Yes
(SWH)
R&D law Yes Yes Yes Yes Yes Public awareness programmes
Yes Yes (strong)
