energy efficiency in china: glorious history, … efficiency in china: glorious history, uncertain...
TRANSCRIPT

Energy Efficiency in China:Glorious History, Uncertain Future
Mark D. LevineSenior Staff ScientistFounder and Leader,
China Energy Group
April 21, 2010

The China Energy Group at LBNL
The China Energy Group works collaboratively with groups in China and elsewhere:
• to promote energy efficiency in China,• to enhance the capabilities of Chinese
institutions that promote energy efficiency, and
• to understand the dynamics of energy use in China.

Founded in 1988
Focused on End-Use Energy Efficiency
~ 40 Current Projects in ChinaCollaborations with ~50 Institutions in China

Mark D. Levine Group Leader, Senior Staff Scientist
David Fridley Deputy Group LeaderStaff Scientist
Lynn Price Staff Scientist
Nan Zhou Scientist
Nate Aden Senior Research Associate
Hongyou Lu Senior Research Associate
Nina Zheng Research Associate
Ali HasanbeigiPost Doc
Yining QinPost Doc
Shuqin Chen Post Doc
Jing Ke Visiting Researcher
Stephanie Ohshita Visiting Faculty
Queena Qian Visiting Researcher
Three Major Achievements
• Appliance Efficiency Standards
• Industrial Energy Efficiency Policy
• Instrumental in creating two major institutions — China Sustainable Energy Program of the
Energy Foundation— Beijing Energy Efficiency Center

Part I: Glorious Historypreceded in good dialectical fashion by an inglorious
earlier history
Part II: Energy Crisis in China: 2001 to presentrepeat of much earlier “inglorious history”??
Part III: The Future:What might happen? What is to be done to end the crisis?

7
Executive Summary (Part I)
• Things were bad in energy (for 3 decades)• Deng Xiaoping came to power
—A group of academics suggested a new approach to energy—Deng listened!
• Things were much better (for 2 decades)• The market became king
—Energy went off track again• There are solutions
—The Chinese government and Communist party are responding, somewhat in the manner of Deng

8
Part I: China’s Recent Energy History in Three Acts
“Soviet Style” Energy Policy (1949-1980)
Deng’s Initial Reforms (1981-1992)
Transition Period (1993 to 2001), then Crises

9
“Soviet Style” Energy Policy (1949-1979)
• Single objective was rapid energy supply growth
• Energy prices greatly subsidized
• Central allocation system provided energy primarily to heavy industry
• No attention to environment
• Result: one of the world’s least efficient (and fastest growing) energy systems
Source: NBS

Primary Energy Use vs GDP Index, 1952=100 1952-1980
LAWRENCE BERKELEY NATIONAL LABORATORY
0
200
400
600
800
1,000
1,200
1,400
1952 1954 1956 1958 1960 1962 1964 1966 1968 1970 1972 1974 1976 1978 1980
GDP
Energy
11
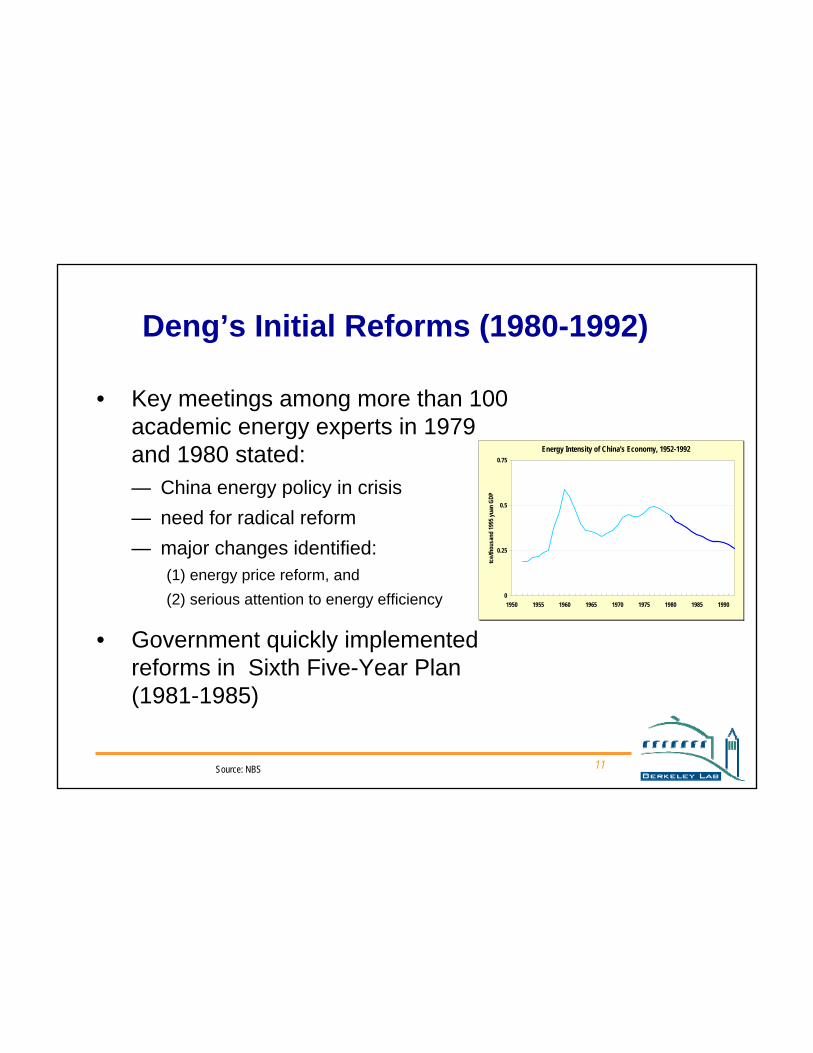
Deng’s Initial Reforms (1980-1992)
• Key meetings among more than 100 academic energy experts in 1979 and 1980 stated:— China energy policy in crisis— need for radical reform— major changes identified:
(1) energy price reform, and (2) serious attention to energy efficiency
• Government quickly implemented reforms in Sixth Five-Year Plan (1981-1985)
0
0.25
0.5
0.75
1950 1955 1960 1965 1970 1975 1980 1985 1990
tce/t
hous
and
1995
yuan
GDP
Energy Intensity of China's Economy, 1952-1992
Source: NBS

Primary Energy Use vs GDP Index, 1980=1001980-2000
LAWRENCE BERKELEY NATIONAL LABORATORY
0
100
200
300
400
500
600
700
1980 1982 1984 1986 1988 1990 1992 1994 1996 1998 2000
Energy
GDP
13
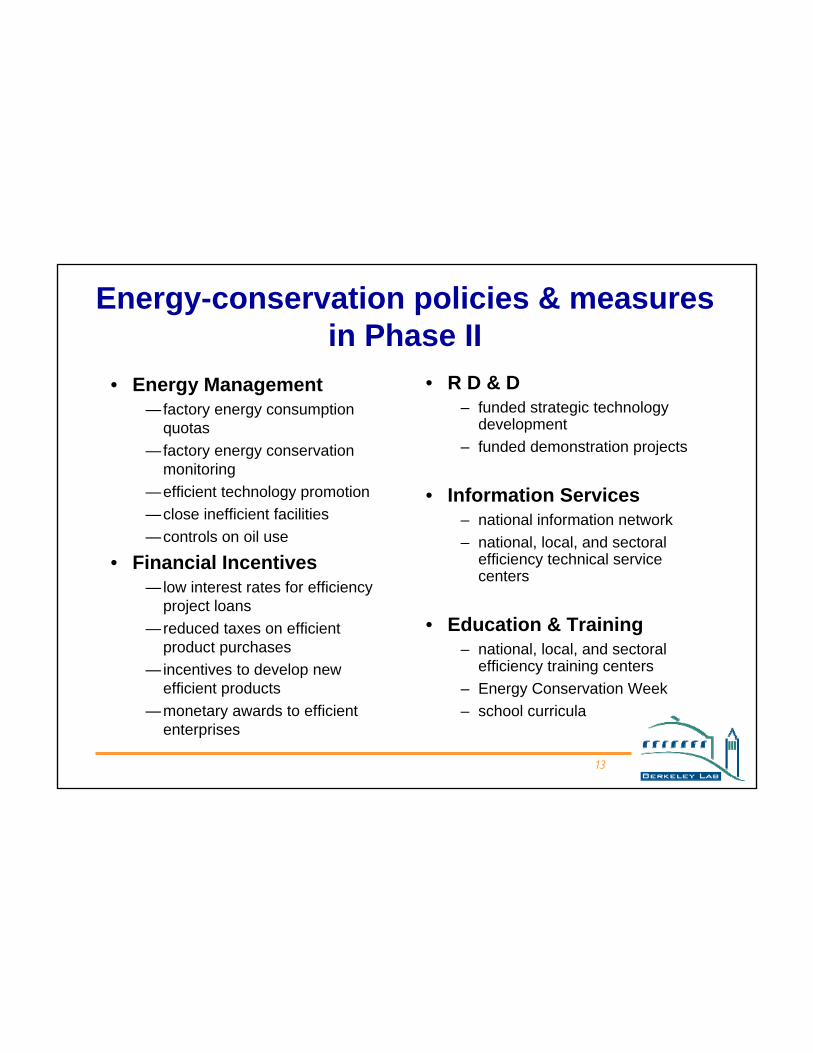
Energy-conservation policies & measures in Phase II
• Energy Management—factory energy consumption
quotas—factory energy conservation
monitoring—efficient technology promotion—close inefficient facilities—controls on oil use
• Financial Incentives—low interest rates for efficiency
project loans—reduced taxes on efficient
product purchases —incentives to develop new
efficient products—monetary awards to efficient
enterprises
• R D & D– funded strategic technology
development– funded demonstration projects
• Information Services– national information network– national, local, and sectoral
efficiency technical service centers
• Education & Training– national, local, and sectoral
efficiency training centers– Energy Conservation Week– school curricula

14
Energy efficiency investment is stable, but declining as share of total investment
0
100
200
300
1981 1986 1991 1996
Inve
stm
ent (
billio
n 19
95 yu
an)
0%
5%
10%
15%
Share of Total Investment
Energy Supply Investment
Energy Efficiency Investment
Efficiency Share of Total Energy Investment
Estimated Efficiency Share, 1996-1998
Energy Supply and Energy Efficiency Investment, 1981-1998
N.B. Only partial data on energy efficiency investments after 1995 are available. These partial data informed the estimates presented here of efficiency's shares of total energy sector investment for 1996-1998. All investment data are for state-owned units only.
Source: NBS, SPC

15
China’s CO2 emissions would have surpassed the US before 1990 if energy intensity had not
declined
0
200
400
600
800
1000
1200
1400
1600
1950 1955 1960 1965 1970 1975 1980 1985 1990 1995
Mt C
arbo
n
USA
Former Soviet Union
China
Japan
India
Source: ORNL
Carbon Dioxide Emission Estimates:

16
Transition period (1993 to 2002)
Rapid movement towards market-based system…—Dramatic energy price reforms (raised all energy prices to consumers)
—Enterprise reforms increased price sensitivity
…but past successes in improving energy efficiency were based on mechanisms that were disappearing…
—Elimination of energy quotas
—Low incentives for monitoring in industry
—Difficulty in continuing energy efficiency loan subsidies
—New tax code (1994) eliminated tax breaks for efficiency

17
Take-off of consumer goods highlights the need for efficiency standards
0
5
10
15
1980 1985 1990 1995
Outp
ut (m
illion
s)
Air Conditioners
Refrigerators
Motor Vehicles
Production of Consumer Durables, 1980-1999
Source: NBS

Appliance Saturation
LAWRENCE BERKELEY NATIONAL LABORATORY
0
20
40
60
80
100
120
140
1981 1983 1985 1987 1989 1991 1993 1995 1997 1999 2001 2003 2005 2007
Owne
rshi
p:Nu
mbe
r of U
nits
per 1
00 U
rban
Hou
seho
lds
Clothes Washers
Color TVs
Refrigerators
Room Air Conditioners
Cars
PCs
Rural households lag urban households by 10-20 years

Part II: Energy Crisis in China: 2002 to present
repeat of much earlier “inglorious history”??

20
Executive Summary (Part II)
• China faced a serious new energy crisis —Through 2005, most Chinese saw the energy shortage as
the crisis—The real crisis was in energy policy and much too-rapid
energy demand growth (just as in 1979)• A key issue: how does China reduce energy demand
growth and still meet requirements for energy services?
• Unless this problem is solved, China’s economic goals will be placed in jeopardy and the environmental consequences of energy policy failure are truly frightening
21
Energy crisis: 2002-2005 and beyond
• Energy demand growing very, very fast• Widespread power shortage; extraordinary pace of
construction of power plants• Soaring coal prices• Transportation bottlenecks for coal• “Surge” in oil imports especially as oil is used in
place of coal

China Adds 2 power plants per week
—101 GW added in 2006• 92 GW coal-fired
—Comparable additions in 2007 and 2008
—Annual additions ~ the combined capacity of UK and Thailand
—or twice California’s capacity

23
China’s Energy and Development Goals for 2020
Goals (compared with 2000)• GDP -- Quadrupling• Urbanization -- 65% vs 35% now• Energy Use -- Doubling
By 2005, it was already clear that the goal could not be realized.

Source: National Bureau of Statistics, China Statistical Abstract, various years.
24
Overview: Energy Intensity Trends and Overview: Energy Intensity Trends and Policy BackgroundPolicy Background
Average Annual Increase of5% per year
Average Annual Decline of5% per year
Quadruple GDP/Double EnergyStrong efficiency mechanisms in 1980s
Weakening of efficiency mechanismsIncreased rate of urbanization
China joins WTO
China announces 20% E/GDP reduction target for 2010
Zhou, N., Levine, M.D., and Price, L., in press. “Overview of Current Energy-Efficiency Policies in China.” Invited for a Special Issue of Energy Policy.

0
200
400
600
800
1,000
1,200
1,400
1990 1995 2000 20050
100
200
300
400
500
1990 1995 2000 2005
Source: China Iron and Steel Association; Institute of Technical Information for the Building Materials Industry; U.S. Geological Survey
数据来源:中国钢铁协会;建筑材料工业技术情报研究所;美国国家地质调查局
Million Metric Tons
China’s Steel Production 1990 – 2007
Coal Use & Energy-Related CO2煤炭消费与能源相关二氧化碳排放
China’s Cement Production 1990 – 2007
中国的钢铁生产量(1990-2007年) 中国的水泥生产量(1990-2007年)
百万吨

Source: U.S. Geological Survey 2008. Mineral Commodity Summaries: Cement; China National Bureau of Statistics, 2008资料来源:美国地质调查局2008年。 矿产品摘要:水泥;中国国家统计局2008年数据。
India 6%
Cement Production Worldwide: 2007世界水泥生产量2007
United States 4% (includes Puerto Rico)
Japan 3%
Rep of Korea 2%
Russia 2%
Spain 2%
Turkey 2%
Mexico 2%
Italy 2%
Rest of World 26%
China ~50%
墨西哥
意大利
土耳其
西班牙
俄罗斯
韩国
日本
美国(包括波多黎各) 印度
中国
其他国家

2000 2002 2004 2006 2008 2010 2012 2014 2016 2018 2020Source: NBS, China Statistical Yearbook, various years; China Statistical Abstract 2005; growth estimates extrapolated from mid-year production
data for 2005; targets announced by NDRC数据来源:中国国家统计局,中国统计年鉴(各年);中国统计摘要(2005);2005年增长数据是基于2005年年中生产数据通过插值方法得到的;目标
基于国家发展与改革委员会公布的数据
Ener
gy C
onsu
med
(billi
on tc
e)
36
Actual GDP
实际国内生产总值
Energy and GDP, Path to 2020中国的能源消费与国内生产总值(至2020年)
GD
P (tr
illion
200
0 R
MB
)
32
28
24
20
16
12
8
4
0
2.7
2.4
2.1
1.8
1.5
1.2
0.9
0.6
0.3
0
Actual energy
实际能源消费
energy target
能源目标
GDP target
国内生产总值目标
能源消费(十亿吨标准煤)
国内生产总值(
千亿2000
年人民币元)

Figure 3: Global, Chinese, and American Per-capita Energy-Related CO2 Emissions, 1950-2004
0
5
10
15
20
25
1950 1956 1962 1968 1974 1980 1986 1992 1998 2004
tonn
es C
O2/
pers
on
USA
global average
PRC
Source: China emissions are derived from revised total energy consumption data published in the 2007 China Statistical Yearbook using revised 1996 IPCC carbon emission coefficients by LBNL; China population data from NBS and US Census (for 1950-51); global and American emissions data from Oak Ridge National Laboratory, Carbon Dioxide Information Analysis Center; global and American population data from US Census.

Environmental Energy Technologies4/22/2010 , p. 29
Energy intensities within industrial sub-sectors are actually declining
0.0
0.2
0.4
0.6
0.8
1.0
1.2
1.4
1.6
1.8
2.0
1995 1996 1997 1998 1999 2000 2001 2002 2003
kgce
/RM
B (2
000)
smelting & rolling of ferrous metals
non-metal min prod petroleum, coke, & nuke
raw chemicals & ch prsmelt & roll n-f m
paper coal
electricitytextiles

Part III: The Period after 2005

31
Executive Summary (Part III)
• Things could get worse—Actually they can’t, but they could continue on the
present path for some time
• Things could get better—There is some chance!!
• Update: things are getting better

3232
China’s Policies to Reduce Energy Use and Greenhouse Gas Emissions
Major policy initiatives were introduced in 2005 to Major policy initiatives were introduced in 2005 to reverse the trends in energy demand growth reverse the trends in energy demand growth
experienced from 2002 to 2005experienced from 2002 to 2005

3333
In 2005, China Adopted an In 2005, China Adopted an Energy Intensity Reduction TargetEnergy Intensity Reduction Target
• November 2005: Premier Wen Jiabao at the Plenary of the Communist Party: “Energy use per unit of GDP must be reduced by 20% from 2006 to 2010”
• March 2006: Statement reiterated by the National Peoples Congress
• China’s 11th Five Year Plan (2006-2010): outlined goal of reducing energy consumption per unit of GDP by 20% between 2006 and 2010

3434
Responsibility for Achieving 20% E/GDP Reduction Target
• Varying targets have been assigned to all the provinces, cities and counties in China to achieve the national energy conservation target
• Each province signed an agreement with China’s State Council outlining their specific targets for energy conservation (both for the Five Year Plan and annually)
• Lower level governments in turn signed agreements with provincial governments

3535
Responsibility for Achieving 20% E/GDP Reduction Target
State Council established a personnel evaluation system to enforce the achievement of the target:
—Officials from that do not meet energy conservation reduction targets cannot participate in annual rewards programs or receive honorary titles
—Officials will not be promoted if their jurisdiction fails to meet energy conservation targets (one-vote veto)
—Leaders in state-owned or state-controlled companies will not enjoy the benefits of annual evaluation award programs
—Provincial governments and companies are subject to the evaluation jurisdiction’s high energy-consumption projects followed by an investigation by administrative bodies
—Deception in the reporting of results can lead to criminal charges

3636
Reducing Energy Use in the Industrial Reducing Energy Use in the Industrial SectorSector
• China’s national-level government established the Top-1000 Energy-Consuming Enterprises Program
• Provincial and local governments signed agreements with about 100,000 smaller companies
• All companies using more than a certain threshold level of energy annually agreed to develop energy conservation targets and action plans

3737
TopTop--1000 Enterprises Represent a 1000 Enterprises Represent a Significant Share of ChinaSignificant Share of China’’s Energy Uses Energy Use
Note: Top-1000 program energy consumption is typically reported in final energy units (dark blue box). The shaded area provides the Mtce equivalent of electricity generation, transmission, and distribution losses so that the Top-1000 program can be compared in primary energy terms with the other two bars. Industry sub-sector breakdown based on LBNL LEAP model, not Chinese statistics.
Total energy savings goal for all Top-1000 enterprises is 100 Mtce (2.8 Quads) from their expected 2010 energy consumption.
-
500
1,000
1,500
2,000
2,500
Total Industry Top-1000 Enterprises
Prim
ary
Ene
rgy
Con
sum
ptio
n 20
05 (m
illion
tce)
Commercial
Residential
Transport
Industry
Agriculture
Other Industry
Ethylene
Paper
Cement
Iron and Steel
Aluminium
AmmoniaGlass
33% of total energy
45% of industrial energy
Note: Mtce >> EJ = 0.0293; EJ >> Quads = 0.9478

Rapid growth China's energy efficiency investment
– Feb. 18, 2010: The gross output of China’s energy efficiency services industry increased 40.8% year on year to RMB 58.8 billion($8.8 B) last year (2009), according to statistics released by the China Energy Conservation Association.
– Last year, the government's comprehensive energy-saving investment was RMB 36.0 billion ($5.3B), up 42.3% from RMB 25.3 billion ($3.7 B) in the previous year.
– The government incentives drew forth 100 B RMB ($14.7 B) investment from industry
– Investment in energy performance contracting in China surged 67.4% year on year to RMB 19.5 billion ($2.9 B) last year
http://www.chinaknowledge.com/Newswires/News_Detail.aspx?type=1&NewsID=31392
.

Comparison with Wind and Comparison with Wind and Nuclear InvestmentsNuclear Investments
Very rough estimates of investment in wind and nuclear:
Wind: 10 GW/yr x RMB 4 billion/GW = RMB 40 billion/yr
Nuclear 7 GW/yr x RMB 14 billion/GW = RMB 100 billion/yr
Energy efficiency is presently >RMB 150 billion ($22B)/year and growing rapidly!

4040
Electric Power Sector PoliciesElectric Power Sector Policies
• “Differential pricing” sets electricity prices for energy-intensive sectors based on energy efficiency and has resulted in thousands on inefficient plants being closed
• “Environmental dispatch” means low carbon and clean plants are dispatched first
• Energy Efficiency Power Plants (EPPs) are virtual power plants made of energy efficiency projects – China has EPP pilots in 5 provinces
• Grid-connected renewable energy with preferential feed-in tariffs (60% higher than that for coal-fueled power generation)
China has adopted a number of innovative policies that aren’t found in most countries

4141
Low Carbon Energy SourcesLow Carbon Energy Sources• Renewable Energy
— Renewable Energy Law enacted in 2006
— National targets: 10% of total primary energy in 2010 will be from renewable energy, increasing to 15% by 2020
— Wires charge for Renewable Energy fund doubled to 0.03 cents/kWh— More than 170 GW of hydro power has been commissioned; expected growth
of about 300 GW by 2020, and 400 GW by 2030 — Largest producer and user of solar water heaters in the world with over 120
million square meters of solar heat collectors in use, saving 20 million tons of coal per year
— Largest producer of PV cells for the world — Aggressive new solar PV incentives announced in April 2009
• Ambitious nuclear power development plan— More than 60 GW new nuclear power plants will be constructed and
commissioned by 2020
— Advanced nuclear power technology being introduced

Recent Achievements in ChinaRecent Achievements in China
With these strong policies and programs, China has With these strong policies and programs, China has been able to reverse the increase of energy use per been able to reverse the increase of energy use per unit of GDP and has made remarkable progress in unit of GDP and has made remarkable progress in
improving the countryimproving the country’’s energy efficiency, reducing s energy efficiency, reducing energyenergy--related GHG emissions at the same timerelated GHG emissions at the same time
43
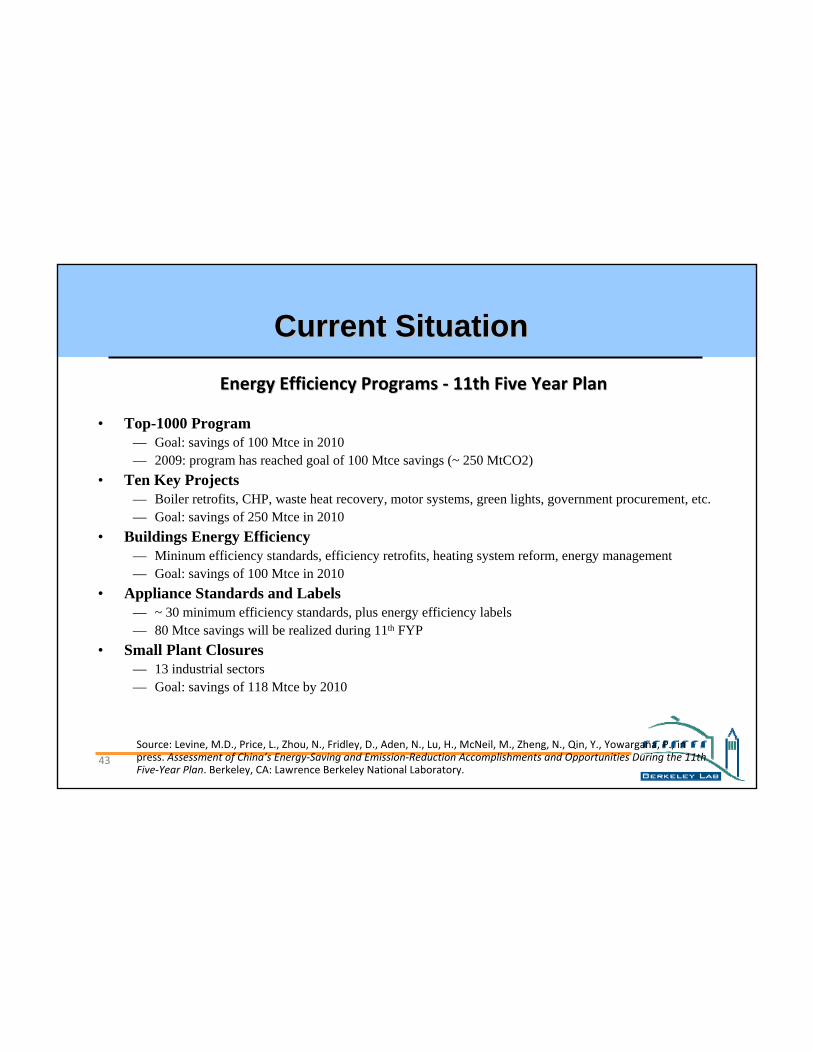
Current SituationCurrent Situation
• Top-1000 Program— Goal: savings of 100 Mtce in 2010— 2009: program has reached goal of 100 Mtce savings (~ 250 MtCO2)
• Ten Key Projects— Boiler retrofits, CHP, waste heat recovery, motor systems, green lights, government procurement, etc.— Goal: savings of 250 Mtce in 2010
• Buildings Energy Efficiency— Mininum efficiency standards, efficiency retrofits, heating system reform, energy management— Goal: savings of 100 Mtce in 2010
• Appliance Standards and Labels— ~ 30 minimum efficiency standards, plus energy efficiency labels— 80 Mtce savings will be realized during 11th FYP
• Small Plant Closures— 13 industrial sectors— Goal: savings of 118 Mtce by 2010
Energy Efficiency Programs Energy Efficiency Programs -- 11th Five Year Plan11th Five Year Plan
Source: Levine, M.D., Price, L., Zhou, N., Fridley, D., Aden, N., Lu, H., McNeil, M., Zheng, N., Qin, Y., Yowargana, P., in press. Assessment of China’s Energy-Saving and Emission-Reduction Accomplishments and Opportunities During the 11th Five-Year Plan. Berkeley, CA: Lawrence Berkeley National Laboratory.

4444
Recent Achievements in ChinaRecent Achievements in China• Economic growth and energy consumption decoupled
• Energy intensity decreases
—1.69% in 2006
—3.66% in 2007
—4.59% in 2008
• 20% energy/GDP target will be difficult to meet because of increase in heavy industry in 2009; however, China is likely to achieve 17%-19% reduction
.

2006:1.8% Decrease
2007:4.04% Decrease
2008:5.2% Decrease
45 Source: National Bureau of Statistics, China Statistical Abstract, various years.
1980-2002:Average Annual Decline of
5% per year
Current SituationCurrent Situation
2002-2005:Average Annual Increase of
5% per year
The story will be continued, as China pursues all avenues to meet its demand for energy services while continuing its policy of aggressively promoting energy
efficiency

Myths and Realities about Energy and Energy-Related CO2 Emissions in China

Motivation for Discussion of Myths讨论有关中国迷思的原因讨论有关中国迷思的原因
• Co-operation between the U.S. and China on reducing CO2 emissions is essential
• 中美之间的合作对降低CO2排放是至关重要的
• This requires trust between the two countries
• 这种合作需要中美之间的信任
• Mistrust of China in the United States on the topic of climate change is fueled by rampant misinformation
• 大量的错误信息加剧了中美之间在气候变化问题上的不信任
• Thus, dispelling these myths is of high importance
• 因此,打破这些迷思是非常重要的

Myth: China’s subsidized energy prices give firms a competitive edge迷思:中国对能源价格的补贴将给公司竞争优势Reality: China’s energy prices are mostly at international levels or higher现状:中国的能源价格几乎处于国际水平或者更高
0
20
40
60
80
100
120
140
160
180
200
1980 1982 1984 1986 1988 1990 1992 1994 1996 1998 2000 2002 2004 2006
2000
= 10
0
Overall Industry
Power
Coal
Petroleum
Index of Industry and Energy Prices工业和能源价格指数
Residents of Guangzhou pay more ($0.16/kWh) for electricity than residents of San Francisco广州的居民电费($0.16美元/度)比旧金山居民电费更高
Natural gas prices in Shanghai are the same as in San Francisco ($10/mcf)上海的天然气价格与旧金山的天然气价格相同($10美元/1000立方英寸)
Coal prices in China ($147/t) are now higher than in the US中国的煤炭价格($147美元/吨)比美国的价格更高
整体工业
电力
煤炭
石油

Myth: China is profligate in its use of energy and becoming more so迷思:中国挥霍地使用能源并变得更加浪费Reality: Per capita energy use in China is only 1/8 U.S. & 1/4 EU现状:中国的人均能耗量仅为美国的1/8,和欧盟的1/4
美国 西欧 中国
人均百万B
TUs

Myth: China is hogging the world’s oil imports迷思:中国正在抢夺世界的石油进口资源Reality: China’s imports, while growing, remain a very small part of traded oil on world markets现状:中国的石油进口,虽然在增长,仍然仅为世界石油贸易市场上的一小部分

Myth: China’s vast consumption of coal dwarfs any global attempt to address climate change emissions迷思:中国大量的消耗煤炭使得全球任何减缓气候变化的努力大大降低Reality: On a per capita basis, China consumes just slightly more than half as much coal as the U.S.! 现状:在人均水平上,中国消耗的煤炭仅为美国水平的一半多一点!
人均煤炭消耗(吨石油当量/
每人)

THE END(almost)

Environmental Energy Technologies4/22/2010 , p. 54
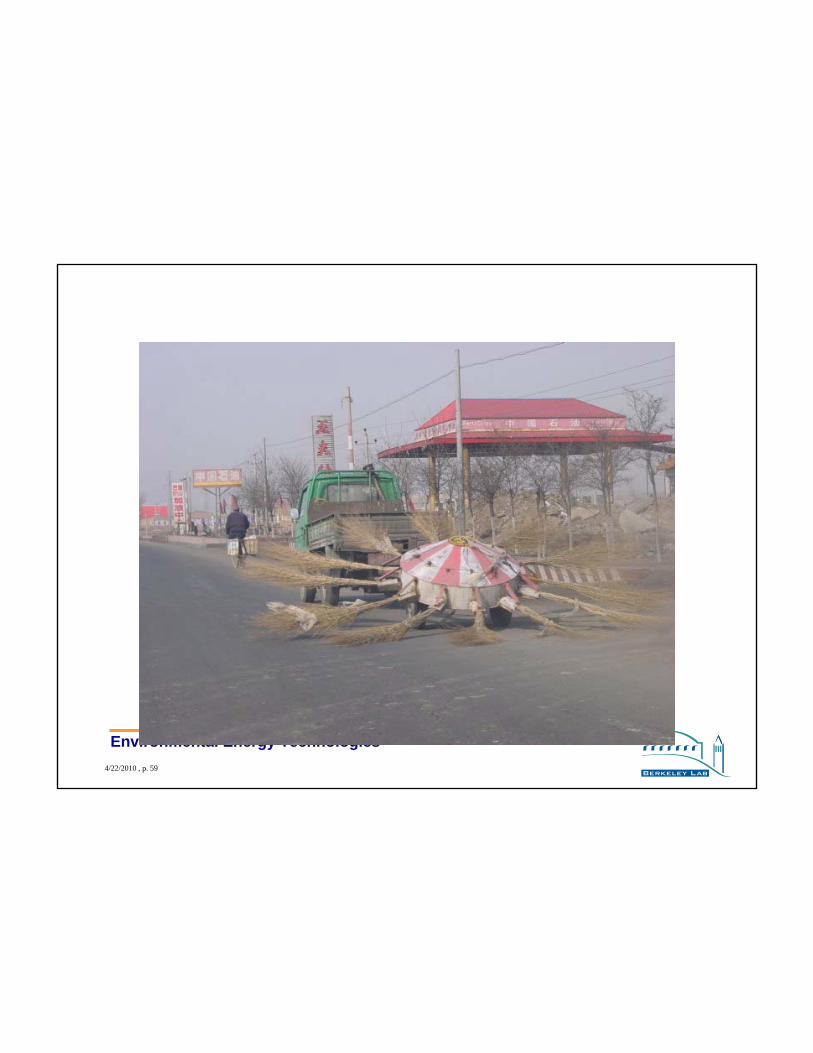
The Reason for My Optimism:
Skills Only Found in China

Environmental Energy Technologies4/22/2010 , p. 55

Environmental Energy Technologies4/22/2010 , p. 56

Environmental Energy Technologies4/22/2010 , p. 57

Environmental Energy Technologies4/22/2010 , p. 58
Environmental Energy Technologies4/22/2010 , p. 59

Environmental Energy Technologies4/22/2010 , p. 60