energy efficiency as a low-cost resource for achieving carbon
TRANSCRIPT
A RESOURCE OF THE NATIONAL ACTION PLAN
FOR ENERGY EFFICIENCY
SEPTEMBER 2009
Energy Effi ciency as a Low-Cost
Resource for Achieving Carbon
Emissions Reductions

About This Document
This paper, Energy Effi ciency as a Low-Cost Resource for Achieving Carbon Emissions Reductions, is provided to assist utility regulators, gas and electric utilities, and others in meeting the National Action Plan for Energy Effi ciency’s goal of achieving all cost-effective energy effi ciency by 2025.
This paper summarizes the scale and economic value of energy effi -ciency for reducing carbon emissions and discusses the barriers to achieving the potential for cost-effective energy effi ciency. It also reviews current regional, state, and local approaches for including energy effi ciency in climate policy, using these approaches to inform a set of recommendations for leveraging energy effi ciency within state climate policy. The paper does not capture federal climate policy options or recommendations, discussion of tradable energy effi ciency credits, or emissions impacts of specifi c energy effi ciency measures or programs.
The intended audience for the paper is any stakeholder interested in learning more about how to advance energy effi ciency as a low-cost resource to reduce carbon emissions. All stakeholders, including state policy-makers, public utility commissions, city councils, and utilities, can use this paper to understand the key issues and terminology, as well as the approaches that are being used to reduce carbon emissions by advancing energy effi ciency policies and programs.

Energy Efficiency as a Low-Cost Resource for Achieving Carbon
Emissions Reductions
A RESOURCE OF THE NATIONAL ACTION PLAN FOR ENERGY EFFICIENCY
SEPTEMBER 2009

The Leadership Group of the National Action Plan for Energy Efficiency is committed to taking action to increase investment in cost-effective energy efficiency. Energy Efficiency as a Low-Cost Resource for Achieving Carbon Emissions Reductions was developed under the guidance of and with input from the Leadership Group. The document does not necessarily represent a consensus view and does not represent an endorsement by the organizations of Leadership Group members.
Energy Efficiency as a Low-Cost Resource for Achieving Carbon Emissions Reductions is a product of the National Action Plan for Energy Efficiency and does not reflect the views, policies, or otherwise of the federal government. The role of the U.S. Department of Energy and U.S. Environmental Protection Agency is limited to facilitation of the Action Plan.
If this document is referenced, it should be cited as:
National Action Plan for Energy Efficiency (2009). Energy Efficiency as a Low-Cost Resource for Achieving Carbon Emissions Reductions. Prepared by William Prindle, ICF International, Inc. <www.epa.gov/eeactionplan>
For More Information
Regarding Energy Efficiency as a Low-Cost Resource for Achieving Carbon Emissions Reductions, please contact:
Joe Bryson U.S. Environmental Protection Agency
Office of Air and Radiation Climate Protection Partnerships Division
Tel: (202) 343-9631 E-mail: [email protected]
Regarding the National Action Plan for Energy Efficiency, please contact:
Stacy Angel U.S. Environmental Protection Agency Office of Air and Radiation Climate Protection Partnerships Division Tel: (202) 343-9606 E-mail: [email protected]
Larry Mansueti U.S. Department of Energy Office of Electricity Delivery and Energy Reliability Tel: (202) 586-2588 E-mail: [email protected]
or visit www.epa.gov/eeactionplan

National Action Plan for Energy Efficiency i
Table of Contents
List of Figures ...............................................................................................................................iii
List of Tables.................................................................................................................................iii
List of Abbreviations and Acronyms............................................................................................. iv
Acknowledgements....................................................................................................................... v
Executive Summary ................................................................................................ ES-1
Findings and Recommendations.........................................................................................ES-4
Achieving All Cost-effective Energy Efficiency—Vision for 2025 ........................................ES-5
1: Introduction ........................................................................................................ 1-1 1.1 Objectives of the Paper ...............................................................................................1-1 1.2 Structure of the Paper .................................................................................................1-4 1.3 Development of the Paper...........................................................................................1-4 1.4 Notes...........................................................................................................................1-4
2: The Size, Economic Value, and Emissions Impacts of Energy Efficiency Resources........................................................................................................... 2-1
2.1 Potential Studies for Energy Efficiency .......................................................................2-1 2.2 Efficiency Potential in Utility Resource Planning Studies ............................................2-5 2.3 Energy Efficiency Resources in Current Program Portfolios.......................................2-8 2.4 Energy Efficiency’s Potential Impact on CO2 Emissions ...........................................2-11 2.5 Summary of Findings ................................................................................................2-15 2.6 Notes.........................................................................................................................2-16
3: Costs and Benefits of Current Energy Efficiency Investments...................... 3-1 3.1 Cost of Saved Energy .................................................................................................3-1 3.2 Total Costs and Savings of Investment in Energy Efficiency Technologies and
Programs.....................................................................................................................3-2 3.3 Macro-Economic Benefits of Efficiency Resource Investments ..................................3-3 3.4 Investment Necessary to Achieve Economic Potential ...............................................3-3 3.5 Summary of Findings ..................................................................................................3-4 3.6 Notes...........................................................................................................................3-4
4: Limitations to Advancing Energy Efficiency Through Energy Pricing Policies................................................................................................................ 4-1
4.1 Market Barriers to Energy Efficiency ...........................................................................4-1 4.2 Regulatory Barriers .....................................................................................................4-3

ii Energy Efficiency as a Low-Cost Resource for Achieving Carbon Emissions Reductions
4.3 Price Elasticity .............................................................................................................4-3 4.4 Summary of Findings ..................................................................................................4-5 4.5 Notes...........................................................................................................................4-5
5: Summary of Energy Efficiency Policies and Programs.................................. 5-1 5.1 Addressing Market Barriers.........................................................................................5-1 5.2 Addressing Regulatory Barriers ..................................................................................5-7 5.3 Action Plan Vision for 2025 and Related Resources...................................................5-7 5.4 Summary of Findings ................................................................................................5-12 5.5 Notes.........................................................................................................................5-12
6: How Climate Policies and Programs Leverage Energy Efficiency ................ 6-1 6.1 Energy Efficiency Within Climate Policy Mechanisms.................................................6-1 6.2 Energy Efficiency as a Complementary Policy............................................................6-7 6.3 Summary of Findings ..................................................................................................6-7
7: Findings and Recommendations...................................................................... 7-1
Appendix A: National Action Plan for Energy Efficiency Leadership Group...... A-1
Appendix B: Glossary.............................................................................................. B-1
Appendix C: References.......................................................................................... C-1

National Action Plan for Energy Efficiency iii
List of Figures
Figure 2-1. Summary of Utility Energy Load Growth Forecasts Through 2013 With and Without Energy Efficiency Programs.....................................................................2-8
Figure 2-2. California Utilities’ Energy Efficiency Program Impacts, 2006–2008.....................2-10
Figure 2-3. Northwest Power and Conservation Council Efficiency Estimates ........................2-10
Figure 2-4. Efficiency Vermont 2007 Impacts ..........................................................................2-11
Figure 2-5. McKinsey Carbon Abatement Cost Curve.............................................................2-13
Figure 2-6. IPCC CO2 Emissions Abatement Estimates..........................................................2-14
Figure 2-7. CO2 Reductions From Energy Efficiency and Renewable Energy ........................2-14
Figure 6-1. Leveraging Energy Efficiency in State Climate Policies ..........................................6-2
List of Tables
Table ES-1. Overview of Existing Work on the Energy Efficiency Resource..........................ES-2
Table ES-2. Overview of Costs and Benefits of Energy Efficiency Programs ........................ES-3
Table ES-3. Policy/Program Options Matched to Markets......................................................ES-3
Table ES-4. Leveraging Energy Efficiency in State Climate Policies......................................ES-4
Table 1-1. National Action Plan for Energy Efficiency Tools by Implementation Goals .............1-2
Table 2-1. Selected U.S. Energy Efficiency Potential Studies ...................................................2-2
Table 2-2. Summary of Utilities' Progress Toward the WGA Clean and Diversified Energy Committee Goal of 20 Percent Reduction in Energy Consumption by 2020 .................................................................................................................2-7
Table 5-1. Policy/Program Options Matched to Markets ...........................................................5-2
Table 5-2. State Progress in Meeting the National Action Plan for Energy Efficiency Vision ....................................................................................................................5-8
Table 5-3. National Action Plan for Energy Efficiency Tools by Implementation Goals ...........5-11
Table 6-1. California Air Resources Board AB 32 Compliance Plan Summary .........................6-4
Table 6-2. States With Common Energy Efficiency Policies in Place as of October 2008 ........6-7

iv Energy Efficiency as a Low-Cost Resource for Achieving Carbon Emissions Reductions
List of Abbreviations and Acronyms
AB 32 Assembly Bill 32 ACEEE American Council for an Energy-Efficient Economy ARRA American Recovery and Reinvestment Act ASES American Solar Energy Society Btu British thermal unit CARB California Air Resources Board CEE Consortium for Energy Efficiency CEF (Scenarios for a) Clean Energy Future CIP Conservation Improvement Program CO2 carbon dioxide CPUC California Public Utilities Commission DOE U.S. Department of Energy EERS energy efficiency resource standard EIA U.S. Energy Information Administration EPA U.S. Environmental Protection Agency EPRI Electric Power Research Institute GHG greenhouse gas GWh gigawatt-hour IEA International Energy Agency IPCC Intergovernmental Panel on Climate Change kW kilowatt kWh kilowatt-hour MGA Midwestern Governors Association MPO Metropolitan Planning Organization NWPCC Northwest Power and Conservation Council NYSERDA New York State Energy Research and Development Authority OECD Organisation for Economic Co-operation and Development PGE Portland General Electric PG&E Pacific Gas and Electric Company PSCo Public Service of Colorado PSE Puget Sound Energy RGGI Regional Greenhouse Gas Initiative SCE Southern California Edison SDG&E San Diego Gas and Electric Company WCI Western Climate Initiative WGA Western Governors’ Association

National Action Plan for Energy Efficiency v
Acknowledgements
This paper, Energy Efficiency as a Low-Cost Resource for Achieving Carbon Emissions Reductions, is a key product of the National Action Plan for Energy Efficiency. In addition to review and comment by the Action Plan Leadership Group (see Appendix A), this paper was prepared with the valuable input of an advisory group. Advisory group members include:
Lynn Anderson, Idaho Public Utilities Commission Jasmin Ansar, Pacific Gas & Electric Sheryl Carter, Natural Resources Defense Council Daniel Francis, American Electric Power Clay Nesler, Johnson Controls Jolyn Newton, Tennessee Valley Authority Paul Sotkiewicz, PJM Interconnection Dick Stevie, Duke Energy Rick Tempchin, Edison Electric Institute
Bill Prindle of ICF International served as the primary author of the paper, under contract to the U.S. Environmental Protection Agency (EPA). Rich Sedano of the Regulatory Assistance Project provided his expertise during review and editing of this paper.
The U.S. Department of Energy (DOE) and EPA facilitate the National Action Plan for Energy Efficiency. Key staff include Larry Mansuetti (DOE Office of Electricity Delivery and Energy Reliability); Dan Beckley (DOE Office of Energy Efficiency and Renewable Energy); and Kathleen Hogan, Joe Bryson, Katrina Pielli, and Stacy Angel (EPA Climate Protection Partnerships Division).
Eastern Research Group, Inc. provided copyediting, graphics, and production services.


National Action Plan for Energy Efficiency ES-1
Executive Summary
This paper examines the role of energy efficiency in addressing global climate change. It summarizes research on the size, economic value, and carbon dioxide (CO2) emissions reduction impacts of efficiency resources, reviews available information on the benefits and costs of energy efficiency, discusses the factors that limit efficiency investment in today’s markets, and outlines energy efficiency policy and programs in use today that can be further expanded, including climate policy applications. The paper concludes that efficiency’s potential contribution to reducing CO2 emissions and reducing the cost of climate policies is large, requires action, and should be part of climate policy designs at all levels of government. This paper is provided to assist organizations in meeting the National Action Plan for Energy Efficiency’s goal to achieve all cost-effective energy efficiency by 2025.
Investment in energy efficiency combats global climate change in two primary ways. First: simply put, “the less energy used, the fewer emissions produced.” Second, cost-effective energy efficiency achieves these environmental benefits at low cost, and thus can reduce the economic costs of achieving climate policy goals.
To improve the understanding of the role of energy efficiency in addressing global climate change and many of the policy steps necessary to employ energy efficiency toward this end, this paper summarizes:
Existing work on the magnitude, benefits, and costs of the energy efficiency resource in the United States. This paper examines more than a dozen potential studies, resource planning documents, and energy efficiency program evaluations (see Table ES-1). A particular emphasis is placed on studies that evaluate the potential for energy efficiency to cost-effectively reduce CO2 emissions. From these and additional studies, the costs and benefits of energy efficiency programs currently underway are also summarized (see Table ES-2).
Key barriers that limit investment in energy efficiency to a fraction of its cost-effective potential. This paper explores the rationale for energy efficiency policy and program interventions by discussing the nature and extent of market and regulatory barriers that keep energy end-use markets from adopting cost-effective energy efficiency. These include the principal-agent barrier that shows up in new buildings and rental property markets and the transaction-cost barrier that affects many smaller customers and transactions. Regulatory barriers include the fragmented nature of planning and resource decision-making in energy markets, as well as ratemaking practices that create disincentives for utilities to invest in customer energy efficiency. The paper also discusses the limitations of energy prices as a driver for energy efficiency investment due to price inelasticity, which largely results from these market and regulatory barriers.
Energy efficiency policies and programs. This paper summarizes the policies and programs that federal, state, and local governments are using to require or encourage efficiency investment. (Table ES-3 provides a snapshot of these options.) It also lists Action Plan tools and resources that can support agencies and program administrators in developing and implementing these policy and program options.
ES-2 Energy Efficiency as a Low-Cost Resource for Achieving Carbon Emissions Reductions
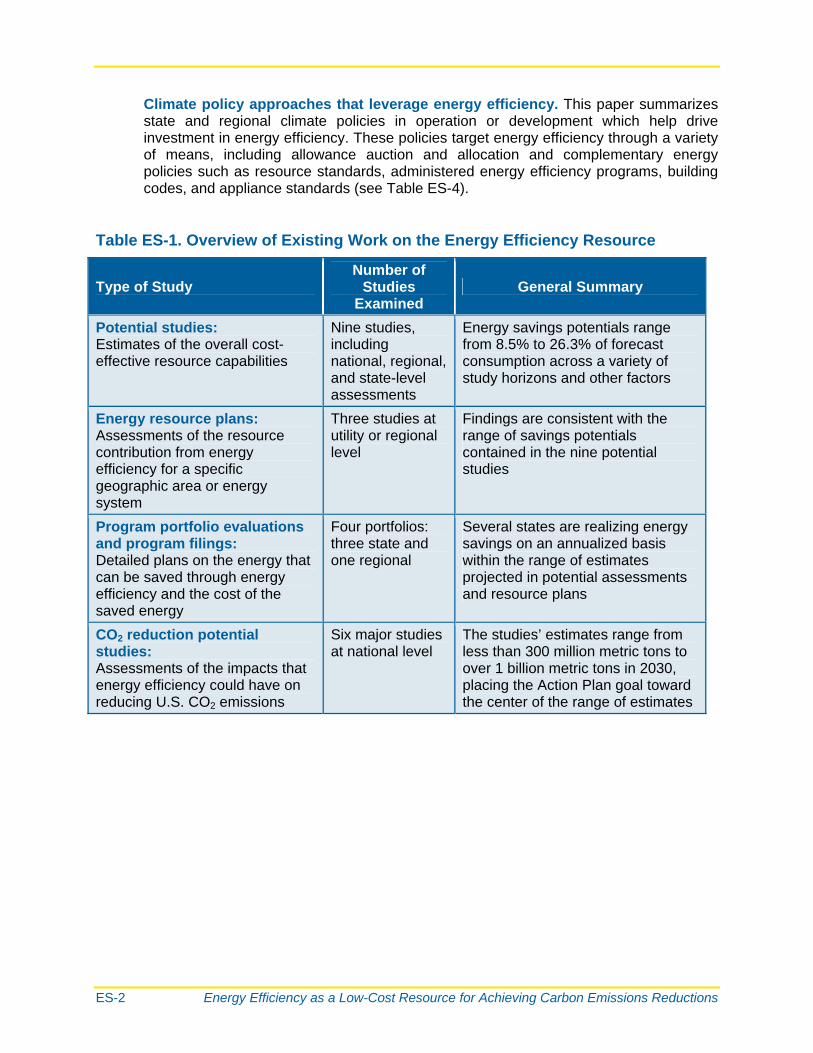
Climate policy approaches that leverage energy efficiency. This paper summarizes state and regional climate policies in operation or development which help drive investment in energy efficiency. These policies target energy efficiency through a variety of means, including allowance auction and allocation and complementary energy policies such as resource standards, administered energy efficiency programs, building codes, and appliance standards (see Table ES-4).
Table ES-1. Overview of Existing Work on the Energy Efficiency Resource
Type of Study Number of
Studies Examined
General Summary
Potential studies: Estimates of the overall cost-effective resource capabilities
Nine studies, including national, regional, and state-level assessments
Energy savings potentials range from 8.5% to 26.3% of forecast consumption across a variety of study horizons and other factors
Energy resource plans: Assessments of the resource contribution from energy efficiency for a specific geographic area or energy system
Three studies at utility or regional level
Findings are consistent with the range of savings potentials contained in the nine potential studies
Program portfolio evaluations and program filings: Detailed plans on the energy that can be saved through energy efficiency and the cost of the saved energy
Four portfolios: three state and one regional
Several states are realizing energy savings on an annualized basis within the range of estimates projected in potential assessments and resource plans
CO2 reduction potential studies: Assessments of the impacts that energy efficiency could have on reducing U.S. CO2 emissions
Six major studies at national level
The studies’ estimates range from less than 300 million metric tons to over 1 billion metric tons in 2030, placing the Action Plan goal toward the center of the range of estimates

National Action Plan for Energy Efficiency ES-3
Table ES-2. Overview of Costs and Benefits of Energy Efficiency Programs
Cost/Benefit Measure Number of
Studies Examined
General Summary
Cost of saved energy (annualized)
Six 1.2–5.2 cents per saved kWh
Total program costs and savingsa
Two About $2 billion annually, equivalent to about 0.5% of utility revenues as of 2006; savings of about 63 billion kWh (about 2% of retail sales) and 135 million therms (about 0.1% of retail sales) as of 2006
Macroeconomic benefits (increases in gross economic output, jobs, and additional personal income)
Three Economic benefits in the range of $250 billion through 2030
Source: Values derived from ACEEE (Eldridge et al., 2008) and CEE (Nevius et al., 2008), as estimated for the Action Plan’s Vision for 2025 (National Action Plan for Energy Efficiency, 2008). a Note that these savings and costs apply only to administered programs. They do not include savings
and costs related to other efficiency policies such as building codes and appliance standards, and also do not capture private efficiency investment from non-participants in administered programs. The energy savings are cumulative, representing savings from multiple years, while the costs are annual.
Table ES-3. Policy/Program Options Matched to Markets
Market Focus
Policy/Program Option Individual Products
New Construction
Existing Buildings/ Facilities
Mandatory appliance standards X
Product labeling X
Voluntary appliance standards X
Minimum building codes X
Voluntary building standards X
Building labeling/benchmarking X X
Retrofit programs X
Education and outreach X X X
Government lead-by-example X X X
Administered energy efficiency programs
X X X

ES-4 Energy Efficiency as a Low-Cost Resource for Achieving Carbon Emissions Reductions
Table ES-4. Leveraging Energy Efficiency in State Climate Policies
State Climate Policy Leveraging Energy Efficiency Number of States
with Policy in Place
GHG allowance revenue from GHG cap and trade used to expand funding of energy efficiency programs
10
State climate change action plans that highlight the potential role for energy efficiency policy and programs
32
Sources: <http://epa.gov/climatechange/wycd/stateandlocalgov/state_planning.html> and <http://www.raponline.org/Slides/DF-RGGI_for_VLS_Parenteau_Class-10Apr09.pdf>.
Note: These totals were current as of August 2008.
Findings and Recommendations
This paper presents the following key findings:
Energy efficiency is a large and low-cost energy resource that can save on the order of 20 percent of end-use energy consumption and costs substantially less than new supply resources.
Efficiency is also a large and low-cost carbon abatement resource. If tapped in substantial quantities, efficiency can help achieve CO2 emissions reduction goals and lower the costs of doing so—whether or not specific climate policies are in effect.
Due to market and regulatory barriers and the limits of price elasticity, energy prices alone are not likely to accelerate efficiency investment at the rate needed to realize efficiency’s economic potential.
Targeted energy efficiency policies and programs are needed to reduce market and regulatory barriers and thereby increase energy efficiency investment. Proven policy and program options are available to address a range of barriers.
On a national basis, harvesting cost-effective efficiency resources could justify several-fold increases in current efficiency program budgets. Investment in efficiency is at a fraction of the level necessary to realize a high percentage of efficiency potential.
Many states and local governments have made energy efficiency central to their greenhouse gas reduction strategies through targeted policies and programs. The Action Plan’s Vision for 2025 and supporting tools and resources offer important policy frameworks and assistance for capturing the low-cost energy efficiency resources.
Based on these findings, key recommendations are as follows:
Energy efficiency should be a cornerstone of energy and/or climate policies at all levels of government, based on its proven status as a cost-effective option for reducing CO2 emissions and reducing the cost of climate policies.

National Action Plan for Energy Efficiency ES-5
Energy efficiency policies and programs should be pursued expeditiously, with an emphasis on establishing the necessary policy foundation for capturing all cost-effective energy efficiency as outlined in the Vision for 2025.
Achieving All Cost-effective Energy Efficiency—Vision for 2025
This paper has been developed to help parties pursue the key policy recommendations of the National Action Plan for Energy Efficiency and its Vision for 2025 implementation goals. As part of its Vision, the Action Plan Leadership Group identified integrating energy efficiency considerations into policies to limit emissions of greenhouse gases as one of the six key related state, regional, and national policies that can help achieve all cost-effective energy efficiency by 2025 (National Action Plan for Energy Efficiency, 2008a, Chapter 4). For information on the full suite of policy and programmatic options to remove barriers to energy efficiency, see the Vision for 2025 and the various other Action Plan papers and guides available at www.epa.gov/eeactionplan.


National Action Plan for Energy Efficiency 1-1
1: Introduction
Global climate change challenges us to transform the ways in which we generate and use energy. Based on the findings of the world’s climate scientists and mitigation experts, substantial emissions reductions are necessary to avoid significant changes in the earth’s atmosphere with severe consequences for human health and the global environment. The most recent consensus findings of the Intergovernmental Panel on Climate Change (IPCC) state that greenhouse gas (GHG) emissions need to be reduced by 50 to 85 percent by 2050 to avoid global temperature rise of 2.5 degrees Celsius or more, and global GHG emissions must stop rising no later than 2015 (IPCC, 2007). With the majority of government leaders taking steps to act on these findings, there are intensified efforts in many nations to develop low-cost emissions reduction options in the near term. This puts energy efficiency in the climate policy spotlight as a near-term, low-cost resource for reducing the growth in carbon emissions and lowering the ultimate cost of reducing GHG emissions.
Energy efficiency provides multiple public benefits regardless of its carbon emissions impacts. It reduces home and business energy costs, improves productivity, stimulates economic growth, reduces energy market prices, improves energy system reliability, reduces criteria air pollutant emissions, and enhances national energy security. Savings from reduced energy consumption typically outweigh the cost of the energy efficiency investment. Thus, efficiency reduces the overall cost of energy services. Energy consumption per dollar of U.S. economic output has fallen by half since the 1970s, fueling sustained economic growth and softening the economic damage from recent energy price surges. Efficiency has become a quiet engine of prosperity for the United States and other economies, and is at the forefront of a new wave of clean energy investment that can support continued prosperity along with energy security and environmental protection (Ehrhardt-Martinez and Laitner, 2008; EPA, 2006; and National Action Plan for Energy Efficiency, 2008a).
Increased energy efficiency investment combats global climate change in two primary ways. First, simply put, “the less energy used, the fewer emissions produced.” While this general statement overlooks the more complex relationships between energy efficiency and carbon dioxide (CO2) emissions, it places energy efficiency in a core role for future energy and climate policies and programs. Second, cost-effective energy efficiency achieves these environmental benefits at low cost, and thus can reduce the economic costs of achieving climate policy goals.
1.1 Objectives of the Paper
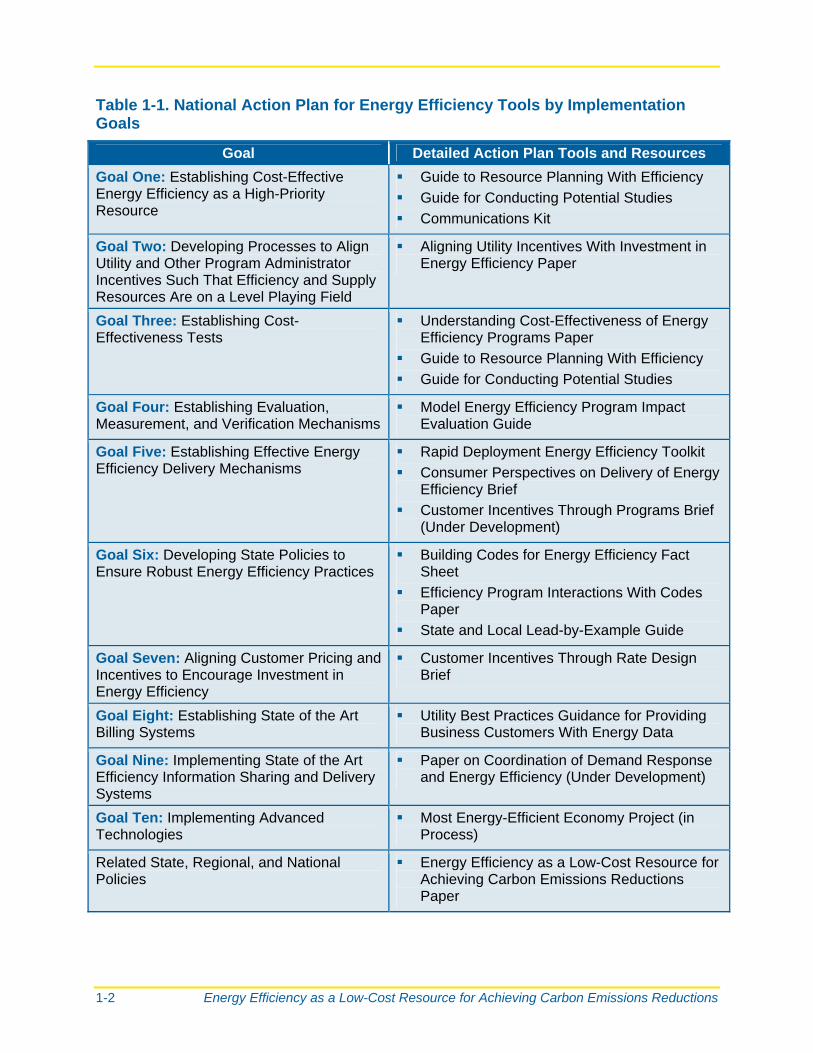
This paper has been developed to help parties pursue the key policy recommendations of the Action Plan and its Vision for 2025 implementation goals. As part of its Vision, the Action Plan’s Leadership Group identified integrating energy efficiency considerations into policies to limit emissions of GHGs as one of the six key related state, regional, and national policies to achieving all cost-effective energy efficiency by 2025. While energy efficiency’s potential to achieve low-cost reductions in CO2 emissions has been mentioned in earlier Action Plan materials, CO2 impacts have been addressed only in a general way as one of many societal benefits. Accordingly, the Leadership Group made it a priority to develop this issue paper, presenting more explicit information that will help states, utilities, and other stakeholders address climate change through a variety of policy and program mechanisms. This paper is part of the comprehensive suite of papers, resources, and tools available to all parties taking action to advance all cost-effective energy efficiency by 2025 (see Table 1-1).
1-2 Energy Efficiency as a Low-Cost Resource for Achieving Carbon Emissions Reductions
Table 1-1. National Action Plan for Energy Efficiency Tools by Implementation Goals
Goal Detailed Action Plan Tools and Resources
Goal One: Establishing Cost-Effective Energy Efficiency as a High-Priority Resource
Guide to Resource Planning With Efficiency
Guide for Conducting Potential Studies
Communications Kit
Goal Two: Developing Processes to Align Utility and Other Program Administrator Incentives Such That Efficiency and Supply Resources Are on a Level Playing Field
Aligning Utility Incentives With Investment in Energy Efficiency Paper
Goal Three: Establishing Cost-Effectiveness Tests
Understanding Cost-Effectiveness of Energy Efficiency Programs Paper
Guide to Resource Planning With Efficiency
Guide for Conducting Potential Studies
Goal Four: Establishing Evaluation, Measurement, and Verification Mechanisms
Model Energy Efficiency Program Impact Evaluation Guide
Goal Five: Establishing Effective Energy Efficiency Delivery Mechanisms
Rapid Deployment Energy Efficiency Toolkit
Consumer Perspectives on Delivery of Energy Efficiency Brief
Customer Incentives Through Programs Brief (Under Development)
Goal Six: Developing State Policies to Ensure Robust Energy Efficiency Practices
Building Codes for Energy Efficiency Fact Sheet
Efficiency Program Interactions With Codes Paper
State and Local Lead-by-Example Guide
Goal Seven: Aligning Customer Pricing and Incentives to Encourage Investment in Energy Efficiency
Customer Incentives Through Rate Design Brief
Goal Eight: Establishing State of the Art Billing Systems
Utility Best Practices Guidance for Providing Business Customers With Energy Data
Goal Nine: Implementing State of the Art Efficiency Information Sharing and Delivery Systems
Paper on Coordination of Demand Response and Energy Efficiency (Under Development)
Goal Ten: Implementing Advanced Technologies
Most Energy-Efficient Economy Project (in Process)
Related State, Regional, and National Policies
Energy Efficiency as a Low-Cost Resource for Achieving Carbon Emissions Reductions Paper

National Action Plan for Energy Efficiency 1-3
This paper supplements existing Action Plan materials that address CO2 emissions in the context of methods for resource planning1 and establishing the business case for energy efficiency.2 It focuses more fully on energy efficiency in a climate policy context, exploring the role of state-level policies in increasing investment in energy efficiency across the nation’s buildings and industrial facilities. Policy options include building codes, state-level appliance standards, voluntary standards, labeling and rating, administered energy efficiency programs, and utility regulatory policies that support investment in energy efficiency where cost-effective.
The paper’s key objectives are to:
Summarize research and analysis on the magnitude and cost of the energy efficiency resource in the United States, especially with respect to its potential to cost-effectively reduce CO2 emissions.
Inventory and summarize the current range of policy and program approaches that seek to leverage energy efficiency as part of GHG reduction strategies across the United States, focusing on state and regional efforts.
Describe the nature and magnitude of the major market and regulatory barriers that currently prevent energy efficiency from realizing its full economic potential.
Briefly summarize the suite of energy efficiency policies and programs that can reduce these key market and regulatory barriers and help capture a larger portion of the available cost-effective potential, referencing the tools and resources offered by the Action Plan as appropriate.
Further, through review and synthesis of numerous studies and other information sources, this paper provides support for the following conclusions:
Energy efficiency is a relatively large and low-cost carbon abatement resource in the United States.
Current U.S. investment levels in energy efficiency tap only a small amount of the available low-cost energy efficiency.
If developed substantially beyond current investment levels, energy efficiency can lower the costs of achieving GHG reductions.
Increased energy prices alone (stemming from policies requiring GHG emissions reductions) will not accelerate efficiency investment sufficiently to tap the majority of efficiency’s economic potential. This is due not only to market and regulatory barriers, but also to the limits of price inelasticity of energy consumption in many end-use markets.
Market and regulatory barriers can be reduced through targeted energy efficiency policies and programs, with the effect of increasing energy efficiency investment, reducing GHG emissions, and reducing the overall economic cost of climate policies.
Many state and local governments, recognizing the important role of energy efficiency in their GHG reduction strategies, have pursued targeted policies and other initiatives to

1-4 Energy Efficiency as a Low-Cost Resource for Achieving Carbon Emissions Reductions
advance energy efficiency. A review of these initiatives provides useful information for policy-makers at all levels of government.
1.2 Structure of the Paper
The paper discusses these topics as outlined below:
Chapter 1. The size and economic value of the energy efficiency resource and its potential to cost-effectively reduce CO2 emissions.
Chapter 2. Current costs and benefits of investments in energy efficiency.
Chapter 3. The limitations to advancing energy efficiency through price mechanisms alone.
Chapter 4. Summary of energy efficiency policies and programs that advance low-cost energy efficiency.
Chapter 5. Review of current climate policies across the United States that explicitly employ energy efficiency.
Chapter 6. Summary of findings and recommendations.
1.3 Development of the Paper
Energy Efficiency as a Low-Cost Resource for Achieving Carbon Emissions Reductions is a product of the National Action Plan for Energy Efficiency. A conceptual outline and drafts of this paper were prepared with direction and comment by the Action‘s Plan Leadership Group (see Appendix A for a list of group members), as well as the valuable input of an Advisory Group (see the “Acknowledgements” section for a list of members). Bill Prindle of ICF International served as project manager and primary author of the paper under contract to the U.S. Environmental Protection Agency (EPA).
1.4 Notes
1 See Chapter 1 and Chapter 3 of National Action Plan for Energy Efficiency (2006), as well as National Action Plan for Energy Efficiency (2007c).
2 See Chapter 4 of National Action Plan for Energy Efficiency (2006).

National Action Plan for Energy Efficiency 2-1
2: The Size, Economic Value, and Emissions Impacts of Energy Efficiency Resources
This chapter reviews recent leading studies and materials that assess the potential for energy efficiency to provide low-cost reductions in CO2 emissions. It summarizes these studies, highlights key considerations, and presents key findings.
The scale of the energy efficiency resource as a low-cost abatement option for CO2 emissions can be assessed by examining studies and planning documents that fall into the following categories:
Energy efficiency potential studies that estimate the overall cost-effective resource capability for energy efficiency to provide energy, economic, and environmental benefits for various energy types, timeframes, and geographic areas.
Energy resource plans that assess the specific role energy efficiency can play in meeting energy needs for a specific geographic area or energy system. These plans often draw on potential studies, but apply them in a more focused and constrained framework.
Energy efficiency program portfolio evaluations and program filings that offer detailed plans on the energy that can be saved through energy efficiency and the cost of the saved energy.
Studies designed specifically to assess the CO2 reduction potential of energy efficiency, building upon the overall energy efficiency potential studies.
2.1 Potential Studies for Energy Efficiency
Numerous potential studies have been undertaken over the last decade to assess the availability and cost of energy efficiency. These studies have been performed at the national, regional, and state levels and employ various screens (e.g., technically feasible, economically feasible, programmatically achievable) to assess the energy efficiency resource. Selected leading analyses are highlighted in Table 2-1.
The examples summarized in Table 2-1 vary considerably in absolute savings. Several key factors account for this variation. They include the following:
Sectors, geographic scope, and fuels covered. These studies vary from national to state-level in scope. In terms of sectors studied, they range from economy-wide—including all four key economic sectors (i.e., residential, commercial, industrial, and transportation)—to a focus on those sectors using electricity. They also differ based on the fuels covered. For example, the McKinsey analysis is U.S. economy–wide and covers all fuels. Other studies are state-wide or regional in scope, and many focus primarily on electricity.

2-2 Energy Efficiency as a Low-Cost Resource for Achieving Carbon Emissions Reductions
Table 2-1. Selected U.S. Energy Efficiency Potential Studies
Study Author, Date, and Title
Savings Potential
(achievable unless noted)a
Timeframeb Annualized
Savingsc Scope
McKinsey & Company (2009). Unlocking Energy Efficiency in the U.S. Economy.
23% (economic)
2020 ~2%/year National
All fuels
Economic potential only
Itron (2006). California Energy Efficiency Study. CALMAC Study ID: PGE0211.01
7.5% (electricity) 4.4% (gas)
2016 <1%/year (electricity) ~0.5%/year (gas)
California
Electricity and gas
Technical, economic, and achievable potential
Limited to programs of investor-owned utilities
EPRI (2009). Assessment of Achievable Potential from Energy Efficiency and Demand Response Programs in the U.S. (2010–2030).
5%–8% (realistic to maximum achievable)
2030 <0.5%/year National
Electricity only
Technical, economic, and achievable potential
Limited to programs; excludes building codes or product standards
WGA (2006). Energy Efficiency Task Force Report. A report of the WGA Clean and Diversified Energy Initiative.
20% 2020 >1%/year 18 western states
Electricity only
Achievable potential only
ACEEE (2008). Energizing Virginia: Efficiency First.
19% 2025 >1%/year Virginia
Electricity only
Achievable potential only
Georgia Environmental Facilities Authority. 2005. Assessment of Energy Efficiency Potential in Georgia.
2.3%–8.7% (electricity) 1.8%–5.5% (gas)
2010 ~1%/year (electricity) ~0.7%/year (gas)
Georgia
Electricity and gas
Technical, economic, and achievable potential

National Action Plan for Energy Efficiency 2-3
Study Author, Date, and Title
Savings Potential
(achievable unless noted)a
Timeframeb Annualized
Savingsc Scope
NYSERDA (2003). Energy Efficiency and Renewable Energy Resource Development Potential in New York State.
16% 2022 <1%/year New York
Electricity only
Achievable potential only
Also addresses renewable electricity
ACEEE (2004). The Technical, Economic, and Achievable Potential for Energy Efficiency in the United States: A Meta-Analysis of Recent Studies.
24% (electricity) 9% (gas)
Various 1.2%/year (electricity) 0.5%/year (gas)
Meta-analysis of 11 reports
Includes national, regional, and state studies
Electricity and gas
Technical, economic, and achievable potential
a This table expresses savings potential as a percentage of a future year forecast of energy consumption. Percentages tend to vary based on the length of the time horizon; e.g., shorter timeframes tend to show smaller savings percentages. It is thus important to take the timeframe into account when comparing percentage estimates.
b To provide a more consistent basis for comparison of savings potential, this column presents a rough estimate to show energy savings on an annualized basis. This tends to even out the differences in timeframe among the various studies. However, these estimates are only approximate and are meant as indicative only.
c To provide a more consistent basis for comparison of savings potential, an estimate is made in this column to show energy savings on an annualized basis. This tends to normalize the differences in timeframe among the various studies. However, these estimates are only approximate and are meant as indicative only.

2-4 Energy Efficiency as a Low-Cost Resource for Achieving Carbon Emissions Reductions
Potential framework. Potential studies generally use at least one tier in a three-tier framework: technical potential, economic potential, and achievable (or market) potential (National Action Plan for Energy Efficiency, 2007b).
– Technical potential is based on the assumption that all major end-use devices and building components are replaced instantly with the best available technology, regardless of cost. This type of potential reflects the savings possible with today’s known technologies.
– Economic potential applies one or more economic tests or criteria, screening out measures that are not economically attractive. These criteria can vary from simple payback calculations to complex life-cycle benefit/cost tests.
– Achievable (or market) potential applies various constraints to economic potential, such as availability of funding, program delivery capacity, program design limits, market acceptance rates, and other factors. Many of the studies in Table 2-1 use various sub-definitions of what is achievable.
Timeframe. Some potential studies show lower potential savings in terms of absolute percentage numbers because their timeframes are shorter than other studies.’ For example, the Georgia study covers only five years, while the ACEEE Virginia study covers 17. To address differences in timeframes, Table 2-1 provides estimates of the annualized savings where possible.
Technology assumptions. Part of the variability of these studies’ results stems from differences in the energy efficiency measures selected for analysis and different assumptions about their cost and performance. Some use very detailed “bottom-up” methods of aggregating thousands of different efficiency measures; others use more aggregated or stylized characterizations of technology choices in various end-uses and markets.
Economic assumptions. Key parameters that drive variations in the findings for economic potential studies include the assumed discount rates used for present value analyses and the costs of avoided energy. Appropriate values for these factors can vary by geographic region and sector, among other considerations.
Technologies versus practices. Many potential studies are “widget-based,” which means they look at individual equipment measures that can improve the efficiency of specific products or systems. However, significant efficiencies can be found in systems and whole buildings through design and operating practices. Such improvements are harder to standardize, and they are left out of many studies. Including such approaches can improve efficiency potential study estimates on a technical or economic basis, though implementing them consistently in energy markets can be challenging—which can limit the achievable estimates for such approaches.
Policy and other “baseline” considerations. Studies vary considerably in their assumptions regarding the fraction of economic potential that can be achieved through existing market forces and policies. Market-based, autonomous trends driven by market forces such as energy prices and technology advancement can be projected to capture some fraction of economic potential. Policies and programs already in place can be projected to capture another fraction, leaving a remainder to be captured by additional or

National Action Plan for Energy Efficiency 2-5
incremental policies and programs. Some studies focus on what energy efficiency programs can achieve, such as the EPRI and Itron studies. Others, including the ACEEE and Georgia studies, consider a broader suite of policies such as mandatory building codes and product standards.
Technological change. Potential studies vary in their assumptions about changes in the costs and energy performance of end-use technologies over time. Some studies assume no change from current levels. Other studies assume varying degrees of change over time. The longer the timeframe accounted for in the study, the greater the impacts these assumptions will have.
While less extensive, the analytical literature on natural gas end-use energy savings is also part of the research record. Natural gas potential studies tend to show somewhat lower potential as a total fraction of gas consumption, in part because the number of end-uses for gas tends to be fewer in typical buildings, which limits the number of efficiency measures available for study. In addition, basic differences between natural gas and electricity end-use applications can limit efficiency potential based on current technologies.1
2.2 Efficiency Potential in Utility Resource Planning Studies
A number of utility or regional energy resource plans forecast energy savings from energy efficiency programs and policies, building upon the information contained in energy efficiency potential studies in many cases (National Action Plan for Energy Efficiency, 2007b, 2007c). Often referred to as integrated resource planning, these plans and their development processes have a periodic cycle and identify supply and demand resource options needed to meet utility customers’ future energy needs. Resource planning studies typically use many of the same data sources and analytical techniques applied in potential studies. The principal difference is that resource planning analysis uses timeframes, economic assumptions, and other factors specific to the utility service area.
Energy efficiency savings, when used in a resource plan, tend to be at the lower end of the energy efficiency potential spectrum. This is true for several reasons, including that the potential is typically limited to what can be achieved with the energy types of the utility and can be limited to the types of energy efficiency programs that utilities typically administer. These studies typically use conservative estimates of energy savings to be deemed realistic and reliable for the purposes of planning energy supply. Resource plans can also be built up from individual program designs; these programs may draw on some of the data in potential studies, but tend to use market-based estimates of what has been achieved through energy efficiency programs and funding projections to estimate expected impacts.
Below are brief summaries of selected recent studies showing the expected energy savings from energy efficiency as part of integrated resource planning.
Duke Energy. In 2007, Duke Energy Carolinas issued an energy efficiency potential study for North Carolina. It found a technical potential over a 20-year study period of 32 percent of forecast load. Economic potential over 20 years was projected at 18 percent of forecast load (Forefront Economics, Inc., H. Gil Peach and Associates, and PA Consulting Group, 2007). These numbers are comparable with a North Carolina Utilities Commission potential analysis conducted prior to the Duke study, which estimated technical potential of 33 percent and economic potential of 14 percent (GDS Associates, 2006), although the timeframe was shorter, 11 years vs. 20 years. These numbers are

2-6 Energy Efficiency as a Low-Cost Resource for Achieving Carbon Emissions Reductions
also comparable to those in the ACEEE meta-review of 11 studies that found median technical potential of 33 percent and median economic potential of 20 percent.
Western Governors’ Association (WGA). In 2005, WGA set a goal of reducing electricity usage by 20 percent in 2020 compared with baseline forecasts. In 2006, a report was issued comparing the resource plans of more than a dozen utilities in the western states with the WGA’s 20 percent goal. The report is one of very few attempts to compare efficiency components of utility resource plans across a large number of states and utilities. It found that some utility plans contained energy efficiency savings projections that would achieve a substantial fraction of the 20 percent goal, and others held much lower efficiency gains (Hopper et al., 2006). More specifically, the report shows that the California utilities, which have the most aggressive energy savings targets in the region, have efficiency resource plans expected to offset over 70 percent of forecast load growth, about 60 percent of capacity growth, and 10 percent of total energy consumption by 2013, the last year of the study timeframe (see Table 2-2) (Hopper et al., 2006). Further, they would reduce annual energy load growth by about 1 percent (see Figure 2-1) (Hopper et al., 2006).
Northwest Power and Conservation Council (NWPCC). The NWPCC is a unique organization, created by Congress in the 1980 Pacific Northwest Electric Power Planning and Conservation Act as a resource planning structure for the region served by the federal Bonneville Power Administration. While its authority does not extend to all retail utilities in the region, the Council’s planning process exerts substantial influence, and its resource plans are viewed as credible and authoritative. The Council’s Fifth Power Plan, issued in 2005, projects that cost-effective and achievable energy efficiency could reduce forecast load growth by just over 50 percent by 2025. This planning process includes a broad set of energy efficiency policies including codes and standards as well as utility-administered programs. The expected savings from energy efficiency in the future are in addition to substantial savings achieved through programs that have been in place for more than 20 years (see Figure 2-3).

National Action Plan for Energy Efficiency 2-7
Table 2-2. Summary of Utilities' Progress Toward the WGA Clean and Diversified Energy Committee Goal of 20 Percent Reduction in Energy Consumption by 2020
Plan Program Effects as Percent of Total Energy Requirements (%)a Utility
2008 2013
Avista 2.5 4.8
BC Hydrob 3.8 6.0
Idaho Power 0.4 0.9
Nevada Powerc 0.7 —
NorthWestern 2.9 5.9
PacifiCorp 1.9 3.4
PGEd 2.8 5.1
PSCo 1.4 2.8
PSEe 5.7 10.4
PG&Ef 5.0 10.1
SCEf 5.3 10.4
SDG&Ef 6.7 11.3
Sierra Pacificg 1.4 —
Source: Hopper et al., 2006.
Note: The authors made assumptions in calculating italicized values. Values in regular font are compiled directly from resource plan data. a Total energy requirements do not include load reductions from plan program effects or reserve margins. b BC Hydro’s plan only commits to implementing its PowerSmart-2 program through 2012; possible
continued savings from PowerSmart-3 are included for 2013. c Nevada Power only reported annual savings for 2004; this level of savings was assumed for each year
from 2004 through 2008. d PGE identifies plan program effects for 2005–2011; the 2013 value was extrapolated. e PSE values include residential fuel conversion programs; stand-alone energy-efficiency program
savings were not available. f The energy savings goals for the California utilities include all programs administered by the utilities,
including those offered to direct access customers. Some portion of savings from energy-efficiency standards is included in these goals, as the utilities administer programs to support their implementation.
g Sierra Pacific only reported annual savings for 2005; this level of savings was assumed for each year from 2004 through 2008.

2-8 Energy Efficiency as a Low-Cost Resource for Achieving Carbon Emissions Reductions
Figure 2-1. Summary of Utility Energy Load Growth Forecasts Through 2013 With and Without Energy Efficiency Programs
Source: Hopper et al., 2008.
In reviewing resource plans, it is important to be aware that these plans are developed using locally and or regionally specific information and guidelines. In the NWPCC planning process, efficiency is treated prominently, consistently, and transparently, and is included in the plan as achievable potential, not as the impacts of specific program portfolios. In most utility resource plans, efficiency impacts are based on estimates from programs likely to be implemented.
2.3 Energy Efficiency Resources in Current Program Portfolios
A number of states and utilities now have substantial experience deploying energy efficiency resources in comprehensive program portfolios, and the results of these efforts provide support for estimates of the savings that can be achieved through planned energy efficiency initiatives. The reported impacts from a sampling of these programs include:
California. The state’s three largest investor-owned electric utilities have just completed a three-year program cycle (2006–2008), driven by plans developed under the California Public Utilities Commission (CPUC). A snapshot of the companies’ cumulative savings impacts to date is shown in Figure 2-2.
Figure 2-2 shows the total gigawatt-hours (GWh) of energy savings estimated for each month from measures installed in that or prior months. “Committed” refers to savings

National Action Plan for Energy Efficiency 2-9
from projects that participated in programs in that month, but whose installation was not completed in that month. The installed savings in Figure 2-2 were reported in the CPUC Web-based reporting system, and represent about 3 percent of estimated 2008 investor-owned utility electricity sales. This means that, over the 2006–-2008 program period, savings are averaging about 1 percent of total sales for each year’s program efforts. This is consistent with the efficiency savings potential estimates in the studies summarized in Table 2-1.
Minnesota. The state’s Conservation Improvement Program (CIP) has continued fairly steadily for more than a decade. A 2005 report by the state’s Office of the Legislative Auditor found that the investor-owned utilities’ CIP savings totaled 328 million kilowatt-hours (kWh) in 2003 (Minnesota Office of the Legislative Auditor, 2005). This is about 0.8 percent of 2003 investor-owned utility electricity sales, which is also within the range of estimates found in the potential studies in Table 2-1.
Pacific Northwest. In the NWPCC Fifth Power Plan cited earlier, the Council estimates the impacts of regional energy efficiency programs operated since 1980. Figure 2-3 summarizes those estimates. While this figure includes the impacts of state building energy codes and federal appliance standards, the great majority of energy savings come from utility and Northwest Energy Efficiency Alliance programs. The 2000 average megawatts of energy savings, not including the savings from federal codes, are equal to about 7 percent of 2002 electricity sales. The annual savings over the last 10 years covered by the figure are close to 1 percent of sales.
Vermont. The Efficiency Vermont program, in which a single entity is contracted to deliver energy efficiency programs for the whole state, reports significant impacts from its programs. Efficiency Vermont estimates that its program portfolio saved about 103,000 megawatt-hours, or about 1.7 percent of total electricity sales in 2007, which is at the high end of efficiency potential estimates (Efficiency Vermont, 2008). This savings level is the highest to date and is the result of significantly higher levels of investment in energy efficiency programs. This level of savings is estimated to fully offset growth in electricity sales. Figure 2-4 illustrates the annual impacts of the Efficiency Vermont program since 2000. Figure 2-4 also offers a result that might be unexpected: at higher levels of energy efficiency savings, the amount saved per dollar spent goes up. While it is intuitive to expect that the “law of diminishing returns” would eventually reduce the savings yield per dollar, energy efficiency programs demonstrate that economies of scale may also influence the savings yield per dollar.
These estimates of savings from energy efficiency typically represent the savings achievable through utility- or state-administered programs. The Pacific Northwest stands out as an effort that represents the savings from a more comprehensive set of energy efficiency policies.

2-10 Energy Efficiency as a Low-Cost Resource for Achieving Carbon Emissions Reductions
Figure 2-2. California Utilities’ Energy Efficiency Program Impacts, 2006–2008
Source: CPUC Energy Efficiency Groupware Application reporting system: <http://eega2006.cpuc.ca.gov/Default.aspx>.
Figure 2-3. Northwest Power and Conservation Council Efficiency Estimates
Source: NWPCC, 2009.

National Action Plan for Energy Efficiency 2-11
Figure 2-4. Efficiency Vermont 2007 Impacts
Source: Efficiency Vermont, 2008.
2.4 Energy Efficiency’s Potential Impact on CO2 Emissions
Efficiency has long been discussed as a “no regrets” element of climate policy because it offers a cost-effective energy resource even in the absence of greenhouse gas reduction goals or associated policies. Thus, reducing CO2 emissions associated with energy usage is just another benefit to an already cost-effective strategy. Efficiency has been viewed as providing at least two broad benefits in the climate arena: (1) slowing the growth of energy use, to buy time for non-emitting supply technologies to reduce average emissions rates, and (2) reducing the cost of meeting CO2 emissions reduction goals.
Efforts to quantify the link between energy efficiency and CO2 emissions have been fewer than analyses of energy efficiency potential, and have generally been conducted in long-term, aggregate frameworks at the national level. In electricity systems, because electricity usage is distant from the generation facilities that emit CO2, efficiency’s impact on CO2 emissions is indirect, and it depends on specific factors like the hourly load shape impact of efficiency measures and the marginal carbon emissions rate at a given hour for the affected power system. Studies often use national or regionally averaged emission factors to address this issue.
Recent studies of the impact of energy efficiency on CO2 emissions include:
EPRI’s PRISM analysis. This 2007 report included end-use efficiency in addition to a range of low-carbon supply technologies in a high-level estimate of their potential for reducing U.S. electricity-sector CO2 emissions in 2030. The study assumed that efficiency could reduce average annual growth rates by 30 percent, based on an assumed average end-use energy intensity improvement of 20 percent. Combined with

2-12 Energy Efficiency as a Low-Cost Resource for Achieving Carbon Emissions Reductions
low-carbon supply technologies, efficiency would contribute substantially to a 45 percent reduction in power-sector CO2 emissions from the 2007 U.S. Energy Information Administration (EIA) Annual Energy Outlook reference case. While the report does not specify exact emissions impacts by technology type, interpretation of report graphics indicates that efficiency would reduce 2030 CO2 emissions by 200 to 300 million metric tons, or about 12 to 18 percent of a combined 1,600 million metric ton reduction in 2030 (EPRI, 2007).
McKinsey & Company. McKinsey has developed several carbon abatement cost curves that highlight the leading role of energy efficiency in low-cost abatement strategies (McKinsey & Company, 2007). The mid-range cost curve shows that roughly 1 billion tons of CO2 emissions reductions are available annually in the 2030 timeframe through energy efficiency technologies (see Figure 2-5). Energy efficiency technologies account for most of the lowest-cost resource options, shown on the left side of the graphic. While the level of detail available in the report does not precisely segment efficiency versus other technology impacts, McKinsey’s analysis also estimates costs per ton of CO2 emissions reduced. Most energy efficiency technologies are shown as negative-cost measures. This negative-cost calculation is based on net life-cycle costs, measured against reference case estimates of energy supply costs. McKinsey does not include non-capital costs, such as the administrative and other program costs needed to overcome market barriers, and so may somewhat underestimate the total cost of delivering efficiency resources. McKinsey’s use of the life-cycle-cost framework, in which efficiency investments show lower lifecyle costs than reference supply investments and therefore have negative relative costs, does not suggest that efficiency bears no initial capital cost.2 Ultimately, from the policy-maker’s perspective, the issue of “negative cost” is a question of relative costs—the relative cost of resource choices. If energy efficiency resources cost less on a life-cycle basis than other resource choices, they would be preferred in a least-cost policy.

National Action Plan for Energy Efficiency 2-13
Figure 2-5. McKinsey Carbon Abatement Cost Curve
Source: McKinsey & Company, 2007.
IPCC. The IPCC’s mitigation working group developed substantial analysis on energy
efficiency and carbon abatement potential (IPCC, 2007). Their report shows that more than 2.5 gigatons of CO2 emissions reductions are available through end-use energy efficiency in the countries belonging to the Organisation for Economic Co-operation and Development (OECD), at costs less than $20 per ton of CO2. While this work is primarily global in scale, the findings generally apply to U.S. markets on a proportional basis. Figure 2-6 summarizes the projected contributions from various sectors. Note that the buildings sector holds the largest fraction of low-cost emissions reduction potential, and most of that comes from electricity savings.
American Solar Energy Society (ASES). The 2007 ASES report shows energy efficiency accounting for a large fraction of the CO2 emissions reductions necessary in 2030 to meet goals of reducing CO2 emissions by 60 to 80 percent by 2050 (Kutscher, 2007). Efficiency accounts for 57 percent of the 1.2 billion tons of carbon equivalents that the study finds could be achieved by 2030. The total reduction potential is close to that of the McKinsey report. The ASES study developed a set of energy efficiency supply curves, which calculate the cost of saved energy on a levelized life-cycle basis. They project the energy efficiency resources in the study to cost less than $6 per million British thermal units (Btu). U.S. energy costs in recent years have been in the $10 per million Btu range. Figure 2-7 summarizes the ASES study’s projected impacts.

2-14 Energy Efficiency as a Low-Cost Resource for Achieving Carbon Emissions Reductions
Figure 2-6. IPCC CO2 Emissions Abatement Estimates
Source: IPCC, 2007.
OECD = Organisation for Economic Co-operation and Development; EIT = economies in transition.
Figure 2-7. CO2 Reductions From Energy Efficiency and Renewable Energy
Source: Kutscher, 2007.

National Action Plan for Energy Efficiency 2-15
Scenarios for a Clean Energy Future (CEF). The CEF study projected carbon emissions and reductions out to 2020. In its advanced scenario, with maximum reductions of 565 million tons of CO2 in 2020 across a range of policies, energy efficiency accounted for 65 percent of total emissions reductions. The CEF study projected investment costs of $82 billion in 2020, offset by energy bill reductions of $189 billion, for a net economic benefit of $107 billion.
Action Plan Vision for 2025. The Action Plan has a goal of achieving all cost-effective energy efficiency by 2025. The national cost-effective energy savings estimate was developed by extrapolating the costs and benefits from existing energy efficiency efforts; this estimate has been translated into the CO2 reductions that would result from achieving this goal. The goal is equivalent to a reduction in greenhouse gas emissions on the order of 500 million metric tons of CO2 annually (National Action Plan for Energy Efficiency, 2008a). The Vision does not assume a price for CO2.
2.5 Summary of Findings
A review of the studies presented in this chapter leads to the following observations:
The scope of cost-effective energy efficiency is large, and a substantial percentage of future energy needs can be met through efficiency resources. Several studies in the electricity sector indicate that savings in the range of 1 percent of total sales annually are achievable. Continued over several years, these modest annual savings can add up to a large portion of a long-term forecast. These estimates suggest that efficiency policies and programs can offset a significant portion of electric load growth, on the order of 50 percent or more (National Action Plan for Energy Efficiency, 2008a). The percentage of load growth that can be offset depends in part on underlying forecast growth rates. In high-load-growth areas, efficiency may have a lower percentage impact on load growth, while in slower-growth areas, efficiency can offset a higher fraction.
Substantial energy savings and greenhouse gas reductions are possible through energy efficiency programs administered by states, utilities, or third parties. The promise found in potential studies is being borne out by measured impacts from programs operated in some states over extended timeframes.
Extrapolating the costs and benefits of existing programs managed by states and/or utilities reveals a national potential to meet 50 percent or more of load growth, or 20 percent of electricity demand and 10 percent of natural gas demand in 2030. In other words, in 2030, peak electric demand would be 20 percent lower than it otherwise would be, and natural gas demand would be 10 percent lower than it otherwise would be due to the effect of cost-effective energy efficiency programs.
Studies that cover a full range of markets, end-uses, and technologies show substantial energy efficiency savings opportunities across residential, commercial, and industrial end-use sectors. While the efficiency potential found in a given region, state, metropolitan area, or utility service territory depends on its unique mix of building stock, industry sectors, and other factors, potential studies are relatively consistent in finding savings opportunities in comparable ranges throughout the country.
The studies that calculate the CO2 emissions impacts of energy savings show that energy efficiency offers substantial low-cost opportunities to reduce CO2 emissions.

2-16 Energy Efficiency as a Low-Cost Resource for Achieving Carbon Emissions Reductions
They estimate that efficiency could achieve on the order of one-eighth to one-half of the reductions necessary in the 2025–2030 timeframe to attain a longer-term goal of reducing CO2 emissions by 60 to 80 percent by 2050.3
2.6 Notes
1 For more information, see Nadel et al. (2006).
2 The conclusion of the study is accompanied by the following important caution: “Achieving these reductions at the lowest cost to the economy, however, will require strong, coordinated, economy-wide action that begins in the near future.” Further, the study makes it clear that achievement of the identified potential will require strong policy support “needed to address fundamental market barriers.” The analysis does not account for the costs associated with such policies.
3 There is some confusion in the literature about some studies’ association of the term “negative cost” with energy efficiency investments. These studies use negative cost in a life-cycle-cost framework, against a benchmark of reference case energy supply costs. In this framework, efficiency can be said to bear negative costs on a life-cycle, comparative basis. Such findings should not be confused with a present-day, investment-oriented framework, in which all resource choices bear initial capital and other costs. From a policy-maker’s point of view, the comparative life-cycle cost perspective can be appropriate, and it is also true that the up-front costs of all resource choices must be considered.
National Action Plan for Energy Efficiency 3-1
3: Costs and Benefits of Current Energy Efficiency Investments
This chapter provides an overview of the costs and benefits of energy efficiency programs and policies and presents key findings.
To better understand the role that energy efficiency can play in reducing CO2 emissions, and at what cost, it is important to review available information on the cost of saved energy, the level of current investment in energy efficiency across the country, the resulting aggregate savings, and the extent to which these efforts are capturing the available low-cost energy efficiency. This chapter presents information and key findings on:
The cost of saved energy.
Current investments and savings from energy efficiency programs and policies.
The portion of low-cost, achievable energy efficiency being captured from current investments.
3.1 Cost of Saved Energy
Various potential studies, resource plans, and program reports and evaluations have estimated the cost-effectiveness of energy efficiency, both as an aggregate resource and as individual measures and programs. Overall, these analyses find that energy efficiency is relatively inexpensive, especially when compared with conventional energy supply resource options. A sample of these estimates includes:
A 2004 ACEEE review of efficiency programs around the United States found that the levelized life-cycle cost of saved energy for the programs reviewed ranged from 2.3 to 4.4 cents per kWh (Kushler et al., 2004). This compares favorably with avoided costs for conventional power plants. It is important to note that the definition and the calculation methods of “avoided costs” vary from state to state, so there is no single national benchmark for the cost of electricity supply resources that would be avoided by efficiency programs. In California, 2008–2009 estimates of avoided costs are in the range of 9 cents per kWh. This is within a typical range of avoided costs filed in various resource plans around the United States.
Consistently, a nominal calculation from ACEEE’s State Energy Scorecard data (Eldridge et al., 2008) shows an average cost of about 20 cents per first-year saved kWh. On a levelized life-cycle basis, this translates to a cost of saved energy of approximately 2 cents per kWh. This estimate would be termed the “program administrator cost” for the saved energy; because customers typically pay a substantial portion of total efficiency investment costs, the “total resource cost” of these savings would be higher than 2 cents.1
The NWPCC’s Fifth Power Plan (NWPCC, 2005) estimates levelized costs and benefit-cost ratios for individual efficiency measures and end-uses. The levelized cost of saved energy averages 2.4 cents per kWh, ranging from 1.2 to 5.2 cents. The Council’s

3-2 Energy Efficiency as a Low-Cost Resource for Achieving Carbon Emissions Reductions
avoided cost estimates are unique and variable because it uses a mix of low-cost hydropower and higher-cost fossil-fuel generation resources in a sophisticated hourly modeling approach. An annual average cost of saved energy would fall within this range.
Efficiency Vermont’s 2007 Annual Report (Efficiency Vermont, 2008) estimates the cost of saved energy at 2.7 cents per kWh. Vermont’s avoided costs for electricity supply are estimated to average 10.7 cents per kWh.
The Minnesota CIP evaluation (Minnesota Office of the Legislative Auditor, 2005) shows 2003 costs of $52 million for annual savings of 328 million kWh. That averages to a cost per first-year saved kWh of 16 cents per kWh. While the report does not calculate levelized life-cycle costs of saved energy, based on typical measure lives this translates to a levelized cost of 2 cents per kWh or less.
The July 2006 Action Plan report (National Action Plan for Energy Efficiency, 2006) references 12 best practice program portfolios with lifetime levelized costs of $0.02 to $0.05 per kWh for electricity measures and $0.06 to $2.32 per million Btu for natural gas efficiency measures.
3.2 Total Costs and Savings of Investment in Energy Efficiency Technologies and Programs
Energy efficiency has yielded important benefits across the U.S. economy over the last 35 years. However, while various analyses have sought to estimate total investment and benefits from energy efficiency across the U.S. economy (e.g., Ehrhardt-Martinez and Laitner, 2008), such efforts are limited by data and methodology constraints. Reports like the Rand study of California’s efficiency policies provide useful examples of the significant streams of economic and other benefits these policies and programs deliver (Bernstein et al., 2000). Based on data available, energy efficiency delivered through state- and utility-administered programs is funded at the following levels and has provided the following benefits:
Approximately $2 billion (approximately 0.5 percent of utility revenues) is being invested annually in state- and utility-administered energy efficiency programs.2
Cumulative annual electricity savings total 63 billion kWh (about 2 percent of retail sales) and cumulative annual natural gas savings total 135 million therms (0.1 percent of retail sales) as of 2006.3 The cumulative electricity savings have avoided the need for 16 gigawatts of new capacity.4
These estimates have been developed from a variety of available information sources,5 which introduces inconsistencies in timeframes, reporting categories, universe of respondents, and quality control of data. Due to data limitations, these initial values are likely to underestimate the full contribution that energy efficiency investments are making to reduce energy demand as well as the full level of energy efficiency investment. Some of the key limitations include:
The energy savings values only capture savings from administered energy efficiency programs and do not reflect energy savings from other state and local efforts such as building energy codes, state-level appliance standards, and local and state lead-by-example initiatives.

National Action Plan for Energy Efficiency 3-3
The energy savings values do not include the benefits from national efforts to promote energy efficiency, federal appliance standards, or the autonomous rate of improvement in efficiency across the economy.
The program funding values represent program costs alone and not the costs that program participants may bear.
Additional attention is necessary to expand the breadth and accuracy of energy efficiency resource information in order to improve the ability to measure progress toward all cost-effective energy efficiency using these national performance metrics.
3.3 Macro-Economic Benefits of Efficiency Resource Investments
Some of the potential studies reviewed in this chapter assess the wider economic benefits of energy efficiency investments. Examples include:
ACEEE state analyses. The Virginia study cited earlier, and other recent ACEEE state efficiency potential studies, include state-level macroeconomic assessments of the policies recommended in the study. In Virginia, the study estimates that in 2025, electricity customers would save a net $2.2 billion on their bills, nearly 10,000 net new jobs would be created, and the state economy would expand by almost $900 million. The comparable ACEEE study in Ohio estimates net electricity bill savings of $3.3 billion in 2025, 32,000 net new jobs, and $2.5 billion in increased gross state product.
EPRI PRISM study. EPRI used its general-equilibrium MERGE macroeconomic model to estimate economic impacts from carbon emissions reduction policies, with and without advanced technology deployment. The MERGE analysis estimated that a carbon emissions policy scenario without advanced technology deployment could reduce gross domestic product through 2030 by as much as $1.5 trillion. Full deployment of advanced technologies as outlined in the PRISM analysis could reduce that impact by as much as $1 trillion. Efficiency was estimated to provide about $250 billion, or about 25 percent, of that $1 trillion impact reduction.
Scenarios for a Clean Energy Future. The CEF study did not include direct macroeconomic modeling for its technology scenarios, because the incremental impacts on gross domestic product were estimated to be too small to be meaningfully calculated. However, a discussion paper included as an appendix estimated a range of possible secondary economic impacts. This discussion, while not specific in its conclusions, estimated that negative macroeconomic impacts from the clean energy scenarios would in most cases be lower than the net economic benefits of the technology investments.
3.4 Investment Necessary to Achieve Economic Potential
Current levels of energy efficiency investment are substantially less than necessary to capture all cost-effective energy efficiency. For example, leading energy efficiency programs being deployed in some states, as described above, are being funded at 2 to 3 percent of energy revenues and delivering energy savings on the order of 1 percent of total sales per year. If these programs were deployed throughout the country, annual energy efficiency program funding and investment would be on the order of four to five times larger. In this context, total efficiency

3-4 Energy Efficiency as a Low-Cost Resource for Achieving Carbon Emissions Reductions
program spending in the utility sector might rise as high as $10 billion annually if all states pursued savings goals and program portfolios comparable to those in leading states.
These estimates do not reflect the investment requirements of implementing energy efficiency policies such as building codes and minimum appliance standards. Further, focusing just on the state efforts that have been designed to capture achievable cost-effective energy efficiency would suggest that these investment levels should be higher.
3.5 Summary of Findings
The key findings in this area are summarized below:
Energy efficiency is a low-cost resource. The studies cited in this chapter show a levelized cost of 2 to 5 cents per saved kWh of electricity. While some of these estimates come from potential studies, many come from program impact reports, and are thus borne out by program field experience.
Public investment in efficiency is a fraction of the levels justified by potential assessments. If all states spent the fraction of revenues expended by leading states, total utility-sector efficiency spending would be as high as five times the current national total.
Efficiency can produce net economic benefits. There are macroeconomic benefits from the pursuit of energy efficiency, including reduced energy expenditures for end-use consumers, increased spending of saved energy dollars in other sectors, increased employment and personal income, and increased total economic output.
3.6 Notes
1 For a more complete discussion of cost-effectiveness issues, see the Action Plan report Understanding Cost-Effectiveness of Energy Efficiency Programs: Best Practices, Technical Methods, and Emerging Issues for Policy-Makers (National Action Plan for Energy Efficiency, 2008c).
2 The annual spending value considers both ACEEE’s 2006 actual electricity efficiency program spending (Eldridge et al., 2008) and CEE’s 2007 budget estimates for residential, commercial, and industrial electricity and gas efficiency programs (Nevius et al., 2008). CEE budget estimates capture responses from both CEE members and nonmember administrators of energy efficiency programs. Program funding for low-income, load management, and other programs is not included in these estimates. Actual 2006 spending for electricity efficiency programs comes from ACEEE, leveraging EIA and ACEEE’s independent information collection efforts.
3 Natural gas savings are from CEE for their members only (Nevius et al., 2008) and include estimated savings from measures installed in 2006, as well as those installed as early as 1992 that were still generating savings as of 2006.
4 Annual incremental electricity savings are from ACEEE (Eldridge et al., 2008) and cumulative electricity savings are from EIA Form-861 data (EIA, 2008), both for year 2006. Values reflect reported data for administered energy efficiency programs only and do not include low-income programs or other load management efforts such as demand response. Cumulative savings do not capture those programs administered by state entities. Peak electricity savings are from EIA Form-861 data for year

National Action Plan for Energy Efficiency 3-5
2006 and reflect reported data for utility-administered energy efficiency programs only and do not include load management programs.
5 For additional information on data sources and calculation methodologies see Appendix E of National Action Plan for Energy Efficiency (2008a).


National Action Plan for Energy Efficiency 4-1
4: Limitations to Advancing Energy Efficiency Through Energy Pricing Policies
This chapter summarizes key barriers to energy efficiency and the extent to which price signals can influence energy consumption. Reducing carbon emissions through energy efficiency policies and programs requires that a broad suite of market and regulatory barriers be addressed.
In traditional energy and environmental policy analysis, getting energy prices “right,” such that they fully reflect direct economic costs as well as indirect environmental social costs, is a central concern.1 In this approach to policy-making, setting the right energy price signals would result in the best allocation of resources among various options. It would suggest that proper price signals would also capture the cost-effective energy efficiency resource potential embedded in the various sectors of the U.S. economy.2 This chapter explores two factors that limit the effects that price signals have in driving investments in energy efficiency:
The substantial and persistent market barriers that affect large portions of energy end-use markets. Decades of experience in real energy markets, backed up by recent analyses that seek to quantify the effects of market barriers, show that barriers are real, large, and lasting, and require targeted policy and program initiatives to overcome. There are both significant market barriers and regulatory barriers that limit investment in cost-effective energy efficiency and which need to be addressed.
The limits of price elasticity in effecting net changes in energy use throughout the economy. While price elasticity effects are real, they are also counteracted by other forces such as income elasticity (the tendency for consumption to rise and fall with income) and cross-elasticity (reduced consumption of one good in response to the change in price of another good), such that the net effect of price signals on energy consumption can be blunted. Price elasticities are further muted by the lack of transparency in electricity and natural gas pricing and billing.
Following is a discussion of these factors and key findings.
4.1 Market Barriers to Energy Efficiency
One of the roles of efficiency potential studies is to identify the cost-effective technologies, practices, and programs that reduce life-cycle or societal costs, because such measures justify policy or program intervention to remediate market failures. Substantial work in this area has been undertaken, as seen in Chapter 2. Further, a principal purpose of many of the energy efficiency programs and policies already in place at the national, state, and local levels is to reduce market or policy barriers that can be shown to significantly limit energy efficiency investment, relative to the level of investment that would occur if markets operated “efficiently.”
There is substantial economic research on the existence and magnitude of market barriers to energy efficiency and on the ability of policies and programs to overcome them.3 Barriers to energy efficiency are reviewed in several Action Plan documents (National Action Plan for Energy Efficiency, 2006, 2008a, 2008b). Other market barrier research includes the International Energy Agency’s recent Mind the Gap report (IEA, 2007). This report segments

4-2 Energy Efficiency as a Low-Cost Resource for Achieving Carbon Emissions Reductions
barriers into phenomena that classical economists recognize, conditions that behavioral economists and psychology and sociology practitioners might study, and conditions that energy efficiency practitioners experience.
Several commonly acknowledged market barriers are described below:
The principal-agent barrier. This involves a condition in which one entity (the agent) makes energy efficiency investment decisions and another entity (the principal) pays the energy operating costs that flow from those decisions. The most common principal-agent barrier observed in the United States is the builder-buyer barrier, in which building designers or construction contractors determine the efficiency levels for major building systems and equipment. This can include building thermal performance, heating and cooling systems, hot water systems, lighting systems, and major appliances. The builder’s equipment and design choices will ultimately determine much of the building’s energy consumption requirements. Builders will rarely optimize energy performance on a life-cycle basis, unless they are under contract directly to informed buyers who specify such performance and are willing to pay for it. This “custom-building” or owner-designed construction accounts for a small minority of U.S. building starts. In residential or commercial rental property, tenants normally lack the ability to specify energy performance for major building systems or appliances, and landlords typically pass through energy costs to tenants, so they lack the incentive to reduce energy usage in their buildings. Principal-agent problems can exist even within organizations: for example, if a procurement department buys energy-using equipment for the organization on a low-bid first cost basis, and facility operators seek to reduce operating costs through efficient technologies that have a cost premium, the organization may chronically under-invest in efficiency.
The transaction-cost barrier. Economists sometimes use terms like “information-cost” or “search cost” for this type of barrier. It refers to the condition in which energy users, even if they have the ability to consider the energy efficiency performance of a product or system, are unwilling to invest the time, effort, and analysis to make the best economic decision. Residential and small commercial consumers frequently experience this situation: they need to replace a product, such as a water heater, but lack the knowledge, expertise, and time to figure out the most economical decision. These factors—information, time, and analytical skill—add up to a transaction barrier that average consumers are unwilling or unable to overcome. By contrast, some larger customers and some energy professionals have the information, expertise, and time to make better decisions, so some customer markets are less affected by this barrier.
Many other conditions are often referred to as barriers. Consumers’ aversion to risk, competing attributes of products that drive decisions based on non-energy factors, and other conditions can be observed in markets and consumer behaviors. Understanding these phenomena can be helpful for some purposes, such as designing the marketing, outreach, and delivery systems for efficiency programs, or public education and media efforts. However, the scope of this paper limits the extent of such a review, so this assessment is limited to the more classic barrier types.
These barriers have a significant limiting effect on total investment by energy end-users and others in cost-effective energy efficiency.

National Action Plan for Energy Efficiency 4-3
4.2 Regulatory Barriers
Policies can create additional barriers in some cases by adding constraints or prescriptions to market structures or practices. In the power sector, regulatory barriers to efficiency revolve around utility resource planning and ratemaking policies.
Examples of regulatory barriers to efficiency in the power sector include:
Resource planning practices. While efficiency programs can be deployed rapidly, their full potential typically takes decades to realize. The markets for new buildings, energy systems, and other end-use products take many years to turn over; efficiency programs must be in place for the duration of such cycles to fully realize efficiency’s market potential. However, not all jurisdictions undertake resource planning on the 10- to 20-year timeframes needed to adequately plan for efficiency. In addition to the time horizon issues, resource planning must include robust and consistent resource assessment methods that treat demand and supply resources with comparable levels of analytic rigor (National Action Plan for Energy Efficiency, 2007c).
Ratemaking practices. The mechanisms by which utilities recover costs and earn returns can have a strong effect on investor-owned companies’ willingness to invest in demand-side resources. The predominant approach to utility cost recovery in most U.S. states links sales to the recovery of variable and some portion of fixed costs, including allowed margins. If kWh sales fall short of estimates, utilities’ fixed cost recovery and shareholder returns can be reduced substantially. This limits many companies’ willingness to invest substantial amounts in energy efficiency (National Action Plan for Energy Efficiency, 2007a).
Unbundling of distribution, transmission, and generation functions. Restructuring of these three utility system functions can be argued to increase economic efficiency by opening markets to competitive forces. From a resource planning point of view, however, unbundling of these functions can also fracture the jurisdictional ability to plan for and estimate the resource value of energy efficiency. This is particularly true for distribution-only utilities regulated by state or local government. Because transmission and generation are outside these agencies’ jurisdiction, it can be difficult for them to assign a fully bundled set of values to energy efficiency resources. Transmission system operators, in a related way, are able to value only the transmission-related resource benefits of efficiency, and in some cases (e.g., ISO New England and PJM Interconnection) can value the generation capacity value if a capacity market has been established.
These barriers are a result of state-level policies, and they have a significant impact in limiting investment in cost-effective energy efficiency. The Vision for 2025 and other Action Plan materials extensively discuss these barriers and policy and program options for addressing them.
4.3 Price Elasticity
“Price elasticity of demand” is an economist’s term for the effects of changes in energy prices on energy consumption. Price elasticity assumptions underlie many energy policies, relying on energy prices to change energy use patterns. While price elasticity is an important market

4-4 Energy Efficiency as a Low-Cost Resource for Achieving Carbon Emissions Reductions
factor, experience in end-use markets indicates the significant limits of this effect. Thus, it is important to discuss whether pricing policies alone are sufficient to realize the full potential for energy efficiency. This section discusses the limits of price elasticity and the implications of such limits for policies to encourage efficiency investment in the power sector.
The limits of price elasticity can be summarized in the following points:
Market barriers. As discussed above, barriers such as the principal-agent problem and the transaction-cost problem have the effect of isolating some energy end-use markets from price elasticity effects. This barrier affects a large fraction of residential and commercial end-use markets (IEA, 2007).
Price transparency. End-users can only respond to price signals when prices are transparent: that is, when prices are perceived at or before the time of energy consumption. For example, in motor fuel markets, drivers see posted fuel prices at retail stations before making their purchases, and thus have a very transparent signal that may affect both short-term driving behavior and longer-term vehicle purchase behavior. By contrast, in utility markets, customers receive bills after they have consumed electricity. Bills are often complex, such that customers may have to do arithmetic to discover the net price per kWh, then compare that price with what they paid in previous periods. This can mask price effects. Moreover, vehicle drivers have more transparent choices regarding future energy use: some can drive less in the near term, and/or buy more fuel-efficient vehicles in the longer term. Electricity consumers, however, typically have dozens of power-using devices in their homes or businesses, and they do not typically know which devices will yield the greatest savings if used differently or replaced. This compounds the lack of price transparency with a lack of transparency for choices in demand reduction. Further, the traditional ratemaking practice of average-cost, non-time-differentiated pricing tends to mask the marginal cost of producing electricity. While many states are developing rate and pricing approaches that better match the marginal cost of power to retail rates, the prevailing price structures in most states continue to rely on average-cost-based rates.
Countervailing price effects. Price elasticity is but one element of economic price theory. Income elasticity and cross-elasticity effects also operate in energy markets, and they can serve to counteract price elasticity effects. Income elasticity refers to the effect of income on energy demand. In prospering economies, rising incomes tend to drive up the demand for energy services. For example, consumers want larger homes and more appliances as their incomes increase in good economic times. Cross-elasticity refers to effects in which changes in energy prices cause energy users to reduce consumption of other goods, rather than directly reducing energy consumption. For example, consumers may continue to drive to a shopping center, using the same amount of fuel, but may make fewer discretionary purchases on a given shopping trip. Electricity users may see electricity as an essential service and may choose to cut back on entertainment or other expenses if utility bills rise. While it is difficult to quantify the net effects of price, income, and cross-elasticity, for the purposes of this paper it is sufficient to point out that price elasticity effects may be limited in some markets.
Lack of substitutes. The lack of practical substitutes for electricity, natural gas, or heating oil in many end-uses also impacts price elasticity. Energy is needed to provide services such as heating or hot water, cooling, and ventilation, in addition to food

National Action Plan for Energy Efficiency 4-5
preparation, cleaning, and entertainment. Fuel switching is frequently not technically feasible or economically attractive.
This chapter’s discussion of the limits of price elasticity is not meant to suggest that energy pricing policies have no impact on promoting energy efficiency. Rather, the intent is to point out that to realize the potential for efficiency in all end-use markets, pricing policies will need to be complemented with other approaches.
4.4 Summary of Findings
Assuming that a principal impact of climate policies will be to raise energy prices, energy prices alone will not increase efficiency investment to the level needed to tap the majority of efficiency’s economic potential. Price signals alone are insufficient because:
Market and regulatory barriers are large and persistent, especially the principal-agent barrier, information-cost or transaction-cost barriers, and regulatory policies in the area of utility ratemaking.
The price elasticity of energy consumption in many residential and commercial markets is relatively weak, due to countervailing elasticity effects. Relying solely on price elasticity to drive efficiency investment is unlikely to lead to the realization of a large fraction of efficiency potential.
More analysis is needed to quantify the impacts of specific barriers and evaluate the solutions designed to address them.
4.5 Notes
1 In practice, environmental costs are incorporated to some degree through a number of different mechanisms. For example, some state utility commissions require utilities to apply factors representing the societal costs of environmental externalities (e.g., cost per ton of CO2 emitted) when conducting resource planning. Some federal and state emissions regulations require emission controls that increase costs of power plants. These costs are ultimately reflected in electric rates.
2 Selected recent references on price elasticity include Barbose et al. (2004), Faruqui and Wood (2008), Neenan (2008), McDonough and Kraus (2007), and Siddiqui (2003).
3 One of the fundamental distinctions made in the market barrier literature is between market barriers and market failures. Some economists distinguish barriers and failures by defining a market failure as a condition that reduces energy efficiency and economic efficiency, whereas a market barrier is a condition that reduces energy efficiency without necessarily reducing economic efficiency. For example, one could point out a market barrier that keeps home builders from constructing homes that use 75 percent less energy than current building codes require. However, this condition would only be classified as a market failure if the life-cycle cost of the home were lower at the 75 percent energy savings level than at the current code level. If it can be shown that energy performance at that level does not reduce overall life-cycle costs, builders’ unwillingness to build to that level of performance would not be a market failure. If, by contrast, a performance level 30 percent better than current codes can be shown to reduce life-cycle costs, and builders still fail to build to this level of performance, that would be deemed a market failure.


National Action Plan for Energy Efficiency 5-1
5: Summary of Energy Efficiency Policies and Programs
This chapter reviews the policies and programs that can address the key market and regulatory barriers to energy efficiency. It also outlines tools and resources available through the Action Plan to address these barriers and presents key findings.
A common rationale for public policy and programs aimed at energy efficiency is removing the known barriers to energy efficiency in key end-use markets. Another important focus is in the policy arena itself, such as reforming regulatory policies to remove utility disincentives to efficiency investment. Market barriers can be addressed through direct policy interventions (e.g., building codes, appliance standards, setting energy efficiency resource requirements) and through voluntary, information- or incentive-based programs administered by utilities, government entities, and third parties. Addressing regulatory barriers involves a review of regulatory policy specifics and modifications that align with the delivery of energy efficiency where it is cost-effective.
Policies and programs are currently used to:
Address market barriers. A suite of programs are employed by many state and local governments, utilities, and others to address the market barriers limiting investment in energy efficiency. These programs generally target the following market opportunities:
– Purchase of individual products – Construction of new buildings – Improvement of existing facilities
Address regulatory barriers. The regulatory barriers can be addressed by state policy-makers, utilities, and others through policies in the following areas:
– Utility regulatory issues – Pricing policies – Ratemaking policies
5.1 Addressing Market Barriers
This section summarizes the policy and program options most commonly used today to address market barriers and increase energy efficiency in end-use markets. It matches policy/program options to the main markets affected by barriers. Table 5-1 summarizes this approach.

5-2 Energy Efficiency as a Low-Cost Resource for Achieving Carbon Emissions Reductions
Table 5-1. Policy/Program Options Matched to Markets
Market Focus
Policy/Program Option Individual Products
New Construction
Existing Buildings/ Facilities
Mandatory appliance standards X
Product labeling X
Voluntary appliance standards X
Minimum building codes X
Voluntary building standards X
Building labeling/benchmarking X X
Retrofit programs X
Education and outreach X X X
Government lead-by-example X X X
Administered energy efficiency programs
X X X
5.1.1 Purchase of Individual Products
Product purchases exemplify a “lost-opportunity” market, in that consumers or businesses routinely purchase energy-using products or equipment, and each purchase represents an opportunity that will be lost if the efficiency program does not influence the purchaser to make a more efficient choice. Principal-agent and transaction-cost barriers can turn millions of these routine transactions into lost opportunities. Fortunately, there are several policy tools for reducing these lost opportunities. These include minimum appliance standards and approaches that go beyond standards, as discussed below.
Mandatory minimum appliance standards. Minimum appliance standards help address the principal-agent problem in new construction and in leased space, as well as the transaction-cost barrier that arises in the typical purchase of an energy-using product. The latter is best highlighted by explaining how purchases are frequently made. If, for example, a hot water heater, air conditioner, or refrigerator fails, the owner’s first concern is to replace the unit as soon as possible. This “panic purchase” situation tends to severely truncate any broader consideration of efficiency options, and tends to drive consumers toward models that are available and affordable on short notice. For many of the larger energy-using products, the new construction market and the retrofit markets have relatively equal sales, emphasizing the role of appliance standards in addressing these various barriers.
Appliance standards play a complementary role to building codes by addressing the devices that consume energy within the building. This is particularly true for residential buildings, where federal standards cover most major energy-using devices. It is less so for commercial buildings, where some types of heating and cooling equipment—and most lighting systems—are not covered by federal standards.
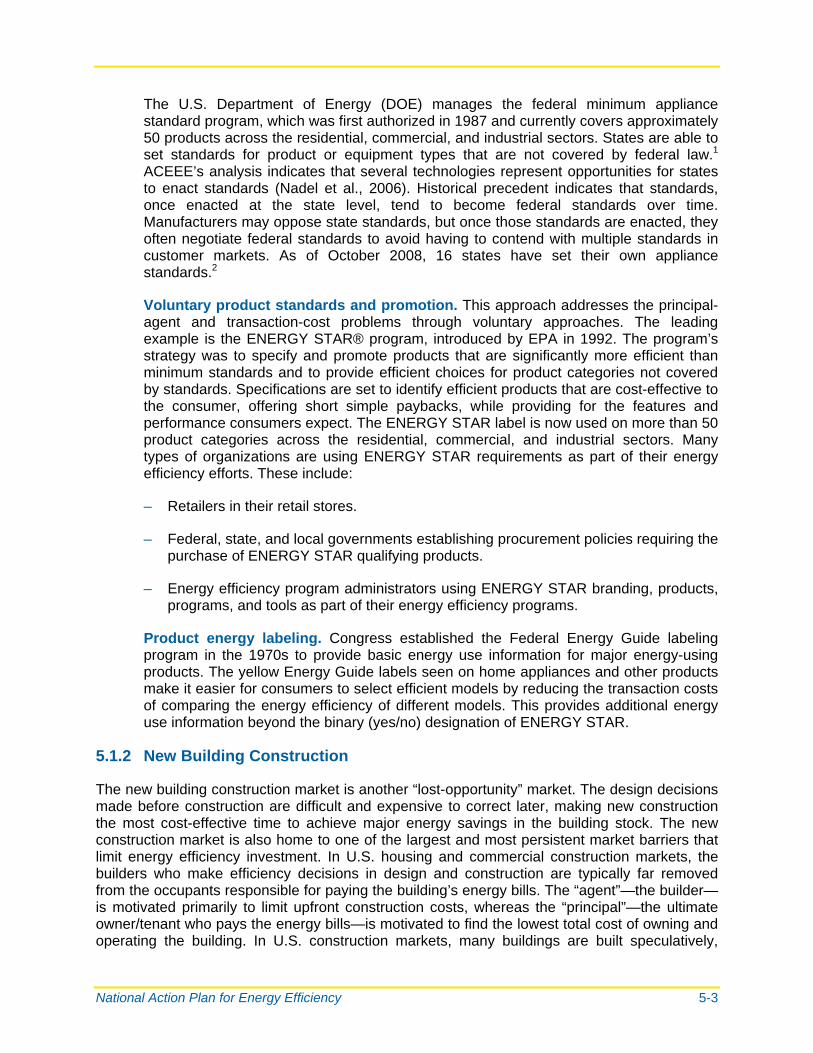
National Action Plan for Energy Efficiency 5-3
The U.S. Department of Energy (DOE) manages the federal minimum appliance standard program, which was first authorized in 1987 and currently covers approximately 50 products across the residential, commercial, and industrial sectors. States are able to set standards for product or equipment types that are not covered by federal law.1 ACEEE’s analysis indicates that several technologies represent opportunities for states to enact standards (Nadel et al., 2006). Historical precedent indicates that standards, once enacted at the state level, tend to become federal standards over time. Manufacturers may oppose state standards, but once those standards are enacted, they often negotiate federal standards to avoid having to contend with multiple standards in customer markets. As of October 2008, 16 states have set their own appliance standards.2
Voluntary product standards and promotion. This approach addresses the principal-agent and transaction-cost problems through voluntary approaches. The leading example is the ENERGY STAR® program, introduced by EPA in 1992. The program’s strategy was to specify and promote products that are significantly more efficient than minimum standards and to provide efficient choices for product categories not covered by standards. Specifications are set to identify efficient products that are cost-effective to the consumer, offering short simple paybacks, while providing for the features and performance consumers expect. The ENERGY STAR label is now used on more than 50 product categories across the residential, commercial, and industrial sectors. Many types of organizations are using ENERGY STAR requirements as part of their energy efficiency efforts. These include:
– Retailers in their retail stores.
– Federal, state, and local governments establishing procurement policies requiring the purchase of ENERGY STAR qualifying products.
– Energy efficiency program administrators using ENERGY STAR branding, products, programs, and tools as part of their energy efficiency programs.
Product energy labeling. Congress established the Federal Energy Guide labeling program in the 1970s to provide basic energy use information for major energy-using products. The yellow Energy Guide labels seen on home appliances and other products make it easier for consumers to select efficient models by reducing the transaction costs of comparing the energy efficiency of different models. This provides additional energy use information beyond the binary (yes/no) designation of ENERGY STAR.
5.1.2 New Building Construction
The new building construction market is another “lost-opportunity” market. The design decisions made before construction are difficult and expensive to correct later, making new construction the most cost-effective time to achieve major energy savings in the building stock. The new construction market is also home to one of the largest and most persistent market barriers that limit energy efficiency investment. In U.S. housing and commercial construction markets, the builders who make efficiency decisions in design and construction are typically far removed from the occupants responsible for paying the building’s energy bills. The “agent”—the builder—is motivated primarily to limit upfront construction costs, whereas the “principal”—the ultimate owner/tenant who pays the energy bills—is motivated to find the lowest total cost of owning and operating the building. In U.S. construction markets, many buildings are built speculatively,

5-4 Energy Efficiency as a Low-Cost Resource for Achieving Carbon Emissions Reductions
meaning that the builder does not know the ultimate owner/occupant before key design and construction decisions are made. Under such conditions, builders chronically under-invest in efficiency. This persistent principal-agent barrier has been addressed through policy action in building codes and beyond code programs.
Mandatory building energy codes. State and local governments commonly use building energy codes to address the principal-agent problem. Building energy codes primarily address the thermal performance of the building envelope—insulation and window efficiency; air leakage through walls, ceilings, and window and door assemblies; and in some cases leakage from heating and cooling ducts. Codes are limited in most cases to the “envelope” for two reasons:
– The envelope involves the most permanent design and construction decisions, because these components can last indefinitely and can be difficult or expensive to rebuild after construction.
– Federal law pre-empts states from regulating most heating, cooling, hot water, and other appliances. These devices can be replaced somewhat more quickly (on a 10- to 30-year cycle), typically do not require expensive construction modifications to replace, and are addressed through the appliance standards discussed above.
The majority of states have relatively recent building codes in force for both residential and commercial buildings.3 Beyond the basic question of whether an energy code exists, the relative stringency of the code can also reflect the principal-agent problem. Because builders participate in the code development and adoption process, and are influential economic interests in most states and localities, they can influence the stringency of building energy codes. Stringency is an important issue in developing, adopting, and implementing energy codes. Other important issues include builder training, enforcement, and verification.
Voluntary, beyond-code programs. Regardless of the presence of building codes, programs such as ENERGY STAR that establish performance levels more stringent than codes also work to address the principal-agent barrier while providing greater energy savings. ENERGY STAR encourages buyers to evaluate the energy performance of a building before buying and influences builders to upgrade the energy performance of their buildings. Programs such as ENERGY STAR are being used to establish a market for efficient, beyond-code buildings and are used in energy efficiency programs to offer more efficient buildings and procure energy savings by the utility. These programs include verification protocols and require the development of a building rating infrastructure to ensure that the buildings are constructed to more efficient levels. Significant market penetration of buildings built to these voluntary standards is being achieved; for example, ENERGY STAR new homes represent more than 20 percent of new home starts in many metropolitan areas (EPA, 2008).
5.1.3 Existing Facility Improvements
Beyond the lost-opportunity markets driven by equipment replacement and new construction cycles, a vast set of energy efficiency measures can be installed as elective retrofits and improvements. Many lighting measures, insulation, air leakage reduction, controls, and other technologies can be cost-effective to install without waiting for a time-of-replacement point. These retrofit measures hold significant energy savings potential, but they also present

National Action Plan for Energy Efficiency 5-5
challenges in reaching customers and engaging trade allies because there are typically few existing market channels through which to promote these options. Getting retrofits to occur takes much more active marketing—and sometimes additional administrative effort to coordinate marketing and delivery—than do measures that can be driven through existing market channels.
Home weatherization measures provide an example of the challenges faced by programs aimed at retrofit measures. With much of the U.S. housing stock built before the current era of high energy prices, environmental concerns, and advances in building design, there are enormous opportunities for improving home insulation, windows, air leakage, duct leakage, lighting, and other features. However, reaching homeowners one by one and customizing measures and installation techniques to each home can be challenging. These challenges stem in part from the diverse and complex nature of home improvement markets, the overriding effect of which is to increase transaction-cost barriers.
Key programs operating in U.S. markets today that seek to overcome these barriers include:
Low-income weatherization. The federal Weatherization Assistance Program, which is administered through state and local organizations, currently serves about 100,000 homes annually with a range of retrofit measures, from air and duct leakage reduction to insulation and equipment replacement.
Comprehensive home retrofits. Some states and utilities offer packages of retrofit services to residential customers. One of the leading national umbrella efforts for these programs is Home Performance with ENERGY STAR. This program takes a comprehensive approach to home retrofits, using advanced diagnostics and treatment methods, qualified home professionals, and quality assurance protocols to deliver energy efficiency solutions that reduce energy bills while improving comfort. This package has been designed to tackle the specific barriers found to be present in the residential home improvement marketplace.
Commercial building retrofits. Several states and utilities offer direct installation, re-commissioning, and customized retrofit programs for non-residential customers. ENERGY STAR Buildings is a commonly used umbrella approach for many of these efforts; it uses a benchmarking approach to determine relative energy performance. Many building owners then pursue a range of retrofits and operating practices to improve the building’s performance to a level that can be recognized by the ENERGY STAR program.
Industrial assistance. Federal and state programs support a variety of industrial technical assistance. EPA’s Industrial ENERGY STAR programs, DOE’s Office of Industrial Technologies programs, and numerous state industrial programs offer analytical tools, recognition, technical assistance, and in some cases financial incentives.
In the 2009–2011 timeframe, these and other efficiency programs for homes and businesses are receiving substantial federal grant support through the American Recovery and Reinvestment Act (ARRA). Additional information on ARRA funding and technical assistance is available on the Action Plan Web site.4
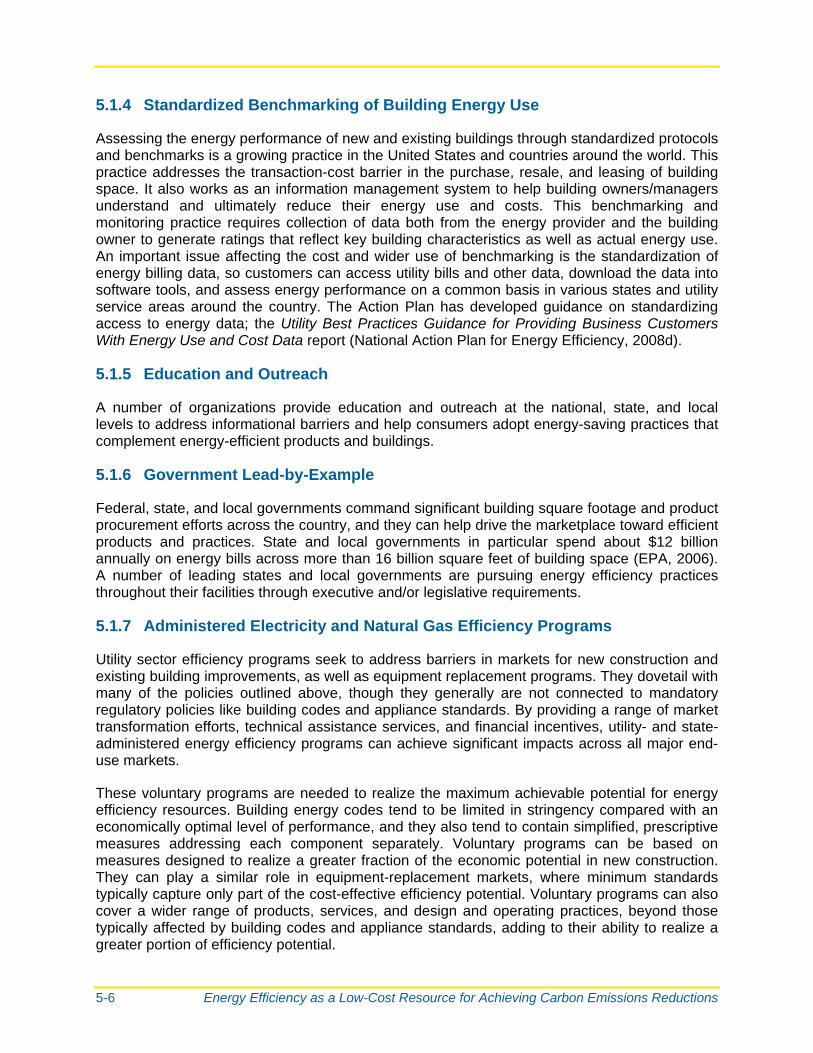
5-6 Energy Efficiency as a Low-Cost Resource for Achieving Carbon Emissions Reductions
5.1.4 Standardized Benchmarking of Building Energy Use
Assessing the energy performance of new and existing buildings through standardized protocols and benchmarks is a growing practice in the United States and countries around the world. This practice addresses the transaction-cost barrier in the purchase, resale, and leasing of building space. It also works as an information management system to help building owners/managers understand and ultimately reduce their energy use and costs. This benchmarking and monitoring practice requires collection of data both from the energy provider and the building owner to generate ratings that reflect key building characteristics as well as actual energy use. An important issue affecting the cost and wider use of benchmarking is the standardization of energy billing data, so customers can access utility bills and other data, download the data into software tools, and assess energy performance on a common basis in various states and utility service areas around the country. The Action Plan has developed guidance on standardizing access to energy data; the Utility Best Practices Guidance for Providing Business Customers With Energy Use and Cost Data report (National Action Plan for Energy Efficiency, 2008d).
5.1.5 Education and Outreach
A number of organizations provide education and outreach at the national, state, and local levels to address informational barriers and help consumers adopt energy-saving practices that complement energy-efficient products and buildings.
5.1.6 Government Lead-by-Example
Federal, state, and local governments command significant building square footage and product procurement efforts across the country, and they can help drive the marketplace toward efficient products and practices. State and local governments in particular spend about $12 billion annually on energy bills across more than 16 billion square feet of building space (EPA, 2006). A number of leading states and local governments are pursuing energy efficiency practices throughout their facilities through executive and/or legislative requirements.
5.1.7 Administered Electricity and Natural Gas Efficiency Programs
Utility sector efficiency programs seek to address barriers in markets for new construction and existing building improvements, as well as equipment replacement programs. They dovetail with many of the policies outlined above, though they generally are not connected to mandatory regulatory policies like building codes and appliance standards. By providing a range of market transformation efforts, technical assistance services, and financial incentives, utility- and state-administered energy efficiency programs can achieve significant impacts across all major end-use markets.
These voluntary programs are needed to realize the maximum achievable potential for energy efficiency resources. Building energy codes tend to be limited in stringency compared with an economically optimal level of performance, and they also tend to contain simplified, prescriptive measures addressing each component separately. Voluntary programs can be based on measures designed to realize a greater fraction of the economic potential in new construction. They can play a similar role in equipment-replacement markets, where minimum standards typically capture only part of the cost-effective efficiency potential. Voluntary programs can also cover a wider range of products, services, and design and operating practices, beyond those typically affected by building codes and appliance standards, adding to their ability to realize a greater portion of efficiency potential.

National Action Plan for Energy Efficiency 5-7
5.2 Addressing Regulatory Barriers
Effectively addressing regulatory barriers is fundamental to achieving all cost-effective energy efficiency investment. In the electricity and natural gas sectors, these barriers involve ratemaking and resource planning issues. While not the primary focus of this paper, policies affecting clean distributed generation technologies such as combined heat and power can also inhibit efficiency investment. These include utility interconnection policies and tariff policies regarding standby and supplemental power.
As with efficiency programs, the Action Plan has dedicated substantial effort to exploring the policy issues involved in redirecting utility regulatory policies to encourage utility and customer investment in energy efficiency. These issues include:
Integrating energy efficiency into resource planning Providing sufficient, timely, and stable recovery of program costs Addressing utility revenue stability given the reduction in throughput from efficiency Providing incentives to shareholders for measured and verified savings Designing rates to maximize customer incentives for energy efficiency
These issues are discussed in the Action Plan report (National Action Plan for Energy Efficiency, 2006), with substantial detail provided in additional Action Plan guides and papers. These documents can be found at www.epa.gov/eeactionplan.
5.3 Action Plan Vision for 2025 and Related Resources
The Vision for 2025 provides a comprehensive framework for overcoming a state’s market and regulatory barriers to investment in cost-effective energy efficiency. It establishes a long-term goal of achieving all cost-effective energy efficiency by 2025, defines 10 specific implementation goals, and outlines additional policy and program steps for each goal. The Vision framework is based on over two decades of program and policy experience. Implementation of these goals by 2015 to 2020 would put the country on the path to achieving all cost-effective energy efficiency. Substantial progress has been made, as can be seen by reviewing the policies in place across the 50 states (see Table 5-2). Much more progress is needed to establish the necessary policy foundation for energy efficiency, though, as Table 5-2 shows.

5-8 Energy Efficiency as a Low-Cost Resource for Achieving Carbon Emissions Reductions
Table 5-2. State Progress in Meeting the National Action Plan for Energy Efficiency Vision
States Having Adopted Policy Step as of December 31, 2007
Electricity Services Natural Gas Services Implementation Goal and Key Steps
Completely Partially Completely Partially
Goal One: Establishing Cost-Effective Energy Efficiency as a High-Priority Resource
1 Process in place, such as a state and/or regional collaborative, to pursue energy efficiency as a high-priority resource.
14 0 14 0
2 Policy established to recognize energy efficiency as high-priority resource.
21 22 8 8
3 Potential identified for cost-effective, achievable energy efficiency over the long term.
25 1 13 0
4 Energy efficiency savings goals or expected energy savings targets established consistent with cost-effective potential.
15 3 5 2
5 Energy efficiency savings goals and targets integrated into state energy resource plan, with provisions for regular updates.
0 16 0 1
6 Energy efficiency savings goals and targets integrated into a regional energy resource plan.a
TBD TBD TBD TBD
Goal Two: Developing Processes to Align Utility and Other Program Administrator Incentives Such That Efficiency and Supply Resources Are on a Level Playing Field
7 Utility and other program administrator disincentives are removed.
17 8 18 5
8 Utility and other program administrator incentives for energy efficiency savings reviewed and established as necessary.
10 5 5 2
9 Timely cost recovery in place.a TBD TBD TBD TBD
Goal Three: Establishing Cost-Effectiveness Tests
10 Cost-effectiveness tests adopted which reflect the long-term resource value of energy efficiency.
29 2 9 0

National Action Plan for Energy Efficiency 5-9
States Having Adopted Policy Step as of December 31, 2007
Electricity Services Natural Gas Services Implementation Goal and Key Steps
Completely Partially Completely Partially
Goal Four: Establishing Evaluation, Measurement, and Verification Mechanisms
11 Robust, transparent EM&V procedures established.
14 6 5 2
Goal Five: Establishing Effective Energy Efficiency Delivery Mechanisms
12 Administrator(s) for energy efficiency programs clearly established.
24 2 13 1
13 Stable (multi-year) and sufficient funding in place consistent with energy efficiency goals.
4 9 2 4
14 Programs established to deliver energy efficiency to key customer classes and meet energy efficiency goals and targets.
24 2 7 0
15 Strong public education programs on energy efficiency in place.
18 5 13 6
16 Energy Efficiency program administrator engaged in developing and sharing program best practices at the regional and/or national level.
30 0 18 0
Goal Six: Developing State Policies to Ensure Robust Energy Efficiency Practices
17 State policies require routine review and updating of building codes.
28 13 28 13
18 Building codes effectively enforced.a TBD TBD TBD TBD
19 State appliance standards in place. 11 0 11 0
20 Strong state and local government lead-by example programs in place.
13 24 13 24
Goal Seven: Aligning Customer Pricing and Incentives to Encourage Investment in Energy Efficiency
21 Rates examined and modified considering impact on customer incentives to pursue energy efficiency.
7 5 2 0
22 Mechanisms in place to reduce consumer disincentives for energy efficiency (e.g., including financing mechanisms).
4 1 0 0

5-10 Energy Efficiency as a Low-Cost Resource for Achieving Carbon Emissions Reductions
States Having Adopted Policy Step as of December 31, 2007
Electricity Services Natural Gas Services Implementation Goal and Key Steps
Completely Partially Completely Partially
Goal Eight: Establishing State of the Art Billing Systems
23 Consistent information to customers on energy use, costs of energy use, and options for reducing costs.a
TBD TBD TBD TBD
Goal Nine: Implementing State of the Art Efficiency Information Sharing and Delivery Systems
24 Investments in advanced metering, smart grid infrastructure, data analysis, and two-way communication to enhance energy efficiency.
5 29 b b
25 Coordinated energy efficiency and demand response programs established by customer class to target energy efficiency for enhanced value to customers.a
TBD TBD b b
26 Residential programs established to use trained and certified professionals as part of energy efficiency program delivery.
9 0 9 0
Goal Ten: Implementing Advanced Technologies
27 Policies in place to remove barriers to combined heat and power.
11 24 b b
28 Timelines developed for the integration of advanced technologies.a
TBD TBD TBD TBD
See Appendix D of the Vision for 2025 report (National Action Plan for Energy Efficiency, 2008a) for additional information on how these numbers have been determined. a See Appendix D of the Vision for 2025 report (National Action Plan for Energy Efficiency, 2008a) for
discussion of why progress on this policy step is not currently measured. b Steps 24, 25, and 27 do not apply to natural gas.
TBD = to be determined.
In addition, the Action Plan provides a comprehensive suite of resources and technical assistance to help states, utilities, and other stakeholders realize the Vision. Table 5-3 lists guides and papers that are available to assist in implementing each of the Vision goals.

National Action Plan for Energy Efficiency 5-11
Table 5-3. National Action Plan for Energy Efficiency Tools by Implementation Goals
Goal Detailed Action Plan Tools and Resources
Goal One: Establishing Cost-Effective Energy Efficiency as a High-Priority Resource
Guide to Resource Planning With Efficiency
Guide for Conducting Potential Studies
Communications Kit
Goal Two: Developing Processes to Align Utility and Other Program Administrator Incentives Such That Efficiency and Supply Resources Are on a Level Playing Field
Aligning Utility Incentives With Investment in Energy Efficiency Paper
Goal Three: Establishing Cost-Effectiveness Tests
Understanding Cost-Effectiveness of Energy Efficiency Programs Paper
Guide to Resource Planning With Efficiency
Guide for Conducting Potential Studies
Goal Four: Establishing Evaluation, Measurement, and Verification Mechanisms
Model Energy Efficiency Program Impact Evaluation Guide
Goal Five: Establishing Effective Energy Efficiency Delivery Mechanisms
Rapid Deployment Energy Efficiency Toolkit
Consumer Perspectives on Delivery of Energy Efficiency Brief
Customer Incentives Through Programs Brief (Under Development)
Goal Six: Developing State Policies to Ensure Robust Energy Efficiency Practices
Building Codes for Energy Efficiency Fact Sheet
Efficiency Program Interactions With Codes Paper
State and Local Lead-by-Example Guide
Goal Seven: Aligning Customer Pricing and Incentives to Encourage Investment in Energy Efficiency
Customer Incentives Through Rate Design Brief
Goal Eight: Establishing State of the Art Billing Systems
Utility Best Practices Guidance for Providing Business Customers With Energy Data
Goal Nine: Implementing State of the Art Efficiency Information Sharing and Delivery Systems
Paper on Coordination of Demand Response and Energy Efficiency (Under Development)
Goal Ten: Implementing Advanced Technologies
Most Energy-Efficient Economy Project (in Process)
Related State, Regional, and National Policies
Energy Efficiency as a Low-Cost Resource for Achieving Carbon Emissions Reductions Paper

5-12 Energy Efficiency as a Low-Cost Resource for Achieving Carbon Emissions Reductions
5.4 Summary of Findings
The information presented above can be summarized as follows:
Market and regulatory barriers can and are being reduced through targeted energy efficiency policies and programs, with the effect of increasing energy efficiency investment, reducing greenhouse gas emissions, and ultimately reducing the overall economic cost of climate policies.
– Policies and programs are available to address a range of identified market barriers to energy efficiency across the key end-use sectors and to address the prominent market transactions where these barriers limit investment.
– Policies and approaches are available to address a range of regulatory barriers that exist primarily at the state level.
Substantial progress has been made at the state level to advance energy efficiency policies and programs to address barriers, but more work needs to be done.
Additional work is necessary to better understand the extent to which individual policies and programs can address the existing barriers and help access the available, cost-effective energy efficiency potential.
The Vision for 2025 and supporting tools and resources offer important policy frameworks for state and local policy-makers and assistance for capturing low-cost energy efficiency resources.
5.5 Notes
1 For more information, see the Appliance Standards Awareness Project at <http://www.standardsasap.org>.
2 Based on data reported at <http://www.epa.gov/cleanenergy/energy-programs/state-and-local/efficiency_actions.html>.
3 Energy building codes have been adopted by 37 states for commercial buildings and 34 states for residential buildings. See <http://www.epa.gov/cleanenergy/energy-programs/state-and-local/efficiency_actions.html> for more information.
4 See the Action Plan’s Rapid Deployment Energy Efficiency Toolkit at <http://www.epa.gov/cleanenergy/energy-resources/ee_toolkit.html>.

National Action Plan for Energy Efficiency 6-1
6: How Climate Policies and Programs Leverage Energy Efficiency
This chapter reviews and summarizes the existing state and regional climate policies that leverage energy efficiency. It also provides a summary of key findings.
A review of climate-related policies and programs across the United States finds that energy efficiency is used in two main forms:
Within climate policy mechanisms. These policies are part of core climate policy mechanisms (e.g., a cap and trade program for greenhouse gases) and are used to encourage energy efficiency investment. An example of this is an allowance allocation approach whereby auction proceeds are used to fund energy efficiency programs.
As complementary energy policies/programs. These initiatives are not directly a part of the regulatory system governing the core climate policy; rather, they operate in parallel in the energy sector, with the intent of reducing total greenhouse gas emissions or reducing the cost of meeting greenhouse gas reduction targets. Many of these policies and programs were discussed in some detail in Chapter 5. Additional policies include energy efficiency resource standards (EERS).
6.1 Energy Efficiency Within Climate Policy Mechanisms
Figure 6-1 summarizes state policies that are being implemented in support of greenhouse gas reduction objectives.

6-2 Energy Efficiency as a Low-Cost Resource for Achieving Carbon Emissions Reductions
Figure 6-1. Leveraging Energy Efficiency in State Climate Policies
Sources: <http://epa.gov/climatechange/wycd/stateandlocalgov/state_planning.html> and <http://www.raponline.org/Slides/DF-RGGI_for_VLS_Parenteau_Class-10Apr09.pdf>.
Examples of each of these policy forms are provided below.
Regional Greenhouse Gas Initiative (RGGI). RGGI is a 10-state policy in the Northeast, comprising Maryland, Delaware, New Jersey, New York, Connecticut, Rhode Island, Massachusetts, Vermont, New Hampshire, and Maine. Since its origins in a 2003 governors’ agreement, RGGI has established a model regulation that establishes an electricity-sector CO2 cap and trade system. The program begins compliance in 2009, caps emissions in 2014, and then requires a 10 percent reduction by 2018.
Within RGGI’s regulations, the principal means through which efficiency is promoted is the RGGI allowance auction policy. The model rule requires that at least 25 percent of allowances be auctioned, and that the proceeds be used to support energy efficiency and other carbon emissions reduction strategies. States have for the most part structured their RGGI implementation rules to require higher auction percentages, most at or near 100 percent. As states have worked out their allowance auction processes and the use of allowance proceeds, energy efficiency has been designated for specific levels of funding. For example, the 2008 Maryland legislation establishing the state’s Strategic Energy Investment Fund designates 46

National Action Plan for Energy Efficiency 6-3
percent of allowance proceeds for energy efficiency (Maryland General Assembly, 2008). The first RGGI emissions allowance auction was held on September 25, 2008, producing a clearing price of $3.07/ton. At that price, Maryland would garner $117 million in total funds and $54 million for energy efficiency programs. Another 2008 Maryland bill (the EmPOWER Maryland Act), which sets energy savings targets for utilities, requires utilities to coordinate their efficiency programs with the state-run programs funded with RGGI dollars. Other RGGI states are taking similar approaches (Environment Northeast, 2009).
Most of the RGGI states are also pursuing complementary energy efficiency policies, including building codes, appliance standards, and EERS. These policies are referenced in various RGGI documents, including the following statement on complementary policies in the RGGI Memorandum of Understanding, which all participating states have signed:
COMPLEMENTARY ENERGY POLICIES
Each state will maintain and, where feasible, expand energy policies to decrease the use of less efficient or relatively higher polluting generation while maintaining economic growth. These may include such measures as: end-use efficiency programs, demand response programs, distributed generation policies, electricity rate designs, appliance efficiency standards and building codes. Also, each state will maintain and, where feasible, expand programs that encourage development of non-carbon emitting electric generation and related technologies.
EERS, which set overall energy savings targets for utility-sector efficiency programs, are in place in Vermont, New York, Connecticut, Maryland, and also in non-RGGI states such as Pennsylvania, Ohio, Illinois, Minnesota, Texas, North Carolina, and Colorado.
California Assembly Bill 32 (AB 32) legislation and subsequent actions from the California Air Resources Board (CARB) and CPUC. AB 32 is the authorizing legislation for CARB, CPUC, and other entities to act on several fronts to reduce greenhouse gas emissions. Key documents to date include the Climate Change Draft Scoping Plan: A Framework for Change (CARB, 2008) and CPUC’s Final Opinion on Greenhouse Gas Regulatory Strategies under Rulemaking 06-04-009 (CPUC, 2008).
The CARB Scoping Plan’s proposed portfolio of policies and programs is shown in Table 6-1. Energy efficiency policies, including transportation measures, account for more than one-third of total emissions reductions targeted under the plan.

6-4 Energy Efficiency as a Low-Cost Resource for Achieving Carbon Emissions Reductions
Table 6-1. California Air Resources Board AB 32 Compliance Plan Summary
Recommended Reduction Measures
Reductions Counted Toward
2020 Target (MMT CO2e)
Estimated Reductions Resulting From the Combination of Cap-and-Trade Program and Complementary Measures
146.7
California light-duty vehicle greenhouse gas standards Implement Pavley standards Develop Pavley II light-duty vehicle standards
31.7
Energy efficiency Building/appliance efficiency, new programs, etc. Increase CHP generation by 30,000 GWh Solar water heating (AB 1470 goal)
26.3
Renewables portfolio standard (33% by 2020) 21.3
Low carbon fuel standard 15
Regional transportation-related GHG targets 5
Vehicle efficiency measures 4.5
Goods movement Ship electrification at ports System-wide efficiency improvements
3.7
Million solar roofs 2.1
Medium-/heavy-duty vehicles Heavy-duty vehicle greenhouse gas emission reduction
(aerodynamic efficiency) Medium- and heavy-duty vehicle hybridization
1.4
High-speed rail 1.0
Industrial measures (for sources covered under cap and trade program) Refinery measures Energy efficiency and co-benefits audits
0.3
Additional reductions necessary to achieve the cap 34.4
Estimated Reductions From Uncapped Sources/Sectors 27.3
High global warming potential gas measures 20.2
Sustainable forests 5.0
Industrial measures (for sources not covered under cap and trade program) Oil and gas extraction and transmission
1.1
Recycling and waste (landfill methane capture) 1.0
Total Reductions Counted Towards 2020 Target 174

National Action Plan for Energy Efficiency 6-5
Other Recommended Measures Estimated 2020
Reductions (MMT CO2e)
State government operations 1-2
Local government operations TBD
Green buildings 26
Recycling and waste (other measures) 9
Water sector measures 4.8
Methane capture at large dairies 1.0
Source: CARB, 2008.
MMT CO2e = million metric tons of carbon dioxide equivalents.
The CPUC decision (CPUC, 2008) defers a number of specific issues, including the use of allowance auction proceeds, so it is not known to what extent this revenue stream will be applied to support energy efficiency-related efforts. However, this statement in CPUC’s recent greenhouse gas decision indicates an intention to devote some portion of allowance allocation revenues to energy efficiency:
We recommend that ARB require that all allowance auction revenues be used for purposes related to Assembly Bill (AB) 32, including the support of investments in renewables, energy efficiency, new energy technology, infrastructure, customer bill relief, and other similar programs. (p. 289)
Western Climate Initiative (WCI). This multi-state effort began in February 2007 when the governors of Arizona, California, New Mexico, Oregon, Montana, Utah, and Washington, plus four Canadian provinces, issued the Design Recommendations for the WCI Regional Cap-and-Trade Program in September 2008 (WCI, 2008). One statement in the Design Recommendations identifies energy efficiency as a targeted use for allowance revenues:
The WCI Partner jurisdictions agree that a portion of the value represented by each WCI Partner jurisdiction’s allowance budget (for example, through set-asides of allowances, a distribution of revenues from the auctioning of allowances, or other means) will be dedicated to one or more of the following public purposes which are expected to provide benefits region wide:
– Energy efficiency and renewable energy incentives and achievement;
– Research, development, demonstrations, and deployment (RDD&D) with particular reference to carbon capture & sequestration (CCS); renewable energy generation, transmission and storage; and energy efficiency;
– Promoting emissions reductions and sequestration in agriculture, forestry and other uncapped sources; and
– Human and natural community adaption to climate change impacts.
(p. 7)
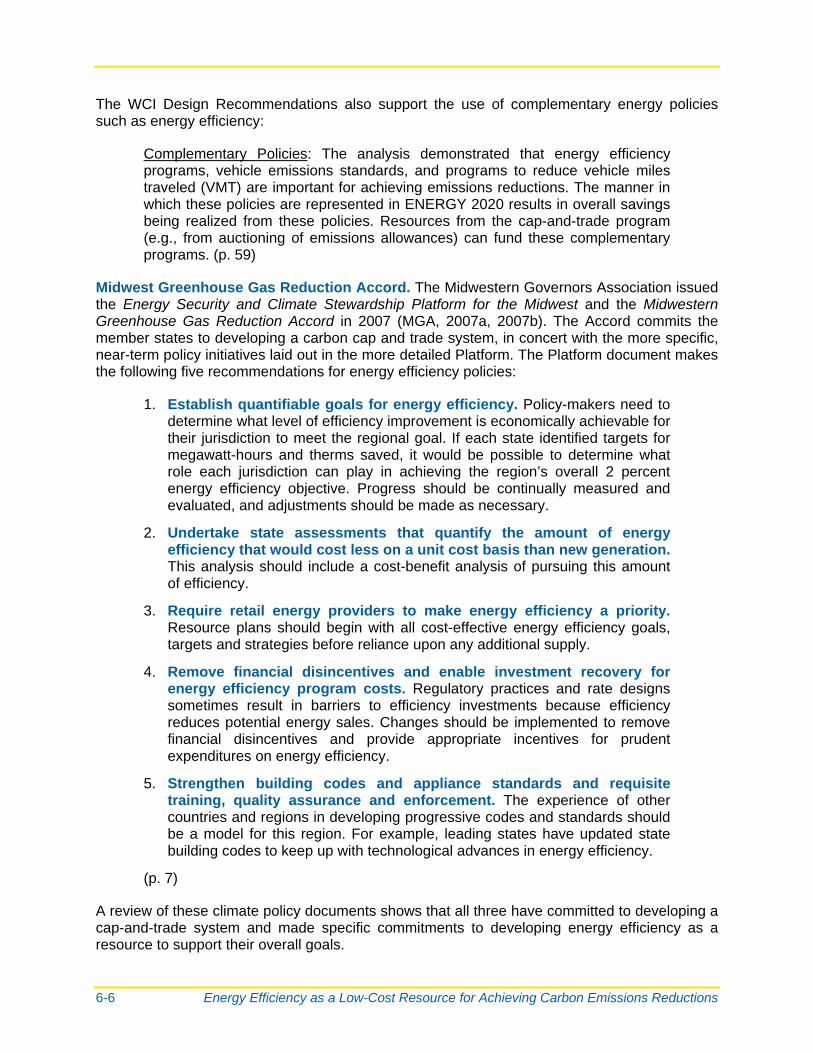
6-6 Energy Efficiency as a Low-Cost Resource for Achieving Carbon Emissions Reductions
The WCI Design Recommendations also support the use of complementary energy policies such as energy efficiency:
Complementary Policies: The analysis demonstrated that energy efficiency programs, vehicle emissions standards, and programs to reduce vehicle miles traveled (VMT) are important for achieving emissions reductions. The manner in which these policies are represented in ENERGY 2020 results in overall savings being realized from these policies. Resources from the cap-and-trade program (e.g., from auctioning of emissions allowances) can fund these complementary programs. (p. 59)
Midwest Greenhouse Gas Reduction Accord. The Midwestern Governors Association issued the Energy Security and Climate Stewardship Platform for the Midwest and the Midwestern Greenhouse Gas Reduction Accord in 2007 (MGA, 2007a, 2007b). The Accord commits the member states to developing a carbon cap and trade system, in concert with the more specific, near-term policy initiatives laid out in the more detailed Platform. The Platform document makes the following five recommendations for energy efficiency policies:
1. Establish quantifiable goals for energy efficiency. Policy-makers need to determine what level of efficiency improvement is economically achievable for their jurisdiction to meet the regional goal. If each state identified targets for megawatt-hours and therms saved, it would be possible to determine what role each jurisdiction can play in achieving the region’s overall 2 percent energy efficiency objective. Progress should be continually measured and evaluated, and adjustments should be made as necessary.
2. Undertake state assessments that quantify the amount of energy efficiency that would cost less on a unit cost basis than new generation. This analysis should include a cost-benefit analysis of pursuing this amount of efficiency.
3. Require retail energy providers to make energy efficiency a priority. Resource plans should begin with all cost-effective energy efficiency goals, targets and strategies before reliance upon any additional supply.
4. Remove financial disincentives and enable investment recovery for energy efficiency program costs. Regulatory practices and rate designs sometimes result in barriers to efficiency investments because efficiency reduces potential energy sales. Changes should be implemented to remove financial disincentives and provide appropriate incentives for prudent expenditures on energy efficiency.
5. Strengthen building codes and appliance standards and requisite training, quality assurance and enforcement. The experience of other countries and regions in developing progressive codes and standards should be a model for this region. For example, leading states have updated state building codes to keep up with technological advances in energy efficiency.
(p. 7)
A review of these climate policy documents shows that all three have committed to developing a cap-and-trade system and made specific commitments to developing energy efficiency as a resource to support their overall goals.

National Action Plan for Energy Efficiency 6-7
6.2 Energy Efficiency as a Complementary Policy
Many states are pursuing energy efficiency policies and programs outside of climate policy mechanisms due to the many benefits that energy efficiency provides, including low-cost CO2 emissions reductions. Table 6-2 shows how many states have adopted common energy efficiency policies.
Table 6-2. States With Common Energy Efficiency Policies in Place as of October 2008
Policy Number of States
State appliance standards 16
Building codes 43
EERS 21
Public benefit funds for energy efficiency 22
Source: <http://www.epa.gov/cleanenergy/energy-programs/state-and-local/efficiency_actions.html>.
6.3 Summary of Findings
Many states and local governments have recognized the important role of energy efficiency in their greenhouse gas reduction strategies and have developed targeted policies to capture the available low-cost energy efficiency opportunities. These policies include energy efficiency strategies that complement carbon policies, as well as the use of revenue from the carbon policy to fund energy efficiency programs.


National Action Plan for Energy Efficiency 7-1
7: Findings and Recommendations
This paper’s findings regarding energy efficiency as a resource for reducing CO2 emissions are summarized as follows:
Energy efficiency is a relatively large and low-cost resource available to states and other entities to meet future energy needs. Approximately 20 percent of end-use energy consumption can be saved at costs less than half that of new generation. This can reduce energy bills as well as the total cost of energy resources.
Current investment levels in energy efficiency are substantially below those needed to capture the achievable, low-cost potential of this resource.
Efficiency is a relatively large and low-cost carbon abatement resource. Given its low cost relative to new supply of energy, if tapped in substantial quantities beyond current investment levels, efficiency can help achieve carbon emissions reduction goals and lower the costs of meeting these goals—whether or not specific climate policies are in effect.
Energy prices alone are not likely to accelerate efficiency investment at the rate needed to tap the majority of efficiency’s economic potential. While more analysis is needed to quantify the specific impacts of barriers, it is generally clear that:
– Market and regulatory barriers are large and persistent. They include principal-agent barriers, information-cost or transaction-cost barriers, and regulatory policy barriers in the areas of resource planning and utility ratemaking.
– The price elasticity of energy consumption in many residential and commercial markets is relatively weak due to countervailing elasticity effects. Relying solely on price elasticity to drive efficiency investment is unlikely to capture a significant portion of cost-effective efficiency potential.
Targeted energy efficiency policies and programs are needed to reduce market and regulatory barriers. These policies and programs can help increase energy efficiency investment, reduce greenhouse gas emissions, and reduce the overall economic cost of climate policies.
– Policies and programs are available to address a range of identified market barriers to energy efficiency across the key economic sectors and to address the prominent market transactions where barriers limit investment.
– Policies and approaches are available to address a range of regulatory barriers that exist primarily at the state level.
Many states and local governments have recognized the important role of energy efficiency in their greenhouse gas reduction strategies and have developed targeted policies to capture the available low-cost energy efficiency opportunities. These policies include energy efficiency strategies that complement carbon policies as well as the use of revenue from the carbon policy to fund energy efficiency programs.
7-2 Energy Efficiency as a Low-Cost Resource for Achieving Carbon Emissions Reductions
The Action Plan’s Vision for 2025 and supporting tools and resources offer important policy frameworks and assistance for capturing low-cost energy efficiency resources.
Based on these findings, key recommendations are:
Energy efficiency should be a cornerstone of energy and/or climate policies at all levels of government, based on its proven status as a cost-effective option for reducing CO2 emissions and reducing the cost of climate policies.
Energy efficiency policies and programs should be pursued expeditiously, with an emphasis on establishing the necessary policy foundation for capturing all cost-effective energy efficiency as outlined in the Vision for 2025.

National Action Plan for Energy Efficiency A-1
Appendix A: National Action Plan for Energy Efficiency Leadership Group
Co-Chairs
Marsha Smith Commissioner, Idaho Public Utilities Commission Past President, National Association of Regulatory Utility Commissioners
James E. Rogers Chairman, President, and C.E.O. Duke Energy
Leadership Group
Barry Abramson Senior Vice President Servidyne Systems, LLC
Tracy Babbidge Director, Air Planning Connecticut Department of Environmental Protection
Angela Beehler Senior Director, Energy Regulation/Legislation Wal-Mart Stores, Inc.
Bruce Braine Vice President, Strategic Policy Analysis American Electric Power
Jeff Burks Director of Environmental Sustainability PNM Resources
Sandra Hochstetter Byrd Vice President, Strategic Affairs Arkansas Electric Cooperative Corporation
Kateri Callahan President Alliance to Save Energy
Jorge Carrasco Superintendent Seattle City Light
Lonnie Carter President and C.E.O. Santee Cooper
Sheryl Carter Co-Director, Energy Program Natural Resources Defense Council
Gary Connett Director of Environmental Stewardship and Member Services Great River Energy
Larry Downes Chairman and C.E.O. New Jersey Natural Gas (New Jersey Resources Corporation)
Roger Duncan General Manager Austin Energy
Neal Elliott Associate Director for Research American Council for an Energy-Efficient Economy
Angelo Esposito Senior Vice President, Energy Services and Technology New York Power Authority
Jeanne Fox President New Jersey Board of Public Utilities
Philip Giudice Commissioner Massachusetts Department of Energy Resources
Dian Grueneich Commissioner California Public Utilities Commission
Blair Hamilton Policy Director Vermont Energy Investment Corporation
Stephen Harper Global Director, Environment and Energy Policy Intel Corporation
Maureen Harris Commissioner New York State Public Service Commission
Mary Healey Consumer Counsel for the State of Connecticut Connecticut Consumer Counsel
Joe Hoagland Vice President, Energy Efficiency and Demand Response Tennessee Valley Authority
Val Jensen Vice President, Marketing and Environmental Programs ComEd (Exelon Corporation)
Mary Kenkel Consultant, Alliance One Duke Energy
A-2 Energy Efficiency as a Low-Cost Resource for Achieving Carbon Emissions Reductions
Ruth Kiselewich Director, Demand Side Management Programs Baltimore Gas and Electric Company
Harris McDowell Senator Delaware General Assembly
Ed Melendreras Vice President, Sales and Marketing Entergy Corporation
Janine Migden-Ostrander Consumers’ Counsel Office of the Ohio Consumers’ Counsel
Michael Moehn Vice President, Corporate Planning Ameren
Fred Moore Director, Manufacturing and Technology, Energy The Dow Chemical Company
Richard Morgan Commissioner District of Columbia Public Service Commission
Diane Munns Vice President, Regulatory Relations and Energy Efficiency MidAmerican Energy Company
Clay Nesler Vice President, Global Energy and Sustainability Johnson Controls, Inc.
Brock Nicholson Deputy Director, Division of Air Quality North Carolina Department of Environment and Natural Resources
Jed Nosal Chief, Office of Ratepayer Advocacy Massachusetts Office of Attorney General Martha Coakley
Pat Oshie Commissioner Washington Utilities and Transportation Commission
John Perkins Consumer Advocate Iowa Office of Consumer Advocate
Doug Petitt Vice President, Marketing and Conservation Vectren Corporation
Phyllis Reha Commissioner Minnesota Public Utilities Commission
Roland Risser Director, Customer Energy Efficiency Pacific Gas and Electric
Gene Rodrigues Director, Energy Efficiency Southern California Edison
Wayne Rosa Energy and Maintenance Manager Food Lion, LLC
Art Rosenfeld Commissioner California Energy Commission
Jan Schori General Manager Sacramento Municipal Utility District
Ted Schultz Vice President, Energy Efficiency Duke Energy
Larry Shirley Division Director North Carolina Energy Office
Paul Sotkiewicz Senior Economist, Market Services Division PJM Interconnection
Jim Spiers Senior Manager, Planning, Rates, and Member Services Tri-State Generation and Transmission Association, Inc.
Susan Story President and C.E.O. Gulf Power Company (Southern Company)
Tim Stout Vice President, Energy Efficiency National Grid
Debra Sundin Director, Energy Efficiency Marketing Xcel Energy
Paul Suskie Chairman Arkansas Public Service Commission
Dub Taylor Director Texas State Energy Conservation Office
David Van Holde Energy Manager, Department of Natural Resources and Parks King County, Washington
Brenna Walraven Managing Director, National Property Management USAA Realty Company
J. Mack Wathen Vice President, Regulatory Affairs Pepco Holdings, Inc.

National Action Plan for Energy Efficiency A-3
Mike Weedall Vice President, Energy Efficiency Bonneville Power Administration
Michael Wehling Strategic Planning and Research Puget Sound Energy
Henry Yoshimura Manager, Demand Response ISO New England, Inc.
Dan Zaweski Assistant Vice President, Energy Efficiency and Distributed Generation Long Island Power Authority
Observers
Rex Boynton President North American Technician Excellence
James W. (Jay) Brew Counsel Steel Manufacturers Association
Susan Coakley Executive Director Northeast Energy Efficiency Partnerships
Roger Cooper Executive Vice President, Policy and Planning American Gas Association
Mark Crisson President and C.E.O. American Public Power Association
Dan Delurey Executive Director Demand Response Coordinating Committee
Reid Detchon Executive Director Energy Future Coalition
Ron Edelstein Director, Regulatory and Government Relations Gas Technology Institute
Claire Fulenwider Executive Director Northwest Energy Efficiency Alliance
Sue Gander Director, Environment, Energy, and Natural Resources Division National Governors Association—Center for Best Practices
Jeff Genzer General Counsel National Association of State Energy Officials
Donald Gilligan President National Association of Energy Service Companies
Chuck Gray Executive Director National Association of Regulatory Utility Commissioners
Katherine Hamilton President GridWise Alliance
William Hederman Member, IEEE-USA Energy Policy Committee Institute of Electrical and Electronics Engineers
Marc Hoffman Executive Director Consortium for Energy Efficiency
John Holt Senior Manager of Generation and Fuel National Rural Electric Cooperative Association
Eric Hsieh Manager of Government Relations National Electrical Manufacturers Association
Lisa Jacobson Executive Director Business Council for Sustainable Energy
Wendy Jaehn Executive Director Midwest Energy Efficiency Alliance
Meg Matt President and C.E.O. Association of Energy Services Professionals
Joseph Mattingly Vice President, Secretary and General Counsel Gas Appliance Manufacturers Association
Kate Offringa President and C.E.O. North American Insulation Manufacturers Association
Ellen Petrill Director, Public/Private Partnerships Electric Power Research Institute
Christie Rewey Senior Policy Specialist National Conference of State Legislatures
Steven Schiller Board Director Efficiency Valuation Organization
Jerry Schwartz Senior Director American Forest and Paper Association

A-4 Energy Efficiency as a Low-Cost Resource for Achieving Carbon Emissions Reductions
Andrew Spahn Executive Director National Council on Electricity Policy
Ben Taube Executive Director Southeast Energy Efficiency Alliance
Rick Tempchin Interim Executive Director, Retail Energy Services Edison Electric Institute
Mark Wolfe Executive Director Energy Programs Consortium
Lisa Wood Executive Director Institute for Electric Efficiency
Facilitators
U.S. Department of Energy
U.S. Environmental Protection Agency

National Action Plan for Energy Efficiency B-1
Appendix B: Glossary
Achievable potential: The result of estimating how much market barriers and program uptake limits will reduce the economic potential.
Allowances: Allowances represent the amount of a pollutant that a source is permitted to emit during a specified time in the future under a cap and trade program. Allowances are often confused with credits earned in the context of project-based or offset programs, in which sources trade with other facilities to attain compliance with a conventional regulatory requirement. Cap and trade program basics are discussed at the following EPA Web site: <http://www.epa.gov/airmarkets/cap-trade/index.html>.
Avoided costs: The forecasted economic “benefits” of energy savings. These are the costs that would have been incurred if the energy efficiency had not been put in place.
Baseline: Conditions, including energy consumption and related emissions, that would have occurred without implementation of the subject project or program. Baseline conditions are sometimes referred to as “business-as-usual” conditions. Baselines are defined as either project-specific baselines or performance standard baselines.
Carbon dioxide reduction potential studies: Assessments of the impacts that energy efficiency could have on reducing U.S. carbon dioxide emissions.
Cost-effectiveness: A measure of the relevant economic effects resulting from the implementation of an energy efficiency measure. If the benefits outweigh the cost, the measure is said to be cost-effective.
Cost recovery: Recovery of the direct costs associated with utility program administration (including evaluation), implementation, and incentives to program participants.
Demand: The time rate of energy flow. Demand usually refers to electric power measured in kW (equals kWh/h) but can also refer to natural gas, usually as Btu/hr, kBtu/hr, therms/day, etc.
Discount rate: A measure of the time value of money. The choice of discount rate can have a large impact on the cost-effectiveness results for energy efficiency. As each cost-effectiveness test compares the net present value of costs and benefits for a given stakeholder perspective, its computation requires a discount rate assumption.
Economic potential: The result of reducing the technical potential by applying cost-effectiveness and program eligibility criteria.
End-use: A category of equipment or service that consumes energy (e.g., lighting, refrigeration, heating, process heat).

B-2 Energy Efficiency as a Low-Cost Resource for Achieving Carbon Emissions Reductions
Energy efficiency: The use of less energy to provide the same or an improved level of service to the energy consumer in an economically efficient way. “Energy conservation” is a term that has also been used, but it has the connotation of doing without in order to save energy rather than using less energy to perform the same or better function.
Energy efficiency measure: Installation of equipment, subsystems, or systems, or modification of equipment, subsystems, systems, or operations on the customer side of the meter, for the purpose of reducing energy and/or demand (and, hence, energy and/or demand costs) at a comparable level of service.
Energy resource plans: Assessments of the energy resources that are available to meet future energy needs for a specific geographic area or energy system. These plans can draw from energy efficiency potential studies, but apply them in a more focused and constrained framework.
Evaluation: The performance of studies and activities aimed at determining the effects of a program; any of a wide range of assessment activities associated with understanding or documenting program performance, assessing program or program-related markets and market operations; any of a wide range of evaluative efforts including assessing program-induced changes in energy efficiency markets, levels of demand or energy savings, and program cost-effectiveness.
Fixed costs: Expenses incurred by the utility that do not change in proportion to the volume of sales within a relevant time period.
Integrated resource planning: A public planning process and framework within which the costs and benefits of both demand- and supply-side resources are evaluated to develop the least-total-cost mix of utility resource options. In many states, integrated resource planning includes a means for considering environmental damages caused by electricity supply/transmission and identifying cost-effective energy efficiency and renewable energy alternatives.
Leakage: In the context of avoided emissions, emissions changes resulting from a project or program not captured by the primary effect (typically the small, unintended emissions consequences).
Levelized cost: A constant value or payment that, if applied in each year of the analysis, would result in a net present value equivalent to the actual values or payments which change (usually increase) each year. Often used to represent, on a consistent basis, the cost of energy saved by various efficiency measures with different useful lives.
Load shapes: Representations such as graphs, tables, and databases that describe energy consumption rates as a function of another variable such as time or outdoor air temperature.
Lost-opportunity: Refers to an efficiency measure or efficiency program that seeks to encourage the selection of higher-efficiency equipment or building practices than would typically be chosen at the time of a purchase or design decision.

National Action Plan for Energy Efficiency B-3
Marginal cost: The sum that has to be paid for the next increment of product or service. The marginal cost of electricity is the price to be paid for kilowatt-hours above and beyond those supplied by presently available generating capacity.
Market barriers: Market conditions that limit or constrain economic efficiency and, thus, result in less than economically optimal societal outcomes.
Market transformation: A reduction in market barriers resulting from a market intervention, as evidenced by a set of market effects, that lasts after the intervention has been withdrawn, reduced, or changed.
Monitoring: Gathering of relevant measurement data, including but not limited to energy consumption data, over time to evaluate equipment or system performance.
Non-participant: Any consumer who was eligible but did not participate in the subject efficiency program, in a given program year. Each evaluation plan should define “non-participant” as it applies to a specific evaluation.
Participant: A consumer who received a service offered through the subject efficiency program, in a given program year. In this definition, the “service” can be a wide variety of services, including financial rebates, technical assistance, product installations, training, energy efficiency information or other services, items, or conditions. Each evaluation plan should define “participant” as it applies to the specific evaluation.
Portfolio: Either (1) a collection of similar programs addressing the same market, technology, or mechanisms or (2) the set of all programs conducted by one organization.
Potential study: A study conducted to assess market baselines and energy efficiency savings potentials for different technologies and customer markets. Potential is typically defined in terms of technical, economic, achievable, and program potential.
Price elasticity: Refers to “price elasticity of demand,” which is the extent to which a change in the price of a product or service will affect the quantity demanded. In the context of energy efficiency, it refers to the effects of changes in energy prices on energy consumption.
Principal-agent barrier: A condition in which one entity (the agent) makes energy efficiency investment decisions, and another entity (the principal) pays the energy operating costs that flow from that decision.
Program: A group of projects, with similar characteristics and installed in similar applications.
Program administrators: Typically procure various types of energy efficiency services from contractors (e.g., consultants, vendors, engineering firms, architects, academic institutions, community-based organizations), as part of managing, implementing, and evaluating their portfolio of energy efficiency programs. Program administrators in many states are the utilities; in some states they are state energy agencies or third parties.

B-4 Energy Efficiency as a Low-Cost Resource for Achieving Carbon Emissions Reductions
Project: An activity or course of action involving one or more energy efficiency measures, at a single facility or site.
Regulatory barriers: Barriers created by adding constraints or prescriptions to market structures or practices. In the power sector, regulatory barriers to efficiency revolve around utility resource planning and ratemaking policies.
Resource planning study: Typically uses many of the same data sources and analytical techniques applied in potential studies. The principal difference is that a resource planning analysis uses timeframes, economic assumptions, and other factors specific to the utility service area.
Retrofit: Refers to an efficiency measure or efficiency program that seeks to encourage the replacement of functional equipment before the end of its operating life with higher efficiency units (also called “early-retirement”) or the installation of additional controls, equipment, or materials in existing facilities for purposes of reducing energy consumption (e.g., increased insulation, lighting occupancy controls, economizer ventilation systems).
Technical potential: An estimate of what energy and capacity savings would be achieved if all technically feasible efficiency measures were implemented for all customers. The technical potential is adjusted by applying a series of screens of real-world constraints.
Transaction-cost barrier: Refers to the condition in which energy users, even if they have the ability to choose an energy-efficient product or system, are unwilling to invest the time, effort, and analysis to make an economically optimal decision. Economists sometimes use terms like “information-cost” or “search cost” for this type of barrier.
National Action Plan for Energy Efficiency C-1
Appendix C: References
American Council for an Energy-Efficient Economy [ACEEE] (2004). The Technical, Economic, and Achievable Potential for Energy Efficiency in the United States: A Meta-Analysis of Recent Studies.
American Council for an Energy-Efficient Economy [ACEEE] (2008). Energizing Virginia: Efficiency First. <http://www.aceee.org/pubs/e085.htm>
Barbose, G., C. Goldman, and B. Neenan (2004). A Survey of Utility Experience With Real Time Pricing. Energy Analysis Department, Environmental Energy Technologies Division, Ernest Orlando Lawrence Berkeley National Laboratory. <http://eetd.lbl.gov/ea/EMS/EMS_pubs.html>
Bernstein, M., R. Lempert, D. Loughran, and D. Ortiz (2000). The Public Benefit of California's Investments in Energy Efficiency. MR-1212.0-CEC. Prepared for the California Energy Commission by the RAND Corporation. Santa Monica, California: RAND Corporation. <http://www.rand.org/pubs/monograph_reports/MR1212.0/>
California Air Resources Board [CARB] (2008). Climate Change Draft Scoping Plan: A Framework for Change. <http://www.arb.ca.gov/cc/scopingplan/document/psp.pdf>
California Public Utilities Commission [CPUC] (2008). Final Opinion on Greenhouse Gas Regulatory Strategies. <http://docs.cpuc.ca.gov/PUBLISHED/FINAL_DECISION/92591.htm>
Efficiency Vermont (2008). Year 2007 Annual Report. <http://www.efficiencyvermont.com/stella/filelib/AR2007_Revised_MW.pdf>
Ehrhardt-Martinez, K., and J.A. Laitner (2008). The Size of the U.S. Energy Efficiency Market: Generating a More Complete Picture. American Council for an Energy-Efficient Economy, report no. E083. <http://www.aceee.org/pubs/e083.htm>
U.S. Energy Information Administration [EIA] (2008). Form EIA-861 Final Data File for 2006. Accessed 2008. <http://www.eia.doe.gov/cneaf/electricity/page/eia861.html>
Eldridge, M., M. Neubauer, D. York, S. Vaidyanathan, A. Chittum, and S. Nadel (2008). The 2008 State Energy Scorecard. American Council for an Energy-Efficient Economy, report no. E086. <http://www.aceee.org/pubs/E086.pdf>
Environment Northeast (2009). RGGI Allowance Allocations & Use of Auction Proceeds. March 24, 2009. <http://www.env-ne.org/public/resources/pdf/ENE_Auction_Tracker_040209.pdf>
U.S. Environmental Protection Agency [EPA] (2006). Clean Energy-Environment Guide to Action: Policies, Best Practices, and Action Steps for States. <http://www.epa.gov/cleanenergy/documents/gta/guide_action_full.pdf>

C-2 Energy Efficiency as a Low-Cost Resource for Achieving Carbon Emissions Reductions
U.S. Environmental Protection Agency [EPA] (2008). ENERGY STAR and Other Climate Protection Partnerships: 2007 Annual Report. <http://www.energystar.gov/ia/news/downloads/annual_report_2007.pdf>
Electric Power Research Institute [EPRI] (2007). The Power to Reduce CO2 Emissions: The Full Portfolio. EPRI Technology Assessment Center.
Electric Power Research Institute [EPRI] (2009). Assessment of Achievable Potential From Energy Efficiency and Demand Response Programs in the U.S. (2010–2030).
Faruqui, A., and L. Wood (2008). Quantifying the Benefits of Dynamic Pricing in the Mass Market. Edison Electric Institute.
Forefront Economics, Inc., H. Gil Peach and Associates, and PA Consulting Group (2007). Duke Energy Carolinas DSM Action Plan: North Carolina Draft Report. Prepared for Duke Energy Carolinas.
GDS Associates (2006). A Study of the Feasibility of Energy Efficiency as an Eligible Resource as Part of a Renewable Portfolio Standard for the State of North Carolina. Report to the North Carolina Utilities Commission. <http://www.ncuc.commerce.state.nc.us/reps/NCRPSEnergyEfficiencyReport12-06.pdf>
Georgia Environmental Facilities Authority (2005). Assessment of Energy Efficiency Potential in Georgia. <http://www.gefa.org/Modules/ShowDocument.aspx?documentid=46>
Hopper, N., C. Goldman, and J. Schlegel (2006). Energy Efficiency in Western Utility Resource Plans: Impacts on Regional Resource Assessment and Support for WGA Policies. Ernest Orlando Lawrence Berkeley National Laboratory, report no. LBNL 58271. <http://eetd.lbl.gov/ea/ems/reports/58271.pdf>
Hopper, N., G. Barbose, C. Goldman, and J. Schlegel (2008). Energy Efficiency as a Preferred Resource: Evidence From Utility Resource Plans in the Western United States and Canada. Ernest Orlando Lawrence Berkeley National Laboratory, report no. LBNL-1023E. <http://eetd.lbl.gov/ea/EMS/reports/lbnl-1023e.pdf>
International Energy Agency [IEA] (2007). Mind the Gap: Quantifying Principal-Agent Problems in Energy Efficiency. <http://www.iea.org/Textbase/publications/free_new_Desc.asp?PUBS_ID=1954>
Intergovernmental Panel on Climate Change [IPCC] (2007). Summary for Policymakers. In B. Metz, O.R. Davidson, P.R. Bosch, R. Dave, and L.A. Meyer, eds. Climate Change 2007: Mitigation. Contribution of Working Group III to the Fourth Assessment Report of the Intergovernmental Panel on Climate Change. Cambridge, United Kingdom, and New York, NY: Cambridge University Press. <http://www.ipcc.ch/pdf/assessment-report/ar4/wg3/ar4-wg3-spm.pdf>

National Action Plan for Energy Efficiency C-3
Itron (2006). California Energy Efficiency Study. CALMAC Study ID: PGE0211.01. <http://www.calmac.org/publications/PGE_PotentialStudy_Vol1_05242006.pdf>
Kushler, M., D. York, and P. Witte (2004). Five Years In: An Examination of the First Half-Decade of Public Benefits Energy Efficiency Policies. American Council for an Energy-Efficient Economy, report no. U041. <http://www.aceee.org/pubs/u041.htm>
Kutscher, C.F., ed. (2007). Tackling Climate Change in the U.S.: Potential Carbon Emissions Reductions From Energy Efficiency and Renewable Energy by 2030. American Solar Energy Society. <http://ases.org/images/stories/file/ASES/climate_change.pdf>
Maryland General Assembly (2008). Regional Greenhouse Gas Initiative—Maryland Strategic Energy Investment Program. House Bill 368. <http://mlis.state.md.us/2008rs/billfile/hb0368.htm>
McDonough, C., and R. Kraus (2007). Does Dynamic Pricing Make Sense for Mass Market Customers? The Electricity Journal 20(7):26–37.
McKinsey & Company (2009). Unlocking Energy Efficiency in the US Economy. <http://www.mckinsey.com/clientservice/electricpowernaturalgas/downloads/US_energy_efficiency_full_report.pdf>
McKinsey & Company (2007). Reducing U.S. Greenhouse Gas Emissions: How Much at What Cost? <http://www.mckinsey.com/clientservice/ccsi/greenhousegas.asp>
Midwestern Governors Association [MGA] (2007a). Energy Security and Climate Stewardship Platform for the Midwest. <http://www.midwesterngovernors.org/Publications/MGA_Platform2WebVersion.pdf>
Midwestern Governors Association [MGA] (2007b). Midwestern Greenhouse Gas Accord. <http://www.midwesterngovernors.org/Publications/Greenhouse gas accord_Layout 1.pdf>
Minnesota Office of the Legislative Auditor (2005). Evaluation Report: Energy Conservation Improvement Program. <http://www.auditor.leg.state.mn.us/Ped/pedrep/0504all.pdf>
Nadel, S., A. deLaski, M. Eldridge, and J. Kliesch (2006). Leading the Way: Continued Opportunities for New State Appliance and Equipment Efficiency Standards. American Council for an Energy-Efficient Economy, report no. A062. <http://www.aceee.org/pubs/a062.htm>
National Action Plan for Energy Efficiency (2006). National Action Plan for Energy Efficiency. <http://www.epa.gov/eeactionplan>
National Action Plan for Energy Efficiency (2007a). Aligning Utility Incentives With Investment in Energy Efficiency. Prepared by Val R. Jensen, ICF International. <http://www.epa.gov/eeactionplan>

C-4 Energy Efficiency as a Low-Cost Resource for Achieving Carbon Emissions Reductions
National Action Plan for Energy Efficiency (2007b). Guide for Conducting Energy Efficiency Potential Studies. Prepared by Philip Mosenthal and Jeffrey Loiter, Optimal Energy, Inc. <http://www.epa.gov/eeactionplan>
National Action Plan for Energy Efficiency (2007c). Guide to Resource Planning With Energy Efficiency. Prepared by Snuller Price et al., Energy and Environmental Economics, Inc. <http://www.epa.gov/eeactionplan>
National Action Plan for Energy Efficiency (2008a). National Action Plan for Energy Efficiency Vision for 2025: A Framework for Change. <http://www.epa.gov/eeactionplan>
National Action Plan for Energy Efficiency (2008b). Sector Collaborative on Energy Efficiency Accomplishments and Next Steps. Prepared by ICF International. <www.epa.gov/eeactionplan>
National Action Plan for Energy Efficiency (2008c). Understanding Cost-Effectiveness of Energy Efficiency Programs: Best Practices, Technical Methods, and Emerging Issues for Policy-Makers. Prepared by Energy and Environmental Economics, Inc., and Regulatory Assistance Project. <http://www.epa.gov/eeactionplan>
National Action Plan for Energy Efficiency (2008d). Utility Best Practices Guidance for Providing Business Customers With Energy Use and Cost Data. Prepared by ICF International. <http://www.epa.gov/eeactionplan>
Neenan, B. (2008). Juneau Response to Jolt Confirms Price Elasticity. The Electricity Journal 21(5):4–5.
Nevius, M., J. Krouk, S. Griffith, and C. Lasky (2008). Energy Efficiency Programs: A $3.7 Billion U.S. and Canadian Industry. Boston: Consortium for Energy Efficiency. <http://www.cee1.org/ee-pe/2007/>
Northwest Power and Conservation Council [NWPCC] (2005). The Fifth Northwest Electric Power and Conservation Plan. <http://www.nwcouncil.org/energy/powerplan/5/Default.htm>
Northwest Power and Conservation Council [NWPCC] (2009). Draft Sixth Northwest Power Plan. <http://www.nwcouncil.org/energy/powerplan/6/default.htm>
New York State Energy Research and Development Authority [NYSERDA] (2003). Energy Efficiency and Renewable Energy Resource Development Potential in New York State. <http://www.nyserda.org/sep/EE&ERpotentialVolume1.pdf>
Siddiqui, A.S. (2003). Price-Elastic Demand in Deregulated Electricity Markets. Energy Analysis Department, Environmental Energy Technologies Division, Ernest Orlando Lawrence Berkeley National Laboratory. <http://eetd.lbl.gov/ea/EMS/EMS_pubs.html>

National Action Plan for Energy Efficiency C-5
Western Climate Initiative [WCI] (2008). Design Recommendations for the WCI Regional Cap-and-Trade Program. <http://www.westernclimateinitiative.org/the-wci-cap-and-trade-program/design-recommendations>
Western Governors’ Association [WGA] (2006). Energy Efficiency Task Force Report. Western Governors’ Association Clean and Diversified Energy Initiative. <http://www.westgov.org/wga/initiatives/cdeac/Energy%20Efficiency-full.pdf>


Funding and printing for this report was provided by the U.S. Department of Energy and U.S. Environmental Protection Agency in their capacity as co-sponsors for the National Action Plan for Energy Effi ciency.