feasibility of achieving a carbon-neutral or zero
TRANSCRIPT

Attachment A
1


King County Metro Transit
Feasibility of Achieving a Carbon-Neutral or Zero-Emission Fleet
March 2017
Department of Transportation
Metro Transit Division King Street Center, KSC-TR-0415
201 S. Jackson St Seattle, WA 98104
206-553-3000 TTY Relay: 711 www.kingcounty.gov/metro
Alternative Formats Available 206-477-3832 TTY Relay: 711

This report was prepared by King County Metro Transit, with technical analysis and support from Sam Schwartz Consulting and WSP | Parsons Brinckerhoff and input provided by representatives of the following stakeholders: City of Kent, Climate Solutions, Got Green, Puget Sound Energy, Transportation Choices Coalition, Puget Sound Clean Air Agency, and Puget Sound Sage.

CONTENTS
EXECUTIVE SUMMARY .................................................................................................................................. 1
INTRODUCTION ............................................................................................................................................. 4
About this report ....................................................................................................................................... 4
Structure of this report .............................................................................................................................. 5
BACKGROUND: KING COUNTY COMMITMENT TO REDUCING EMISSIONS FROM TRANSPORTATION ........ 8
BACKGROUND: METRO’S CURRENT FLEET PRACTICES ............................................................................... 11
OPTION 1: CARBON-NEUTRAL FLEET THROUGH GHG ACCOUNTING APPROACH ...................................... 18
Findings .................................................................................................................................................... 18
OPTION 2: CARBON-NEUTRAL FLEET THROUGH PURCHASE OF CARBON OFFSETS ................................... 19
Findings .................................................................................................................................................... 20
OPTION 3: TRANSITION TO A ZERO-EMISSION BUS FLEET POWERED BY RENEWABLE ENERGY ................ 21
Findings .................................................................................................................................................... 22
THE FEASIBILITY AND POTENTIAL OUTCOMES OF TRANSITIONING TO A ZERO-EMISSION FLEET POWERED BY RENEWABLE ENERGY ............................................................................................................................. 23
Service and fleet ...................................................................................................................................... 25
Cost .......................................................................................................................................................... 36
Supporting systems ................................................................................................................................. 46
Environment ............................................................................................................................................ 51
Equity ....................................................................................................................................................... 57
Findings .................................................................................................................................................... 63
CONCLUSIONS ............................................................................................................................................. 64
RECOMMENDATION AND NEXT STEPS ....................................................................................................... 65
ACKNOWLEDGEMENTS ............................................................................................................................... 69

1
EXECUTIVE SUMMARY
King County Metro Transit has a long history of leadership and action to confront climate change and to promote equity and social justice, and is committed to advancing the goals and priorities of King County’s Strategic Climate Action Plan as well as the Equity and Social Justice Strategic Plan.
This report, Feasibility of Achieving a Carbon-Neutral or Zero-Emission Fleet, recommends that Metro now make significant new contributions in both areas by transitioning to a zero-emission bus fleet powered by renewable energy, and by focusing early deployment of zero-emission buses in the communities that are most vulnerable to air pollution.
A successful transition will depend on a number of conditions being met over the years ahead, including advancements in bus technology, charging infrastructure development, affordable costs, and management of risks.
__________
This report responds to Motion 14633, in which the County Council requested an assessment of the feasibility of achieving either a carbon-neutral or a zero-emission Metro vehicle fleet. We evaluated several alternatives to Metro’s current practice of replacing diesel buses with diesel-electric hybrids and maintaining an electric trolley fleet. Our assessment considered service needs, costs, necessary supporting systems, environmental results, and social equity benefits. We assessed the following options:
Option 1: Using an accounting approach that considers Metro’s efforts to avoid emissions through increased ridership, which removes vehicles from our roadways and contributes to a more compact built environment. We found that under this approach, Metro’s fleet would already be considered net carbon-neutral. There would be no changes made in our operations, fleet or supporting systems under this option. Pursuit of this strategy would not achieve the County’s commitment in the 2015 Strategic Climate Action Plan to directly reduce greenhouse-gas (GHG) emissions from the operation of our transit fleet or set us on a long-term path to reduce our region’s transport emissions nor would it reduce air pollution or public health inequities resulting from poor air quality.
Option 2: Purchase carbon offsets from external providers. Metro could purchase carbon offsets from GHG projects that reduce emissions from sources outside of our own operations. We concluded that while purchasing offsets could be a relatively low cost option for reducing GHG emissions and having a net carbon-neutral fleet, as with option one this approach is not aligned with the policy priorities in the County’s 2015 Strategic Climate Action Plan to focus on efforts that directly reduce GHG emissions nor does it set Metro on a long-term low-carbon path. Furthermore, this option would not improve local air quality or provide associated public health benefit to King County residents.
Option 3: Transition to a zero-emission fleet powered by renewable energy. Under this approach Metro would transition to a fleet of all-electric trolley and battery-electric buses that have no tailpipe GHG or air pollutant emissions, and would purchase power from sources with no associated emissions from generation. This approach would require the acquisition of electric vehicles, operational changes, and installation of charging infrastructure, and might require service adjustments. This option would directly reduce Metro’s emissions of GHG and other air pollutants,

2
reduce the noise of buses, and would yield air quality benefits to local communities. It would lead to a carbon-neutral fleet when the fleet transition is complete. Because this option aligns with the 2015 Strategic Climate Action Plan and would deliver environmental and social benefits that options one and two could not provide, this report focuses on an extensive assessment of its feasibility and potential results.
Assuming continued rapid development of battery bus technology to meet Metro’s service and operating needs, all future bus purchases and all new buses put into operation starting in 2020 would be zero-emission. To increase the environmental, climate change, and health benefits of this transition, Metro would seek to power these buses with renewable electricity. Through ongoing fleet replacement and expansion, Metro would commit to completing the transition to a zero-emission fleet by as early as 2034, or by 2040 at the latest, depending on technology requirements and other implementation considerations.
Transitioning to a zero-emissions fleet would advance the goals and policy priorities of King County’s 2015 Strategic Climate Action Plan by directly reducing transportation-related GHG emissions. The benefits would increase as Metro works to increase service by 70 percent and double transit ridership by 2040, as envisioned in the Metro Connects long-range plan.
This option also aligns with the County’s Equity and Social Justice Strategic Plan. The battery-bus feasibility analysis shows how the air pollution benefit of zero-emission technology could advance social equity by first serving communities most vulnerable to air pollution. By prioritizing deployment of new zero-emission buses to routes originating at South Base, Metro could improve air quality and public health outcomes in low-income and minority (underrepresented communities of color), which historically have borne an undue share of vehicle emission and health impacts.
Option 3 would contribute to the Countywide Strategic Plan by taking steps that simultaneously reduce climate pollution and improve human health in King County.
Metro’s transition to a zero-emission fleet could have benefits beyond our region by serving as a model for transit agencies across our state and nation.
This table summarizes key findings of the carbon neutral fleet options considered in this feasibility study:
Evaluation criteria
Option 1 Carbon-neutral fleet through GHG accounting approach
Option 2 Carbon-neutral fleet through purchase of carbon offsets
Option 3 Transition to zero-emission bus fleet powered with renewable energy
Service and fleet needs
No impacts or benefits No impacts or benefits
Current battery-bus technology could meet 70% of service needs, assuming 60-foot bus performance is proven. Could rise to 90% by 2018/2020 with expected technology advancements.
Cost No impacts or benefits Est. cost range is $445,000-$1.2M annually, not including program costs
Battery bus life-cycle cash costs estimated to be 6 percent higher than diesel-hybrids; 2 percent higher when societal costs are included; costs could decline as technology/market matures.
Supporting systems
No impacts or benefits No impacts or benefits Gradual introduction of buses/charging infrastructure not expected to disrupt service.

3
Environment No impacts, no direct benefits
Indirect GHG emission reductions. No air pollutant reductions. No local benefits.
Could reduce up to 1.8M tons CO2 emissions by 2040, eliminate tailpipe air pollutants and reduce noise improving quality of life for local residents.
Social equity No impacts or benefits No impacts, no direct benefits
Would improve local air quality. Deploying zero-emission buses first to vulnerable communities could advance social equity.
Metro will need to collaborate with the bus manufacturing industry, other transit agencies, and utilities to ensure progress on the following technical and policy requirements for a successful transition to a zero-emissions fleet powered by renewable energy:
Vehicle and charging technology enables Metro to meet current and future service goals, as defined in Metro Connects. Examples are a 60-foot articulated battery bus, electric vanpool and Access vehicles, and charging technology that successfully meets charging times and vehicles ranges.
Charging infrastructure meets our standard operation procedure requirements, including charging standardization and on-base charging compatible with bus base and facility capacity constraints.
Metro is able to secure renewable energy supplies via purchases from Puget Sound Energy through the Green Direct Program or approval of Metro’s Renewable Identification Number application to the U.S. EPA for the sale of environmental attributes or other future renewable power purchase options.
To move successfully toward a transition to a zero-emission fleet powered by renewable energy, Metro would also continue to collaborate with the bus manufacturing industry, power providers, local communities and others to ensure the following safety, financial and service factors are addressed:
Safety for both customers and employees must be maintained or improved over current standards.
Staff training and development opportunities are provided to Metro employees.
Public outreach processes are in place to maximize benefits and limit burdens to local communities.
Equity impact review is used to target service with zero-emission vehicles to communities that are most vulnerable to the impacts of poor air quality.
Continued monitoring of total costs of transitioning to a zero-emission fleet to ensure incremental costs do not limit Metro’s ability to deliver and expand service. If incremental cost increases occur, Metro will seek partnerships and other funding sources to offset these increases.
Emergency preparedness plan and procedures are in place to ensure Metro can be responsive in an emergency by the time Metro reaches the point that the fleet is majority zero-emission buses. An example is back-up power generation.
In addition to guiding Metro, this feasibility report will inform the work we are doing with other departments to develop and transmit a Carbon Neutral King County Plan to the County Council by February 2019, with an interim progress report by Dec. 31, 2017.

4
INTRODUCTION
About this report In April 2016, the King County Council approved Motion 14633, requesting that the Executive transmit a report addressing the feasibility of achieving a carbon-neutral or zero-emission transit fleet.
“MOTION 14633.
C.1. The executive is requested to develop and transmit a feasibility report that identifies and analyzes strategies for and barriers to achieving a carbon-neutral or zero-emission vehicle fleet, including the vanpool fleet.”
The Council requested that the report provide an analysis and recommendation on whether Metro should adopt a carbon-neutral or a zero-emission fleet goal, provide a range of possible target dates for achieving that goal, identify any changes needed in Metro’s strategic plan or long-range plan to attain the goal, and engage a group of stakeholders to provide input on the plan.
The motion specifically requested analyses of costs and benefits of the potential goals, Metro’s battery buses and other fleet and infrastructure technology, how Metro’s carbon offset program could be implemented, any market gaps that should be addressed, and how the recommended goal would affect equity and social justice.1
Metro responded to the motion by convening a Stakeholder Review Panel and a Technical Review Panel to provide direction and input for the analysis. Given the rapidly evolving nature of zero-emission vehicle technology and the challenges with matching Metro’s service needs with existing bus technology, Metro commissioned Sam Schwartz Consulting and WSP–Parsons Brinckerhoff to provide technical assistance.
1 King County. Motion 14633. A MOTION requesting Metro Transit transmit a feasibility report for achieving a carbon-neutral or zero-emission fleet. April 27, 2016. Available at: http://aqua.kingcounty.gov/Council/Clerk/OldOrdsMotions/Motion%2014633.pdf

5
Structure of this report This report begins by providing background information on current Metro practices of replacing retiring diesel buses with diesel-hybrids and maintaining an all-electric trolley fleet, with limited expansion of Metro’s zero-emission battery-electric bus fleet. The report then summarizes the evaluation of alternatives for achieving a carbon-neutral or zero-emission Metro fleet. Then the report provides a detailed analysis of the feasibility and outcomes of transitioning to a zero-emission fleet. It concludes with recommendations and next steps for Metro.
There is no universally accepted definition of carbon neutrality. Put simply, “carbon-neutral” means having no carbon emissions. Carbon-neutral is often discussed in terms of being net carbon-neutral, where emission reductions equal emission sources.
Typically, an organization’s first step to achieve carbon neutrality is to directly reduce emissions from internal projects. The second step, as needed, is to reduce emissions indirectly–through the purchase of carbon offsets or renewable energy, for example. The King County 2015 Strategic Climate Action Plan follows this approach, giving first priority to directly reducing our demand for fossil fuels through fleet and energy efficiency before exploring opportunities to reduce the carbon intensity of the energy we use or to indirectly offset emissions.
Zero-emission vehicles include battery-electric or hydrogen fuel cell vehicles that have no tailpipe emissions and produce no local air pollution or GHG emissions during operation. Here we focus on battery-electric zero-emission vehicles. Overall reductions in emissions from a zero-emission fleet depend on the source and production of the electricity the vehicles use, so achieving large-scale emission reductions depends on pairing zero-emission vehicles with low- to zero-emission electricity sources.
Roles of the review panels
Following the County Council’s direction, the Stakeholder Review Panel included a maximum of seven participants from groups focused on low-income communities, racial equity, public health, climate change, and public transit. Representatives from Puget Sound Sage, Got Green, Puget Sound Clean Air Agency, Transportation Choices Coalition, Climate Solutions, Puget Sound Energy, and the City of Kent met three times from October 2016 to January 2017 to provide input and feedback.
In particular, the panel was asked to review the draft and final feasibility assessment and ensure the analysis is an effective and comprehensive evaluation of the potential for negative impacts and positive benefits for our target service levels and the communities we serve, as well as ensure the recommendation reflects the priorities of communities of color, low-income communities, transit dependent communities, communities most impacted by the health concerns of high-traffic bus corridors, public transit riders, and priorities related to addressing climate change and providing the infrastructure to support vehicle electrification.
The internal Technical Review Panel comprised staff members from a number of Metro sections: Vehicle Maintenance, Service Development, Power and Facilities, Finance and Budget, Human Resources, Operations, Design and Construction, and Strategy and Performance. This panel met five times through December 2016 to review the analysis and methodology and ensure they reflected Metro’s priorities and conditions.
6
Metro identified and compared three options for achieving a net carbon-neutral or zero-emission fleet:
Option 1 – Using an accounting approach that considers Metro’s efforts to avoid emissions through increased ridership. Metro would include all activities within our direct influence (e.g. building ridership and resulting displacement of single occupancy vehicle travel) to quantify net emissions
Option 2 – Purchasing carbon offsets from external providers. Metro would indirectly reduce emissions through the purchase of carbon offsets. Option 3 – Transitioning to an all-electric zero-emission fleet powered by renewable energy. Metro would reduce emissions directly by transitioning to a zero-emission fleet and powering electric vehicles with renewable energy
For all options, this report assesses the feasibility of achieving the goal without incurring additional costs that cause a reduction in transit service levels, an increase in GHG emissions, or a negative impact on the public’s ability to use transit. The report also evaluates a range of possible target dates to achieve a net carbon-neutral or zero-emission battery-bus fleet powered by renewable energy.
Each of the options is assessed using the following five evaluation criteria:
Service and Fleet: The extent to which the vehicle fleet can meet Metro’s service levels, service quality, and transit access needs. This criterion is important for achieving the Metro Connects long-range plan as well as the Executive’s priority of enhancing regional mobility.
Cost: The potential cost for vehicles, operations, maintenance or other factors, and the implications for Metro’s ability to deliver service to our customers. Financial stewardship is a key principle in the Executive’s goal for King County to be the best-run government in the nation.
Supporting Systems: The feasibility and impacts of developing the infrastructure, bus base facilities, and workforce capacities to meet Metro’s service and operational needs. This criterion is also important for achieving the Metro Connects long-range plan as well as the Executive’s priority of enhancing regional mobility.
Environment: The degree to which each option would contribute to achieving King County’s and Metro’s goals and targets for reducing GHG emissions and criteria air pollutants, as defined in the 2015 Strategic Climate Action Plan and the Countywide Strategic Plan.
Equity: The degree to which each option ensures the equitable distribution of benefits and avoids a disproportionate burden of negative impacts on low-income and minority communities. This criterion is important for achieving King County’s Equity and Social Justice Strategic Plan, a key priority for the Executive.
These options and issues will be evaluated in more detail as part of the countywide strategy to develop an implementation plan for making King County government carbon-neutral. The 2016 Comprehensive Plan includes a new policy, F-215b, directing the County to “strive to provide services and build and operate public buildings and infrastructure that are carbon neutral.” As part of the council-directed work plan in support of the Comprehensive Plan, the Executive is committed to develop and transmit a Carbon Neutral King County Plan to Council by February 2019, with an interim progress report by Dec. 31, 2017. The plan will assess and identify the actions, costs and schedule for achieving carbon-neutral status across all King County government operations, including Metro. Metro will work closely with all departments to develop a comprehensive plan that further explores options to achieve carbon neutrality.

7
In this report, our analysis is most in-depth on the feasibility of transitioning to a zero-emission fleet. Metro has already considered options for generating carbon offsets in prior reports to the County Council, and will be actively engaged in responding to the Council’s request to assess and develop a carbon neutral implementation plan for King County. In addition, the trial and adoption of zero-emission battery-electric buses is progressing rapidly at Metro and across the country, and there is a great demand for in-depth analysis around how and whether these vehicles and associated infrastructure can meet Metro’s service needs.
While this report focuses on Metro’s bus fleet, Metro also operates non-revenue passenger vehicles, Access vans, and commuter VanPool and metropool vehicles. The report includes a high-level summary of the feasibility and status of transitioning the VanPool fleet from conventional internal combustion vans to zero-emission vans.
The results of this study will serve as a roadmap for Metro, and guiding fleet procurement and fleet deployment. To guide future decision-making in this rapidly changing transportation landscape, the analyses and priorities may be updated as new information becomes available.
8
BACKGROUND: KING COUNTY COMMITMENT TO REDUCING EMISSIONS FROM TRANSPORTATION
Transportation accounts for nearly half of all greenhouse gas emissions in Washington. In King County, fossil fuel use for transportation is one of the top two sources of GHG emissions.2
Action to reduce GHG emissions and prepare for the impacts of climate change has been a long-standing priority for King County and in 2015 Council adopted King County’s Strategic Climate Action Plan3 , a blueprint to reduce emissions from county services and operations and prepare for the impacts of climate change. Metro plays a particularly important role in reducing emissions countywide by expanding and improving products and services to grow transit ridership, ease traffic congestion, and reduce single-occupancy vehicle miles traveled (VMT); by promoting compact, active, pedestrian- and transit-oriented communities; and by supporting non-motorized travel. As one of our region’s largest consumers of diesel fuel and operator of a fleet of heavy-duty vehicles, Metro also plays an important role in reducing emissions in our own operations.
King County’s 2015 Strategic Climate Action Plan and Metro’s Sustainability Plan set targets and priority actions for reducing emissions and increasing efficiency. The Strategic Climate Action Plan establishes countywide GHG emission reduction targets of 25 percent by 2020, 50 percent by 2030, and 80 percent by 2050, relative to a 2007 baseline. The County has committed to reducing GHG emissions from its own operations by 25 percent by 2020 and 50 percent by 2030, relative to a 2007 baseline.
The following are targets or priority actions for increasing the efficiency and minimizing the GHG and air pollutant emissions of the Metro fleet:
Increase ridership to 127 million passenger boardings annually by 2015, to 142 million boardings by 2020, and to 225 million boardings by 2040, consistent with projections in the Puget Sound Regional Council’s Transportation 2040 plan. In 2015, Metro had 126 million boardings, a ridership record, though short of the 2015 goal. In the past year, the King County region has had the highest transit growth for all large metropolitan areas in the U.S.
Grow transit service through 2020 with no increase in GHG emissions.
Increase the use of alternative fuels (e.g. electricity, biofuels) in Metro’s fleet by 10 percent by 2025, relative to 2014. To reach the 2025 target, alternative fuel use countywide must increase by 1 percent annually.
Reduce energy use of all Metro fleet vehicles by 10 percent between 2014 and 2020. In 2015, normalized energy use per vehicle miles traveled in transit fleets declined by about 2.6 percent from 2014, suggesting a reduction of more than 7 percent is still required to reach the 2020 target.
2 King County, 2016. Greenhouse gas emissions in King County. Climate change response. Available at: http://www.kingcounty.gov/services/environment/climate/strategies/emissions-inventories.aspx
3 King County, 2015. Strategic Climate Action Plan. Available at: http://your.kingcounty.gov/dnrp/climate/documents/2015_King_County_SCAP-Full_Plan.pdf

9
Reduce criteria air pollutant emissions from the bus fleet by at least 10 percent per vehicle miles traveled by 2015, relative to 2009 levels. As of 2014, Metro had reduced criteria air pollutants by 54 percent. No new goals for beyond 2015 have yet been established.
By taking cars off the road, reducing traffic congestion, and facilitating more efficient land use, Metro displaces roughly four times more GHG emissions than it generates—a net displacement of approximately 600,000 metric tons of carbon dioxide equivalent (MTCO2e) each year, equivalent to taking 175,000 cars off the road or 10 percent of transportation related emissions in King County.4,5 Achieving the ridership targets in 2020 and 2040 will reduce annual GHG emissions in King County by 828,000 MTCO2e and 1,272,000 MTCO2e, respectively.
While these reductions in community-scale GHG emissions are a core element of King County’s climate change strategy, reducing direct, operational emissions from fuel used in Metro’s fleet is also an important climate goal. Metro’s bus fleet consumes about 10 million gallons of diesel fuel annually and emits approximately 80 percent of King County government’s GHG emissions from fossil fuels. Research suggests that achieving deep emission reductions in the transportation sector will depend on successful deployment of electric vehicle technology coupled with low-emission electricity production.6
A key strategy for reducing vehicle emissions is to integrate innovative technologies and lower-carbon fuels into operations. Metro has more than 3,700 vehicles. The fleet of about 1,400 buses includes diesel and diesel-hybrid buses, electric trolleys, and three zero-emission battery-electric buses. Metro also operates the largest public rideshare program in the nation, providing more than 1,500 commuter vans and 24 electric vehicles in the metropool program. Other vehicles include dial-a-ride-transit vans, door-to-door Access vans, and non-revenue vehicles that support Metro’s operations.
The Puget Sound region is particularly well-suited to vehicle electrification given our hydroelectric power resources, though these resources are finite and may decline with climate change.7 Zero-net-emission electricity for Metro vehicles is further supported by Seattle City Light’s commitment to maintaining a carbon-neutral electricity supply and by the City of Seattle’s “Drive Clean Seattle” comprehensive strategy supporting vehicle electrification infrastructure. As of late February 2017, the Metropolitan-King County Council is reviewing legislation authorizing Metro and other county departments in King County to enter into a “Green Direct” agreement with Puget Sound Energy to purchase wind-generated renewable energy from a new wind farm in western Washington. Metro is
4 King County, 2017. Environmental Sustainability. Dept. of Transportation Metro Transit. Available at: http://kingcounty.gov/depts/transportation/metro/about/environmental-sustainability.aspx
5 Erickson, P. and C. Chandler. 2012. Greenhouse Gas Tracking Framework for King County: 2010 Update. Stockholm Environment Institute. Available at: http://www.kingcounty.gov/~/media/services/environment/climate/documents/2010_King_County_Core_GHG_Emissions.ashx?la=en
6 As discussed in Vimmerstedt, L., A. Brown, E. Newes, T. Markel, A. Schroeder, Y. Zhang, P. Chipman, and S. Johnson. 2015. Transformative Reduction of Transportation Greenhouse Gas Emissions: Opportunities for Change in Technologies and Systems. National Renewable Energy Laboratory (NREL) and U.S. Dept. of Transportation. Technical Report NREL/TP-5400-62943 April 2015.
7 King County, 2012. Greenhouse Gas Emissions in King County: An Updated Geographic-plus Inventory, a Consumption-based Inventory, and an Ongoing Tracking Framework. Prepared by the Stockholm Environment Institute – U.S. Available at: http://www.kingcounty.gov/~/media/services/environment/climate/documents/2008/ghg-inventory-summary.ashx?la=en

10
also working to secure renewable energy for our electric vehicles through the sale of Renewable Identification Numbers (RINs) credits.8
In addition to producing GHG emissions, Metro’s diesel and gasoline powered fleets emit other harmful criteria air pollutants including ozone, lead, diesel particulate matter, carbon monoxide, sulfur oxides, and nitrogen oxides. These pollutants can harm both human health and the environment. In the U.S., low-income families and people of color are more likely to live in neighborhoods with high concentrations of air pollution and as a result be at higher risk for chronic disease and premature death.9
Metro has taken steps to reduce both GHG emissions and criteria air pollutants through the adoption of diesel-hybrid bus technology, exhaust system retrofits, the use of ultra-low sulfur diesel fuel, and purchase of biodiesel. Metro is one of five transit agencies nationwide that has retained its all-electric trolley network, and recently introduced new trolley buses that use 30 percent less energy. In 2004, Metro became the first large transit agency in the nation to purchase a fleet of articulated diesel-electric hybrid buses. In 2015, with support from a Federal Transit Administration grant, Metro began testing three zero-emission battery-electric buses in service.
8 The federal Renewable Fuel Standard (RFS and RFS2) created sellable renewable identification numbers (RINS) for the use of renewable energy in transportation. King County has entered into a contract to purchase renewable fuel for all its electric fleet and sell RINS. Metro is currently awaiting U.S. Environmental Protection Agency approval for this transaction.
9 National Equity Atlas. 2016. Air pollution: Unequal burden. Available at: http://nationalequityatlas.org/indicators/Air_pollution%3A_Unequal_burden

11
BACKGROUND: METRO’S CURRENT FLEET PRACTICES
As of February 2017, more than 78 percent of Metro’s bus fleet was either all-electric or diesel-hybrid electric. Metro generally replaces vehicles after 14 to 16 years of operation, and as older diesel vehicles are phased out, they are replaced with electric or diesel-hybrid coaches. Metro’s fleet purchases vary from year to year based on a variety of factors from fleet age to agency revenue streams. Based on a review of recent purchase history and the fleet replacement plan going forward, an average annual fleet replacement of about 5 to 10 percent (or 75 to 150 buses) was assumed for this study.
Metro needs to expand the fleet to achieve the vision of Metro’s long-range plan, Metro Connects. Metro Connects envisions building a world-class transit system that will accommodate the needs of our growing region over the next 25 years. It lays out a roadmap for an interconnected, efficient, easy-to-use transit system with smooth transfers between systems—notably enhanced integration with Sound Transit’s expanding regional rail system. The future Metro transit network would offer more frequent service all day and include expanded RapidRide, all-day express and local services. It includes improvements for people with disabilities, such as better wayfinding signage, wider aisles and doors, and audio and tactile signs on buses and at stations. It envisions using new technology to provide improved customer and service information, as well as tools to simplify fare payment and speed up boarding.
The system envisioned in Metro Connects would increase Metro service by 70 percent and more than double transit ridership to accommodate the one million more residents and 850,000 new jobs expected in the Central Puget Sound Region by 2040. Expansion and improvements in Metro’s bus fleet, bus bases and other supporting infrastructure would be critically important to support the service growth and enhancements envisioned in Metro Connects, and a green vehicle fleet is part of the long-range vision.
Metro Connects would add 2.5 million service hours to serve our growing population, requiring an estimated 625 additional buses by 2040 in addition to replacement of existing buses. As Metro replaces and expands its fleet each year, we will make purchasing decisions that will influence our ability to achieve our targets for increasing efficiency and minimizing GHG and air pollutant emissions.
Metro’s current practice is to maintain a fleet of mainly diesel-hybrid and all-electric trolley buses, and recent plans to expand the fleet of zero-emission battery-electric buses. We discuss the service, cost, supporting systems, environment, and equity considerations related to Metro’s current operations here.
Service and fleet
In 2016, Metro operated 3.8 million service hours and maintained an active fleet of about 1,400 buses, including RapidRide coaches and trolley buses. Metro also operates an additional 117 buses for Sound Transit. Metro’s current zero-emission fleet includes three Proterra all-electric, fast-charge battery-operated buses, as well as a fleet of 174 electric trolley buses, as shown in Figure 1.

12
Figure 1: Metro's current fleet (as of February 2017)
Bus type Number of buses Percent of fleet
35- and 40-foot diesel 165 12%
60-foot diesel 141 22%
35- and 40-foot diesel-hybrid 319 10%
60-foot diesel-hybrid 617 43%
Battery-electric 3 0.2%
All-electric trolleys 174 12%
Total Metro Fleet 1419 100%
Sound Transit Fleet 117 N/A
Total with Sound Transit 1536 N/A
Cost A cost analysis of Metro’s current non-trolley fleet operations by bus fleet and by year and month was used to develop a life-cycle cost estimate over the period from 2016 - 2045. This analysis uses Metro’s current fleet as a starting point and assumes a continuation of current practices of replacing diesel buses with diesel-hybrid vehicles. It incorporates Metro’s January 2017 announcement to order 120 battery-electric buses. It assumes that the current trolley fleet size remains unchanged and does not include trolley fleet costs or replacement in the analysis.
The annual maintenance cost assumption for the existing diesel-hybrid fleet was based on a thorough review of Metro’s maintenance cost records. Based on the 40-foot Orion buses—the most representative group—the average cost per mile per bus is estimated to be $0.78 (2016 dollars).
Raw capital costs for bus and fueling infrastructure were forecasted over the project period required to replace the entire current fleet of diesel and diesel-hybrid vehicles with new diesel-hybrid Gillig 40 foot and New Flyer 60 foot models, assuming a 14 year vehicle replacement cycle. Bus replacement assumptions include current buses on order and extend out to 2034, the last year of assumed vehicle purchases to entirely replace the fleet. Discounting future projected costs by 4.5 percent, total costs in 2016 dollars for vehicle and fueling infrastructure are $1.6 billion, operating costs including fuel and battery replacement are $1.4 billion, as well bus and battery recycle or disposal costs are $38 million for a total fleet replacement cost of just over $3 billion. If monetized societal factors such as emissions and noise results are included, then the total cost is $3.2 billion.
Supporting systems Metro’s current fleet plan, which does not consider the longer-term service increases called for in Metro Connects, calls for a gradual increase in the number of buses the agency operates and maintains. By 2028, Metro plans to operate 1,700 buses (an 11 percent increase from 2017).
Metro currently operates seven bus bases around King County to support daily operations and maintain the fleet. Metro’s bases vary in size, and can support between 130 to 280 buses, with all bases nearing their functional capacity. Metro has begun planning to expand base capacity, both through opportunities to increase capacity at existing facilities and planning for a new eighth bus base.
Metro Connects envisions adding approximately 620 buses by 2040, and the base capacity to support the fleet additions. To meet current and growing service needs, Metro human resources is actively exploring how to ensure we have the workforce with the right skill set in place. This effort will continue

13
to be supported and aligned with King County’s 2016 Equity and Social Justice Strategic Plan10 to ensure that government employment opportunities are accessible to all groups, to expand opportunities for disadvantaged populations to build skills that will help them acquire better jobs and leverage the County’s role as a large employer and contractor to promote family-supporting wages.
Support systems needed in case of a severe weather, natural disaster, or catastrophic event are also essential. The expectations for Metro are outlined in the King County Comprehensive Emergency Management Plan and King County Continuity of Operations Plan. Metro shall coordinate and provide emergency bus transportation and services, make buses available for King County emergency operations and return transit service to normal levels as soon as possible following an emergency or disaster. There are no specific minimum service level expectations for Metro in the event of a catastrophic event. Metro has coordinated efforts with other regional agencies to ensure restoration of transit service is appropriately prioritized (e.g. arterial streets with bus service are snow plowed first). In the event of snow, Metro has designated and informed the public of alternative snow routes and reduced service levels.
Environment Metro has already made great strides reducing tailpipe emissions by transitioning toward a fleet of all hybrid buses, with 176 zero-emission trolley buses and three zero-emission battery buses. While Metro is starting from a fleet profile that has a relatively low rate of GHG emissions and criteria air pollutants compared to other transit agencies around the nation, a transition to a 100 percent zero-emission fleet could still result in GHG and air pollutant emission reductions.
Figure 2 shows the difference in emission rates per VMT for carbon dioxide (CO2), nitrous oxides (NOx) and 10-micro particulate matter (PM10) that were obtained for two of the bus models used by Metro. The 40-foot hybrid buses have, respectively, 41 percent fewer CO2 emissions than a standard diesel bus; 95 percent fewer nitrogen oxide (NOx) emissions; and 99 percent fewer particulate matter (PM10) emissions. Despite GHG emission reductions achieved by adopting a hybrid fleet, further actions would be needed to achieve the GHG reduction goals in the County’s 2015 Strategic Climate Action Plan.
10 King County. 2016. Equity and Social Justice Strategic Plan 2016-2022. Office of Equity and Social Justice. Available at: http://www.kingcounty.gov/elected/executive/equity-social-justice/strategic-plan.aspx

14
Figure 2: Emissions Comparison—40-foot and 60-foot Hybrid vs. Generic Diesel11
Rates (Grams/Vehicle Miles Traveled)
Vehicle CO2 NOx PM10
40-foot diesel bus 2,444 16.64 0.14
40-foot diesel-hybrid bus 1,611 0.82 0.001
60-foot diesel-hybrid bus 2,602 1.48 0.004 Note: Rates for CO2 correspond to specific vehicle models currently used by Metro: 40-foot Gillig Standard LF and 60-foot New Flyer HDE 60. Rates for NOX and PM10 emissions are based on a New Flyer XDE40 and adjusted by average fuel efficiency to derive corresponding values for a New Flyer HDE 60. No comparable emissions data was found for Metro’s 60-foot diesel bus fleet.
Equity Metro currently uses adopted Service Guidelines to conduct an annual equity analysis rooted in Title VI of the Equal Rights Act. This analysis identifies how service hour investment needs are distributed throughout the county and whether or not investment needs are disproportionately present in areas of the county that serve communities that have high concentrations of people with low incomes or people of color. Furthermore, the majority of investment needs are identified via an analysis that explicitly considers equity and helps ensure that service investments are distributed equitably throughout the county. This annual analysis is in addition to the Title VI analyses conducted to comply with federal law when Metro changes service, as well as Metro’s triennial Title VI report. Based on the ridership demographics of each bus route, a route is classified by Metro as either a low-income or a minority route, based on whether the proportion of its ridership from low-income or minority areas is higher than the countywide average. Low-income is defined as 200 percent of the federal poverty level for the average household size in King County, and minority is defined as all non-white and all Hispanic people.
The Service Guidelines analysis does not include a breakdown of zero-emission trips by low-income or minority status, nor does it consider air pollution vulnerability. However, we were able to apply the approach from the Service Guidelines analysis to examine Metro’s current fleet practices of zero-emission fleet deployment to see where benefits are currently experienced in our service network. We found that currently, 57 percent of all trips in our system are run on routes classified as low-income, but 79 percent of all zero-emission trips are run on routes classified as low-income. In contrast, 52 percent of all trips are run on routes classified as minority routes, but only 43 percent of all zero-emission trips are run on minority routes.
Metro’s current zero-emission buses, including the three battery-electric buses and the electric trolley bus fleet, are deployed in areas that are vulnerable to the effects of poor air quality, as shown in Figure 3. Equal weight was given to all criterions except for low-income percentage, minority percentage, and asthma risk, which were given double weight. Current Metro zero-emission bus routes (trolleys and battery buses) are scored by averaging the score of census block groups within 200 meters of each route. The darker shaded areas show where deployment of zero-emission buses would serve areas most vulnerable to air pollution. Our analysis found 27 percent of the census block groups that existing zero-emission buses travel through each day are areas where people are most vulnerable to the effects of poor air quality. In comparison, 21 percent of the census areas where diesel and hybrid buses travel are
11 EMFAC Web Database, California Environmental Protection Agency, Air Resources Board, accessed December 1, 2016, https://www.arb.ca.gov/emfac/2014/. Emissions rates adjusted for assumed average vehicle speed.

15
considered the most vulnerable. In addition, 34 percent of the daily mileage of current zero-emission buses is scored in the highest quintile (top 20 percent), while 21 percent of diesel and hybrid buses score in the same quintile. Further explanation of the equity analysis methodology is found in the feasibility assessment section for transitioning to a zero-emission fleet on page 57.

16
Figure 3: Highest and Lowest Scored Areas in King County by Air Pollution Vulnerability and Current Zero-Emission Bus Routes
Darker shaded areas are more vulnerable to air pollution than the lighter shaded areas. Red bus routes are in the highest priority quintile to be served by zero-emission buses, green routes the lowest. Further explanation of the equity analysis methodology is found in feasibility assessment section for transitioning to a zero-emission fleet on page 58.

17
Summary of Metro’s current fleet practices
Under current practices our fleet at Metro is already close to 8 percent electric or diesel-hybrid, including 174 zero-emission trolley buses. From the standpoint of air quality and noise, Metro is already ahead of many transit agencies by nearly phasing out our diesel fleet. However, even though diesel-hybrid buses are cleaner than diesel buses, a diesel-hybrid fleet will still produce significant greenhouse gas emissions (over two million metric tons) from 2016 - 2047.
Total estimated capital, maintenance, disposal and fuel costs for continuing with a fleet of trolleys and diesel-hybrids would be $3 billion (2016 dollars) over the period from 2016 to 2045. When societal costs from greenhouse gases, air pollutants and noise are included, this life-cycle cost rises to $3.2 billion (2016 dollars). Continued dependence on a diesel-hybrid fleet would make the agency vulnerable to large fluctuations in the price of diesel.
Given the targets and goals outlined in the King County 2015 Strategic Climate Action Plan, continuation of current practices will not get Metro on the trajectory needed to reduce GHG emissions from operations and services without reducing service levels across the county. While Metro’s current deployment of our existing zero-emission trolley fleet does provide air quality benefits for communities most vulnerable to air pollution, a continuation of current practices does not provide a means for us to further address inequities of air quality and health outcomes in King County.

18
OPTION 1: CARBON-NEUTRAL FLEET THROUGH GHG ACCOUNTING APPROACH
King County’s Department of Natural Resources has achieved carbon neutrality by using an operational inventory approach. This accounting approach considers all GHG emissions that local governments can influence as internal GHG reductions and removal projects.12 A similar accounting approach could be explored for the entire County. Use of a consistent approach would be critical to avoid double counting or omitting emissions. For Metro, this approach would mean including avoided emissions resulting from the transit service we provide as part of our GHG accounting.
Transit provides not only direct emission reductions by removing vehicles from the region’s road system, but also provides more important benefits by promoting compact communities. The Transportation Cooperative Research Program has quantified these benefits, and found they are several times larger than the mode-shift reductions.13 The American Public Transit Agency (APTA) provides guidance on quantifying the emission reductions associated with removing private vehicles from the roadways. This methodology is widely accepted by transit agencies.
Overall, we estimate that Metro reduces the region’s carbon emissions by approximately 600,000 metric tons annually with 3.7 million hours of service. This suggests that on average, an additional investment in a new service hour indirectly reduces CO2 emissions by approximately 160 kg (or 350 lbs.) and makes 22 new daily person-trips possible for residents. Following this accounting approach, Metro is already net carbon-neutral. Though further analysis would be required to confirm the methodological and quantification approach used for these estimates.
This option assumes no change in Metro’s current fleet practices. Metro’s fleet would continue to emit GHG and air pollutants, and we would not meet our goals to reduce operating GHG emissions as specified in the 2015 Strategic Climate Action Plan. However, our fleet would be considered net carbon-neutral based on an operational GHG accounting approach that includes avoided emissions from transit ridership.
Findings While there is some precedent for using accounting of other reductions as part of King County’s
operations, this approach would not create the technology change needed to actually set Metro on a long-term path to reduce GHG emissions; rather, it is an accounting exercise. This option would not reduce air pollution or help reduce inequities from air quality and public health outcomes for King County residents.
12 King County Dept. of Natural Resources and Parks. 2016. Greenhouse Gas Emissions Inventory Methodology Review. Prepared by Cascadia Consulting Group. Available at: http://www.kingcounty.gov/~/media/environment/climate/documents/pdf/DNRP-GHG-Methodology-Review.ashx?la=en
13Transportation Cooperative Research Program, Quantifying Transit’s Impact on GHG Emissions and Energy Use: The Land Use Component, 2014, available at http://apps.trb.org/cmsfeed/TRBNetProjectDisplay.asp?ProjectID=3092

19
OPTION 2: CARBON-NEUTRAL FLEET THROUGH PURCHASE OF CARBON OFFSETS
Many organizations meet their emission-reduction goals by purchasing offsets from verified GHG projects that reduce emissions from sources beyond the control of the organization. Locally, Seattle City Light purchases offsets where it has been unable to reduce emissions directly from its own operations to meet its own carbon-neutral commitment. Offsets have been purchased from projects such as:
Biodiesel fuel for Seattle area buses, ferries and garbage trucks
Shore power for cruise ships at the Port of Seattle
Aerobic composting of local food and yard waste
Methane recapture and destruction at dairy farms and landfills.
Metro could procure similar offsets in the range of three to eight dollars per ton, not including management costs.
Similarly, many local and national companies have policies for carbon neutrality. Amazon, Microsoft, and Google all purchase renewable energy electricity or offsets from local, national, and international projects. Microsoft’s carbon neutrality program has resulted in the reduction of over 9 million metric tons of carbon and over 14 million MWh of renewable energy. Microsoft’s Beyond Carbon Neutral project has invested in projects around the world to offset their scope three emissions; these projects focus on the “low-carbon economy while helping increase energy access, improve education and healthcare, and empower women”.14
Metro could explore investments in carbon offset projects, but this would come at a cost. Metro would have to dedicate substantial staff time to reviewing and purchasing offsets to ensure they met our quality standards. Based on Metro’s direct energy and fuel related emissions of 135,000 tons per year, the estimated annual price for Metro to purchase offsets to cover our fleet emissions is $445,000 to 1.2 million, not including program costs. This is comparable to 3,000 to 8,000 service hours annually. If Metro continued to maintain a diesel hybrid fleet, we would need to continue purchasing carbon offsets year after year indefinitely to make emissions carbon-neutral. By 2040, this cost of offsets would total between $10.2 and $27.6 million. Use of offsets would not set Metro on a long-term trajectory to reduce its operating emissions.
Alternatively, Metro could purchase offsets at a declining rate over the next 15 to 20 years, until the transition to a zero-emission fleet is complete. Depending on the future price of offsets and the speed of the transition to zero-emission buses, this total expenditure could cost upward of $15 or $20 million dollars (in year of expenditure $) until the fleet was fully converted by 2040.
This option does not propose any changes to Metro service operations or fleet. No changes in supporting systems would be required. GHG emission reductions would be achieved through the purchase of offsets; whether or not the project reduces air pollution reduction would be less certain. It is likely that Metro would purchase offset credits from projects outside of the Puget Sound region. While
14 Microsoft. 2016. Beyond Carbon Neutral. Available at: https://www.microsoft.com/about/csr/environment/carbon/
20
GHG emission impacts are global and not location-specific, health impacts of air pollution are local. Any air pollution reductions associated with a remote offset project would not deliver benefits to King County.15 As with Option 1, this approach would not create the technology change needed to actually set Metro on a long-term path to reduce GHG emissions; nor would it reduce local air pollution or help reduce inequities from air quality and public health outcomes for King County residents.
Sale of environmental attributes by Metro
In previous reports to the County Council, Metro has evaluated opportunities to sell environmental attributes associated with our operations.
In May 2015, Metro prepared the “Feasibility Evaluation of the Sale of Metro Transit Carbon Offsets.” This report concluded that some Metro projects might produce sellable carbon offsets, but significant barriers to verification and registration exist that would preclude the gain of significant revenues. And if Metro sold carbon offsets from our operations, we could no longer include these emission reductions in our own inventory, making it more challenging to meet our own emission reduction targets.
In December 2015, Metro presented a report, “Monetizing Transit Environmental Attributes.” This report concluded that Metro could monetize the sale of Renewable Identification Numbers (RINs) created by our trolley and battery-bus fleet.
In September 2016, the Council authorized Metro to sell the environmental attributes of powering electric vehicles with renewable energy with Renewable Identification Numbers (RINs) credits, and Metro has submitted an application to do so.
Findings As with Option 1, investing in carbon offsets alone to achieve a net carbon-neutral fleet would
not be in alignment with the County’s 2015 Strategic Climate Action Plan to focus on direct emission reduction nor would it set Metro on a long-term path to reduce emissions from transit operations. This option also does not deliver local air quality benefits to improve public health in King County nor provide an opportunity to address the public health inequities of local air pollution.
The purchase of carbon offsets could be an interim strategy as Metro transitions to a zero-emission fleet powered with renewable energy. However, in either case funds used to purchase carbon offsets would limit the emission reductions that could be achieved by investing in service hours or supporting the transition to long-term low-carbon pathway for delivering transit service.
15 In California, the state’s cap-and-trade program faced lawsuits and delays from the environmental justice community regarding the use of offsets and concerns around inequities of air quality and health outcomes for communities in California. See Cushing, L.J., M. Wander, R. Morello-Frosch, M. Pastor, A. Zhu, J. Sadd. 2016. A Preliminary Environmental Equity Assessment of California’s Cap-and-Trade Program. University of Southern California: Research Brief. Available at http://dornsife.usc.edu/assets/sites/242/docs/Climate_Equity_Brief_CA_Cap_and_Trade_Sept2016_FINAL2.pdf

21
OPTION 3: TRANSITION TO A ZERO-EMISSION BUS FLEET POWERED BY RENEWABLE ENERGY
A third option is for Metro to transition to a fleet made up entirely of zero-emission buses powered by renewable energy, which would be carbon-neutral by having no tailpipe or electricity generation GHG emissions. The majority of the fleet would be battery-electric buses, along with Metro’s fleet of all-electric trolley buses.
Metro would need to enter into renewable energy agreements to provide electricity for vehicles. Seattle City Light has committed to maintaining carbon-neutral electricity, so vehicles powered by electricity from within the City Light service area would already be net carbon-neutral. The County is actively seeking opportunities to purchase renewable electricity for electricity sourced from our facilities and operations in Puget Sound Energy’s utility service area.
As of late February 2017, the Metropolitan-King County Council is reviewing legislation authorizing Metro and other county departments in King County to enter into a “Green Direct” agreement with Puget Sound Energy to purchase wind-generated renewable energy from a new wind farm in western Washington. While this current agreement does not include power for our current or future expansion of our zero-emission vehicle fleet, Metro and King County anticipate there will be future opportunities to enter into a wind-power agreement with Puget Sound Energy.
Another alternative for supplying renewable energy for our zero-emissions electric vehicle fleet is through the sale of Renewable Identification Numbers (RINs). In September 2016, the County Council authorized Metro to use RINs credits to sell the environmental attributes of powering electric vehicles with renewable energy. RINs were created under the federal Renewable Fuel Standard (RFS and RFS2) for the use of renewable fuels in transportation. Metro is currently awaiting approval for this transaction by the U.S. Environmental Protection Agency. Metro potentially could expand the agreement to include the sale of RINs for electricity used for expansion of the zero-emission battery-electric fleet. There are indications that approval of this transaction may be delayed by the new administration, although the program is not expected to be cancelled.
By transitioning to a zero-emission fleet powered by renewable energy, Metro could directly reduce our emissions and become carbon-neutral when we complete the fleet transition, sometime between 2034 and 2040. Carbon neutrality would not occur immediately, but would be achieved over time through normal fleet replacement by 2034 to 2040. Direct reduction of GHG emissions would reinforce the policy priorities of King County’s 2015 Strategic Climate Action Plan.
Unlike the other two options, this option would also provide local air quality benefits to King County. Metro would have an opportunity to advance social equity by focusing early deployment of zero-emission buses in low-income and minority communities that are most vulnerable to the impacts of poor air quality.
A transition to an entirely zero-emission fleet made up in large part by battery-electric buses would have significant implications for daily operations, maintenance, and supporting systems. Compounding the challenges of a transition to battery-electric buses is technology that is still developing, lack of standardization between manufacturers, and new complexities introduced into base operations with a mixed-fleet of diesel-hybrid and battery-electric buses. The technology choices made when purchasing a battery-electric fleet can significantly affect space requirements and compatibility with other systems.
22
Findings Of the three options considered, the option of transitioning to a zero-emission fleet would do
the most to advance the goals of King County’s 2015 Strategic Climate Action Plan and the Equity and Social Justice Strategic Plan.
This option involves acquisition of zero-emission buses—which are still evolving; development of charging infrastructure, operations changes, and a number of other requirements that must be considered carefully to be successful. For this reason, the next section of this report presents a detailed study of the feasibility and potential outcomes of this option.

23
THE FEASIBILITY AND POTENTIAL OUTCOMES OF TRANSITIONING TO A ZERO-EMISSION FLEET POWERED BY RENEWABLE ENERGY
A transition to a zero-emission fleet would have significant implications for Metro’s service and operations. Compared to the transition from standard diesel to diesel-hybrid buses, which use the same fueling procedures, a battery-electric bus fleet, infrastructure and charging time requirements would have a much larger impact on base operations, vehicle maintenance, and bus storage.
Battery bus technologies are still rapidly evolving and must be carefully considered to understand what would be involved in transitioning Metro’s non-trolley fleet to battery-electric buses. Decisions on charging type or bus manufacturer will have significant implications for daily operations and maintenance activities.
As a result of the rapidly evolving technology and market conditions, limited operations, engineering and cost data are available for analyzing the different infrastructure requirements of battery-electric buses. Findings and conclusions in this study are based on the best data available in 2016 and draw upon interviews with staff at multiple transit agencies and battery-electric bus manufacturers.
This section covers the following topics:
The general market for battery electric buses and basic charging technologies
How battery-electric buses could meet Metro’s service needs
How a fleet plan could guide Metro’s transition to a zero-emission fleet
Life-cycle costs of battery-electric buses compared to diesel-hybrids
Supporting systems such as charging technology, base operations and capacity, and workforce
Environmental benefits of battery-electric buses compared to diesel-hybrids
How battery-electric buses could be deployed to advance social equity
Current state of the battery-electric bus market and technology
Battery-electric bus manufacturing and technology are still in their development stages, but they are progressing rapidly.
The National Renewable Energy Laboratory considers battery-electric bus development to be in the technology demonstration, or commissioning, phase—meaning battery-electrics should not be considered fully commercial products. Battery-electric buses are a fraction of the overall transit vehicle industry today. Large established manufacturers have yet to fully commit to battery-electric buses, although New Flyer has one model in the market. Companies focusing on battery-electrics, including Proterra, BYD, and Green Power, are relatively new to the market and have much smaller manufacturing footprints in the United States than the established bus manufacturers. For these reasons, the business-related risks of procuring battery-electric buses are high. Metro could manage these risks by working with known manufacturers with which we have experience for future battery electric bus procurements.
Currently, five agencies in the United States are operating 10 or more electric buses (Long Beach Transit in Long Beach, CA; Transit Authority of River City in Louisville, KY; Foothill Transit in Pomona, CA; IndyGO in Indianapolis, IN; Stanford University and Antelope Valley Transit Authority (AVTA) in

24
Lancaster, CA). Two agencies have orders for more than 20 electric buses including AVTA’s recent agreement with BYD, which includes 13 60-foot articulated battery electric buses. Overall, 38 agencies in the U.S. have at least one electric bus in service.
The industry is currently focusing mainly on 40-foot standard bus designs. Offerings in the 60-foot articulated bus category are still growing. There is one manufacturer of a 60-foot slow-charge bus, but this product had not met Metro’s quality standards in preliminary testing.
As the industry scales up manufacturing, bus cost and reliability will be greatly improved. Until that time, battery-electric technology will pose risks, which have been addressed in several recent technical reports.16 The main risk concerns the choice between fast-charge/low-capacity battery buses and infrastructure, and slow-charge/higher-capacity battery buses and infrastructure. The danger is that a transit agency could select a charging technology that either does not meet its long-term needs, or is not adopted broadly by the industry and eventually becomes unsupported by manufacturers. A compounding risk is the current lack of standardization in the industry.
Battery-electric buses are powered by an onboard battery storage system that provides energy to the electric drive train. These buses typically take advantage of the electric drive motors to recapture energy generated from braking. Most components in a battery-electric bus are similar or identical to those used in existing hybrid buses.
Most battery-electric buses are charged conductively, with the vehicle physically “plugged in” to the electricity source, although some early pilot projects are testing inductive charging. There are generally two classes of chargers:
1. Slow chargers refill the battery slowly, typically using a cable and a plug similar to those used
to charge electric cars, although designs vary by manufacturer. The term “extended-range” is
also used for this type of battery technology. Slow chargers are generally paired with larger
batteries and buses with a longer range. Charging is typically done over longer periods—two
to five hours during the night or long midday layovers.
2. Fast chargers refill the battery very quickly, typically using an overhead contact with the bus
and little or no interaction needed by the driver. Designs for these systems also vary by
manufacturer. The term “quick-charge” is also used for this type. Fast chargers are typically
paired with buses that have a smaller battery designed to accept a lot of power in just five to
10 minutes. The operational concept for fast-charge buses is to recharge the battery multiple
times a day during a layover period or between trips.
16 Two resources are the National Renewable Energy Lab’s assessment of the Foothill Transit electric bus pilot project on their Route 291 (foothilltransit.org), and the Draft Technology Assessment: Medium and Heavy-Duty Battery Electric Trucks and Buses, October 2015.

25
Service and fleet Battery-electric buses should be introduced into the bus network in a way that minimizes impacts on operations and service. To understand how this could be done, the Metro study team analyzed how Metro’s service matches the operational characteristics of new battery-electric buses.
Battery technology requires charging. Both the range of miles a bus can travel before it must be recharged and the necessary charging time vary among slow-charge and fast-charge battery-electric buses and affect how the buses can be used in service. To identify routes that could be operated by battery-electric buses in Metro’s current service profile without significant changes to service, we analyzed where and how far buses travel throughout King County. We did this by identifying the time they leave and return to the bus base and the scheduled length of their layovers. We then integrated the analysis with Metro’s existing fleet replacement plan to determine a schedule for transitioning the fleet to all battery-electric buses over time.
The service analysis is divided into four sections:
Service Analysis 1: Slow-charge battery-electric buses Service Analysis 2: Fast-charge 40-foot battery-electric buses Service Analysis 3: Fast-charge 60-foot battery-electric buses Service Analysis 4: Fleet transition analysis
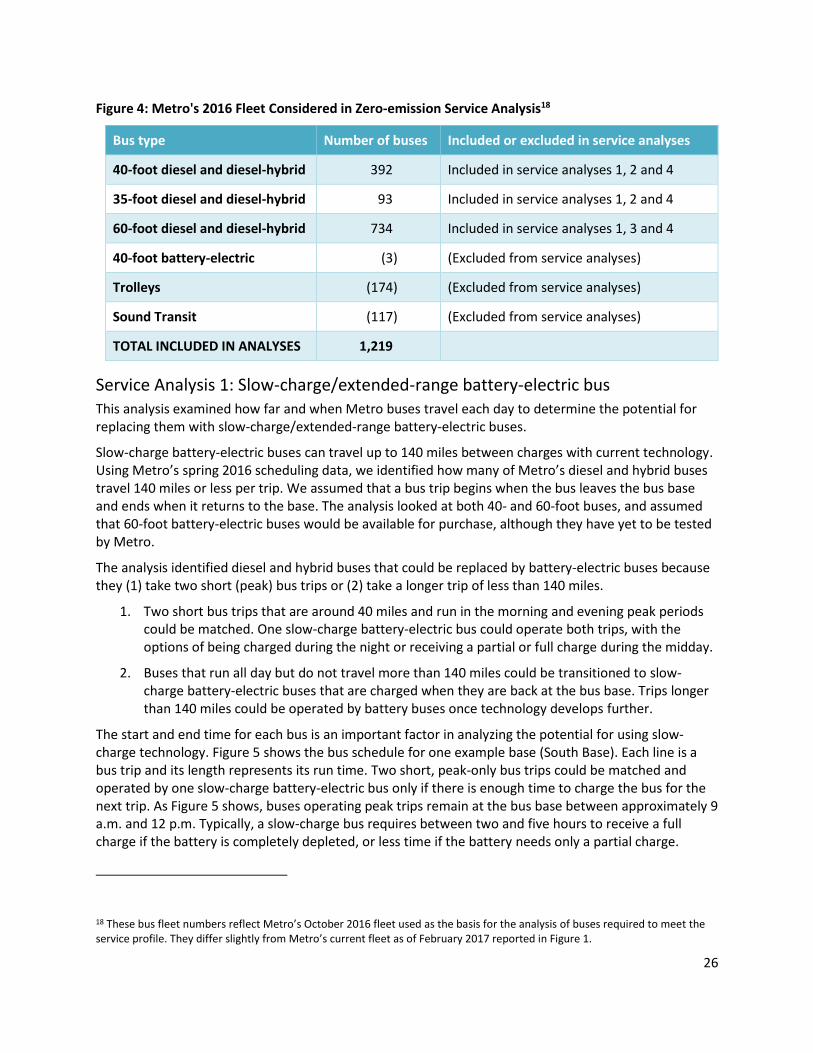
Metro’s 35-foot, 40-foot and 60-foot buses are included in these analyses; the trolley buses and three battery-electric buses (which are already zero-emission) as well as school routes and Sound Transit buses operated by Metro are not included. Figure 4 shows the fleet mix and sub-fleets that are included versus excluded. The analyses focus on transitioning the diesel-hybrid fleet to zero-emission battery buses and do not explore opportunities to expand the trolley network and fleet.
The analyses looked only at bus scheduling and service design to determine the number of buses that could potentially transition to battery-electric buses.17 We did not consider other limiting factors such as available base capacity or space at layover locations needed for charging infrastructure. We assumed that both 40-foot and 60-foot battery-electric buses would be available. Currently Metro has tested 40-foot battery-electric bus technology, but the one model of a 60-foot battery-electric bus currently available has not yet proven it can meet Metro’s quality standards.
17 The term “service profile” is used in this document to refer to the specifics of bus trips (schedule and length) and how they are strung together to form a vehicle assignment for the day (referred to as “blocking”). The particulars of each trip and how multiple trips are assembled together can change from one service change to the next to accommodate various goals of the agency, including maximizing the efficiency of service. Therefore, we present ranges for the number of buses that could be converted to battery-electric buses, as the exact number is uncertain and may change over time due both to changes in our service profile and to technological developments.
26
Figure 4: Metro's 2016 Fleet Considered in Zero-emission Service Analysis18
Bus type Number of buses Included or excluded in service analyses
40-foot diesel and diesel-hybrid 392 Included in service analyses 1, 2 and 4
35-foot diesel and diesel-hybrid 93 Included in service analyses 1, 2 and 4
60-foot diesel and diesel-hybrid 734 Included in service analyses 1, 3 and 4
40-foot battery-electric (3) (Excluded from service analyses)
Trolleys (174) (Excluded from service analyses)
Sound Transit (117) (Excluded from service analyses)
TOTAL INCLUDED IN ANALYSES 1,219
Service Analysis 1: Slow-charge/extended-range battery-electric bus This analysis examined how far and when Metro buses travel each day to determine the potential for replacing them with slow-charge/extended-range battery-electric buses.
Slow-charge battery-electric buses can travel up to 140 miles between charges with current technology. Using Metro’s spring 2016 scheduling data, we identified how many of Metro’s diesel and hybrid buses travel 140 miles or less per trip. We assumed that a bus trip begins when the bus leaves the bus base and ends when it returns to the base. The analysis looked at both 40- and 60-foot buses, and assumed that 60-foot battery-electric buses would be available for purchase, although they have yet to be tested by Metro.
The analysis identified diesel and hybrid buses that could be replaced by battery-electric buses because they (1) take two short (peak) bus trips or (2) take a longer trip of less than 140 miles.
1. Two short bus trips that are around 40 miles and run in the morning and evening peak periods could be matched. One slow-charge battery-electric bus could operate both trips, with the options of being charged during the night or receiving a partial or full charge during the midday.
2. Buses that run all day but do not travel more than 140 miles could be transitioned to slow-charge battery-electric buses that are charged when they are back at the bus base. Trips longer than 140 miles could be operated by battery buses once technology develops further.
The start and end time for each bus is an important factor in analyzing the potential for using slow-charge technology. Figure 5 shows the bus schedule for one example base (South Base). Each line is a bus trip and its length represents its run time. Two short, peak-only bus trips could be matched and operated by one slow-charge battery-electric bus only if there is enough time to charge the bus for the next trip. As Figure 5 shows, buses operating peak trips remain at the bus base between approximately 9 a.m. and 12 p.m. Typically, a slow-charge bus requires between two and five hours to receive a full charge if the battery is completely depleted, or less time if the battery needs only a partial charge.
18 These bus fleet numbers reflect Metro’s October 2016 fleet used as the basis for the analysis of buses required to meet the service profile. They differ slightly from Metro’s current fleet as of February 2017 reported in Figure 1.

27
One bus that operates all day could be replaced by one slow-charge battery-electric bus that could be charged overnight.
Deployment of slow-charge/extended-range battery electric buses would require a schedule that efficiently coordinates charging time based on the number of chargers at each base and the amount of charging time each bus would need.
Figure 5: Bus Trip Schedule at South Base
We categorized the results of our analysis by bus base to understand the distribution of buses and trips in our system, the sequencing and deployment of buses, and the placement of charging infrastructure that would be necessary as the transition to a zero-emission fleet begins. The fleet requirements are based on the time period when the total number of buses needed is the highest—typically the weekday evening peak. We included an additional spare ratio of 20 percent. The results derived from this methodology are shown in Figure 6.

28
Figure 6: Total Estimated Number of Buses Required for Service at Each Bus Base by Total Daily Mileage Traveled
This analysis of the ability of slow-charge technology to meet Metro’s service profile suggests the following:
If the currently available 60-foot battery-electric bus can meet Metro’s performance standards, then slow-charge/extended-range battery-electric technology in its current state could meet the service needs of nearly 70 percent of Metro’s current operations.
If technology improves to allow battery buses to travel 200 miles between charges, approximately 250 more buses (90 percent of all buses) could operate using slow-charge battery technology.
In order to transition 100 percent of the current fleet, the mileage range of battery technology would either have to reach the mileage of the longest bus trip (350 miles), or bus schedules would have to be shifted to accommodate shorter trips or midday charging.
South, Ryerson, and North bases have the most buses operating less than 140 miles; less than 10 percent of trips less than 140 miles operate from East and Atlantic bases.
While 70 percent of buses required for service could be operated with currently available slow-charge battery-electric buses, some shorter routes may be better suited for fast-charge battery-electric buses.
Service Analysis 2: Fast-charge/short-range 40-foot battery-electric bus We identified opportunities for 40-foot fast-charge battery-electric buses to meet Metro’s service. The analysis used the same scheduling dataset that was used for the slow-charge analysis, and similarly excluded Sound Transit, trolleys, and school routes. A separate analysis of fast-charge/short-range 60-foot battery-electric buses is in Service Analysis 3.
Our analysis considers the constraints of fast-charge/short-range technology on bus operations, including the number of miles each bus can travel before needing to charge and how much time would be needed to receive a full charge. The analysis modeled a range of assumptions about the amount of time necessary for a full charge and the maximum distance between charges to understand the
19 These bus fleet numbers are estimated based on the analysis of buses required to meet the service profile, rather than on the actual number of buses in Metro’s fleet.
Total miles Bellevue North Central Atlantic East South Ryerson Total +20
percent spare
0-140 47 121 115 65 70 137 145 700 840
140-200 34 42 26 19 7 50 29 207 248
200-260 21 9 9 1 6 34 5 85 102
260+ 4 0 1 0 4 11 1 21 25
Total buses 106 172 151 85 87 232 180 1,013 1,21619

29
potential for using fast-charge buses with current technology, as well as the increased potential with improved technology. Current fast-charge technology has a maximum distance between charges of 25 miles and requires at least 10 minutes to charge. We considered a potential range in fast-charge technology of up to 55 miles and a potential reduction in charging time to only four minutes.
Figure 7 shows a sample of the approximate number of diesel and hybrid buses out of the 392 currently in Metro’s 40-foot fleet that could be transitioned to fast-charge battery-electric buses, based on scheduling and service design, with both current technology and potential future changes in technology. If Metro deploys fast-charge battery-electric bus technology, further screening would be necessary to determine the feasibility of transitioning the preliminary number of buses shown in Figure 7. Screening would need to include ownership of layover locations, on-time performance, and the future conversion of certain routes to RapidRide. Not considered in the analysis below is the efficiency of deploying fast-charge infrastructure. The infrastructure is costly, and efficient deployment depends on the identification of charging locations that can be served by multiple routes and can charge six to eight buses per hour. Therefore, further screening to identify practical and economically efficient sites for fast-charger stations is likely to reduce the deployment of this fleet type significantly.
Figure 7: Preliminary Number of 40-Foot Diesel or Hybrid Buses that Could be Transitioned to Battery-
Electric Buses Based on Different Technology Constraints
Fast-charge technology
Miles between charges
Time needed to
fully charge battery
Note on technology
Number of 40-foot buses that could be transitioned to battery-electric buses
(out of 392 buses)
25 10 Current technology, no impact on current service
140 – 187
25 4 If the time a battery needs to charge is reduced
162 – 217
40 10 If the miles a bus can travel between charging is increased
265 – 353
The analysis of the ability of current 40-foot fast-charge/short-range technology to meet Metro’s 2016 service profile suggests the following:
Between 140 and 187 diesel and hybrid buses—35 to 47 percent of the 40-foot fleet—could be
transitioned to battery-electric fast-charge buses. However, after further consideration of siting
constraints and efficiency of charging infrastructure, it is likely that a smaller subset would be
feasible to replace in the near-term.
Decreasing the charge time to four minutes would increase the potential percentage of battery-
electric fast-charge buses to 41 to 55 percent. This also shows the potential percentage of 40-
foot buses that could be transitioned if batteries were partially charged throughout the route
until time was available for a full charge.

30
If 10 minutes remained the amount of time needed for a full charge, but a bus could travel for
40 miles between charging instead of 25, the percentage of 40-foot buses in Metro’s system
that could be transitioned would increase to nearly 90 percent.
Service Analysis 3: Fast-charge/short-range 60-foot battery-electric bus We conducted a similar analysis to identify the potential to replace Metro’s current fleet of 742 60-foot diesel and hybrid buses with fast-charge battery-electric buses. Currently, fast-charge/short-range 60-foot battery-electric buses are not available, but this analysis identifies opportunities should the technology be introduced into the market.
As in the 40-foot fast-charge analysis, we estimated the potential number of buses that could be transitioned based on a range of technology assumptions. Our analysis assumed that a 60-foot fast-charge bus would have the same technical capabilities as a 40-foot fast-charge bus. However, since a 60-foot bus is heavier and would require more battery capacity for the same range, a 60-foot fast-charge bus might require more charging time than a 40-foot bus would. If so, the scenario below with a longer charge time could be more applicable.
Figure 8: Preliminary Number of 60-Foot Diesel or Hybrid Buses that Could be Transitioned to Battery-Electric Buses Based on Different Technology Constraints
Fast-charge technology
Miles between charges
Time needed to fully charge
battery
Note on
technology
Number of 60-foot buses that could be transitioned to battery-electric buses
(out of 742 buses)
25 10
Equivalent to current 60-foot battery technology, no impact on current service
268 - 358
25 4 If the time a battery needs to charge is reduced
306 - 408
25 15 If larger batteries, for larger buses, require longer charge times
189 - 252
40 10 If the miles a bus can travel between charging is increased
573 - 742
This analysis of the ability of 60-foot fast-charge/short-range technology to meet Metro’s service profile suggests the following:
With Metro’s 2016 service profile and fast-charge technology equivalent to what is available for
40-foot buses (though not yet available for 60-foot buses), between 268 and 358 diesel and
hybrid buses, or 36 to 48 percent, would have the potential to be transitioned to battery-electric

31
buses. These buses could be replaced without any impacts to service assuming the needed
charging infrastructure is in place.
Decreasing the charging time to four minutes would increase the potential percentage of
battery buses to 41 to 55 percent. This also shows the potential percentage of 60-foot buses
that could be transitioned if batteries were partially charged throughout the route until the time
is available for a full charge was available.
If 10 minutes remained the amount of time needed for a full charge but a bus could travel for 40
miles between charging instead of 25, 100 percent of the 60-foot buses could be transitioned to
fast-charge battery-electric buses.
Service Analysis 4: Fleet transition analysis This section supplements the previous analyses by considering the composition of the existing fleet, Federal Transit Administration (FTA) requirements, and bus retirement and replacement cycles. Taken together, the service and fleet analyses establish a potential phased transition to a 100 percent zero-emission fleet.
The fleet transition plan is used as an input to the financial analysis discussed later, and to analyze the potential target date for transitioning to a zero-emission fleet.
Metro receives substantial federal funding for bus purchases. The FTA requires Metro to keep buses in the fleet for at least 12 years. Metro typically retires buses when they are 14 years old. Some may be kept longer—generally up to 16 years—depending on service demands and procurement cycles. Other Metro practices reflected in the fleet replacement plan include:
Maintenance of a 20 percent spare ratio
Maintenance of a 50 to 55 percent 60-foot (articulated) to 40-foot bus ratio for the fleet
Regular purchases every one to two years to even out fleet replacement activities.
Metro’s multi-year fleet forecasts are based on a variety of factors (age of existing fleet, local economic conditions, changing technology, etc.) and fluctuate over time. We used the following assumptions to develop a long-term plan to transition to a zero-emission fleet:
Baseline is the October 2016 fleet plan, which provides a detailed forecast for purchases and
retirements by bus type, length, propulsion type, and whether the bus is owned by Metro or
Sound Transit from 2016 through 2028.
The near-term purchase of 120 40-foot battery-electric buses occurs, with eight arriving in 2017 and the remaining 110 in 2018 and 2019.
All new buses in service from 2020 on are battery-electric buses.
Battery-electric bus lifespans considered were 12, 14 and 16 years.
40-foot battery-electric buses are currently available from a number of manufacturers and are the type Metro is purchasing in the near-term. Going forward, Metro’s service profile is expected to continue the need to maintain a 50 to 55 percent ratio of 60-foot electric buses would require purchases of 60-foot articulated buses to replace retiring diesel-hybrids. Based on the current fleet plan, including committed purchases and a typical lifespan of 14 years, 2020 would be the first year Metro would purchase 60-foot battery-electric buses. This year works

32
well with manufacturer plans for 60-foot battery-electric bus deployment. Currently, BYD is the only manufacturer with orders for 60-foot battery electrics. New Flyer has also developed a 60-foot battery electric and recently began testing. Discussions with other manufacturers indicate that there will likely be at least one other 60-foot battery-electric bus available around 2020. Metro has not yet had a pilot test of a 60-foot battery-electric bus.
In 2028 (the end year of the October 2016 Metro Fleet Plan), the Metro fleet would be approximately 68 percent zero emission. Following a 14 year replacement schedule, per common practice at Metro, the entire fleet could be transitioned to a zero-emission fleet by 2034. The transition over time is shown in Figure 9.
Figure 9: Fleet Replacement Plan: Potential for Zero-Emission Fleet
0%
10%
20%
30%
40%
50%
60%
70%
80%
90%
100%
20
15
20
16
20
17
20
18
20
19
20
20
20
21
20
22
20
23
20
24
20
25
20
26
20
27
20
28
20
29
20
30
20
31
20
32
20
33
Per
cen
tage
of
Flee
t
Diesel
Diesel - Hybrid
Zero Emission(Trolley & Battery Electric Fleet)
Metro’s current zero-emission bus fleet Metro’s current zero-emission fleet (the electric trolley buses and the three fast-charge 40-foot Proterra buses in revenue service since early 2016) comprise around 12 percent of our total fleet. The Proterra buses were the first off the production line and, as expected, some changes were needed, although the buses have generally performed as advertised. The plan is to incorporate key concerns of safety, operator and maintenance staff members into the next-generation bus. As part of Metro’s funding for the current fleet from the Federal Transit Administration, the U.S. Department of Energy National Renewable Energy Laboratory has conducted an in-service performance evaluation of Metro’s experience with our current fleet. This report is expected to be released in 2017.
While issues remain to be worked out, the buses have met or exceeded charge duration and range requirements, and the manufacturer has responded to issues quickly. Overall, the battery bus pilot has been successful and led to our assessment that moving toward battery-electric buses is feasible so long as technology continues to evolve to meet our service and operational needs. Metro is confident enough with what we have learned to commit to expanding our zero-emission battery bus fleet and build associated infrastructure.

33
Feasibility of transitioning Metro’s VanPool fleet
Metro’s Rideshare Operations is committed to electrifying shared vehicles and innovative public transportation alternatives, and already is offering customers 100 percent zero-emission electric vehicles (EVs) in its metropool program.20
Three key issues involved in transitioning the commuter van fleet to battery-electric technology are costs, the commercial availability of electric 7+ passenger vehicles, and the availability of easy-to-use charging infrastructure.
Today, for eligible vehicles, the initial capital cost of purchasing an electric vehicle is significantly higher than a fossil fuel vehicle. However, EVs have lower operating and maintenance costs compared to their fossil fuel counterparts, and lifecycle costs continue to decrease as capital costs come down.
Volunteer drivers take the vanpool vehicles home at night. As there are liability and procedural limitations for private citizens charging County vehicles at their personal residences, workplace charging is necessary, although that may change in the future. This is the model currently used for our metropool program, and our experience there has given us information about the challenges regarding availability and competition for workplace charging stations, as well as the need for employers to develop policies for workplace charging. While work remains to be done to site and build efficient charging stations and to further develop partnerships with employers, the outlook for a proliferation of workplace charging is promising.
Metro intends to continue assessing how to transition commuter van vehicles to EVs, adding proportionally more EVs to the fleet and associated charging infrastructure at appropriate locations.
As the largest transit agency in Washington, Metro takes a leadership role in exploring partnership and grant opportunities. Metro hopes to invest grant funds in the extensive, and growing, Commuter Van fleet and in infrastructure improvements, leveraging grant funding opportunities through partnerships.
Providing transit customers with opportunities to ride in, drive, charge, and experience the benefits of electric and plug-in hybrid electric vehicle (PHEV) technologies will help our region overcome barriers to EV vehicle ownership and use. Metro’s Commuter Van customers, who travel as far as 270 miles round trip per day, and who use key transportation corridors, could showcase public EV and PHEV use. They also may make decisions to purchase an EV as their next personal vehicle based on their experience in an EV Commuter Van. King County leadership in EV adoption could help jumpstart a large-scale transition to electric vehicle use throughout our region and state, improve regional mobility options, and provide equitable access to zero-emission transportation alternatives.
20 For more information about Metro’s metropool program see: http://metro.kingcounty.gov/tops/van-car/programs/metropool/

34
Service and fleet analysis findings Our analysis found that battery-electric buses available today meet the service criteria for much of Metro’s current fleet, and will satisfy even more of our service needs as battery-bus and charging technology advances. A number of risks and limitations exist, though, and the industry is rapidly changing. Metro must continue to evaluate opportunities and risks presented by battery-electric buses.
The analysis identifies the following opportunities:
Current slow-charge/extended-range battery-electric technology could meet the service needs of nearly 70 percent of Metro’s current operations, based only on an analysis of current service levels and trip lengths, and assuming the future availability of proven 60-foot battery-electric buses in addition to the 40-foot buses that are readily available now.
As battery technology progresses and bus range increases to 200 miles, over 90 percent of Metro’s service could be met. A range of 350 miles would be required for slow-charge buses to accommodate 100 percent of current operations, or bus schedules could be adjusted to accommodate buses with shorter ranges.
Current fast-charge/short-range battery-electric buses could meet the current service needs of 140 to 187 (36 percent to 48 percent) of Metro’s 40-foot diesel and diesel-hybrid buses. With further advancements in battery technology, this number could grow to more than 350 out of 390 40-foot buses (90 percent).
As service needs change, especially with the service expansion and shift from peak to all-day service envisioned in Metro Connects, and as battery bus technology evolves, Metro will need to continue evaluating how well battery buses and which type of battery buses can meet our service needs.
Based on our fleet transition analysis, in 2028, the Metro fleet would be approximately 68 percent zero emission. Depending on the fleet retirement age, which ranges from 14 to 16 years, the fleet could reach 100 percent zero emission as early as 2034.
Metro has been testing three fast-charge battery-electric buses that are operating out of Bellevue Base with a charging station at Eastgate Park-and-Ride. These buses have performed well, and the charging infrastructure has worked without major issues. Metro continues to work closely with the bus manufacturer to ensure these buses can meet our needs as we look to expand this fleet and build on what we have learned. Metro has an opportunity to leverage our purchasing power to ensure manufacturers develop products that meet our service needs.
Metro’s Rideshare program currently offers customers 100 percent zero-emission electric vehicles
(EVs) in its metropool program.
The analysis identifies the following risks and limitations given the current state of knowledge of battery-electric bus technology
Energy regeneration, which can extend the miles between vehicle charging, was not an input in this analysis. When an electric vehicle is coasting or going downhill, energy is produced rather than consumed. Energy regeneration was beyond the scope of this analysis because it would require a test bus on multiple routes to adequately identify the potential for additional energy.
Elevation and topography were also not considered because of limitations in the project scope. Additional analysis and testing may be required before battery vehicles are deployed on routes that travel on steep inclines, which may affect the batteries’ charge and the miles the bus can travel between charges.

35
Service reliability is a key risk in transitioning to fast-charge technology, but was beyond the scope of this feasibility analysis. If a bus is often running late, there may not be enough time to charge its battery during a layover without causing further delays or requiring investment of additional service hours to ensure adequate layover time. If Metro has to add more time to schedules to ensure sufficient layover, this would result in higher overall operating cost.
Currently, only a few medium-sized slow-charge fleets are in service in the US. Because of the lack of experience with this technology, Metro needs to confirm the operational and facility functionality to charge and maintain a large fleet in time to meet the next day’s service.
If Metro begins purchasing all zero-emission buses in 2020, nearly 70 percent of Metro’s fleet would be zero-emission buses by 2028. It will be important for Metro to have a resiliency plan in place by 2020 to guide operations during a power outage.
This analysis held Metro’s service profile as constant and did not consider the potential to modify our service structure to accommodate battery technology (e.g. breaking longer blocks into multiple, shorter blocks). Altering our service profile would likely incur greater labor and capital costs, and, as this analysis found, there are multiple near- and medium-term opportunities to expand our use of zero-emission buses without changing our service profile. In the future, Metro may be able to redesign certain services to better accommodate the technology, but we do not anticipate needing to do so for some time.

36
Cost Zero-emission battery-electric buses have significantly different capital, operating, maintenance and societal costs than diesel-hybrid fleets. Here we present findings of our life-cycle cost assessment, which analyzed how the costs of transitioning Metro’s diesel-hybrid fleet to battery-electric buses would compare to Metro’s current practices of maintaining a diesel-hybrid fleet.
We used a life-cycle cost analysis approach to look not only at initial capital costs of bus purchases, but also at the costs over the multi-decade life-cycle of the fleet. This analysis included both the cash costs to Metro (i.e. capital, operating, maintenance, and disposal) and the societal costs from environmental pollutants (i.e. greenhouse gases, air pollutants, and noise).
Forecasting costs, inflation, and price fluctuations for volatile commodities over a multi-decade time frame is difficult and requires numerous assumptions. In this analysis, the difficulty was compounded by the relatively young state of the battery-electric bus industry. For some of the costs considered, there is limited published data to rely on. Our analysis was built on data from a variety of sources including recent technical studies, manufacturer specifications, and interviews with staff at multiple transit agencies—including Metro—and battery-electric bus manufacturers.
The analysis was modeled after Metro’s current fleet replacement plan and assumes all buses have a 14-year lifespan. The current ratio of 45 percent 40-foot to 55 percent 60-foot buses was maintained over the analysis period. The analysis included all confirmed orders through 2018 and committed orders through 2020, including Metro’s near-term plans to expand the battery-electric fleet that were announced in January 2017. Following the fleet replacement plan analysis presented earlier, our cost assessment assumed that technology and charging infrastructure will improve in the near-term, such that all new Metro buses in service from 2020 will be battery-electrics and electric trolleys, and the last diesel-hybrid bus will be replaced in 2034.
The analysis covered the full life-span of all buses purchased from 2016 to 2032 and in service from 2017 to 2034. This means it covered total costs from the first year of fleet purchases in 2016 through the final year of operations in 2047—the end of life for buses purchased in 2032 and in service in 2034. All results in the model are provided in 2016 dollars and for an average bus within a fleet of buses (diesel-hybrid or battery-electric), and are based on a 4.5 percent discount rate.
We looked at the range of cost estimates for each cost factor by bus and by fleet. We also conducted a
sensitivity analysis to give insight into the potential range of the life-cycle cost estimates based on the
confidence and range of costs for each parameter.
Cost analysis: Bus capital costs Total bus capital costs are based on the standard vehicle price, acquisition, after-market equipment and contingency costs as shown in Figure 10 for diesel-hybrid, all-electric trolley, and battery-electric 40-foot and 60-foot vehicles. In general, capital costs for diesel-hybrid and battery-electric buses fall within the same range. For example, the standard vehicle price for a 40-foot diesel-hybrid is $769,000, similar to the price range of $707,000 to $784,000, depending on battery type, for a 40-foot battery-electric bus.
For reference, we present information on trolley buses, a key all-electric zero-emission component of Metro’s fleet. However, this analysis does not consider expansion or replacement of Metro’s trolley fleet. As shown in Figure 10, trolley buses are considerably more expensive than either diesel-hybrid or battery-electric vehicles. In general, direct comparisons between trolleys and battery-electric buses are difficult due to the complexity of the trolley network infrastructure and the allocations of its costs.

37
Battery-electric buses operate within a very dynamic cost environment—more so than traditional diesel-hybrid vehicles. The key component of their power system—the battery packs—have seen significant price drops over the past decade.21 Battery requirements for battery-electric buses are different from those of light-duty vehicles such as electric passenger cars. They are heavier, need more horsepower, have greater expected lifetime mileages, and have more demanding loads on battery usage.
Furthermore, though batteries for battery-electric buses sometimes use battery chemistry similar to that used by light-duty vehicles, they are packaged differently and are not produced or purchased in the same high volumes as light-duty vehicles. Price forecasts for the three types of batteries typically used in buses are expected to continue to fall for the next 10 to 15 years, which should allow manufacturers to offer lower costs or longer ranges for the same price.22
At the same time, given the small size of the battery-electric bus market, it is possible that manufacturers are currently selling vehicles below cost to increase market share, aiming to recoup their costs over time and may pass on less savings to the buyer. Nevertheless, because of rapid technology development and forecasted decreases in battery costs, the price risks associated with electric bus technology are considered to be low. This analysis assumed that battery costs will decline at approximately 3.4 percent per year through 2030, based on recent analysis of the bus battery market by the California Air Resources Board.23
Figure 10: Bus Capital Costs by Vehicle Type and Length
Bus Type Bus Size Standard Vehicle Prices*
Acquisition and Additional Costs**
Total Bus Capital Costs
Diesel-hybrid
40-foot $769,000 $139,000 $908,000
60-foot $959,000 $114,000 $1,073,000
All-electric Trolley
40-foot $1,179,000 $419,000 $1,598,000
60-foot $1,472,000 $404,000 $1,876,000
Battery- electric
40-foot – fast-charge*** $707,000 $124,000 $831,000
40-foot – slow-charge $784,000 $134,000 $918,000
60-foot – fast-charge $760,000 $92,000 $852,000
60-foot – slow-charge $1,099,000 $172,000 $1,271,000
* Standard vehicle price based on Metro and Washington State Dept. of Transportation contracts, includes options of $8,800 per bus in 2016 $s and 9.9 percent sales tax. Prices are adjusted to year-of-purchase dollars and discounted to 2016 $s.
** Additional costs include project management, after-market equipment, training and manuals, service preparation and inspection, special tools and diagnostic equipment, and contingency (5 to 10 percent depending on bus model).
*** Fast-charge buses have a shorter range and charge faster. Slow-charge buses have an extended range and charge more slowly.
21 Nykvist, B. and M. Nilsson. 2015. Rapidly falling costs of battery packs for electric vehicles. Nature Climate Change 5, 329–332
22 California Air Resources Board. 2015. Draft Technology Assessment: Medium and Heavy-Duty Battery Electric Trucks and Buses. Available at: https://www.arb.ca.gov/msprog/tech/techreport/bev_tech_report.pdf
23 California Air Resources Board. 2015. Draft Technology Assessment: Medium and Heavy-Duty Battery Electric Trucks and Buses. Available at: https://www.arb.ca.gov/msprog/tech/techreport/bev_tech_report.pdf

38
Cost analysis: Charging and fueling infrastructure capital costs Charging infrastructure requirements are a key consideration for battery-electric buses. Figure 11 shows charging and fueling infrastructure costs by vehicle type, including the capital and installation costs as well as the number of vehicles served and their expected lifespan, to estimate the total infrastructure costs per bus. As shown, the per vehicle fueling infrastructure costs for diesel-hybrid fleets are three to 14 times less than the charging infrastructure costs for battery-electric buses. Trolley charging infrastructure costs are considerably more per bus than for either diesel-hybrids or battery-electrics.
As we have noted, charging infrastructure is evolving and no standardization yet exists across the industry. This presents a risk that the infrastructure Metro installs will become obsolete before it would otherwise be replaced. Here we assume a lifespan of charging equipment similar to that of a bus—14 years. Furthermore, as discussed in the supporting systems section that follows, while charging infrastructure is in operation today, the transit industry has limited experience with large-scale deployments of charging infrastructure, so the costs of doing so are less certain. These factors compound to create uncertainty in the costs related to charging infrastructure deployment, particularly related to the number of vehicles each charging station can serve. Based on Metro’s experience to date and interviews with manufacturers, we conservatively assumed four buses per fast charger and two buses per slow charger for our analysis. As Metro gains operational experience with the buses, and as charging infrastructure evolves to meet large-scale needs, the charging efficiency may increase.
Figure 11: Charging and Fueling Infrastructure Costs by Vehicle Type*
Bus Type
Infrastructure Type
Capital Cost
Installation Cost
Vehicles Served per Unit and
Lifespan**
Total Infrastructure Costs per Bus
Diesel-hybrid
Diesel fueling equipment
$1.4 million
$4.2 million 200 vehicles;
40 years $10,000
All-electric Trolley
Overhead wire, electrical
substation retrofits and
depot infrastructure
Break out of infrastructure costs not available
10 vehicles $2,017,000
Battery- electric
Fast charger $300,000-$350,000
$360,000 ($200,000
-$622,500)
4 vehicles; 14 years
$144,000
Slow charger $20,000-$30,000
$60,000 ($40,000-$70,000)
2 vehicles; 14 years
$34,000
*Infrastructure cost estimates are from the following sources: diesel-fueling equipment based on a WSP | Parsons Brinckerhoff
cost estimates for Sound Transit Burien Bus Base as part of the Sound Transit 3 Long Range Plan; all-electric trolley costs from a

39
2014 of the Philadelphia trolley system24; fast charge costs from a 2015 study of Foothill Transit25 and Metro experience; and, slow charge costs from WSP | Parsons Brinckerhoff cost estimates for Albuquerque ride electric bus feasibility study.
Cost analysis: Vehicle operating, maintenance, and disposal costs Vehicle maintenance, operating, and disposal costs include costs related to labor, parts, battery replacement, diesel fuel or electricity, and bus and battery disposal costs. The vehicle maintenance costs used in this analysis were based on Metro’s experience with our diesel-hybrid and battery-electric fleets, and assumed a replacement of the battery once during the lifespan of a vehicle, at year seven.
Vehicle maintenance costs for diesel-hybrid buses start at $0.78 per mile. For the battery-electric fleet we estimate vehicle maintenance costs of $0.54 per mile, though we explored a range of vehicle maintenance costs for battery-electrics from $0.30 per mile to $1.05 per mile. We assumed that vehicle maintenance costs would increase over time as the fleet ages per Metro’s historic operations cost data. For the first four years after the start of operations there is an annual increase of $0.04 per mile, no annual increases for years four through 10, then annual increases of $0.07 per mile each year after year 10. While we have high confidence in the diesel-hybrid data based on many years of experience and a large fleet size, it was more difficult and less certain to extrapolate the costs from our fleet of only three battery-electric buses over only a few months of operation. The in-service performance evaluation of Metro’s fleet by the National Renewable Energy Laboratory anticipated to be released in 2017 will further inform our understanding of vehicle maintenance and operating costs.
We assumed that bus and battery disposal costs would be similar to those Metro has experienced with diesel-hybrid buses and batteries to date. We assumed bus disposal costs to be 4 percent of the bus acquisition cost for diesel-hybrid buses and 5 percent for battery-electric buses. Options to reuse and recycle batteries are discussed further in the “Supporting Systems” section that follows. For this analysis, we conservatively used $2.50 per pound as the battery disposal cost for both diesel-hybrid and battery-electric buses.
Long-range forecasts for the price of diesel fuel are notoriously uncertain due to market conditions. We used an industry-recognized fuel price forecast from the U.S. Energy Information Administration, which was $1.67 per gallon in 2016 increasing to $7.14 per gallon by 2040, ranging from a high price forecast of $11.42 per gallon to a low of $4.29 per gallon in 2040.
Forecasts for electricity prices were based on values provided by Puget Sound Energy and Seattle City Light over the near-term through 2018. From 2019 onward, electricity costs were based on the forecast by the U.S. Energy Information Administration. Utility demand prices to serve the power supply required for an electric bus fleet were included in forecasted electricity rates. Metro currently pays an electric rate of $0.08 to $0.09 per kWh, we assumed a rate of $0.15 in this analysis to incorporate anticipated demand charges.
24 Delaware Valley Regional Planning Commission, 2015. Vehicle Technology Analysis for SEPTA Routes 29 and 79. South Philadelphia Trackless Trolley Feasibility Analysis. Available at: http://www.dvrpc.org/reports/13028.pdf
25 Vimmerstedt, L., A. Brown, E. Newes, T. Markel, A. Schroeder, Y. Zhang, P. Chipman, and S. Johnson. 2015. Transformative Reduction of Transportation Greenhouse Gas Emissions: Opportunities for Change in Technologies and Systems. National Renewable Energy Laboratory (NREL) and U.S. Dept. of Transportation. Technical Report NREL/TP-5400-62943 April 2015.

40
Cost analysis: Societal costs of environmental and noise pollution Much of the societal cost associated with Metro’s hybrid bus operations is from vehicle emissions. To determine the societal costs of environmental pollution, we used tailpipe and upstream emissions26 from buses by type and miles traveled, as presented later in the environment section. Social costs of pollution were based on costs published by U.S. Department of Transportation27 and on studies reported by the U.S. Environmental Protection Agency for CO2, NOx, and PM10 (Figure 12). These values were adjusted for future years by applying an annual escalation rate of 2 percent. The life-cycle cost analysis assumes that Metro is able to secure renewable energy to power the fleet. If instead, Metro uses grid electricity from Puget Sound Energy, which is likely to power 24 percent of our fleet this would result in emissions with a social cost of $4.3 million.
Noise pollution for battery-electric buses is 25 percent less than for diesel-hybrid fleets, as discussed in the “Environment” section. According to a study by the Victoria Transport Policy Institute (VTPI), the societal cost of noise pollution is most often calculated using an estimate of the reduction in real estate value (or societal dis-benefit) caused by high levels of vehicular noise, which can be translated into a societal cost of noise per VMT.28 VTPI aggregated a collection of studies on vehicular noise to estimate a per-VMT value for noise pollution for diesel buses and battery-electric buses. Our analysis assumed that hybrid buses generate noise costs approximately halfway between the values for diesel and battery-electric buses, as shown in Figure 13.
26 Emissions resulting from the extraction, generation, processing, handling and/or transportation of fuel.
27 U.S. Department of Transportation. 2016. TIGER Benefit-Cost Analysis Resource Guide. Available at: https://www.transportation.gov/sites/dot.gov/files/docs/Tiger_Benefit-Cost_Analysis_%28BCA%29_Resource_Guide_1.pdf
28 Transportation Cost and Benefit Analysis II, Victoria Transport Policy Institute (VTPI, December 2015. Available at: www.vtpi.org/tca/tca0511.pdf

41
Figure 12: Social Cost of Emissions by Pollutant Type, per Metric Ton and per 14-year lifespan of a 40-foot bus
Pollutant Social Cost per
Ton (2015$) Diesel-hybrid
(2016$)
Battery-electric with grid electricity
(2016$)
Battery-electric with renewable
electricity (2016$)
CO2e29 $43 $39,800 $11,900 $0
NOx30 $8,010 $12,500 $6,300 $0
PM1022 $366,414 $173 $0 $0
Figure 13: Noise Costs, by Vehicle Type, per VMT
Vehicle Class Noise Cost per VMT
(2016 $)
Diesel bus $0.076
Electric bus $0.046
Hybrid (implied) $0.061
Cost analysis: Total life-cycle costs for fleet replacement and per bus Figure 14, on the following page, presents the results of the life-cycle cost analysis for fleet replacement over the full forecast horizon, from 2016 to 2047. It compares transitioning to a zero-emission fleet to continuing Metro’s current fleet practices.
The costs shown exclude Metro’s electric trolley fleet, assuming that under either approach the trolley fleet will continue to be maintained at its current size. The forecast of Metro’s current fleet practices includes Metro’s order of 120 more battery-electric buses, announced in January 2017. No further expansion of the battery-electric fleet is considered in the evaluation of total costs for continuing Metro’s current practice of purchasing diesel-hybrid buses as buses are retired.
The long-term model includes total cash costs for Metro separately from societal costs resulting from emissions and noise pollution that are incurred by all King County residents. Given the uncertainty around the mix of slow- and fast-charge battery-electric bus technology that will be deployed, these
29 U.S. Environmental Protection Agency, Interagency Working Group on Social Cost of Carbon (2013), Technical Update of the Social Cost of Carbon for Regulatory Impact Analysis Under Executive Order 12866, p.18., Table A1, (https://www.whitehouse.gov/sites/default/files/omb/inforeg/social_cost_of_carbon_for_ria_2013_update.pdf).
30 National Highway Traffic and Safety Administration. 2012. Corporate Average Fuel Economy for MY2017-MY2025 Passenger Cars and Light Trucks, page 922, Table VIII-16, “Economic Values Used for Benefits Computations (2010 Dollars)”. Available at: http://www.nhtsa.gov/staticfiles/rulemaking/pdf/cafe/CAFE_2012-2016_FRIA_04012010.pdf (as cited in the 2016 DOT TIGER Resource Guide in 2015 dollars)
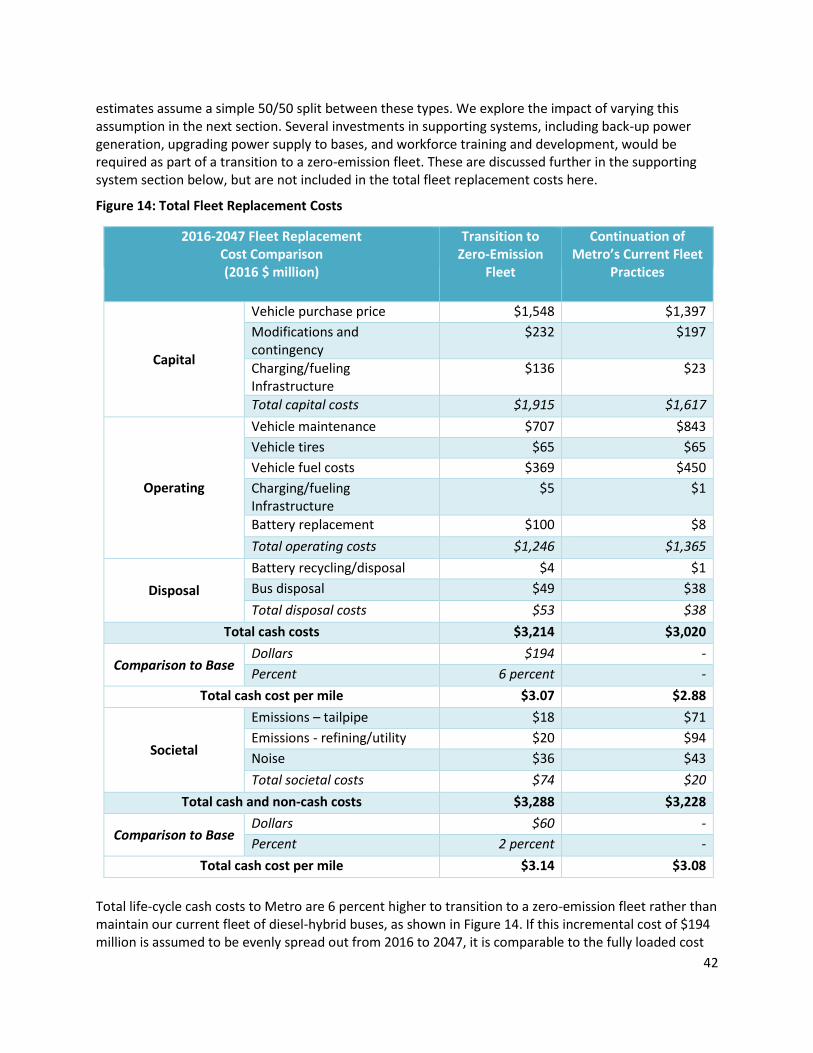
42
estimates assume a simple 50/50 split between these types. We explore the impact of varying this assumption in the next section. Several investments in supporting systems, including back-up power generation, upgrading power supply to bases, and workforce training and development, would be required as part of a transition to a zero-emission fleet. These are discussed further in the supporting system section below, but are not included in the total fleet replacement costs here.
Figure 14: Total Fleet Replacement Costs
2016-2047 Fleet Replacement Cost Comparison (2016 $ million)
Transition to Zero-Emission
Fleet
Continuation of Metro’s Current Fleet
Practices
Capital
Vehicle purchase price $1,548 $1,397
Modifications and contingency
$232 $197
Charging/fueling Infrastructure
$136 $23
Total capital costs $1,915 $1,617
Operating
Vehicle maintenance $707 $843
Vehicle tires $65 $65
Vehicle fuel costs $369 $450
Charging/fueling Infrastructure
$5 $1
Battery replacement $100 $8
Total operating costs $1,246 $1,365
Disposal
Battery recycling/disposal $4 $1
Bus disposal $49 $38
Total disposal costs $53 $38
Total cash costs $3,214 $3,020
Comparison to Base Dollars $194 -
Percent 6 percent -
Total cash cost per mile $3.07 $2.88
Societal
Emissions – tailpipe $18 $71
Emissions - refining/utility $20 $94
Noise $36 $43
Total societal costs $74 $20
Total cash and non-cash costs $3,288 $3,228
Comparison to Base Dollars $60 -
Percent 2 percent -
Total cash cost per mile $3.14 $3.08
Total life-cycle cash costs to Metro are 6 percent higher to transition to a zero-emission fleet rather than maintain our current fleet of diesel-hybrid buses, as shown in Figure 14. If this incremental cost of $194 million is assumed to be evenly spread out from 2016 to 2047, it is comparable to the fully loaded cost

43
to deliver 55,000 service hours annually. When societal costs to all residents in King County are included, reflecting costs from emissions and noise pollution, the total incremental costs are only 2 percent higher for a battery-electric bus fleet. It should be noted that environmental costs are non-monetary, so budgetary expenditures may increase or decrease, but total societal costs are about the same.
Figure 15 presents a summary of the life-cycle bus costs by major cost category over the 14-year lifespan of a 40-foot slow-charge and a 40-foot fast-charge battery-electric bus, compared to a 40-foot diesel-hybrid bus.
Figure 15: Total Life-cycle Costs per Bus for Battery-Electric and Diesel-Hybrid Bus Types
14-year Bus Lifespan
Cost Comparison (2016 $)
40-Foot Battery Electric (Slow-Charge)
40-Foot Battery Electric (Fast- Charge)
40-Foot Diesel-Hybrid
Capital
Vehicle purchase price $784,000 $707,000 $769,000
Modifications and contingency $134,000 $125,000 $139,000
Charging/fueling Infrastructure $34,000 $144,000 $10,000
Total capital costs $952,000 $976,000 $918,000
Operating
Vehicle maintenance $335,000 $335,000 $475,000
Vehicle tires $27,000 $27,000 $29,000
Vehicle fuel costs $158,000 $158,000 $185,000
Charging/fueling Infrastructure $1,000 $5,000 $0
Battery replacement $24,000 $113,000 $0
Total operating costs $545,000 $639,000 $689,000
Disposal
Battery recycling/disposal $3,000 $2,000 $0
Bus disposal $26,000 $23,000 $20,000
Total disposal costs $29,000 $25,000 $20,000
Total cash costs $1,526,000 $1,640,000 $1,628,000
Comparison to Base
Dollars -$102,000 $12,000 $0
Percent -6 percent 1 percent -
Total cash cost per mile $2.45 $2.63 $2.85
Societal
Emissions – tailpipe $0 $0 $36,000
Emissions - refining/utility $0* $0* $57,000
Noise $19,000 $19,000 $28,000
Total societal costs $19,000 $19,000 $121,000
Total cash and non-cash costs $1,544,747 $1,659,000 $1,749,000
Comparison to Base
Dollars -$204,000 -$90,000 -
Percent -12 percent -5 percent -
Total cash cost per mile $2.48 $2.66 $3.06
*If battery-electric buses are powered by grid electricity versus renewable energy, than the societal costs from emissions would be $18,000 over the bus lifespan.

44
The total life-cycle cash costs per bus for Metro range from 6 percent less for slow-charge to 1 percent higher for a fast-charge zero-emission bus, respectively, compared to a diesel-hybrid bus. When societal costs to all stakeholders in King County are included, reflecting costs from emissions and noise pollution, the total incremental costs are between 12 and 5 percent less for battery-electric buses compared to diesel-hybrid vehicles.
Cost analysis: Sensitivity tests We conducted sensitivity tests for two sets of input values to explore the sensitivity of life-cycle costs to various input assumptions. The assumptions concerned:
Distribution of charging technology in fleet (fast-charge and slow-charge)
Vehicle lifespan, annual maintenance costs, diesel prices, and charging efficiency
The first sensitivity test compared life-cycle costs for battery-electric bus fleets assuming a 50/50 distribution of fast- and slow-charge versus an 80/20 split between fast-and slow-charge. Prices for fast-charge buses, which have less storage capacity and less mileage range but charge more quickly, are lower than for slow-charge buses, which have more storage capacity and longer range but charge more slowly. This is shown in Figure 10. There are key service considerations regarding whether to deploy fast- or slow-charge buses, and we do not yet know what mix will best meet Metro’s service profile over time.
Proterra, the manufacturer of Metro’s current fleet of battery-electric buses, offers the ability to interchange the battery configuration. This gives Metro flexibility in two ways: (1) after placing an order with Proterra with a two-year lead time for delivery, Metro can wait until three months before delivery to confirm the battery type; and (2) once the bus is delivered, Metro could decide later to change out the battery type. This interchangeability gives Metro a buffer from the risks related to evolving charging infrastructure standards and technology development.
Results show that life-cycle costs for battery-electric buses are relatively insensitive to changes in the distribution of charging technology, increasing by less than 2 percent if there is an 80/20 split of slow- versus fast-charge relative to a 50/50 split.
A second test compared total life-cycle cash costs (excluding societal costs) between battery-electric buses and diesel-hybrids with two sets of assumptions, one favorable to battery-electric buses and one favorable to diesel-hybrids. The test maintained the assumption of a 50/50 split of slow versus fast charge but, varied three key input variables. When we explore annual maintenance costs inputs ranging from $0.30 per mile to $1.05 per mile, the total fleet replacement costs vary from 8 percent lower to 5 percent higher for a battery-electric fleet. When we consider forecasted prices of diesel fuel the overall total fleet replacement costs vary from 18 percent lower to 3 percent higher for a battery-electric fleet. When the charging efficiency is varied from six or four buses per hour per charger for fast-charge buses and two or one bus per charger for slow-charge buses, influencing the charging infrastructure capital costs, then the total fleet replacement costs vary from 1 percent lower to 2 percent higher for a battery-electric bus fleet.
When these three key input assumptions are considered together, we find that the life-cycle cost estimates for battery-electric buses may range from about 27 percent below to about 10 percent above the cost of diesel-hybrids, depending on whether the assumptions are favorable to battery-electric buses or to diesel-hybrids.

45
Cost summary
Given the young state of the battery-electric bus industry, forecasting costs, inflation and price fluctuations over a multi-decade time frame is difficult and requires numerous assumptions.
The estimated total cash cost to Metro of acquiring, operating and maintaining battery buses would be 6 percent higher than for diesel-hybrid buses over the period from 2016 to 2047. The incremental cost is 2 percent higher for transitioning to battery-electric bus fleet when the societal costs from emissions and noise pollution are considered.
The combined total cash costs for a 40-foot battery-electric bus over its 14 year lifespan ranges from 6 percent less for a slow-charge to 1 percent more for a fast-charge than for a comparable diesel-hybrid bus. When societal costs are included, battery-electric buses are 12 to 5 percent lower in cost than diesel-hybrid buses.
Depending on future projections for battery-electric maintenance costs, diesel prices and efficiency of charging station deployment the life-cycle cost for a zero-emission fleet could range from 27 percent less to 10 percent more than diesel-hybrids. 31
Bus capital costs for diesel-hybrid and battery-electric buses fall within the same range. The standard vehicle price for a 40-foot diesel-hybrid is $769,000, similar to the price range of $707,000 to $784,000, depending on battery type, for a 40-foot battery-electric bus. Price forecasts for the three types of batteries typically used in buses are expected to continue to fall for the next 10 to 15 years, which should allow manufacturers to offer either lower costs or longer ranges for the same price.
The charging capital costs are dependent on the number of vehicles each charger can serve. Given the evolution of charging infrastructure and the current lack of standardization, there is a risk that equipment could become obsolete and challenges with scaling up the deployment of charging infrastructure could occur, making the costs less certain.
Based on Metro’s experience with our diesel-hybrid and initial fleet of battery-electric fleets, current vehicle maintenance costs have been 30 percent less for the battery-electric buses.
The societal costs from GHG and air pollutant emissions and noise are three times higher for a diesel-hybrid fleet than for a zero-emission fleet powered by renewable energy.
31 As a point of comparison, Spokane Transit also conducted a life-cycle cost comparison for the purchase of buses with various fuel types in 2015 and concluded that battery-electric buses would be the most cost-effective alternative. This conclusion was based on electricity being the lowest cost fuel among those considered and an assumed significant decrease in maintenance costs, which offset the significantly higher purchase price per vehicle. However, maintenance costs applied for battery-electric buses were not based on first-hand experience of the transit agency or on manufacturer estimates. Instead costs were based on subtracting the maintenance hours logged for the combined coolant system, engine, exhaust system, transmission and 24V generation system. Maintenance of this CEET24V system accounts for 36 percent of maintenance hours and it was assumed nine percent for battery-electric buses, though no rationale for this exact number was given. In addition, battery-electric buses were not recommended at the conclusion of the report because of the need for multiple charge points along the route. This charging infrastructure cost was not taken into account and the report states that a service analysis would need to be conducted to potentially select some routes to be initially served by battery-electric buses.

46
Supporting systems A transition to a battery-electric bus fleet would have significant implications for fueling and charging infrastructure, bus base operations, workforce, and emergency preparedness —especially when compared to the transition from standard diesel to diesel-hybrid buses. The newness of the technologies and the lack of standardization between manufacturers require a detailed understanding of the charging technologies, electrical infrastructure requirements and limitations, and the proprietary technology constraints associated with each manufacturer. Choices regarding the selection of fast-charge or slow-charge configurations for buses and chargers would have far-reaching and long-lived impacts, as charging infrastructure would be costly to relocate.
This section assesses the overall feasibility of a transition to a battery-electric fleet and identifies key considerations. Before introducing large numbers of battery-electric buses to the fleet, Metro will need to conduct detailed design studies for affected bases that address the equipment and electrical infrastructure requirements, modifications to base operations to accommodate battery-electric buses, bus storage space, workforce development, and emergency preparedness planning. Facility needs will vary by base depending on current capacity limitations, physical configuration and types of buses it will serve.
Supporting system: Charging infrastructure Slow-charge/long-range and fast-charge/short-range battery bus and charging technology is still evolving.32
The battery-bus industry today does not have standardized charging ports, charging port locations, wire sizes, plugs, or receptacles. For example, BYD uses a unique system that has an on-board inverter and a different connector, while Proterra and New Flyer use an SAE standard connector with the inverter included as part of the charging station.
This lack of consistency and standardization has direct impacts on the layout of maintenance base charging equipment. It also affects an agency’s ability to efficiently store buses on a base—especially if the agency is considering operating buses from multiple manufacturers that may not be able to share the same charging equipment.
Some buses, such as the Complete Coach Works 40-foot vehicles in use at IndyGo in Indianapolis, can be charged only with plug‐in charging. Other manufacturers’ buses, such as Proterra’s 40-foot Catalyst buses (the type currently in operation out of Bellevue Base) can be fully charged from an overhead charging port as their primary power source, but also have plug‐in ports to allow for secondary charging. Other bus manufacturers, such as BYD, use plug‐in charging as their primary charging method but can be paired with third party en-route charging equipment to extend their range.
32 Induction charging, a third type is currently less-developed charging technology that is worth monitoring over the long-term. In‐pavement chargers (or induction chargers) use wireless technology to charge the vehicle batteries. Similar to a large version of a wireless cell phone charging pad, an electrically hardwired transmitter is recessed into the pavement and covered with an identifying traffic- and weather-proof cover. The induction chargers have typically been tested on routes where vehicles can dwell five to 15 minutes over a single inductive transmitter to charge. The chief benefit of this technology is the minimal space required compared to other charging infrastructure options. Antelope Valley Transit Authority will be testing inductive charging over the next several years with its new fleet of battery-electric buses.

47
Overhead chargers connect an electrical power source above the vehicle’s roof to a charging port on the vehicle’s roof—the difference is how the electrical connection is made. Overhead charging is typically associated with en-route fast-charge/short-range operations. The industry has dramatically different approaches to providing overhead en-route charging. For example, Proterra buses use a semi‐autonomous docking feature that guides an incoming bus into the correct position under a telescoping charging head that drops down to make the electrical connection. The connection, starting, and stopping of the electrical flow are controlled automatically with available driver overrides. New Flyer’s Xcelsior electric bus flips the drop-down approach and uses an inverted pantograph connection, similar to an electric trolley’s, to an overhead continuous catenary wire. This approach has the bus driver approach a stretch of nonmoving electrified conductor overhanging the bus stop.
As the technology is improved and early versions of charging stations are replaced by updated stations, a more unified approach to overhead charging may be adopted by the bus manufacturers. Until then, each manufacturer of fast-charge/short-range battery-electric buses uses a different and incompatible technology.
Currently, no third-party, overhead, en-route chargers are commercially available to add to a bus that was manufactured without overhead charging capabilities.
Supporting system: Bus base operations Introducing battery-electric buses into the fleet would require significant modifications to the typical nightly maintenance and service cycle, especially during the transition period when the agency is operating a mix of diesel and battery-electric buses out of the same maintenance base. Modifications to maintenance facilities will also be required. During the transition period, the flow of vehicles through the yard during the nightly servicing will be more complicated since the typical refueling and cleaning cycle will work for only a portion of the buses at the base.
Unlike diesel and diesel-hybrid buses that are refueled in similar ways, the time required to charge battery-electric buses can vary dramatically based on the size of the battery and type of charger (from 5 minutes with an overhead fast-charger to 5 hours with a slow-charge plug-in charger). The difference between the required number of shared fueling positions versus shared charging positions, and the difference in time needed for fueling versus charging vehicles, can create different nighttime service circulation patterns and bus parking.
To accommodate a large number of battery-electric buses, Metro’s maintenance bases would need additional space for charging infrastructure, unless below ground or overhead charging is developed.
Overhead fast-chargers are typically located en-route and, depending on how they are deployed, can minimize the need to do nighttime charging at the base or can be coupled with buses that allow supplemental slow-charge plug-in charging. They can also be used to charge multiple fast-charge/short-range buses in the maintenance base overnight. For example, assuming a 10-hour window for night-time charging and a 10-minute charge cycle per bus, approximately 60 fast-charge buses could be cycled through a shared-use fast charger per night. This would require additional overnight staff to move buses between chargers.
For slow-chargers, given current technology, each charger would likely accommodate one or two parked buses per night, depending on the battery capacity of the bus, its state of charge, and the electrical throughput of the charger. Currently, battery-electric bus manufacturers use plug-in slow-chargers that come in a variety of configurations but generally have a 3-foot x 3-foot footprint. Other transit agencies that are including battery-electric buses in their fleets have done design studies to create efficient yard

48
layouts and bus parking schemes to accommodate chargers between rows of parked buses (ABQRide) or overhead charging cable management structures (IndyGo). Antelope Valley Transit Authority is planning to pilot in-pavement inductive charging with some of their battery-electric bus fleet, which would have minimal impact on space requirements for charging facilities. However, no transit agency has scaled up a battery-bus fleet to the extent that Metro envisions, and charging technology continues to evolve. With no experience to learn from, and uncertainty about future technology, we cannot reliably project future base capacity needs.
Metro Connects calls for the addition of base capacity to support 620 more buses by 2040, either by building two or three new bases or by expanding existing facilities. Initial planning for one new base is underway, with potential completion around 2030. These facilities often take many years to site, design, permit and build. It will be important to understand and plan for the infrastructure needs to support a battery-electric bus fleet. Given the current capacity constraints at bases, the additional operational complications introduced by battery-electric bus charging, and the additional space needed for charging equipment, near-term and ongoing planning will be essential to manage the infrastructure needs of a growing fleet of battery-electric buses. At the same time, as Metro plans for new or expanded bases, it can consider opportunities to include battery-bus infrastructure from the start.
Supporting system: Power supply and infrastructure requirements For near-term procurements, configuring a base or multiple bases to supply power for 50 battery-electric buses is feasible and would not be a significant capital cost risk. Puget Sound Energy and Seattle City Light did not express concerns about current power generation capacity or additional demand surcharges, as regional demand has been stagnating and even declining—largely because of increasing energy efficiency and conservation efforts. However, it would be necessary to upgrade power delivery equipment to accommodate the significantly larger power requirements.
For a full battery-bus fleet, we assessed whether or not power requirements could become a limiting factor to transitioning the fleet. Metro currently operates seven maintenance bases that support 120 to 280 buses. Assuming buses with 660 kWh battery capacities (Proterra E2 Max—the largest battery currently on the market) with an 80 percent state of charge and 100 kW charging stations that allow for two equal shifts of bus charging, the power draw for 273 buses would be around 14MW. This is a significant power draw from the grid, but not unprecedented. To put this into context, a typical utility substation transformer is around 30MW. Given a lead time of five to 10 years to plan, design, and expand or construct the facility and to negotiate with the utility for upgrades to accommodate this energy requirement, local utilities indicated that Metro should be able to incorporate the utilities and infrastructure needed to support the power requirements.
Supporting system: Workforce training needs Metro recognizes the need to develop a workforce with the skills required to maintain and operate a zero-emission bus fleet. This involves both training of current staff and expanding our pool of applicants to those with skill sets applicable for a zero-emission fleet. Since procuring diesel-hybrid and new electric trolley buses over the past few years, Metro has been developing many of the skills needed for repairing and maintaining electric and battery-electric technology. Metro Human Resources is actively developing new ways to grow the talent pool, including apprenticeships and the hiring of an apprenticeship program coordinator to expand the applicant pool of mechanics with electro-mechanic skills.

49
The transition to a zero-emission fleet will also increase the demand for electricians to maintain the power-charging infrastructure. Metro’s Operations group is now training current and new operators with our existing fleet to ensure they are familiar with the operating requirements.
These efforts to meet workforce needs for a zero-emission fleet will build on other employee recruitment and workforce development programs outlined in our background information on Metro’s current fleet practices, per the County’s Equity and Social Justice Strategic Plan.
Supporting system: Emergency preparedness With a move to all zero-emission buses, a concern is that buses could not be charged and operated during a power outage or other emergency.
Our analysis projects that by 2020 close to 70 percent of the fleet will be transitioned zero-emission buses. We recommend that before the majority of Metro’s vehicles are battery electrics, a resiliency plan should be in place to deal with a potential loss of power.
As the landscape for battery technology is evolving quite rapidly, it is hard to predict what technology will be in place more than a decade into the future. There are few examples of designs for back-up power. One of the few agencies that is considering resiliency is Albuquerque Ride. Their recent study of introducing 60 battery buses into their Daytona maintenance and operations base included a two-MW power generator as an assumed cost in their implementation plan. This generator would cover the charging needs of about 30 percent of their battery-bus fleet during a power outage. Their estimate assumed the cost for the back-up generator was $1 million.
Supporting systems summary A transition to a battery-electric bus fleet would have significant implications for infrastructure, daily operations, and maintenance. Compared to the transition from standard diesel to diesel-hybrid buses, which use similar fueling procedures, a battery-electric bus fleet, infrastructure and charging time requirements would have a much larger impact on base operations, vehicle maintenance, and bus storage.
Metro can facilitate the transition through the following actions:
Conduct operations and design studies before introducing large numbers of buses into operations at maintenance bases to work out new operational flows, charging equipment placement, facility design issues, staffing requirements and power requirements. Key considerations would include the number, type and manufacturer of battery-electric buses that would be introduced and which bases would service them; and the distribution of overhead fast-charge/short-range versus plug-in slow-charge/long-range by base.
Continue to monitor and refine base operations and design standards as battery-electric buses
are introduced into the overall fleet. In the near-term, the installation of charging infrastructure
will increase the pressure on base capacity that Metro is currently experiencing. Further
evaluation is needed to quantify this impact.
The planning currently underway for an additional bus base is an opportunity to build a new base specifically to accommodate the infrastructure requirements of zero-emission buses.
The industry currently does not have a common standard for charging technologies. Equipment
varies by manufacturer, resulting in incompatibilities among buses and chargers, and creating
the risk that Metro will install charging infrastructure that becomes obsolete. Metro can

50
coordinate with other transit agencies and the American Public Transportation Association to
encourage bus manufacturers to standardize charging equipment.
Coordinate with other transit agencies that are introducing battery-electric buses into their fleet to investigate options to reduce the footprint of charging facilities.
Focus deployment of initial purchases to three bus bases until a more critical number of battery-electric buses is reached among the entire fleet. Small fleets can be significantly more expensive to maintain, due to a lack of efficiency of scale.33 Bellevue Base is a recommended candidate to support continued deployment of fast-charge/short-range buses because of its service profile, ability to make use of common charging locations, and expertise gained during the battery-bus pilot testing period.
Expand recruitment of employees with skills applicable to electric motors and start training programs for current staff. As the zero-emission fleet grows, it will be most efficient for staff training and infrastructure deployment to occur at select bases first and then expand to other bases. Training can build on skills and lessons learned from Metro’s current experience at Bellevue Base.
Retain our ability to provide transportation during emergencies by coordinating other regional agencies to update King County’s emergency preparedness plans to reflect needs and services available for a zero-emission all-electric fleet.
33 Based on current practice with a small number of battery-electric buss, as well as Metro’s experience with managing a small
fleet of Sound Transit vehicles.

51
Environment In addition to considering capital, operations and maintenance, and vehicle disposal costs, we examined the environmental—or societal—impacts from criteria air pollutants, greenhouse gas emissions and environmental noise pollution that would be generated by Metro’s hybrid bus fleet compared to a zero-emission fleet, as shown in Figure 16.
Figure 16: Comparison of Emissions from Hybrid vs. Zero-emission Buses
Emissions Type/Factor Diesel-Hybrid Buses Zero-emission Buses
Tailpipe emissions
Tailpipe emissions have a substantial adverse effect
on air quality and GHG emissions
Do not generate tailpipe emissions
CO2 1,611 - 2,602 g/VMT*
n/a NOx 0.82 – 1.48 g/VMT*
Particulate Matter (PM10) 0.001 – 0.004 g/VMT*
Upstream refinery emissions Fuel refining process
generates upstream air quality impacts
Electricity generated from renewable energy sources eliminates adverse air quality impacts.
CO2 345 g/VMT n/a
CH4 (Methane) 72 g/VMT
Noise
Generate environmental noise pollution from the
vehicle drivetrain, air movement, and tire
contact with pavement
Generate noise from air movement and
roadway contact, but much less from the vehicle drivetrain
Impact per VMT Rates shown in Figure 19 Rates shown in Figure 19
*Range corresponds to 40- versus 60-foot diesel-hybrid buses. Rates correspond to specific vehicle models currently used by Metro: 40-foot Gillig Standard LF and 60-foot New Flyer HDE 60.
Environmental analysis: GHG and air pollutant emissions Much of the environmental impact associated with Metro’s hybrid bus operations is from vehicle emissions. We consider both the emissions from the vehicle tailpipe and upstream from the production of diesel fuel or electricity generation.34
To quantify the tailpipe emissions, we projected vehicle miles traveled (VMT) for Metro’s hybrid fleet from 2017 to 2047 and used emission rates per VMT based on industry standard values. The calculation included emission rates for carbon dioxide (CO2), nitrous oxides (NOx) and 10-micro particulate matter (PM10) that were obtained for two of the bus models used by Metro. Figure 17 shows the emission rates
34 Other emissions and environmental damage associated with the production and transportation of batteries and buses is excluded from the analysis along with the emissions and costs associated with the production of crude and transportation to refineries for processing.

52
by vehicle type over the 14-year lifespan of a bus. Figure 18 shows the total projected emissions from 2016 to 2047 over the time period to transition the bus fleet.35
Upstream emissions from the refining process that produces the diesel fuel used by hybrid buses is included. Upstream refining generates approximate 345 grams of CO2 and 72 grams of methane (CH4) per hybrid-bus VMT. We combined these rates with VMT projections to calculate projected emissions expressed in metric tons.
Upstream electricity emissions depend on how electricity is sourced. The Puget Sound region is particularly well-suited to vehicle electrification given our hydroelectric power resources, though these resources are finite and may decline with climate change. Two utilities serve Metro’s service area.
Seattle City Light is already committed to maintaining a carbon-neutral electricity supply, and their efforts are supported by the City of Seattle’s “Drive Clean Seattle” comprehensive strategy supporting vehicle electrification infrastructure.
Puget Sound Energy (PSE), the other utility in this region, currently relies on a variety of electricity supply sources, including fossil fuel to maintain their local distribution. As of 2014, these included; coal (35 percent), hydroelectric (36 percent), natural gas (24 percent), wind (three percent), nuclear (one percent), and other (one percent).36 PSE has committed to reducing the contribution of coal-powered electricity by July 2022 as a result of a lawsuit settlement in 2016. As of late February 2017, the Metropolitan-King County Council is reviewing legislation authorizing Metro and other county departments in King County to enter into a “Green Direct” agreement with PSE to purchase wind-generated renewable energy from a new wind farm in western Washington. The current agreement includes existing Metro facilities (e.g. bus bases), but does not include current or future electricity demand for charging infrastructure to power zero-emission vehicles.
Metro intends to pursue renewable energy to power the expanding battery-electric vehicle fleet. Metro will seek options to expand the County’s “Green Direct” agreement to purchase renewable energy from Puget Sound Energy to include power for the existing or planned bus charging systems. Alternatively, Metro may explore options to expand our current efforts to sell the environmental attributes of powering electric vehicles with renewable energy using Renewable Identification Numbers (RINs) credits.
If electricity from the grid is used to power the fleet, we estimate that 24 percent of the fleet would be powered by facilities served by Puget Sound Energy. We apply the marginal emissions factor, to estimate the GHG effect of a change in electricity consumption, as directed by the GHG Protocol Policy
35 Emission rates were obtained from a white paper published by Michael J. Bradley and Associates (MJB&A), an environmental consulting firm that describes the results of a series of tests performed by the Altoona Bus Research and Testing Center (ABRTC). ARBTC is responsible for conducting the emissions testing required for new buses by the FTA; for the required testing, ARBTC designed a test cycle intended to mimic the operational attributes of the fleet used in Orange County, California. These operational attributes—a maximum speed of 41 miles per hour, an average speed of 12 miles per hour, and an average of five stops per mile—were assumed to be similar to Metro’s operational performance.
36 Puget Sound Energy, 2017. Electric Supply. Available at: https://pse.com/aboutpse/energysupply/pages/electric-supply.aspx

53
and Action Standard.37 For Puget Sound Energy the marginal emissions factor for planned future electricity generation is 0.27 per MWh.38
Figure 17: Emission Rates by Vehicle Type over 14-year lifespan of a bus
metric tons
Vehicle CO2 NOx PM10
40-foot diesel-hybrid 1,106 1.87 0.001
40-foot battery-electric powered by grid electricity
331 0.9 ~0.0
40-foot battery-electric powered by renewable energy
0.0 0.0 0.0
Compared to a diesel-hybrid bus, a zero-emission bus powered by renewable energy eliminates all GHG and air pollutant emissions from the tailpipe and from electricity production. As shown in Figure 17, even if the battery-electric bus is powered with grid electricity, it still reduces CO2 emissions by more than two thirds, NOx by more than 50 percent, and nearly eliminates PM10 emissions. Figure 18. Total Fleet Vehicle Emissions, 2016-2047, including tailpipe and upstream emissions
metric tons
Fleet Replacement Options
CO2e NOx PM10
Continuation of Metro’s Current Fleet Practices
2.34 million 3,533 2.53
Transition to zero-emission fleet powered by grid electricity
1.17 million 2,562 0.62
Transition to zero-emission fleet powered by renewable electricity
0.53 million 756 0.62
Note: Rates correspond to specific vehicle models currently used by Metro: 40-foot Gillig Standard LF and 60-foot New Flyer HDE 60.
Cumulatively over the period from 2016 – 2047 continuing Metro’s current fleet practices will result in 2.34 MTCO2e. Transitioning to a zero-emission fleet through the ongoing retirement and replacement of diesel-hybrids means that diesel fuel will continue to be used and result in emissions as vehicles are phased out. Transitioning to a zero-emission fleet powered by renewable energy reduces GHG
37 World Resources Institute, 2014. Greenhouse Gas Protocol: Policy and Action Standard. Available at: http://ghgprotocol.org/policy-and-action-standard
38 Puget Sound Energy. 2015. Planning for the Future Integrated Resource Plan Puget Sound Energy. 2015. Planning for the
Future Integrated Resource Plan chapter 1 Figure 1-7. Available at: https://pse.com/ABOUTPSE/ENERGYSUPPLY/Pages/Resource-Planning.aspx

54
emissions by 1.8 MTCO2e a nearly 80 percent reduction. It would reduce NOx emissions by nearly 80 percent, and PM10 by more than 75 percent. Using grid electricity would still result in a 50 percent reduction in GHG emissions and substantial reductions in air pollution.
Environmental analysis: Noise Metro’s bus fleet produces noise pollution that results in a societal cost (or dis-benefit), borne particularly by residents who live near heavily traveled bus corridors. At low speeds, much of the noise pollution is generated by the bus’s engine; at higher speeds, most noise pollution results from air movement and the tires’ contact with the ground. While battery-electric buses eliminate the former category of noise, they do produce aerodynamic noise at rates similar to hybrid buses. Figure 19 compares noise emissions from several bus types with other common noise emitters. Shifting to a zero-emission bus fleet would reduce noise pollution to levels similar to and less than a passenger vehicle.
Figure 19: Comparison of Noise Emissions (in decibels)
Vehicle Accelerating Driving By
Diesel bus 76-81 74-80
Hybrid bus 76-78 73-79
Trolley bus 72-75 69-70
Battery-electric bus 65-66 Not available
Comparison Vehicles
Garbage truck 80-84
Utility truck 76-80
Passenger car 66-70
Environmental analysis: Battery production, recycling and disposal The environmental impacts of lithium-ion batteries are a result of material extraction and battery production, recycling, and disposal. Negative environmental effects are associated with the mining of these materials.39 According to a study by Argonne National Laboratory, which looked at the production and recycling of lithium batteries, material reserve estimates indicate that lithium supplies are adequate for battery production, but cobalt and nickel supplies could be strained. In general, while batteries are small contributors to life-cycle energy use and CO2 emissions, cobalt and nickel are the most energy-intensive materials to include in the lithium-ion battery supply chain.40
Lithium, cobalt, and nickel are key components of lithium-ion battery production, along with other organic chemicals and plastics. These metals, unlike fossil fuels, are not consumed in energy production processes and therefore have the potential to be recovered for use after the battery is no longer charging a vehicle. The impacts of collecting, dismantling, and recycling batteries must be accounted for in the process of diverting electric vehicle batteries from waste streams.
39 Reed M. Izatt, PhD. “Lithium-ion Batteries: Key to Solving our Future Energy Needs?” August 2016. Available at: https://investorintel.com/sectors/cleantech/cleantech-intel/lithium-ion-batteries-key-solving-future-energy-needs/
40 Gaines, L. and J. Dunn. “Lithium-Ion Battery Production and Recycling Materials Issues.” June 2015. Argonne National Laboratory. Available at: https://energy.gov/sites/prod/files/2015/06/f23/es229_gaines_2015_o.pdf

55
Recycling of batteries offers benefits and potential, but commercialization of techniques is still evolving. According to a study at the University of California, Berkeley, material recovery from pyrometallurgical recycling can offset environmental burdens associated with lithium-ion battery production, namely a 6 to 56 percent reduction in primary energy demand and 23 percent reduction in GHG emissions, when compared to virgin production. This type of recycling is flexible in that it accepts multiple battery designs and is cost-effective if valuable materials are recovered in the recycling process. There is also evidence that other techniques are being developed that result in less air pollution, lower waste, but use significantly more water than pyrometallurgical processing.41 It is critical that recycling facilities be located in places with strict environmental regulations to ensure outputs do not present a health risk to surrounding populations.
Lithium-ion battery packs can be reused in stationary applications, such as energy storage systems for residential or commercial power. Assessing a battery’s degradation, including any maintenance needs, is necessary when the battery is removed from the vehicle. This process determines the suitability for re-use and is often completed by a vehicle manufacturer. Full battery reuse technology is still not currently commercially developed.42
Currently, Metro disposes of batteries from trolley and hybrid buses at the end of each battery’s useful life. For hybrids, battery life ranges from four to six years, with an average of five.
Battery-electric bus manufacturers will provide warranties for up to six years; however, National Renewable Energy Laboratory (NREL) tests have found that frequently used Proterra bus batteries are exceeding the stated six-year battery life. Our analysis assumed that each bus will have one battery replacement and disposal during its expected lifespan, plus a battery disposal in the assumed year the bus is retired.
Battery technology is changing rapidly, and some manufacturers of zero-emission buses are actively planning for battery recycling. In response to our request for information, the manufacturer BYD said their current batteries contain no toxic electrolytes or heavy metals (iron phosphate chemistry). Their batteries have a 12-year warranty so would not need to be replaced by Metro during a 12-year useful life of a bus.
Proterra said their batteries have almost no toxins and are designed for recycling. Their batteries can be leased, so customers would not be responsible for battery recycling.
Both BYD and Proterra said they will work with customers to facilitate a second life for batteries as stationary energy storage systems, or will repossess the batteries themselves for that purpose. Energy storage systems could be used to facilitate solar charging of buses (in conjunction with photovoltaics), to store power from the grid during off-peak times for charging buses during peak times, or to be a back-up power source (in conjunction with a diesel generator).
41 Hendrickson, T. P., O. Kavvada, N. Shah, R. Sathre, and C. D. Scown. Life-cycle implications and supply chain logistics of electric vehicle battery recycling in California. January 2015. Environmental Research Letters. Available at: http://iopscience.iop.org/article/10.1088/1748-9326/10/1/014011/pdf
42 Ahmadi, L., S. B. Young, M. Fowler, R.A. Fraser, and M. A. Achachlouei. 2015. A cascaded life cycle: reuse of electric vehicle lithium-ion battery packs in energy storage systems. The International Journal of Life Cycle Assessment. Available at: http://link.springer.com/article/10.1007/s11367-015-0959-7

56
Despite above claims, the information from BYD and Proterra is inherently promotional in nature and must be confirmed by Metro as part of the procurement process.
Environment summary Transitioning to a battery-electric fleet provides Metro the opportunity to reduce fleet emissions and noise significantly. Taking advantage of our region’s primarily hydro-powered electricity supply, CO2 emissions would be reduced by over 1.8 MTCO2e over the forecast period and would further the agency’s ability to meet air quality and GHG emission reduction goals if renewable energy is secured. The external noise for Metro bus operations would fall significantly, as battery-electric buses are quieter than any bus in the existing fleet and are closer to the noise levels of private autos. This would improve the quality of life for the neighborhoods in which Metro buses operate.

57
Equity In King County and across the U.S., low-income families and people of color are more likely to live in neighborhoods that have high concentrations of air pollution, and as a result are at higher risk for chronic disease and premature death.43,44 In alignment with King County’s Equity and Social Justice Strategic Plan and King County’s equity impact review process, this analysis focuses on how the air pollution benefits of zero-emission technology could advance social equity by first serving communities most vulnerable to air pollution. Metro’s decisions about service and fleet deployment under a zero-emission fleet transition would continue to follow Metro’s Service Guidelines, discussed in detail in the background section of Metro’s current fleet practices, and would also be based on the technical and physical feasibility aspects covered elsewhere in this report.
Metro has already seen large improvements in air pollution emissions by transitioning a majority of the fleet to diesel-hybrid from standard diesel vehicles. As noted in the previous section, the 40-foot and 60-foot hybrid buses have, respectively, 95 percent and 91 percent fewer NOx emissions; and 99 percent and 97 percent fewer PM10 emissions. Nevertheless, diesel-hybrid buses do emit air pollutants including ozone, lead, atmospheric particulate matter, carbon monoxide, sulfur oxides, and nitrogen oxides. These pollutants can harm human health and the environment. Providing public transit to disadvantaged populations is key to advancing equity, but the diesel technology currently in use throughout the county imposes undesirable effects on those very populations.
A move to a zero-emission fleet would create an opportunity to advance equity further. Metro could prioritize the deployment of zero-emission buses in areas that have both poor air quality and populations with a relatively high prevalence of respiratory and cardiac health issues who are generally less able to move or to receive treatment for these conditions.
For our equity analysis we developed a methodology for prioritizing the deployment of zero-emission buses that has three steps:
1. We compiled factors for air quality, health, and social conditions for each census block in the Metro service area. We gave each factor a score, added the scores together for each block, and then divided the blocks into quintiles based on their scores. The areas with the highest scores are where the population has the highest vulnerability to air pollution and would most benefit from zero-emission technology.
2. Individual bus route alignments were then overlaid on the results of step one. We scored each route based on its daily mileage in each quintile, and by the number of census blocks it intersects in each quintile.
3. Since zero-emission buses would be deployed to specific bases, routes were grouped by their operating base. Bus bases were ranked based on the scores of its routes.
We developed this methodology in consultation with public health and air quality experts from King County Public Health King County, the Puget Sound Clean Air Agency (PSCAA), and the Region 10 U.S.
43 National Equity Atlas. 2016. Air pollution: Unequal burden. Available at: http://nationalequityatlas.org/indicators/Air_pollution%3A_Unequal_burden 44 Schulte, J. 2012. Traffic Density, Census Demographics and Environmental Equity in Housing: a geographic analysis in urban King County. Prepared for King County Equity and Social Justice Initiative.

58
Environmental Protection Agency office, and used PSCAA’s Community Air Tool. The data set includes the following indicators for the factors used in step one above:
1. Poor air quality: diesel emissions, permitted point-source air pollution, proximity to high traffic, and use of wood for heating
2. Existing health conditions that may be caused by or exacerbated by poor air quality: chronic obstructive pulmonary disease, asthma and heart disease
3. Social factors that suggest a population may be less well-equipped to deal with such health effects: low-income, communities of color, under age 18 and above age 64, linguistically isolated, households headed by single females, and low rates of high school completion
We added data about the prevalence of child and adult asthma to the dataset used in the Community Air Tool. We also added population density in response to the Stakeholder Review Panel’s advice that air quality benefits should be targeted not only to areas with poor air quality, but also to areas where the greatest number of people would benefit from improvements.
All factors were combined into an index. Each factor was given equal weight except for minority (communities of color) and low-income percentages and asthma prevalence, which were given double weight. The County’s Equity and Social Justice Plan identifies income and race as key determinants of equity, and the Stakeholder Review Panel highlighted them as well as asthma prevalence as important indicators of a community’s likelihood of experiencing and being able to deal with the effects of air pollution.
Each factor was then given a score of zero to three, with three indicating where residents have the highest vulnerability. The scores for all factors were then added together for each census block. Areas that have poor air quality, have a prevalence of existing health conditions related to air quality, and have more social factors that reduce their ability to deal with the health effects receive a higher score than areas that do not.
The result of the analysis is a score for each census block group in King County. The block scores for all of King County, and the locations of bus bases, are shown in Figure 20. The higher the score is for an area, the higher the vulnerability and priority for reducing air pollution in that area, including through the deployment of zero-emission buses.
It should be noted that while Metro’s equity analysis in our annual system evaluation is based on the population of bus riders, the equity analysis for this report was based on the full population of people living near bus routes. This is because all people living in the community would benefit from improved air quality—not just bus riders.
We then created a profile for each bus route by averaging the score for all census blocks along each route. We created a catchment of 200 meters around each Metro bus route, as most pollutants are dissipated at this distance from the roadway.
Based on their scores, bus routes were divided into five groups (quintiles) with an equal numbers of bus routes in each group. Figure 21 shows the categorization of routes, with routes in red ranking in the highest quintile for priority to be served with zero-emission buses.

59
Figure 20: Highest and Lowest Scored Areas in King County by Air Pollution Vulnerability
Darker shaded areas are more vulnerable to air pollution than the lighter shaded areas.

60
Figure 21: Highest and Lowest Scored Areas in King County by Air Pollution Vulnerability and Scored Bus Routes
Darker shaded areas are more vulnerable to air pollution than the lighter shaded areas. Red bus routes are in the highest priority quintile to be served by zero-emission buses, green routes the lowest.

61
Bus fleets are deployed at specific bus bases, and the buses housed at each base are used interchangeably among routes with comparable service characteristics. As Metro prepares for a bus purchase, the initial decision about where to first deploy battery-electric buses will be by base. This decision can include consideration of the equity scores for each base’s routes, along with the technological and physical factors mentioned elsewhere in this report. After buses are assigned to a particular base, the selection of routes on which to deploy them could be informed by the scores of individual routes operating out of that base.
To compare the results by base, we used two different methods. First, we calculated the daily mileage by route for each of the five scoring categories. With this method, longer routes with lower frequency are not necessarily given priority over shorter routes with high frequency. This table ranks the bus bases by the daily bus mileage of routes serving census blocks with the highest scores (top 20 percent) for poor air quality, health conditions, and vulnerable populations.
In the second method, we calculated the number of census blocks in each of the five scoring categories that are intersected by each route. These are ranked by bus base. This method accounts for population density and the number of affected households in each scored area, as each census block contains an approximately equal number of households.
The results of the two methods are shown in Figure 22 and Figure 23 (current zero-emission buses are excluded from the relevant bases and shown as a separate category).
Figure 22: Total Daily Bus Route Mileage per Scoring Quintile
Lowest score for poor Highest score for poor air quality, health, air quality, health social conditions social conditions
Bus Base 1
(bottom 20%)
2 3 4 5
(top 20%) Total Miles
South 2,257 5,720 1,352 8,967 14,956 33,252
Current zero-emission fleet
1,066 959 1,727 3,902 4,035 11,689
Ryerson 1,302 1,566 2,721 4,252 3,598 13,439
Central 0 4,875 2,136 2,252 1,278 10,541
Atlantic 0 0 872 96 147 1,115
Bellevue 8,831 1,059 1,524 0 0 11,414
East 5,270 409 2,651 93 0 8,423
North 1,737 3,667 10,905 629 0 16,938
Total 20,464 18,255 23,887 20,190 24,014 106,811

62
Figure 23: Total Census Block Groups Intersected by Routes per Scoring Quintile
Lowest score for poor Highest score for poor air quality, health, air quality, health social conditions social conditions
Bus Base 1
(bottom 20%) 2 3 4
5 (top 20%)
Total census block
groups intersected
South 45 98 112 194 205 654
Central 39 91 100 83 117 430
Ryerson 33 98 102 81 94 408
Current zero-emission fleet
10 46 56 50 90 252
North 30 81 78 64 42 295
Atlantic 2 15 4 25 34 80
East 58 63 62 31 20 234
Bellevue 120 96 89 41 9 355
Total 377 588 603 569 611 2,708
Equity summary
Deploying zero-emission buses to South Base would have the greatest positive impact on equity.
o South Base routes have the most daily mileage in the high priority areas identified by this analysis; 62 percent of the highest scoring route mileage originates at South Base.
o South Base routes also travel through more of the high priority areas than any other base; 31 percent of the census blocks that South Base routes travel through are considered the most vulnerable.
o South Base has more daily service miles than any other base, with around three times as many as Ryerson, Central, or South bases.
Central and Ryerson bases rank second to South Base in terms of priority for deployment of zero-emission bus fleets.
Because route mileage score is an average based on all the census blocks a route travels through, Bellevue, East, and North bases do not have routes in the highest scoring quintile, and as a result have no mileage in the highest scoring quintile (Figure 22). However, their routes travel through areas with populations most vulnerable to the effects of air pollution (Figure 23).
The results of this analysis can be combined with the analysis of suitable route and base characteristics in this report to inform near-term deployment decisions—both at the base and at the route level. The analytic framework used for this study can also be applied in the future as service changes over time.

63
Findings The option of transitioning to a zero-emission bus fleet powered by renewable energy presents
an opportunity for Metro to dramatically reduce GHG emissions. The preponderance of zero-emission hydropower in our electricity supply makes this region particularly well-suited to battery electric vehicles.
Additional benefits include significant reductions in fleet noise and other air pollutants. These benefits can be distributed in a way that first benefits those who are most vulnerable to the effects of poor air quality—particularly those served by buses originating from South Base—and can then be distributed to all bases over time.
Our service analysis found that current slow-charge battery buses are likely to meet the service criteria for nearly 70 percent of Metro’s service needs once tested by Metro. If technology progresses to a range of 200 miles on a single charge, they could satisfy over 90 percent of Metro’s bus service.
Current fast-charge technology would allow for 35 to 47 percent of 40-foot buses to be transitioned to battery-electric buses. Further technological advancements could increase this number to as much as 90 percent without substantial service adjustments.
We expect that some mix of slow-charge and fast-charge technology, perhaps along with some service adjustments, could make it possible for Metro to achieve a 100 percent battery-electric bus fleet. According to the fleet replacement plan, this could be achieved by 2034 under a 14-year replacement schedule or by 2036 under a 16-year replacement.
The life-cycle cost analysis found that transitioning to a zero-emission fleet would come at an incremental cost of about 6 percent, or about $194 million in 2016 dollars, when compared to Metro’s current fleet practices. Sensitivity tests that changed assumptions to be more or less favorable for battery-electric buses found that the battery-electric bus life-cycle cost might range from 27 percent lower to 10 percent more expensive than diesel-hybrids.
Transitioning to an all-electric bus fleet powered by low-carbon electricity would enable Metro to meet its commitments to reduce GHG and air pollutant emissions. GHG emissions would be reduced by over 1.8 MTCO2e, an 80% reduction, over the forecast period by transitioning to a zero-emission fleet powered by renewable energy. Air pollution emissions from NOx emissions would be reduced by nearly 80 percent and PM10 by more than 75 percent. Even if grid electricity is used the transition would still reduce GHG emissions by 50 percent, as a result of the efficiency improvements of an electric engine, as well as substantially reduce air pollution.
The external noise for Metro bus operations would fall significantly, as battery-electric buses are quieter than any bus in the existing fleet and are closer to the noise levels of private autos. This would improve the quality of life for the neighborhoods in which Metro buses operate.
Metro’s experience with the three battery-electric buses now in operation has been positive and has generally been mirrored by other agencies testing battery-electric buses in the US. However, a number of matters would require attention if the option of building a zero-emission fleet is pursued. These include the significant changes to daily operations at bus bases; the logistics of charging buses along the route or at maintenance bases, where capacity is already constrained; a plan to provide bus service in the event of a power outage; and the near-term exposure to risks associated with young manufacturing companies, emerging technologies, and the lack of industry standardization.

64
CONCLUSIONS
Our analysis considered three options for achieving a carbon-neutral or zero-emission fleet: using an accounting approach to quantify avoided emissions from Metro’s transit services, purchasing carbon offsets, or transitioning to an all-electric fleet powered by renewable energy. We compared each option against five evaluation criteria: service and fleet, cost, supporting systems, environment, and equity.
We concluded that transitioning to a zero-emission fleet powered with carbon-neutral renewable energy is the only option that would achieve the 2015 Strategic Climate Action Plan’s commitment to directly reduce GHG emissions. By doing so, it would help us attain the climate plan’s long-term emission-reduction targets. It is also the only option that would improve local air quality and public health. This option alone would enable us to reduce social inequities by focusing the early deployment of zero-emission buses in communities that are most vulnerable to the impacts of air pollution. Reduction of noise from buses is another societal benefit unique to this option.
Our feasibility analysis concluded that a fleet made up mainly of battery-electric buses could meet many of our service needs in the near term. Depending on the successful evolution of 60-foot battery bus technology, development of charging infrastructure, and other conditions, battery-electric buses are likely to become capable of meeting most or all of our service needs.
Generally, current estimates show that the total life-cycle costs of a battery-electric bus fleet are 6 percent higher than for diesel-hybrid buses. When societal costs to all residents in King County are included, reflecting costs from emissions and noise pollution, the incremental costs are 2 percent higher for a battery-electric bus fleet. We expect the incremental costs to decline as the technology and the market mature. Metro will continue to monitor our costs for operation and maintenance, as well as for charging station infrastructure as we expand our deployment in the near-term and consider future purchases.
While a transition to a zero-emission fleet would present risks and challenges to Metro’s operations, we concluded that these are manageable. By gradually introducing battery-electric buses and supporting infrastructure as older buses are retired or service is expanded, Metro could convert the fleet and make operational changes without disrupting service to the public. The development of battery-bus infrastructure could be integrated with other infrastructure upgrades and expansion that would be undertaken to support the Metro Connects vision of a 70 percent increase in service. Early planning and constant monitoring of battery-bus technology could also reduce risks. In addition, we could build on Metro’s strong record of successfully adapting to new technologies—especially our early adoption of diesel-hybrid buses.
Our analysis also concluded that while the purchase of carbon offsets would yield indirect environmental benefits. Carbon offset purchases could reduce the funding available for transit service and, consequently, the emission-reduction benefits that transit provides. The slightly higher estimated cost of battery-electric buses compared to diesel-hybrids would be offset by the zero-emission buses’ direct environmental and societal benefits.
This report will inform our work with other departments to respond to the council directed work plan to develop and transmit a Carbon Neutral King County Plan.

65
RECOMMENDATION AND NEXT STEPS
Recommendation King County Metro Transit has a long history of leadership and action to confront climate change and to promote equity and social justice, and is committed to advancing the goals and priorities of King County’s Strategic Climate Action Plan as well as the Equity and Social Justice Strategic Plan.
Metro will pursue a goal of transitioning to a zero-emission fleet powered with renewable energy in order to meet these commitments. Our ability to do so is dependent on technological advancements, infrastructure development, affordable costs, successful management of risks, and other necessary conditions. Metro will pursue having all new buses in service from 2020 be zero-emission, powered by renewable energy, if progress on the following requirements continues to evolve to meet our needs.
Metro will need to collaborate with the bus manufacturing industry and other transit agencies to ensure progress on the following technical and policy requirements for a successful transition to a zero-emissions fleet powered by renewable energy:
Vehicle and charging technology enables Metro to meet current and future service goals, as defined in Metro Connects. Examples are a 60-foot articulated battery bus, electric vanpool and Access vehicles, and charging technology that successfully meets charging times and vehicles ranges.
Charging infrastructure meets our standard operation procedure requirements, including charging standardization and on-base charging compatible with bus base and facility capacity constraints.
Metro is able to secure renewable energy supplies via purchases from Puget Sound Energy through the Green Direct Program or approval of Metro’s Renewable Identification Number application to the U.S. EPA for the sale of environmental attributes or other future renewable power purchase options.
To move successfully toward a transition to a zero-emission fleet powered by renewable energy, Metro would also continue to collaborate with the bus manufacturing industry, power providers, local communities and others to ensure the following safety, financial and service factors are addressed:
Safety for both customers and employees must be maintained or improved over current standards.
Staff training and development opportunities are provided to Metro employees.
Public outreach processes are in place to maximize benefits and limit burdens to local communities.
Equity impact review is used to target service with zero-emission vehicles to communities that are most vulnerable to the impacts of poor air quality.
Continued monitoring of total costs of transitioning to a zero-emission fleet to ensure incremental costs do not limit Metro’s ability to deliver and expand service. If incremental cost increases occur, Metro will seek partnerships and other funding sources to offset these increases.

66
Emergency preparedness plan and procedures are in place to ensure Metro can be responsive in an emergency by the time Metro reaches the point that the fleet is majority zero-emission buses. An example is back-up power generation.
Metro would move gradually toward the goal of a zero-emission fleet. Whenever older buses are replaced or additional buses are acquired to support expanded service, Metro would purchase zero-emission battery-electric buses or—for the trolley system—electric trolley buses. In this way, the goal could be attained as soon as 2034 through ongoing regular fleet replacement and Metro would commit to completing the fleet replacement by 2040, if the key requirements above are met.
Metro will work closely with all departments to respond to the council-directed work plan in support of the Comprehensive Plan to develop and transmit a Carbon Neutral King County Plan to Council by February 2019, with an interim progress report by Dec. 31, 2017.
Next steps As part of Metro’s Zero-Emission Program, this feasibility report will serve as a roadmap for implementing the program and transitioning the fleet. Fleet transition will not occur in one decision, but through a series of decisions over-time as Metro evaluates its fleet and facility needs to deliver service. This analysis can serve as a guide for those future decisions over time. Successful implementation will depend on partnerships and be guided by King County policies and plans. Here we discuss both.
Near-term bus purchase On January 10, 2017 King County Executive Dow Constantine announced that King County Metro Transit will acquire 120 all-electric battery buses by 2020.45 As part of this commitment, Metro will purchase up to 73 battery buses from Burlingame, California-based Proterra. The first 20 are scheduled to go into service this year and 2019. Up to eight of the new 40-foot fast-charge battery buses will likely operate on Metro Routes 226 and 241 in Bellevue. Metro will also acquire up to nine slow-charge long-range electric buses from different manufacturers to test the battery technology with a range of about 140 miles. Once testing is complete Metro will decide whether the remaining portion of the order should be fast- or slow-charge technology.
Partnerships to achieve goal Opportunities to collaborate with other transit agencies, cities, utilities, and other stakeholders are being pursued to ensure our battery bus technology and infrastructure needs are met. Partnering opportunities include cooperating on the assessment, planning, design, and construction of bus and smaller EV charging infrastructure.
Grant funding is available at federal and state levels to support electric vehicle infrastructure, including to study the impacts of charging station infrastructure (power requirements and footprint) on current maintenance and operations. Grants are being pursued for work related to charging station standardization, safety and operational efficiency.
Given the increased magnitude of power that will be required to support large numbers of battery-electric buses, Metro will need to partner and plan with utilities as our power requirement grows. Metro
45 King County Executive Dow Constantine. 2017. King County Executive announces purchases of battery buses, challenges industry to build next-generation transit. Available at: http://kingcounty.gov/elected/executive/constantine/news/release/2017/January/10-battery-buses.aspx
67
has had, and continues to have, conversations and contacts with Puget Sound Energy and Seattle City Light. Initial conversations with utilities have uncovered that providing the quantity of power that a large battery-electric bus fleet would require is possible. At some point in the future, upgraded power infrastructure will be needed and the planning, design, and construction of it will require ample lead time.
Siting of charging infrastructure at transit-centers or on-route charging will require coordination with local jurisdictions. One fast-charge station has been built at Eastgate Park-and-Ride, and coordination with the City of Bellevue on that infrastructure and other new infrastructure sites will continue to be needed. Metro has reached out to build relationships in Bellevue, and will do so for other impacted jurisdictions as potential battery-electric bus charging infrastructure sites are assessed and planned.
Metro can use its market power, in collaboration with other transit agencies, to leverage the bus industry to develop battery-electric buses and charging infrastructure to meet our needs. With the 2017 announcement of the largest battery-bus order in North America, Metro is in a position to influence the direction of product development.
This analysis and engagement with the Stakeholder Review Panel members has strengthened our partnerships on equity and public health in this region. Community partners on our Stakeholder Review Panel strongly emphasized the importance of an equity impact review in this analysis and the need to continue public engagement as Metro deploys new technology. As well, the City of Seattle’s Equity and Environment Initiative provides another platform to align efforts on these issues in our region. Community stakeholder roles and partnerships are critical to ensure that diverse voices with varying and common interests are heard.
The public health and air pollution data for this analysis was generated by the Puget Sound Clean Air Agency and Public Health Seattle and King County. Both of these agencies have identified key priority communities to focus efforts to reduce inequities and improve health outcomes related to air quality in the King County region. As Metro deploys this technology, we have the opportunity to continue to build on these partnerships, to best address the needs in the region.
Implications for King County policy This feasibility report addresses the Countywide Strategic Plan and Equity and Social Justice Strategic Plan goals related to human health, environment sustainability, climate, transportation and mobility. Our equity impact review uses air pollution, health, and demographic data to identify how to prioritize sequencing the deployment of zero-emission bus technology to reduce inequities and disparities with regard to air quality and health outcomes in King County. Our analysis and recommendation to transition to a zero-emission bus fleet invests in advancing policies and programs that simultaneously reduce climate pollution and improve human health in King County. By prioritizing the sequence of deployment of zero-emission fleet at South base, based on the data-driven equity impact review in this analysis, Metro can reduce the inequities of air quality and health outcomes in low-income communities of color most vulnerable to air pollution.
The transition to a zero-emission fleet powered with renewable energy will facilitate the successful realization of King County’s 2015 Strategic Climate Action Plan. In particular, this transition will help achieve the targets for reducing total greenhouse gas emissions from government operations by at least 25 percent by 2020, and 50 percent by 2030; growing transit service through 2020 with no increase in GHG emissions; increasing the percentage of alternative fuels in County fleets 10 percent by 2025; and, ensuring that all electricity supplied for King County government operations is GHG emissions neutral by 2025. In the near-term, in order to complete our testing of battery bus technology, Metro expects it will

68
have to delay retirement of some of the diesel-only fleet until the entire zero-emissions bus order is in service. It is Metro’s assessment that the GHG emission reduction benefits of purchasing a zero-emission bus powered with renewable energy versus a diesel-hybrid bus, outweigh the emissions resulting from keeping a diesel bus on the road for a few more months.
The transition is further supported by priorities outlined in King County Metro’s Long-Range Plan - Metro Connects. In particular, a transition to zero-emission fleet supports efforts to protect our environment and adopt new technologies that enable our customers to have greener travel options; expand investment in integrated research and development; and, nurture a culture that welcomes and adapts quickly to new ideas, technologies, and ways of working.

69
ACKNOWLEDGEMENTS
The following individual King County staff, consultants, and stakeholders contributed to this report.
Metro Technical Review Panel members Alex Adams, Department of Transportation Director's Office Jonathon Bez, Service Development Andrew Brick, Strategy and Performance Brian Cady, Power and Facilities Katie Chalmers, Service Development Susan Eddy, Human Resources Leo Hrechanyk, Vehicle Maintenance Carrie Lee, Strategy and Performance Stanley Lillquist, Vehicle Maintenance Kim Martin, Vehicle Maintenance Ralph McQuillan, Power and Facilities Pete Melin, Battery Bus Project Manager Christina O'Claire, Strategy and Performance Steve Policar, Vehicle Maintenance Gary Prince, Finance and Budget Lisa Shafer, Strategy and Performance Michael Stanaszek, Design and Construction George Stites, Vehicle Maintenance Michael Thornton, Operations David VanderZee, Service Development
Stakeholder Review Panel members Ben Farrow, Puget Sound Energy Ricardo Gotla, Transportation Choices Coalition Vlad Gutman-Britten, Climate Solutions Tania Tam Park, Puget Sound Clean Air Agency Guilia Pasciuto and Kim Powe, Puget Sound Sage Laurie Rocello Tores, Got Green Dinah Wilson, City of Kent
Metro project team members
Carrie Lee, Sustainability Program Coordinator Peter Melin, Zero-emission Program Manager Gary Prince, Finance and Budget Chris O’Claire, Manager, Strategy and Performance Sarah Driggs, Dept. of Transportation -Communications Jamie Stroble, Dept. of Natural Resources and Parks – Climate Engagement
Consultant project team members
Joe Iacobucci, Sam Schwartz Consulting Ellen Gottschling, Sam Schwartz Consulting Kate Sargent, Sam Schwartz Consulting Paul Arnold, WSP I Parsons Brinckerhoff Auden Kaehler, WSP I Parsons Brinckerhoff