carbon neutral action report€¦ · the cleanbc climate action plan, released in 2018, outlines a...
TRANSCRIPT

2019 Carbon Neutral Action Report

2019 ISLAND HEALTH CARBON NEUTRAL ACTION REPORT 1
CONTENTS
Introductory Note ......................................................................................................................................... 2
1. Overview ................................................................................................................................................... 4
About Island Health .................................................................................................................................. 4
Commitment ............................................................................................................................................. 5
2019 Emissions and Offsets Summary Table ............................................................................................ 6
2. Emission Trends ........................................................................................................................................ 7
2019 Emissions Outlook ............................................................................................................................ 9
3. Carbon Neutral Capital Program ............................................................................................................. 10
4. Emissions Reduction Projects in 2019 .................................................................................................... 12
5. Strategies to Reduce Emissions .............................................................................................................. 13
Existing Buildings..................................................................................................................................... 14
New Construction ................................................................................................................................... 14
Clean Energy ........................................................................................................................................... 15
Fleet ........................................................................................................................................................ 16
Paper ....................................................................................................................................................... 16
6. Out-of-Scope Emissions .......................................................................................................................... 17
Personal Vehicle Business Travel ............................................................................................................ 18
Anesthetic Gas ........................................................................................................................................ 18
7. Climate Adaptation & Resilience ............................................................................................................ 19
Leadership ............................................................................................................................................... 19
Organizational Risk.................................................................................................................................. 19
New Construction ................................................................................................................................... 19
Existing Facilities Assessments and Investigations ................................................................................. 20
Extreme Weather Awareness ................................................................................................................. 20
Community Support ................................................................................................................................ 20
8. Sustainability Initiatives .......................................................................................................................... 21
Appendix A: Climate Change Health Impacts Fact Sheet ........................................................................... 23
Appendix B: Energy Wise Network Success Story ...................................................................................... 25
Appendix C: Emissions Source Report ........................................................................................................ 26

2019 ISLAND HEALTH CARBON NEUTRAL ACTION REPORT 2
INTRODUCTORY NOTE This year marks a decade of Island Health reporting and offsetting greenhouse gas emissions. To achieve
carbon neutrality, carbon offsets are purchased for emissions within the scope of the Carbon Neutral
Government Regulation, which includes buildings, fleet and paper. The Carbon Neutral Action Report
discloses the emissions that require offsetting for 2019, actions taken in 2019 to reduce emissions, and
future plans to mitigate the health authority’s impact on climate change. Island Health is committed to
being a positive contributor to climate change response by adhering to the legislated Climate Change
Accountability Act and following the climate action plan outlined in CleanBC.
As we write this report, British Columbia is facing a public health emergency due to the COVID-19
pandemic. Island Health’s response to the pandemic demonstrates how we live our values through our
courage to innovate, and aspirations to the highest degree of safety. We are confident our actions today
to foster organizational preparedness will increase our responsiveness to future health emergencies,
including those precipitated by a changing climate. Climate change is intensifying extreme weather events
and the spread of vector-borne disease, all with the potential to strain the health system. Island Health is
therefore enhancing climate change resilience, while continuing our efforts to decrease greenhouse gas
emissions.
Despite Island Health’s mitigation efforts over the past ten years, achieving the provincially legislated
emissions reduction targets remains a challenge without sufficient funding. Like most organizations, the
health authority has many priorities competing for the same resources, making it difficult to direct
investment into emission reduction projects, especially in the healthcare setting. In an effort to address
this, the organization has received funding since 2014 through the Province’s Carbon Neutral Capital
Program, which has been integral for decreasing emissions in facilities. However, the amount has been
insufficient to bring emissions down to meet provincial targets. Fortunately, an increase in funding of
more than 300% as of fiscal year 2020/21 will advance Island Health closer to the provincial target.
Island Health is actively working with the Ministry of Health, the Ministry of Environment and Climate
Change Strategy, BC Hydro, FortisBC, other BC health authorities, and federal agencies to secure
partnerships and funding for a greater rate of decarbonization.
New construction projects present a unique opportunity for greenhouse gas reduction, by replacing aging
buildings with more efficient facilities. In existing buildings, Island Health’s Energy Department and
Facilities, Maintenance and Operations teams are reducing emissions through continuous optimization,
retrofit projects and behaviour change initiatives. Buildings are the largest source of the organization’s
greenhouse gas emissions, but there are other sources of in-scope and out-of-scope emissions that are
significant contributors to climate change.
Aligned with the CleanBC strategy, Island Health’s vehicle fleet now has three zero-emission vehicles and
several hybrids, increasing fuel efficiency and providing cleaner air in our communities. We are also
reducing greenhouse gas emissions by using office paper made from sugarcane fibre, which is reported
as having the same emission factor as wood-based paper with 100% recycled content. In addition to these
emissions sources, the health authority is concerned about greenhouse gas from out-of-scope sources
such as anesthetic gas, refrigerants and business travel. We have started tracking these sources so action
can be taken to reduce our overall climate impact, beyond the provincial reporting requirements.

2019 ISLAND HEALTH CARBON NEUTRAL ACTION REPORT 3
In March 2020, Island Health received the annual Energy and Environmental Stewardship Award from the
Canadian College of Health Leaders. This award reflects the dedication of staff, from executive leadership
to frontline workers. Island Health is proud to be recognized as a leader for its commitment to minimizing
our adverse climate and environmental impacts.
James Hanson
Vice President
Operations and Support Services
Island Health

2019 ISLAND HEALTH CARBON NEUTRAL ACTION REPORT 4
1. OVERVIEW This Carbon Neutral Action Report for the period January 1, 2019 to December 31, 2019 summarizes our
emissions profile, the total offsets to reach net-zero emissions, the actions we have taken in 2019 to
reduce our greenhouse gas emissions and our plans to continue reducing emissions in 2020 and beyond.
By June 30, 2020, Island Health’s final 2019 Carbon Neutral Action Report will be posted to our website at
www.islandhealth.ca.
About Island Health
Approximately 22,000 health care professionals, technicians and support staff at Island Health provide
health care to more than 800,000 people on Vancouver Island; the islands in the Salish Sea and Johnstone
Strait; and the mainland communities north of Powell River and south of Rivers Inlet.
Figure 1: Island Health Figures at a Glance
Year after year Island Health expands to serve its growing communities. In 2019, the health authority
experienced a rise in acute beds, buildings and total floor space, displayed by upward arrows in Figure 1.
Since becoming carbon neutral in 2010, the health authority’s total floor space has increased by 23%.
Facilities are generating less emissions per square metre, but total floor space continues to grow. Growth
of the organization is a challenge when trying to reduce emissions to meet the provincial targets.
Offsettable greenhouse gas emissions are 12% below 2010 levels, but need to reach a 50% reduction by
2030.

2019 ISLAND HEALTH CARBON NEUTRAL ACTION REPORT 5
Commitment
The Climate Change Accountability Act sets legislated targets of 40% reduction in carbon emissions from
2007 levels by 2030, 60% reduction by 2040 and 80% reduction by 2050. In 2019, the Act was amended
to allow the provincial government to set additional targets and regulations for public sector buildings,
fleets and fuels. Also introduced in 2019, the Act requires public sector organizations to manage risks
arising from a changing climate and minimize adverse environmental effects.
The CleanBC Climate Action Plan, released in 2018, outlines a pathway towards achieving the provincial
targets. Mandated in CleanBC, greenhouse gas emissions from public sector vehicles will be reduced by
40% from 2010 levels by 2030. Additionally, public buildings will demonstrate leadership with a higher
target of a 50% reduction by the same year. Island Health engages regularly with the Province as new
public sector targets and regulations are developed.
Through Island Health’s 2019/20 – 2021/22 Plan, the Executive Leadership Team reaffirmed its
commitment to being a positive contributor to environmental sustainability and climate change response.
To minimize Island Health’s carbon footprint, the health authority will reduce greenhouse gas emissions
through continuous optimization of building systems, infrastructure renewal projects and the adoption of
zero-emission vehicles.
The health authority continues to construct infrastructure that follows environmental stewardship best
practices. In 2019, the two North Island Hospital campuses achieved Leadership in Energy and
Environmental Design (LEED) Gold certification. Island Health operates two additional LEED Gold facilities,
the Patient Care Centre in Victoria and the Emergency Department at Nanaimo Regional General Hospital,
as well as one LEED Silver facility, the Oceanside Health Centre in Parksville. Future construction projects
will pursue LEED certification, and aspire to the highest standards of health and safety for patients, staff
and visitors.
While Island Health strives to enhance climate change resilience, further action is needed to prepare for
a future of new climate extremes. Island Health has conducted several vulnerability and resilience
assessments, identifying potential risks to critical infrastructure and operations. Initiatives are underway
to ensure new construction, renovations and retrofits are designed using climate change information.
Stakeholders are working across the organization to build Island Health’s resilience. More information
about these initiatives can be found in Section 7. Climate Adaptation & Resilience (page 19).

2019 ISLAND HEALTH CARBON NEUTRAL ACTION REPORT 6
2019 Emissions and Offsets Summary Table
Table 1: Island Health’s Greenhouse Gas Emissions and Offsets for 2019
As per the Directive issued March 31, 2020, each Public Sector Organization will use their 2018 Greenhouse Gas Emissions as a placeholder for the purposes of their 2019 Carbon Neutral Action Report.
Total Emissions (tCO2e) 29,741
Total BioCO21 861
Total Offsets (tCO2e) 28,880
Offset Investment ($25 per tCO2e) $722,000
To reduce its emissions to net-zero, Island Health invests in emissions reduction projects by purchasing
BC-based offsets through the provincial government. The offset payments provide incentives to BC-based
projects that reduce emissions through greenhouse gas removal or avoidance according to provincial
regulations. These projects support British Columbia’s green economy and provide social, environmental
and economic benefits to all British Columbians. The offset projects can be viewed on the BC Carbon
Registry.
Retirement of Offsets
In accordance with the requirements of the Climate Change Accountability Act and Carbon Neutral
Government Regulation, Island Health (the Organization) is responsible for arranging for the retirement
of the offsets obligation reported above for the 2019 calendar year, together with any adjustments
reported for past calendar years (if applicable). The Organization hereby agrees that, in exchange for the
Ministry of Environment and Climate Change Strategy (the Ministry) ensuring that these offsets are retired
on the Organization’s behalf, the Organization will pay within 30 days, the associated invoice to be issued
by the Ministry in an amount equal to $25 per tonne of offsets retired on its behalf plus GST.
1 “Biogenic” portion (BioCO2) of the emissions from biomass, renewable natural gas and biofuels are not required to be offset due to their renewable source.

2019 ISLAND HEALTH CARBON NEUTRAL ACTION REPORT 7
2. EMISSION TRENDS Since 2010, Island Health has been reporting and offsetting greenhouse gas emissions using the Province’s
SMARTTool program. For the 2019 reporting cycle, the Province transitioned to a new Clean Government
Reporting Tool for tracking emissions. However, the reporting process, including the transition to the new
tool and verification of emissions, was impeded by the onset of the COVID-19 pandemic.
Due to the pandemic, the Province directed all public sector organizations (PSOs) to use their 2018
greenhouse gas emissions as a placeholder for the 2019 reporting year. This allows PSOs to meet legislated
requirements, while providing flexibility as the public sector responds to the health emergency.
Consequently, the data presented below reflect this directive with 2018 emissions used as an estimate
for 2019. In the next reporting cycle, adjustments will be made to the 2019 reporting year.
Table 2 provides detailed emissions information for the 2010-2019 period, including carbon offset costs,
emissions per full time equivalent employee and emissions per square metre of floor area. Figure 2 shows
total emissions for offsetting (light blue bar) and exempt emissions (dark blue bar) over the same period,
compared to the 2030 emissions target (green line).
Table 2: Island Health’s Emissions and Offset Data, 2010 to 2019
Year Total Emissions (tCO2e)
Exempt Emissions (tCO2e)
Total Emissions for Offsetting (tCO2e)
Offsets Cost plus GST ($)
Emissions per FTE2 (tCO2e/FTE)
Emissions per square metre (tCO2e/m2)
2010 32,993 61 32,938 822,835 2.90 0.066
2011 35,279 59 35,226 875,250 3.06 0.067
2012 34,470 52 34,423 859,125 2.87 0.066
2013 32,123 54 32,075 841,260 2.67 0.058
2014 31,050 56 30,994 813,068 2.55 0.056
2015 28,957 866 28,091 737,310 2.19 0.051
2016 29,147 866 28,277 743,321 2.12 0.052
2017 31,860 864 30,996 814,590 2.26 0.051
2018 29,738 858 28,880 759,150 2.00 0.047
2019 29,741 861 28,880 759,150 1.90 0.047
2 The full time equivalent (FTE) data, provided by the Ministry of Health to all BC health authorities, was used to ensure consistency in methodology for the healthcare sector’s Carbon Neutral Acton Reports.

2019 ISLAND HEALTH CARBON NEUTRAL ACTION REPORT 8
Figure 2: Change in Island Health Emissions and Offsets, 2010 to 2019
Island Health’s emissions peaked in 2011 when the Patient Care Centre opened in Victoria. Emission levels
steadily decreased between 2011 and 2015. The 2016 emission level was slightly higher (0.5%) than the
2015 level due to a cold winter season and a number of delayed emission reduction projects. Emissions
in 2017 increased by 9% compared to the 2016 level, with the opening of two new North Island Hospital
campuses in Campbell River and Comox Valley. These new facilities increased overall floor area by
approximately 40,000 square metres. Emissions in 2018 decreased 6.7% from 2017.
Overall, Island Health has decreased emissions from the peak level in 2011 despite an increase in total
floor space over the same period. Emissions per full time equivalent have been declining steadily since
2011 until 2017 and stayed well below the peak value. This illustrates how the organization is making
progress in reducing emissions while demand for services increases. Table 3 outlines Island Health’s
emissions by source, with buildings accounting for 95% and the remainder from fleet vehicles and office
paper.
Table 3: Island Health Emissions by Source, 2010 to 2019
Emission Source [tCO2e] 2010 2011 2012 2013 2014 2015 2016 2017 2018 2019
Fleet 922 901 879 892 911 888 897 978 693 693
Office Paper 831 747 717 714 691 706 677 687 724 724
Buildings Owned & Leased 31,240 33,631 32,874 30,517 29,448 27,363 27,573 30,195 28,321 28,324
Total Emissions3 32,993 35,279 34,470 32,123 31,050 28,957 29,147 31,860 29,738 29,741
3 Total emissions include both exempt emissions and total emissions for offsetting.
0
5,000
10,000
15,000
20,000
25,000
30,000
35,000
40,000
2010 2011 2012 2013 2014 2015 2016 2017 2018 2019
GH
G E
mis
sio
ns
(tC
O2e
)
Total Emissions for Offsetting Exempt Emissions 2030 Emission Target (16,497 tCO2e)

2019 ISLAND HEALTH CARBON NEUTRAL ACTION REPORT 9
2019 Emissions Outlook
Though Island Health is required to follow the Provincial directive of reporting 2018 emissions as a proxy
during this reporting cycle, based on estimates it is expected for greenhouse gas emissions in 2019 to
increase by approximately 4%.
One reason for the increase was the rupture of a natural gas pipeline in October 2018 which caused a
shortage of natural gas in BC throughout the subsequent winter, leading to increased prices. To mitigate
the impact of the unusually high prices, the health authority’s larger facilities switched to using backup
fuel oil for three days. While this allowed Island Health to avoid the worst of the spike in gas prices, it
resulted in fuel oil consumption increasing by over 60% from the previous year. Standard fuel oil emits
1.4 times more emissions per unit of energy than natural gas in BC, contributing to an increase in 2019
emissions.
Another reason for the increased emissions was the loss of renewable natural gas (RNG). Island Health
has reduced offsettable emissions since 2015 by purchasing a small amount of RNG, thereby increasing
exempt emissions. However, in August 2019 FortisBC ended the sale of RNG to the health authority
because of supply constraints, resulting in a 35% decline in exempt emissions. Standard natural gas has
since replaced the RNG at Island Health facilities. This event reflects the challenges in securing cleaner
fuels that are both accessible and affordable.
Emissions from fleet vehicles also increased as more distance was travelled in 2019. The organization
expanded the availability of fleet pool vehicles, encouraging staff to use fleet vehicles rather than their
personal vehicles. At the same time, Island Health’s fleet has been moving towards more fuel efficient
vehicles to minimize climate impacts. The vehicle emissions per kilometre have decreased, but total
kilometres travelled have increased, leading to an overall rise in emissions.
The only emission source that experienced a decline in 2019 was paper. Emissions decreased by 5% from
2018 levels as a result of the increased use of an alternative paper with an emission factor equal to 100%
recycled content paper.
To achieve the Province’s public sector target for 2030, offsettable emissions need to drop by a further
45% in the next decade, regardless of increases in service levels. Since 2010, Island Health has not made
sufficient progress towards reaching the provincial targets, despite efforts from Energy Management,
Sustainability and Business Continuity, Facilities, Maintenance and Operations, Fleet Services, and Printing
Services. All health authorities require additional support and resources to reach the 2030 targets and
beyond.

2019 ISLAND HEALTH CARBON NEUTRAL ACTION REPORT 10
3. CARBON NEUTRAL CAPITAL PROGRAM In fiscal year 2014/15, Island Health began accessing funding from the Province’s Carbon Neutral Capital
Program (CNCP) to implement greenhouse gas emission reduction projects. Table 4 summarizes projects
funded by the program. The six-year average cost of reducing emissions through these projects is
$3,182/tCO2e (Total Expenditure divided by Emissions Reduction). This value is being used to predict
future emission reduction from CNCP funding.
Table 4: Summary of CNCP Projects
Fiscal Year
Project Description Total
Expenditure ($)
CNCP Funding
($)
Expected Annual
Savings ($)
Emissions Reduction (tCO2e/yr)
Average Cost of Emissions
Reduction ($) FY2015 Lighting upgrade
Boiler optimization Heating, ventilation & air conditioning (HVAC) zoning
1,366,278 902,818 194,452 507.5 2,692
FY2016 Laundry plant upgrade Boiler plant replacement Domestic hot water decouple Zone isolation and lighting
1,474,278 828,505 172,639 525.2 2,807
FY2017 Heat recovery chiller Exhaust air heat recovery Zone control Domestic hot water decouple
1,354,402 817,953 104,640 654.7 2,069
FY2018 Boiler & heating plant upgrade Heat recovery HVAC upgrade
1,416,875 817,953 62,650 262.3 5,402
FY2019 Electronic zone control OR zone control HVAC zoning and scheduling
1,147,500 821,370 89,453 321.0 3,575
FY2020 Heat recovery system 1,222,320 822,320 47,131 479.7 2,548
Average 1,330,276 835,153 111,828 458.4 3,182
The heat recovery project completed in fiscal year 2020 is the first phase of a three-phased project at the
Royal Jubilee Hospital in Victoria. Due to the complexity and size of the original project, a limited annual
CNCP budget and escalating construction costs, the project was divided into three smaller phases. Each
phase of this project yields increasing energy and greenhouse gas reduction and once they are all
complete, will deliver a total reduction of 886 tCO2e and $162,358 in operating costs each year.
This heat recovery project is intended to harvest the waste heat being rejected from several stand-alone
cooling systems operating year-round to serve areas such as medical imaging, server rooms and
pharmacy, and then re-use that heat to warm the supply air to spaces requiring it. The system also
recovers additional waste heat in the summer for the same purpose since there are areas of the hospital
requiring heating year-round.
The completed first phase included the installation of three modular heat recovery chillers in the
penthouse and an upgraded electrical system to power the chillers. These chillers are engineered to
operate like heat pumps, taking heat from warm water rejected by the central chilled water plant and

2019 ISLAND HEALTH CARBON NEUTRAL ACTION REPORT 11
boosting the temperature to the required building heating loop temperature. The heat is otherwise
rejected to atmosphere through cooling towers.
Phase Two will install three additional heat recovery modules to provide chilled water for server rooms
and pharmacy when the main chiller plant is not operating (during shoulder seasons and winter).
Phase Three will add more load to the system to harvest more heat by extending chilled water piping to
the Medical Imaging department. Both these phases will be completed in fiscal year 2020/21.
An additional benefit to this project is reduced load on the cooling tower. This will free up capacity needed
as summer temperatures rise due to climate change. This is an example of a project which provides
significant energy savings, greenhouse gas emission reduction and climate change adaptation benefits.

2019 ISLAND HEALTH CARBON NEUTRAL ACTION REPORT 12
4. EMISSIONS REDUCTION PROJECTS IN 2019 During fiscal year 2019/20, the heat recovery project at the Royal Jubilee Hospital delivered the greatest
reduction in emissions, contributing to over 65% of the total greenhouse gas (GHG) avoided. Table 5
provides a summary of various projects completed in the fiscal year along with their associated costs,
savings and emissions reduction. The incremental cost per tonne of greenhouse gas avoided and payback
on incremental cost are calculated based on this information.
Table 5: Summary of Emission Reduction Projects in the 2019/20 Fiscal Year
Project Type Total Cost
($) Incremental
Cost ($)
Total Annual Cost Savings ($)
GHG Avoided
(tCO2e/yr)
Incremental Cost per Tonne
of GHG Avoided ($)
Payback on Incremental Cost (yrs)4
Boiler and Heating Plant Upgrades 86,250 49,000 15,998 76.70 639 1
Continuous Optimization 107,280 107,280 31,326 77.65 1,382 3
HVAC Conservation Measures 23,000 23,000 20,306 82.82 278 1
Heat Recovery Projects 1,021,000 909,680 38,918 479.68 1,896 18
2019/2020 Total 1,237,530 1,088,960 106,548 716.85 n/a n/a
In Table 5, the Total Cost is the cost required to implement a project. When a piece of existing equipment
is being replaced, the Incremental Cost is the extra cost required to achieve a higher efficiency from the
equipment being replaced (e.g. mid-efficiency boilers being replaced with high efficiency boilers). When
an energy efficiency project is a new addition to the existing infrastructure (e.g. adding a device to reduce
existing motor use), the Incremental Cost equals the Total Cost of the project.
Incremental Cost per Tonne of GHG Avoided is the Incremental Cost divided by GHG Avoided. This
measure gives a clear indication of the cost of emissions reduction by project type. Heating, ventilation,
and air conditioning (HVAC) upgrades, continuous optimization and heat recovery projects are the most
cost-effective in terms of reducing emissions.
Payback on Incremental Cost is calculated by dividing Incremental Cost by Total Annual Cost Savings, net
of BC Hydro and FortisBC rebates. The exact payback varies for each individual project, with the longest
payback rate for the heat recovery project. Most of these measures have a lifespan of 15 to 20 years, and
generate cost savings regardless of their emissions reduction potential. As Island Health electrifies its
heating requirements and provides cooling through a longer cooling season there will be considerable
need to find energy efficiencies so utility budgets are not exceeded.
4 Note that payback period is net of BC Hydro and FortisBC rebates.

2019 ISLAND HEALTH CARBON NEUTRAL ACTION REPORT 13
5. STRATEGIES TO REDUCE EMISSIONS Most of Island Health’s building-related greenhouse gas emissions are from fossil fuels, primarily natural
gas. In areas where natural gas is available, it is widely used for space and hot water heating, as well as
for laundry and cooking. The future emissions reduction strategy for buildings is centred on improving
existing buildings, ensuring new buildings perform to high standards, and utilizing cleaner energy sources.
The green line in Figure 3 represents the expected emissions reduction resulting from a steady investment
going forward from the Carbon Neutral Capital Program (CNCP). The average cost of reduction is $3,200
per tonne of CO2e, based on previous CNCP projects, and does not include escalation.
Figure 3: Island Health Emissions, Targets and Projections
Achieving the CleanBC emissions reduction target for public sector organizations (PSOs) remains difficult,
as depicted in Figure 3. Island Health’s cost per tonne of CO2e reduction does not account for contingency,
escalation and inflation. The aspirational plan also includes benefits beyond only emissions reduction,
such as higher energy efficiency, climate change adaptation and enhanced occupant wellbeing.
The details of Island Health’s emissions reduction plans are still in development, so this projection and its
assumptions may yet change. Based on the current average cost of reduction and CNCP funding, it is clear
that additional investment is required to decrease the organization’s climate impact. Far more aggressive
and expensive retrofits of existing infrastructure will be necessary to meet the provincial reduction
targets.
5,000
10,000
15,000
20,000
25,000
30,000
35,000
40,000
20
07
20
08
20
09
20
10
20
11
20
12
20
13
20
14
20
15
20
16
20
17
20
18
20
19
20
20
20
21
20
22
20
23
20
24
20
25
20
26
20
27
20
28
20
29
20
30
GH
G E
mis
sio
ns
(tC
O2e
)
Offsettable Emissions Energy Management PSO Target
Multi-Year Aspirational Plan
pro
ject
ed
Note: Beyond 2019, plan assumes higher CNCP funding
($2.84M) and GHG reduction capital cost of $3,200/tCO2e
which is typical of results from recent years, yielding 891
tCO2e reduction/year going forward.
New Cowichan Valley Hospital

2019 ISLAND HEALTH CARBON NEUTRAL ACTION REPORT 14
Existing Buildings
In existing buildings, efforts will continue to focus on minimizing waste and improving efficiency of existing
assets. This will require continued close collaboration between Energy Department staff and Facilities,
Maintenance and Operations. In addition to Carbon Neutral Capital Program projects which will tend to
focus on deeper retrofits, more effort will be made to uncover opportunities requiring relatively small
upfront investment, such as system re-commissioning, continuous optimization including scheduling,
optimized controls and improved maintenance (e.g. coil cleaning, steam trap repair and insulation).
Utilizing future climate projections will also be important when designing replacement ventilation and air
conditioning systems.
New Construction
The practice of setting aggressive targets for new construction projects will continue in order to avoid net
increases in greenhouse gas emissions as Island Health expands. Early work in the business planning stages
of the new hospital for the Cowichan Valley includes energy modeling of various design features in an
effort to reach a design that meets both a ‘net zero energy ready’ and a ‘net zero carbon’ level of
performance. Whether these stretch targets can be achieved within the financial constraints of the project
remains to be determined. In addition, future climate projections are being incorporated into the design
and planning to ensure this new facility is capable of handling extremes in weather anticipated over the
service life of the building. As per Provincial mandates, this new hospital will be targeting LEED Gold
certification.
Despite design features to reduce greenhouse gas emissions, new construction often increases
Island Health’s emissions. While emissions intensity (greenhouse gas emissions per square metre) is
declining, overall floor area is increasing at a higher rate. This is a challenge for the new hospital in the
Cowichan Valley as it is expected to be approximately three times the size of the existing hospital.
Minor Procedures Room at the new North Island Hospital
2019 ISLAND HEALTH CARBON NEUTRAL ACTION REPORT 15
Consequently, new facilities are more efficient than the infrastructure they replace, but can result in net
increases in emissions. Until new construction projects can achieve a ‘net zero carbon’ footprint, they will
continue to increase the organization’s emissions budget.
Clean Energy
Another key strategy for reducing greenhouse gas emissions involves increasing the share of low-carbon
energy sources. Island Health has transitioned towards cleaner energy by electrifying facilities with the
installation of heat recovery systems powered by BC’s clean electricity, using renewable energy systems
such as solar thermal and solar electric panels, as well as by procuring renewable natural gas when
available. The health authority will continue exploring alternatives to fossil fuels including biomass.
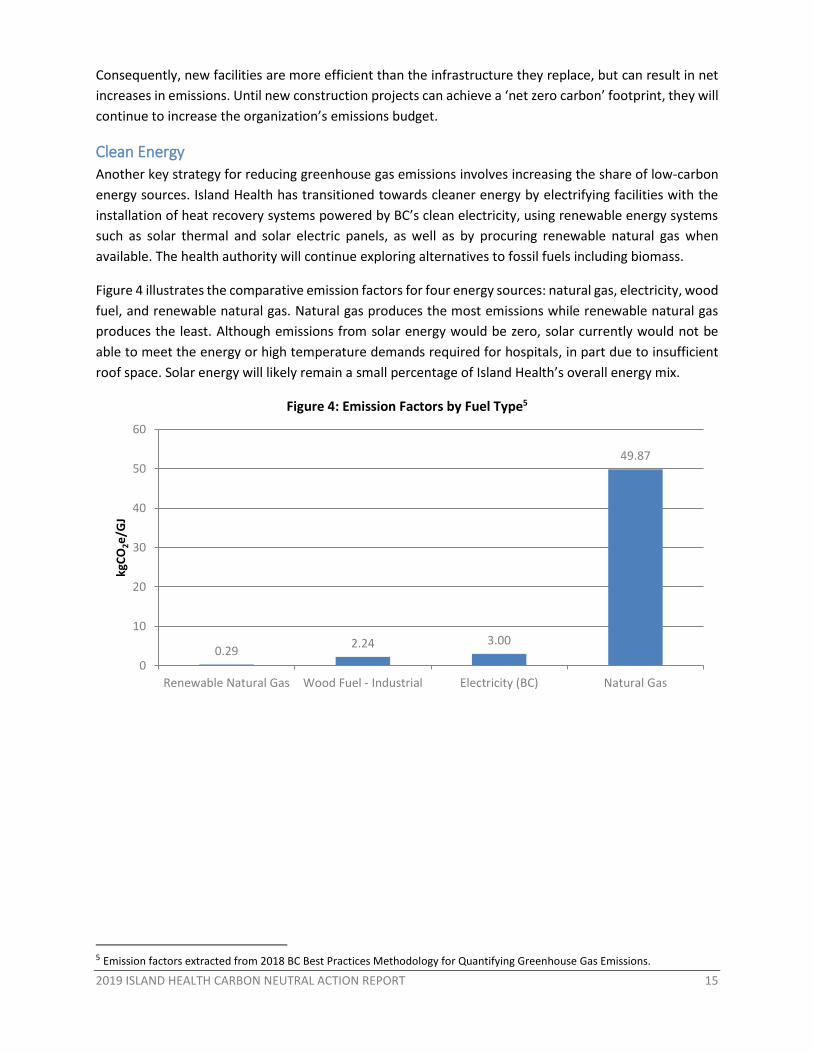
Figure 4 illustrates the comparative emission factors for four energy sources: natural gas, electricity, wood
fuel, and renewable natural gas. Natural gas produces the most emissions while renewable natural gas
produces the least. Although emissions from solar energy would be zero, solar currently would not be
able to meet the energy or high temperature demands required for hospitals, in part due to insufficient
roof space. Solar energy will likely remain a small percentage of Island Health’s overall energy mix.
Figure 4: Emission Factors by Fuel Type5
5 Emission factors extracted from 2018 BC Best Practices Methodology for Quantifying Greenhouse Gas Emissions.
0.292.24 3.00
49.87
0
10
20
30
40
50
60
Renewable Natural Gas Wood Fuel - Industrial Electricity (BC) Natural Gas
kgC
O2e
/GJ

2019 ISLAND HEALTH CARBON NEUTRAL ACTION REPORT 16
Fleet
Island Health is targeting emissions reduction by introducing zero-emission vehicles and improving fuel
efficiency. The health authority is committed to the CleanBC provincial mandate by making 10% of light-
duty vehicle replacements zero-emission vehicles, when suitable.
In 2019, Island Health added a third electric vehicle to its fleet, and installed three charging stations
located at the North Island Hospital Comox Valley and Campbell River campuses, and the Peninsula Health
Unit. Several hybrids are also in the fleet increasing overall fuel efficiency. Additional charging stations for
fleet are planned for installation in 2020.
Funding remains the largest challenge to increasing zero-emission vehicles in the organization’s fleet.
Despite federal and provincial rebates, electric vehicles are more expensive to purchase and require costly
charging infrastructure. There are further challenges associated with installing charging infrastructure in
older facilities lacking electrical capacity, as well as in leased buildings. Approximately half of total fleet
emissions are from heavy duty trucks, for which there are currently no suitable zero-emission alternatives
available.
While the organization aims to achieve the CleanBC 10% replacement target year after year, this will not
be enough to reach the Province’s 2030 target of a 40% reduction in public sector fleet emissions from
2010 levels. Regardless, Island Health’s Fleet Services continues to review optimal locations for new zero-
emission vehicles and charging stations. As more fleet pool vehicles become available across the Island,
the health authority is striving to increase overall fuel efficiency and reduce emissions.
Paper
In 2019, Island Health began using paper made from sugarcane fibre as its standard 8½ x 11 office sheet.
This paper is produced from the residue waste of sugar production, and its greenhouse gas emission factor
is considered to be the same as 100% recycled wood fibre based paper. Paper made from 100% recycled
fibre has 37% lower emissions than paper made from virgin wood fibre. The organization is also exploring
options to utilize this paper source for 8½ x 14 and 11 x 17 sizes.
Zero-Emission Fleet Vehicles at Island Health

2019 ISLAND HEALTH CARBON NEUTRAL ACTION REPORT 17
Organic Waste
Refrigerants
Anesthetic Gas
Personal Vehicle Business Travel
OUT-OF-SCOPE
IN-SCOPE
Owned Buildings
Office Paper
Fleet Vehicles
Leased Buildings
Backup Fuels
Further opportunities for emissions reduction involve using less paper through digitalization and changing
behaviour. For example, in 2019 the organization adopted new software for online ECG results saving
about 600,000 sheets of paper per year. Additionally, Information Management/Information Technology
(IM/IT) supports behaviour change through an ongoing Print-LESS campaign with simple actions for
employees.
6. OUT-OF-SCOPE EMISSIONS Island Health’s climate impact extends beyond only buildings, fleet vehicles and office paper.
Consequently, the organization is reducing greenhouse gas emissions from out-of-scope sources, such as
personal vehicle business travel, anesthetic gas and organic waste. Out-of-scope emissions sources are
not included in the Carbon Neutral Government Regulation, and are thus not formally reported. Carbon
offsets are not required for out-of-scope emissions, but they still emit harmful greenhouse gas and further
exacerbate climate change.
Figure 5 displays the various sources of greenhouse gas emissions at Island Health. In-scope sources are
coloured blue and out-of-scope sources or coloured red.
Figure 5: Island Health’s Extended Climate Impact
Illustrated in Figure 5, emissions from anesthetic gas and business travel in personal vehicles are
estimated to be larger than the in-scope sources of office paper and fleet. Organic waste and refrigerants
are shown in white because these emissions quantities are currently unknown. To decrease emissions

2019 ISLAND HEALTH CARBON NEUTRAL ACTION REPORT 18
from organic waste, several hospital kitchens ensure food waste is composted. Collecting refrigerant data
is challenging, but Island Health is taking measures to enhance monitoring.
Personal Vehicle Business Travel
Island Health covers a large geographic area, requiring substantial business travel. When staff use their
personal vehicle for travel, the emissions are not included in the organization’s total reported greenhouse
gas impact. Distance travelled in personal vehicles accounts for more than five times the distance travelled
in fleet vehicles. 54% of personal vehicle travel is attributed to home and community care health workers
who travel regularly to support their clients. As home support services expand, emissions from vehicle
travel will also increase unless zero-emission fleet vehicles can be provided at scale.
Island Health has taken steps to offer more pool vehicles at sites across the Island, for staff to use in place
of their personal vehicle. This initiative provides greener vehicle options and reduces costs. Expanding
access to pool fleet vehicles will raise reported in-scope fleet emissions, but is expected to offset less-
efficient personal vehicle travel. With several zero-emission vehicles and hybrids, Island Health’s fleet is
aiming to be more efficient than the average passenger vehicle.
Anesthetic Gas
At Island Health, estimated greenhouse gas emissions from anesthetic gas are higher than some in-scope
sources. Island Health primarily uses two types of anesthetic gas, one of which has a significantly higher
global warming potential.
Over the past five years, Island Health’s usage of the anesthetic gas with higher global warming potential
declined, in favour of the lower-emitting gas. Anesthesia workstations are also installed, which reduce
overall gas usage at the source. Since 2013 emissions have declined by approximately 57%, as indicated
in Figure 6. Island Health’s actions to reduce wasted anesthetic gas and associated emissions contribute
to climate change mitigation.
Figure 6: Island Health’s Emissions from Anesthetic Gas Use6
6 Emissions are estimated using factors from Sulbaek Andersen et al, 2012
0
500
1000
1500
2000
2500
2013 2014 2015 2016 2017 2018 2019
Emis
sio
ns
(tC
O2e
)
Increased use of low-emitting gas
Installation of anesthesia workstations

2019 ISLAND HEALTH CARBON NEUTRAL ACTION REPORT 19
7. CLIMATE ADAPTATION & RESILIENCE Climate change continues to present risks for healthcare operations and infrastructure, and also to the
health of our communities. While Island Health strives to minimize its climate impact, the health authority
recognizes that building resilience within facilities is critical for maintaining health services as the climate
changes. In 2019, the organization advanced resiliency by providing leadership, assessing risk, increasing
climate change awareness, and incorporating climate change information into facility design.
Leadership
The health authority included climate change adaptation in Island Health’s 2019/20 – 2021/22 Plan by
identifying the need to enhance climate change resilience for the organization, as well as for the
population served.
Organizational Risk
Island Health follows the British Columbia government’s Risk Management Framework which applies to
all types and categories of risk within the organization, from frontline or operational to enterprise level
risks. Each year, the Board of Directors and Executive Leadership Team produce a summary of top risks
facing the organization. In 2019, lack of resilience to the changing climate was identified as a top risk. As
climate change is an unfolding event over a long period of time there will be many controls required to
reduce impacts. The main control identified at this time involves targeting new construction so all facilities
are developed to withstand climate extremes over their life span.
New Construction
New construction and renovations provide an excellent opportunity to incorporate climate change
information into design. Currently, facilities are designed based on historical weather data, but this is not
representative of the climate the new facility will operate in. This has led to the development of
requirements for consulting engineers and architects to use future climate data to inform the design of
building systems. Island Health is also contributing to a provincial health authority initiative for
establishing Resilience Guidelines for Health Facility Design and Operations. Furthermore, an initial
climate change workshop was provided to the project team working on the Cowichan District Hospital
redevelopment, and work will continue through the project to ensure adaptive measures are included.
Climate Change Impacts Workshop at Island Health

2019 ISLAND HEALTH CARBON NEUTRAL ACTION REPORT 20
Existing Facilities Assessments and Investigations
Existing facilities remain the largest floor area within Island Health’s building stock. The age of the facilities
increases the likelihood for poor resilience to a changing climate. To understand the impacts to the
facilities, there are a variety of assessment tools and methods available. Adapting to the future climate is
a new risk to consider with unique challenges, as many organizations work towards enhanced resilience.
For Island Health, the methodology needs to be effective from both a cost point of view and a practicality
point of view. Since 2017, the health authority assessed three facilities using three different tools. The
tool used in 2019 was Public Safety Canada’s Regional Resilience Assessment Program, which reviews the
resiliency of critical infrastructure at the time of assessment, without considering future changes in
climate. This information is useful for understanding the current resiliency of facilities and identifying
vulnerabilities. All the tools assessed at this time require significant input in terms of time and costs.
Facilities were also assessed through the 2019 Facilities, Maintenance and Operations (FMO) Extreme
Weather Survey. FMO identified water shortage as having potentially catastrophic consequences, though
with a lower likelihood of occurring. The most anticipated extreme climate events to impact FMO-
managed facilities are extreme heat, followed by wildfire.
FMO participated in a study with the National Research Council of Canada to determine if air filtration
performance could be enhanced. It was hoped that the tested system would reduce complaints from
wildfire smoke and other sources of odour. The study was conducted during the summer of 2019 when
there was very little wildfire smoke. However, the study determined the system provided a 23%
improvement in filter efficiency for removing PM2.5 (a component of wood smoke that is harmful to lungs)
compared to the reference air handling system.
Extreme Weather Awareness
Health Emergency Management BC (HEMBC) initiated a system for tracking Environment Canada’s
weather warnings and issuing internal notifications depending on the type and severity of the warning.
Community Support
In 2019, Island Health provided heat advisories on public facing communications and published a new
heat safety web page. The Environmental Health Office’s Regional Built Environment Team developed a
climate change health impacts fact sheet for municipalities to increase awareness of the need to
incorporate future climate planning in community development (shown in Appendix A). Island Health also
supports municipalities and regional districts as they develop climate resiliency plans, to ensure health
impacts, along with facility dependencies, are considered.
Future climate resilience tasks:
Continue participation in the development of the Resilience Guidelines for Health Facility Design and
Operations
Conduct an extreme weather events survey to gather data from clinicians
Establish climate resilience guidelines and an exposure screening tool for internal projects
Develop emergency water measures at Nanaimo Regional General Hospital
Conduct overheating research with the National Research Council of Canada and evaluate adaptation
strategies in response to extreme heat and vulnerable populations
2019 ISLAND HEALTH CARBON NEUTRAL ACTION REPORT 21
8. SUSTAINABILITY INITIATIVES Many departments at Island Health are actively taking measures to achieve greater efficiency and reduce
pollution and consumption of resources. Below are highlights of these activities in 2019.
Water Conservation Island Health reviews water costs and consumption at all major owned sites through an online utility
monitoring platform. Facilities with higher consumption and water rates are prioritized for further
analysis. This analysis informs future opportunities for identifying water conservation measures. The
Energy Department also incorporates a water performance review into quarterly meetings with Facilities,
Maintenance and Operations. In addition to water monitoring, all new buildings are constructed with high
water efficiency goals through LEED certification, including the new North Island Hospital campuses which
have the lowest water usage per square metre.
A notable project completed this year was the removal of a water filtration system at the Lady Minto
Hospital on Salt Spring Island. This was made possible because of improvements in the quality of the local
water supply and the installation of an on-site copper-silver ionization treatment system. The removed
filtration system consumed over 1,000 m3 of water annually as part of its cleaning process through
multiple back-wash cycles every hour. That was roughly 12% of the site’s overall water consumption.
Behaviour Change In 2019, Island Health continued its participation in the BC Energy Wise Network to access funding and
coaching for behaviour change campaigns. This year’s campaign aimed to establish a formalized process
for Facilities, Maintenance and Operations staff to review the organization’s energy management
information system (EMIS) daily. EMIS displays real-time energy data so building operators can
immediately identify energy use anomalies and then take steps to resolve them. Appendix B contains
additional information about the campaign.
Waste Reduction
Island Health is advancing sustainability best practices by reducing waste and moving towards a greener
supply chain. In 2019, Provincial Health Services Authority (PHSA) Supply Chain introduced new
environmental fields to the province-wide Product Investigation Portal. Through the Portal, health
authority staff can submit product concerns related to excess packaging, recyclability and other
environmental issues. These concerns are shared with manufacturers and vendors to identify potential
product changes and minimize environmental impacts.
Island Health staff are also leading initiatives to reduce the amount of waste generated in their work areas.
For example, a nurse at Nanaimo Regional General Hospital led a pilot project to avoid unnecessary plastic
water cups at the patients’ bedside. With input from Infection Control practitioners, a 16-bed unit
changed practices to refill one plastic cup every 24 hours per patient, instead of regularly providing a new
cup. Through this simple action, the unit can avoid using approximately 6,200 cups annually. Healthcare
workers are demonstrating persistence and creativity to find waste reduction solutions. Adjusting
procedures, product design, or packaging requirements are recommended strategies to reduce waste and
decrease Island Health’s environmental footprint.

2019 ISLAND HEALTH CARBON NEUTRAL ACTION REPORT 22
Transportation Demand Management
Parking Services promotes initiatives for decreasing single-occupancy vehicle traffic and demand for
parking at Island Health sites. Through transportation demand management planning, Parking Services
supports employees in optimizing their use of local transportation resources and Island Health programs.
By getting people out of single-occupancy vehicles and into more efficient modes of commuting, the
health authority reduces parking congestion and its climate impact. Initiatives to support transportation
demand management include participation in the annual Bike to Work Week, offering employees
subsidized BC Transit ProPass enrollment, and providing an inter-site shuttle between two major hospitals
in Victoria. In fiscal year 2019/20, shuttle participation increased by 15% and employees’ ProPass
enrollment increased by about 8%, as displayed in Figure 7.
0
100
200
300
400
500
600
Figure 7: Island Health's BC Transit ProPass Participation
Central Island Participants South Island Participants Total Participants

2019 ISLAND HEALTH CARBON NEUTRAL ACTION REPORT 23
APPENDIX A: CLIMATE CHANGE HEALTH IMPACTS FACT SHEET

2019 ISLAND HEALTH CARBON NEUTRAL ACTION REPORT 24

2019 ISLAND HEALTH CARBON NEUTRAL ACTION REPORT 25
APPENDIX B: ENERGY WISE NETWORK SUCCESS STORY

2019 ISLAND HEALTH CARBON NEUTRAL ACTION REPORT 26
APPENDIX C: EMISSIONS SOURCE REPORT
6932.3%
28,32495.2%
7242.4%
Mobile Fuel Combustion (Fleet and other mobile equipment)
Stationary Fuel Combustion (Building Heating and Generators) and Electricity
Supplies (Paper)
*As per the Directive issued March 31, 2020, each PSO will use their 2018 GHG Emissions as a placeholder for the purposes of their 2019 CNAR.
**Tonnes of carbon dioxide equivalent (tCO2e) is a standard unit of measure in which all types of greenhouse gasesare expressed based on their global warming potential relative to carbon dioxide.
*** Under the Carbon Neutral Government Regulation of the Greenhouse Gas Reduction Targets Act, all emissions
from the sources listed above must be reported. As outlined in the regulation, some emissions do not require offsets.
Total Emissions: 29,741
Vancouver Island Health AuthorityGreenhouse Gas Emissions by Sourcefor the 2019 Calendar Year* (tCO2e**)
Offsets Applied to Become Carbon Neutral in 2019 Total offsets required: 28,880. Total offset investment: $722,000. Emissions which do not require offsets: 861