achieving optimal carbon savings from the uk’s existing...
TRANSCRIPT

�
Achieving optimal carbon savings from the UK’s existing housing stock
Report written by: Centre for Sustainable Energy, Association for the Conservation of Energy & Dr Richard Moore for WWF-UK.

�
contentsExecutive summary
1.1 Home energy use
1.2 What must be achieved?
1.3 Why has this study used a cut of 80%,
not 60%, by 2050?
1.4 What must policy-makers do to implement
this?
1.5 What has been explored?
1.6 How (and why) this report uses conservative
assumptions
1.7 How low can residential emissions go?
1.8 What are the benefits?
1.9 What are the implications for the
sustainable energy sector in the UK?
1.10 How have the improvements been
modelled?
2. Background
3. How low do we need to go?
4. How low scenarios – selection and limiting
criteria
4.1 Limiting criteria
5. The Scenarios outlined
5.1 What Is deemed cost-effective by 2020?
5.2 What is technically feasible by 2050?
6 Carbon emissions reductions not predicted by
the How Low? model
6.1 New build between now and 2016
6.2 Decarbonised electricity
6.3 Green gas (for heat)
6.4 Behavioural change and improved
efficiency of appliances
6.5 In summary
7 Analysis of cost-effectiveness
8 How low do we go?
8.1 Cost-effective measures – market and
economic potential
8.2 All measures – technical and theoretical
potential
9 How much to go how low?
9.1 England
9.2 UK
9.3 Economic Benefit in England
10 How to go low?
10.1 What increase in installation rates is
required to 2020?
10.2 What installations may be possible under
planned support mechanisms?
10.3 What employment would be generated in
england?
10.4 Other measures
11 Policy gap analysis
11.1 Existing mechanisms
11.2 Potential mechanisms
11.3 Deployment strategy – key supporting
mechanisms
11.4 Overview
Bibliography
12 Annex I – Model criteria
12.1 Overriding scenario criteria
12.2 General criteria
12.3 Specific criteria for insulation measures
12.4 Specific criteria for heating measures
12.5 Specific criteria for electricity generation
measures
12.6 Criteria for GVA assumed
13 Annex II – Packages of measures
by scenario
14 Annex III – Current installation rates and
economic statistics for key measures,
England
15 Annex IV – Summary of modelled savings for
devolved nations
16 Annex V – Imputation methodology
16.1 Imputations for devolved nations
– Scotland and Wales
16.2 Northern Ireland
17 Annex VI – Conservative assumptions
17.1 Discount rates and cost of carbon
17.2 Areas of Outstanding Natural Beauty
17.3 Green gas percentage
17.4 Decarbonisation of electricity
17.5 Measures costs
– mass marketing LZC technologies
17.6 Fuel prices
17.7 Measures lifetimes – 15 years
3
3
3
3
4
5
6
7
7
8
8
10
10
11
11
12
12
12
13
13
13
14
14
15
16
18
18
18
20
20
22
23
24
24
24
26
26
29
29
31
32
34
36
37
37
37
37
38
38
38
39
41
42
43
43
44
46
46
46
46
47
47
47
47

�
�Space heating
Hot Water
Appliances
Lighting
Cooking
53%
19%
16%
7%5%
�.� Home energy useOver 27% of the UK’s carbon dioxide (CO2)
emissions come from the residential sector.
Many of the measures which will enable us to
make the necessary deep and significant cuts in
these emissions also improve the quality of our
homes and will reduce energy bills. It is clearly vital
to tackle this area appropriately, and as a matter
of urgency.
�.� What must be achieved?The government’s National Energy Efficiency Action
Plan (NEEAP2) sets a target to reduce emissions
from the UK’s residential housing stock by 31%
on 1990 levels by 2020. Further, the government’s
own Climate Change Bill contains a legally binding
economy-wide target to reduce CO2 emissions by
at least 60% on 1990 levels by 2050.
We need a wholesale revision of the rate and
efficacy with which the environmental impacts
of the UK’s housing stock are tackled. The
government’s current housing policies are overly
fragmented and will not deliver the cuts in CO2
emissions necessary to achieve its own targets3.
This was acknowledged by Prime Minister Gordon
Brown in the 2007 Budget statement which
announced that the government would ensure
that by 2020 all homes would meet their cost-
effective energy efficiency potential. However this
definition of ‘cost- effective’ looks only at short
term payback and does not factor in any value for
the cost of carbon.
�.� Why has this study used a cut of 80%, not 60%, by �050?This study had used the most up-to-date 80%
target for a reduction in emissions from the UK
residential sector.
The overwhelming scientific consensus is that the
Climate Change Bill’s 60% target is inadequate
to avert the worst ravages of climate change. It
is essential that atmospheric greenhouse gas
concentrations are stabilised at a maximum of
450 parts per million (ppm)4 of CO2 equivalent
to avoid irreversible and extremely damaging
climatic changes. This would require all developed
countries to cut emissions by at least 80% from
1990 levels by 20505.
Executive summary
27% of the UK’s carbon
dioxide emissions come
from the residential
sector.
1 UK Energy Efficiency Action Plan – Defra, 2007 2 (Defra 2007a); Defra’s NEEAP covers energy efficiency measures, renewables and carbon emissions 3 Those targets under the National Energy Action Plan (NEEAP) or the residential sector portion of the Climate Change Bill targets. 4 International symposium of the stabilisation of greenhouse gas concentrations, Hadley Centre, 2005 5 See, for example, Höhne, Phylipsen and Moltmann (2007)
�
Figure 1: Source of these emissions by
end use1
If everyone in the world were to consume natural resources and generate carbon dioxide (CO2) at the rate we do in the UK, we would need three planets to support us. WWF has a vision for a One Planet Future – a world where everyone lives in harmony with nature and thrives within their fair share of the Earth’s natural resources. It is a vision that requires a transformation in the way we live.
ONE PLANET FUTURE

�
�.� What must policy-makers do to implement this?The study has shown that urgent government
action is needed to ensure the UK meets its
targets for residential carbon emissions, and to
ensure it is on track for 80% cuts in the sector by
2050. The study examines the measures, market
transformation and behavioural changes needed to
achieve these targets. In short:
• In order to achieve the UK’s 2020 targets we
will need to go beyond the short payback
energy efficiency measures that feature
in current policies. We will need to deploy
significant numbers of low and zero carbon
technologies (LZC) and solid wall insulation.
• The government must act now to ensure that
the 80% reduction is achieved. This requires a
strong set of supporting policies and financing
mechanisms that support the deployment of
sustainable energy measures.
This set of policy measures should include:
1.4.1 Fiscal incentives It is vital that the government employs a suite
of economic instruments to encourage the
development of more energy efficient homes
(and sustainable homes more widely). The poor
rate of take-up of many short payback measures
highlights the lack of public understanding of, and
buy-in to, their necessity. The palette of financial
measures should include, but not be limited
to: a stamp duty rebate on energy efficiency
improvements made within a year of moving into
a property; a national Council Tax rebate scheme;
and cutting VAT on the refurbishment of existing
properties.
1.4.2 Low interest loan schemeIn Germany, borrowers are able to take out
low interest loans for measures that help older
properties reach new-build standards through
refurbishment. On reaching this standard, the
government repays 10% of the loan to the
householder. This government-supported retrofit
programme has been extremely successful. The
UK government must explore how to indroduce
such innovative financing mechanisms that
support the refurbishment of existing buildings.
In order to achieve
the UK’s 2020 targets
we will need to go
far beyond the short
payback energy
efficiency measures
that feature in current
policies
�
© J
ohn
Bird
sall
/ W
WF-
UK

5
1.4.3 Supplier Obligation, post-2011The government is currently consulting on the
Supplier Obligation, namely if it should be an
upstream trading mechanism, a downstream
measures-based approach or a hybrid6. The
government must ensure that the Supplier
Obligation takes into account the shadow price
of carbon which would ensure all policy decisions
take due consideration of their environmental
impacts. It must also support the deployment of
both solid wall insulation and LZC technologies,
which are not provided for under the current
mechanisms, in significant numbers.
1.1.4 Minimum standards at point of sale, 2010 to 2016The government should ensure that a minimum
standard is set and progressively tightened to
transform the housing sector, by preventing the
resale (or letting) of the most energy-inefficient
homes. For example, with appropriate exemptions,
by 2016 no property with an Energy Performance
Certificate rating of E could be resold, a target
that can be achieved with the most cost-effective
measures for the majority of properties.
1.4.5 Reform the energy marketFeed-in tariffs are a recognised method of
encouraging the installation of electricity from
micro-generation in countries such as Germany
and Spain. They ensure that the householder can
get a fixed and substantial price for electricity
they generate and feed in to the National Grid.
The government should ensure that the public are
guaranteed that this price reflects the true cost of
installing the equipment.
1.4.6 Evaluate personal carbon trading (PCT) or carbon taxes, 2013 to 2015 onwards UK residential emissions have not decreased
since 1990. Our relationship with energy use and
personal understanding of carbon emissions needs
to evolve if we are to meet our 2020 and 2050
targets. The government must open the debate to
include a wide range of potential policy measures,
including personal carbon trading and carbon
taxes. It must ensure that the social implications
of both trading and taxation approaches are fully
understood – i.e. who stands to lose and gain.
However, there are significant barriers to
introducing PCT, and it could not be onstream for
several years. As it is imperative to act now, any
debate on these mechanisms must be in parallel
with the other recommended actions. Particularly
important is to consider how PCT might interact
with other measures so as to understand the most
effective way forward. For example, emissions
can’t be capped upstream and downstream
simultaneously, it is therefore important that any
overlap between the supplier obligation and PCT is
planned carefully.
�.5 What has been explored?The project team has considered what the “cost-
effective” savings from the UK residential sector
are. The carbon savings have been modelled for
the implementation of two cost-effective scenarios
to 2020. These scenarios are:
• 1a the market potential, as defined by the
government’s limited definition of cost-effective7;
and
• 1b the economic potential, as defined by any
measures that recoup their upfront costs by
future bill savings over their lifespan8.
The latter approach, which is the report team’s
recommended and pragmatic approach,
significantly increases the number of measures
deemed cost-effective, resulting in more measures
being applied and increased carbon and financial
savings.
The project team has not included a cost of
carbon in either of these models as this will be
released as an associated piece of work. However
it is noted that even using a relatively low cost of
carbon will significantly increase the number of
measures considered ‘cost effective.’ This is just
one of the ways in which the project team has
been deliberately cautious in its assumptions.
We need to deploy
significant numbers of
low and zero carbon
technologies (LZC) and
solid wall insulation.
6 In a hybrid system, emissions would be capped and tradable among suppliers, with a seperate measures-based social obligation for low income households. 7 This was defined solely as including: cavity wall, loft and hot water cylinder insulation, draught proofing, efficient boilers and heating controls. 8 The Treasury’s own discount rate of 3.5% was used to determine this.

6
The 2050 scenarios, 2a and 2b, have examined
what can be achieved if all available measures
are applied to the residential sector, regardless
of whether they achieve net financial payback.
Considering the scale of the challenge, it is likely
that almost everything possible will be needed to
achieve 80% cuts. Scenario 2b includes stronger
assumptions about the additional reduction in
carbon emissions achievable from things other
than measures applied to the property itself. These
include a greater decarbonisation of the energy
supply and more efficient appliances.
�.6 How (and why) this report uses conservative assumptionsThe study has made a number of conservative
assumptions about the technologies that have
been applied and the magnitude of savings
generated. This approach should reassure readers
that the savings we present are achievable with
concerted government action. Furthermore, the
costs of the measures required and the magnitude
of the savings generated represent the pessimistic
scenario. The measures associated with scenarios
2a and 2b more than pay for themselves if
projected system costs are used and the full
payback is included – i.e. Gross Value Added
(GVA)9, lifetime fuel savings and value of carbon.
The following is a short description of the main
conservative assumptions made in this report. See
Annex VI for more detail.
1.6.1 Discount rates and cost of carbonScenario 1b represents a cost-effective scenario
based upon a Treasury (real) 3.5% discount rate
for the savings achieved. The study could have
alternatively looked at those measures deemed
cost-effective when the cost of carbon has been
added. This definition of cost-effective would be
even more holistic than that used for scenario
1b, and even more measures would have been
available.
1.6.2 Areas of Outstanding Natural BeautyThe How low? study has assumed that solar
power systems and internal/external wall insulation
will not be applied systematically to listed buildings
or to homes in conservation areas.
1.6.3 Green gas percentageThe study has considered methods of future
decarbonisation of energy supply. The report team
has made a conservative assumption of a total
residential green gas supply of 10% by 2050.
1.6.4 Decarbonisation of electricity The report team has linearly extrapolated the
projected carbon intensity of delivered electricity
(2008-20) to estimate a 2050 carbon factor of
0.059kgC/kWh. The recent IPPR, RSPB and
WWF10 study – 80% Challenge – to identify
whether it would be possible to reduce the UK’s
carbon emissions by 80% of 1990 levels by
2050 identified decarbonised electricity as a key
measure – i.e. a carbon factor of 0.005kgC/kWh.
This study has not assumed as high a level of
decarbonisation as the 80% Challenge report,
which serves to highlight that there is room to
manoeuvre and go beyond an 80% cut in the
residential sector.
1.6.5 Measures costs – mass marketing LZC technologies The report team has used a cost based on today’s
prices for insulation and LZC technologies, which
are likely to fall significantly between now and
2050. The Renewables Advisory Board examined
the projected cost of LZC technologies from
2007 to 2025. If the cost reductions predicted are
applied to scenario 2, to 2050, costs fall by £36
billion which would mean that they achieve a net
positive economic position.
1.6.6 Fuel pricesThis represents a conservative estimate of the
actual savings achieved, as the fuel prices are
based on 2007 averages. Whereas DTI baseline
projections for fuel prices by 2020 demonstrate an
average price rise of 21%.
1.6.7 Measures lifetimes – 15 yearsThe study has assumed a 15-year lifetime for all
measures. This is a conservative estimate based
on the shortest lifetime among the measures
applied. The insulation measures and solar power
systems typically have a 20-30 year lifetime. If a
20-year lifetime were applied, the lifetime savings
would increase by 33%.
9 Gross Value Added represents value to the UK economy or money in the pockets of British workers and businesses. 10 www.wwf.org.uk/filelibrary/pdf/80percent_report.pdf

��
�.� How low can residential emissions go?The government’s definition of cost-effectiveness,
is overly restrictive and as a result only achieves
emissions reductions of 22% from 1990 levels. As
shown in Scenario 1a, this falls short of both the
National Energy Efficiency Action Plan (NEEAP)
and Climate Change Bill targets (apportioned to a
household sectoral target for these purposes). This
demonstrates that a more holistic view of cost-
effectiveness must be considered if we are to meet
our 2020 residential carbon emission targets.
Our alternative definition of cost-effective
– scenario 1b – could reduce UK residential
emissions by a further 7%, which exceeds both
the Climate Change Bill targets and those for
2020 from the NEEAP. The scenario requires
the deployment of significant numbers of solid
wall insulation and low and zero carbon (LZC)
technologies, for which adequate provision
is not made under current implementation or
funding policies. Implementing these measures
by 2020 will require the government to support
a step change in the capacity to install them. For
example, implementing scenario 1b would require
in the region of 125,000 solar water heating
systems to be installed each year, a tenfold
increase on current activity.
Concurrently, the government will need to
implement the above range of supporting fiscal
and behavioural change policies to educate and
provide incentives for householders to take action.
Householders need to have a better understanding
of their own energy use and carbon emissions and
a vested interest in taking those measures.
It is noted again that scenario 1b does not include
a cost of carbon which would make even more
measures cost effective by 2020.
The 80% reduction in residential emissions by
2050 is achievable under scenario 2b. This
requires: the implementation of the sustainable
energy improvements to homes described in 1b;
an uplift in the energy efficiency of household
appliances; a reduction in the carbon content in
electricity through improved generating efficiencies
and increased large scale renewable energy
generation; the use of green gas from waste or
other organic matter; and a 20% improvement in
people’s behaviour to further reduce home energy
use. In order to implement scenario 2b by 2050,
we will need to first implement scenario 1b. Given
the urgency of the issue, we suggest that the
government implements a strong set of policies
now to facilitate this by 2020.
�.8 What are the benefits?Table 2 summarises the carbon savings associated
with all the measures applied to individual
properties, their cost and overall economic benefit.
The savings are conservative as they do not
include those associated with improved appliance
efficiency, behavioural changes and upstream
changes to the energy mix of fuels. Scenario 1a
would generate over £3 of fuel savings for every
£1 spent on home improvements. The total
economic benefit if scenario 1b was implemented
by 2020 also outweighs the projected cost. These
measures will also provide considerable benefit to
Government targets
Market potential (Scenario 1a)
Economic potential (Scenario 1b)
Technical potential (Scenario 2a)
Theoretical potential (Scenario 2b)
NEEAP Climate Change Bill
29.3
33.1
27.7
8.5*
11.9
8.5
Year2020(MtC)
2050(MtC)
31%
22%
35%
60%
72%
80%
% re
duct
ion
% re
duct
ion
Table 1: Summary of emissions reductions for all scenarios
Table 2: Summary of measures costs, savings and benefits under
the home improvement model
* All figures in billions
** This table only considers savings and costs under the model, without considering the wider
improvements around decarbonisation of energy supply, appliance efficiency and behaviour
change. Therefore scenarios 2a and 2b are the same.
Savings calculated by the model (MtC)
Total costs* Total economic benefit lower Total economic benefit upper Net benefit (lower)
Net benefit (upper)
6.2
£23.1
£80.9
£84.3
£57.8
£61.2
9.5
£92.5
£108.3
£113.6
£15.9
£21.1
11.2
£156.0
£111.8
£118.0
-£44.2
-£38.0
Scenario 1a (2020)
Scenario 1b (2020)
Scenario 2a & b**(2050)
*Although the Climate Change Bill does not contain sectoral targets, this has been apportioned to
the residential sector.

8
the 3.5 million fuel-poor households in the UK11,
thus helping the UK government to achieve its
statutory target to eradicate fuel poverty where
practicably possible in all homes by 2016.
For scenarios 2a and 2b, implemented to 2050,
the total benefit is less than the investment cost,
but this takes the very conservative position that
LZC technologies will not fall in price. However,
if the predicted cost of LZC technologies falls,
in line with the Renewables Advisory Board
(RAB) projections the economic benefit therefore
matches the investment made even without
ascribing a cost of carbon. The cost of £2.6-£3.5
billion per year required to deliver the residential
sector measures in scenario 2b is minimal
compared to the cost of doing nothing. The Stern
Review12 estimated the cost to the economy of
mitigating the harmful impacts of climate change
to be 10 times that of acting now.
�.9 What are the implications for the sustainable energy sector in the UK?The study has concentrated on the capacity to
deliver sustainable energy measures to homes
between 2007 and 2020, as the government’s
support mechanism and intentions beyond this
date are entirely unknown. In order to achieve our
UK 2020 NEEAP targets we will need to implement
scenario 1b.
Current installation rates fall short of the required
rates for all solid wall insulation measures and
renewable energy measures. The shortfall
suggests a significant programme of training,
investment and policy support would be needed
if the required installation rates are to be achieved.
The greatest uplift is needed in micro-combined
heat and power (CHP) installation, which requires
an increase of just under 685,000 installations
per year. Micro-CHP is a near-market-ready
technology and the government must ensure
that a framework is put in place to facilitate
its deployment across the housing sector. If
the government ensures that this and similar
technologies are developed and successfully
deployed in the UK in large numbers, then we
will be well positioned globally as market leaders
in emerging and expanding markets. Micro-CHP
also has an important role to play in balancing
our future energy needs. It matches supply and
demand, by producing electricity when the grid
most needs it, i.e. predominantly in the mornings
and evenings when we are at home using our
heating systems.
�.�0 How have the improvements been modelled?The Improvement Model that underpins the study
has been developed by CSE, ACE and Dr Richard
Moore over the last two years. The sophisticated
computer model draws together geographically
specific data from the English House Condition
Survey (EHCS) and data on sustainable energy
improvements from ACE’s Fuel Prophet Model
(which includes fuel type and savings data).
This is integrated with data from the devolved
administrations to build the nationwide picture.
The Stern review
estimated the cost
to the economy of
mitigating the harmful
impacts of climate
change to be 10 times
that of acting now.
11 EEPfH, The impact of fuel price risees in the managed housing sector, CSE, ACE and Dr Richard Moore 2007. 12 www.hm-treasury.gov.uk/independent_reviews/stern_review_economics_climate_change/sternreview_index.cfm
© ir
tsur
veys
.co.
uk

9CHANGE IMAGE
© w
ww
.nat
iona
linsu
latio
nass
ocia
tion.
org.
uk

�0
��The UK government’s 2007 budget presented
the aim that: “by the end of the next decade,
all householders will have been offered help to
introduce energy efficiency measures with the aim
that, where practicably possible, all homes will
have achieved their cost-effective energy efficiency
potential”13. This study, entitled How low? for
short, takes this statement as its starting point
and examines the level of carbon dioxide (CO2)
emissions reductions that are feasible within the
UK housing stock by 2020 using ‘cost-effective’
measures.
The report also assesses what longer-term action
is required to ensure the requisite stability in
carbon emissions is achieved by 2050. It is now
widely accepted that stabilising atmospheric
greenhouse gas concentrations at a maximum of
450 parts per million (ppm) of CO2 equivalent is
necessary14 to avoid dangerous climate change.
This would require all developed countries to cut
CO2 emissions by at least 80% from 1990 levels
by 205013. Therefore, this study examines the
feasibility of achieving an 80% cut in emissions
by applying certain measures to the UK’s housing
stock.
The UK government’s own Climate Change Bill
contains a legally binding target to reduce CO2
emissions by at least 60% from 1990 levels by
2050. This target was first suggested by the
Royal Commission on Environmental Pollution,
which identified the need to stabilise global
concentrations of CO2 at an upper limit of 550
ppm16 to limit warming to 2°C. Based on every
country in the world emitting its ‘fair share’ by
2050, this would require the UK to cut emissions
by 60% from 2000 levels – a greater cut than that
proposed in the Climate Change Bill. However,
the 60% figure used in the Climate Change Bill is
based on out-of-date science and, as stated, there
is now consensus across the scientific community
that an 80% cut is the minimum required.
Since more than 27% of the UK’s CO2 emissions
come from domestic housing, this is clearly a
vital sector to tackle. The UK’s residential sector
greenhouse gas emissions were 45.8 megatonnes
of carbon equivalent (MtC) in 1990, of which 42.4Mt
were CO217.
The UK government has made a number of
announcements and commitments to reduce CO2
emissions (see Table 3). Most recent of these is the
National Energy Efficiency Action Plan (NEEAP18),
which sets a target to reduce emissions from the
UK’s residential housing stock to 29.3MtC (a 31%
reduction) by 2020. With the exception of the UK
Climate Change Bill target, the remaining targets
shown in Table 3 are not statutory.
At present, the UK Climate Change Bill does not
contain sectoral targets. However, applying the
Bill’s overall 60% target proportionately to housing
would mean reducing emissions to 17MtC by
205019. Achieving an 80% cut would require us to
reduce residential emissions to 8.5MtC. As with
the 60% target, an 80% reduction of the UK’s
total emissions would need to be achieved across
all sectors. This may ultimately mean that further
cuts in the residential sector would be required to
offset emissions growth (or smaller cuts) in other
areas, such as from aviation. Indeed, if international
aviation and shipping were to be included in the
Climate Change Bill carbon budget targets, then we
would have to follow an even steeper downward
trajectory for residential emissions, which could
have knock-on implications for the utility of the fuel
mix (see Decarbonised electricity, section 6.2).
1990 baseline
2004 emissions
Targets20
2008-12 (Kyoto)
2010 (CCP 2006)
2010 (NEEAP)
2010 (Gov target)
2016 (NEEAP)
2020 (NEEAP)
2020 (UK Climate Change Bill)
2050 (UK Climate Change Bill)
2050 (80% cut)
45.8
43.7
40.1
38.6
n/a
n/a
n/a
n/a
n/a
n/a
n/a
42.4
41.7
n/a
37.6
37.7
33.9
33.1
29.3
28.8 – 31.4
17
8.5
Year
UK residential sector green-house gas emissions
UK residential sector CO2 emissions
Table 3: Summary of UK residential sector emissions targets (MtC)
Background How low do we need to go?
13 HM Treasury (2007). 14 International Symposium on the Stabilisation of greenhouse gas concentrations, Hadley Centre, 2005. 15 See, for example, Höhne, Phylipsen and Moltmann (2007). 16 RCEP (2000). 17 Defra (2006). 18 Defra (2007a); Defra’s NEEAP covers energy efficiency measures, renewables and carbon emissions. 19 This figure is calculated on the current basis that international aviation and shipping are not incorporated into the targets. 20 Statutory residential sector targets or proportional allocations of wider targets.
�0

��
� The study has examined the impact of four
scenarios on carbon emissions from UK housing
stock. The key selection criteria for each scenario
were:
Scenarios to 2020:
Scenario 1a – The government’s pledge on
cost-effective measures, defined by the then
Chancellor Gordon Brown in the 2007 Budget
statement.
Scenario 1b – Going beyond the basics on
a firm financial footing – i.e. the measures
deemed cost-effective by the team’s analysis of
measures, and packages thereof, that have a
positive net present value (NPV, see Annex II).
Scenarios to 2050:
Scenario 2a – Doing all we can – i.e. all
measures applied by the model.
Scenario 2b – Additionally, going further in
reducing emissions from areas not covered by
the model, such as stronger assumptions about
the decarbonisation of the energy supply.
1a Market potential
1b Economic potential
2a Technical potential
2b Theoretical potential
1a1b
2a2b
Figure 2: Different levels of potential emissions
cuts and relationships of the scenarios
The four scenarios should not be viewed as
alternatives, but rather each subsequent scenario
requires virtually all the same activity as the
scenario numbered before it, but does more
to achieve greater emissions reductions. Each
scenario broadly represents a different level of
potential emissions cuts to either 2020 or 2050.
The relationship between the scenarios and the
levels of emissions reductions is further illustrated
in Figure 2.
�.� Limiting Criteria The different types of potential are explained, along
with the descriptions of each scenario, in section 5.
The mix of sustainable energy measures applied
under each scenario was subjected to a set of
criteria that limited their application to suitable
locations and situations. The model accounts for
the local vernacular and landscape – for example,
if the building is listed or situated in an Area of
Outstanding Natural Beauty (AONB).
4.1.1 AONBs and Listed Buildings External wall insulation is not selected for
listed buildings with solid walls or homes in a
conservation area.
Internal wall insulation is not selected for
individually listed buildings with solid walls and/
or where the habitable rooms are already small.
Solar hot water (SHW) and photovoltaic (PV)
installations are not selected for flats or houses/
bungalows in AONBs21.
4.1.2 Demolition and replacementThe study does not specify any demolition and any
additional new build beyond business as usual,
as the demolition and replacement costs are up
to 10 times22 more than those for refurbishment.
Unfortunately there is a zero rate of VAT on new
build, compared to 17.5% VAT on refurbishment
and this actively encourages developers to opt
for the more destructive option. In terms of the
energy balance between demolition and new
build, there are varying schools of thought, but
rigorous reuse of materials and aggregates
through effective interpretation of planning locally
is one way of minimising the additional energy use
and emissions embodied by new construction. It
should also be noted that there can be multiple
external drivers affecting the case for refurbishment
in preference to demolition and rebuild, such as
community cohesion and place-making.
How low scenarios – selection and limiting criteria
21 It could be argued that planning restrictions in AONBs need to be eased. For the purpose of this study, a number of assumptions have been made that err on the side of caution. For an outline of these, see Annex VI. 22 SDC (2007).
��
How low do we need to go?

��
5 5.� What is deemed cost-effective by �0�0?5.1.1 Scenario 1a (2020) – market potentialScenario 1a modelled the implementation of
measures in the housing stock based on the
“intention” stated in the 2007 Budget that, “by the
end of the next decade, all householders will have
been offered help to introduce energy efficientcy
measures with the aim that, where practicably
possible, all homes will have achieved their cost-
effective energy efficiency potential”. The measures
seen as cost-effective in the Budget include “cavity
wall, loft and hot water cylinder insulation, draught
proofing, efficient boilers and heating controls”23.
Scenario 1a models these measures, including low
energy lighting and assuming ‘efficient boilers’ to
include gas, oil and LPG condensing boilers, as
being installed in all applicable24 dwellings25.
In principle, this scenario represents what is
taken to be the market potential for emissions
reductions – i.e. reductions in emissions that
in theory should come about with little to no
government intervention because they are highly
cost-effective. In practice, for many reasons
including public apathy and a lack of buy-in as to
their environmental necessity and benefit, these
measures are often not taken up in a free market
system.
5.1.2 Scenario 1b (2020) – economic potentialScenario 1b was developed according to two
criteria. The first was to consider individual
measures or combinations of measures to be
cost-effective if they carried a positive net present
value over their lifetime. The second was not to
include micro-wind turbines. The discount rate
used was the Treasury’s own (real) discount
rate26 for appraising public policy – 3.5%. This
more pragmatic definition of cost-effectiveness
significantly expanded the measures and
combinations thereof27 that were applied to the
housing stock.
In principle, scenario 1b represents the economic
potential for reducing emissions from the existing
stock – i.e. cost-effective emissions reductions that
are not normally achievable without government
intervention because of barriers such as high initial
required investment or lack of information about
the economic benefits of the investment.
5.� What is technically feasible by �050?�8
5.2.1 Scenario 2a (2050) – technical potentialScenario 2a was developed to consider the
potential carbon savings if all current measures,
regardless of cost-effectiveness, were applied.
The scenario represents a pragmatic appraisal
of the carbon savings that could be achieved in
the housing stock from energy efficiency and low
to zero carbon (LZC) technologies. The scenario
includes constrained levels of both PV and micro-
wind turbine installations (see Annex I for a full
breakdown of the constraints applied under each
scenario).
The modelled savings associated with these
measures alone thus represents the technical
potential for reducing emissions from the existing
stock – i.e. the emissions reductions achievable
from the set of currently available technologies.
5.2.2 Scenario 2b (2050) – theoretical potentialScenario 2b represents the theoretical potential
for reducing emissions from the existing stock.
It makes stronger assumptions than the other
scenarios about less certain factors, not covered
by the model. These include the volume of
emissions reductions, based on improving and
new technologies and behavioural change. How
the assumptions for each of these factors have
been made for each scenario, including 2b, is
briefly outlined below.
The Scenarios outlined
23 HM Treasury (2007); in the How Low? model, all new boilers are assumed to be fitted with modern efficient heating controls – i.e. room thermostat, timer and thermostatic radiator valves. 24 ‘Applicable’, in the context of all modelled scenarios, means that a combination of measures installed into any one dwelling takes account of the energy improvements already present. 25 For the full set of selection criteria for all scenarios, see Annex II. 26 In economic theory, consumers value a benefit in the future less than a benefit today. Discount rates are used to take account of this.27 Individual measures in addition to scenario 1a: air- and ground-source heat pumps, external and internal wall insulation,
photovoltaic panels, biomass boilers, micro CHP, solar hot water systems, double-glazing. 28 Policy makers will no doubt attempt to compare the findings of this study with those recently published in the ‘Home Truths’ report by the Environmental Change Institute for Friends of the Earth and the Co-operative Bank (Boardman, 2007). However, scenario 2a shows the savings associated with energy improvement measures alone. The main differences in measures applied are the exclusion of large scale / community CHP, the higher prevalence of heat pumps and the inclusion of residential biomass central heating rather than stoves.
��

��
6The How Low? model does not consider all
aspects of emissions from the existing housing
stock. Emissions reductions/increases not
dynamically predicted by the model include:
new build between now and 2016;
decarbonisation of electricity;
green gas;
more carbon conscious energy use in the
home;
and improved efficiency of electrical appliances
(other than lighting, covered by the model).
6.� New build between now and �0�6Based on the Energy Savings Trust’s published
figures, the study has assumed total emissions of
1.9 MtC29 for new homes built in the UK between
now and 2016. Under current legislative plans,
all new homes built from 2016 onwards will be
zero carbon30 and should therefore impose no
additional carbon burden. It is possible that future
new build design may further reduce carbon
impacts, resulting in homes that produce more
energy than they use over the year, with the
excess flowing back into the wider system, but
that has not been accounted for here, as it is
outside the scope of this report.
6.� Decarbonised electricity Decarbonising electricity reduces the amount of
carbon released for each kWh used in the home
and requires the source of generation to be either:
renewable; or low carbon and / or technically
innovative – for example, carbon capture and
storage (CCS) technologies applied to gas- and
coal-fired power generation plants. The team has
linearly extrapolated the projected carbon intensity
of delivered electricity (2008 to 2020)31 to estimate
a 2050 carbon factor of 0.059kgC/kWh – as
shown in Figure 3.
The vision of decarbonised electricity has been
significantly bolstered by the government’s recent
commitment to investigate the deployment of up
to 7,000 offshore wind turbines by 2020. Just 2%
of the UK’s energy comes from renewable sources,
and wind is the source for less than half a gigawatt
(GW). The government hopes that it could provide
around 33GW by 202032.
By 2020, renewable energy should account for
20%33 of the EU’s final energy consumption (8.5%
in 2005). To meet this common target, each
Member State must increase its production and
use of renewable energy in electricity, heating
and cooling, and transport. The UK is obliged to
increase its share of renewable energy from less
than 2% now to 15% of the country’s total energy
needs by 2020. This will require a large proportion
of our electricity to come from renewables
(40%-50%).
The recent 80% Challenge study by the IPPR,
RSPB and WWF, to identify whether it would be
possible to reduce the UK’s carbon emissions
by 80% of 1990 levels by 2050, identified
decarbonised electricity as a key measure34. The
study used two models: the MARKAL-MACRO
model, used for 2007’s Energy White Paper; and a
model developed by Professor Dennis Anderson of
Imperial College for the
Stern Review.
Both these cost minimisation models concluded
that it is feasible to reduce the UK’s emissions by
80% by 2050, at costs that are not prohibitive.
0.3
0.25
0.2
0.15
0.1
0.05
0
Carbon intensity of delivered electricity
1982
1985
1988
1991
1994
1997
2000
2003
2006
2009
2012
2015
2018
2021
2024
2027
2030
2033
2036
2039
2042
2045
2048
Kg
C/k
Wh
Figure 3: Projected decarbonisation of electricity
Carbon emissions reductions not predicted by the How Low? model
29 Zavody (2007). 30 CLG (2007). 31 Market Transformation Programme (MTP) published figures for carbon content of electricity, 1980 to 2020. 32 BERR (2007); 33GW includes the 8GW already planned. 33 Council of the European Union (2007). 34 IPPR, WWF and RSPB (2007).
��

��
The models do this mainly by decarbonising
electricity supply, in particular through the use of
carbon capture and storage (CCS) to make fossil
fuelled power generation carbon-free, and on and
off-shore wind power. For reasons of caution (see
Annex VI) this study has not assumed as high a
level of decarbonisation as the 80% Challenge
report, which serves to highlight that there is room
to manoeuvre and go beyond an 80% cut in the
residential sector35.
6.� Green gas (for heat)Green gas would be produced from the treatment
of waste and the anaerobic digestion of agricultural
organic matter and/or landfill. This gas could then
be injected into the natural gas grid network.
Green gas could be sold to householders in a
similar way to green electricity, with householders
paying for an equivalent amount to that used in
their own home. It would be necessary to ensure
these green gas tariffs were certified to robust
standards of compliance to agreed standards.
Ernst & Young’s recent examination of the initial
business case for supporting the UK renewable
heat sector did not examine the feasibility of
biogas injection to the domestic gas supply
network. However, a response to the Renewable
Heat Obligation consultation by Panthol Ltd36
(a supplier of domestic oil and biofuels) stated
that the UK could possibly secure 10% of its
current natural gas energy needs, or 15% of its
current electricity needs, by 2020, through the
production and use of biogas from indigenous UK
agricultural output. This study has therefore made
a moderately conservative assumption of a total
residential green gas supply – of 10% by 2050.
14.00
12.00
10.00
8.00
6.00
4.00
2.00
0.00
1990
1995
2000
2005
2010
2015
2020
2025
2030
2035
2040
2045
2050
Reference
Policy
Early best practise
Figure 4: Market Transformation Programme scenarios for household
electrical appliances other than lighting, extrapolated to 2050
6.� Behavioural change and improved efficiency of appliancesAssumptions about the improved efficiency of
UK electrical appliances by 2050 (other than
lighting, as lighting is dealt with by the How Low?
model) were based on the Market Transformation
Programme’s37 ‘Early Best Practice’ scenario
(extrapolated from 2020 to 2050) – as shown in
Figure 4.
As regards the impact on emissions of more
carbon conscious behaviour in the home, it was
assumed that behavioural change could reduce
remaining emissions (i.e. after all of the above) by
5% – 20%38 39, depending on the scenario.
Carbon conscious
behaviour in the home
could reduce remaining
emmissions up to 10%.
35 This would increase carbon savings in 2050 by 3MtC. 36 Panthol Ltd (2007). 37 Funded by Defra, the Market Transformation Programme ‘supports UK government policy on sustainable products. Its aim is to achieve sustainable improvements in the resource efficiency of products, systems and services where these are critical to the delivery of government commitments in areas including climate change, water efficiency and waste
reduction’ (MTP, 2008). 38 Not 5% of the 1990 baseline emissions.39 This estimate is based on a review of the literature on direct feedback from metering, billing and energy displays – carried out for Defra by Oxford University’s Environmental Change Institute – which was between 5% and 15% of energy demand (Darby, 2006).

�56.5 In summaryTable 4 summarises the assumptions made
for each of the above factors not dynamically
modelled under the four scenarios.
New build between
now and 2016
Decarbonisation of
electricity
Green gas (heat)
Improved efficiency of
appliances
Behavioural change
1.9 MtC
n/a
n/a
MTP ‘Policy’
scenario in 2020
Government
predicted savings
1.9 MtC
n/a
n/a
MTP ‘Early Best
Practice’ scenario
in 2020
5% of remaining
emissions
1.9 MtC
0.059kgC/kWh
n/a
MTP ‘Policy’
scenario in 2050
10% of remaining
emissions
1.52 MtC*
0.059kgC/kWh
10% of overall grid
gas supply
MTP ‘Early Best
Practice’ scenario
in 2050
20% of remaining
emissions
Additional savings
Scenario 1a(‘market potential’)
Scenario 1b(‘economic potential’)
Scenario 2a (‘technical potential’)
Scenario 2b(‘theoretical potential’)
Table 4: Assumptions made for each scenario
Scenario 2b assumes a 20% improvement in the efficiency of new homes built before 2016 by 2050
– i.e. improved appliances.
�5
© B
EA
LOV
EG
A /
WW
F-U
K

�6
� There are many different definitions of cost-
effectiveness, depending on which parameters
are used. The definition used can result in
widely differing outcomes as to the packages of
measures which may fall within the remit of what
would be applied. WWF believes that we should
incorporate a cost for carbon into the definition
of cost-effectiveness, to properly account for the
environmental impacts of the housing sector.
Indeed, government policy is such that a carbon
price should be used to inform all policy decisions,
including in the existing homes arena40. This would
greatly increase the number of carbon-saving
measures applied, taking us further, faster, in terms
of environmental and financial savings. But for
reasons of practicality and caution, we have used
a more conservative definition of cost-effective (see
Annex VI).
The cost-effectiveness of different packages of
sustainable energy measures for these
purposes was established by calculating the
net present value of each package using the
Association for the Conservation of Energy’s Fuel
Prophet41 to model costs and benefits in different
types of representative dwellings. The model
covers combinations of six built forms, five main
heating fuels and three wall construction types
– representative of 97.2% of all households. Net
present value assesses the cost versus the benefit
of an investment. When benefits exceed costs
over the lifetime of the installed sustainable energy
measures, the package in question has a positive
net present value (NPV), and is thus deemed cost
effective.
Costs in this context are the installed cost of the
sustainable energy measures, including any annual
maintenance cost of the installed equipment.
Benefits are the savings on energy bills over the
years and, if taken into account, the value of the
carbon emissions saved.
The NPV calculations for the sustainable energy
measures thus took into account three factors: one
set of future energy prices (rising conservatively);
three different assumptions about the value of
carbon; and three different discount rates. Future
energy prices were not varied, so only the effect
of the latter two factors on NPV have been
summarised in the table below.
The lower the discount rate and the higher
the value of carbon (i.e. the direction of the
arrows), the more packages of sustainable
energy measures attain a positive net present
value, making them cost-effective. The analysis
of cost-effectiveness was primarily carried out
to identify the packages to be installed under
scenario 1b42 – as indicated by the entry in the grid
below. But it also confirmed that the more limited
choice of sustainable energy measures deemed
cost-effective by the Treasury – and modelled in
scenario 1a – were selected implicitly on the basis
of a less favourable definition of what is cost-
effective (see Annex VI).
Though scenarios 2a and 2b pay no heed to
cost-effectiveness, the analysis showed that the
majority of the packages of sustainable energy
measures deemed uneconomic by scenarios 1a
and 1b attain positive NPV – for example micro
wind turbines in some combinations, or a much
wider rollout of solar thermal or PV electric panels
– when value is ascribed to the carbon emissions
in addition to the energy saved.
Analysis of cost-effectiveness
A much wider rollout
of solar thermal or
PV electric panels
becomes cost effective
when a value is
ascribed to the carbon
emissions, in addition
to the energy saved.
40 Defra (2007b). 41 The purpose of Fuel Prophet is to help housing professionals and policy researchers decide which energy saving refurbishment measures should be supported and installed. It can calculate the performance of various measures, both individually and in combination, in a variety of typical UK dwellings and under different fuel prices conditions.
42 That is by using a more forgiving definition of cost-effectiveness than that implied by the Treasury’s announcement (HM Treasury, 2007) that ‘by the end of the next decade […] all homes will have achieved their cost-effective energy efficiency potential’.
�6
© w
ww
.nat
iona
linsu
latio
nass
ocia
tion.
org.
uk

��
No value ascribed to
saved carbon
10% discount rate (a
typical rate used to
assess commercial
investments)
Packages of sustainable
energy measures with
positive NPV under these
assumptions correspond
to the measures included
in scenario 1a
3.5% discount rate
(value used to assess
the cost-effectiveness
of public policy)
0% discount rate
(assumes people value
future benefits as
much as benefits
appropriate today)
Majority of packages
installed under scenarios
2a and 2b attain positive
NPV
Majority of packages
installed under scenarios
2a and 2b attain positive
NPV
Packages of sustainable
energy measures with a
positive NPV under these
assumptions were
selected for scenario 1b
Majority of packages
installed under scenarios
2a and 2b attain positive
NPV
Economic value
ascribed to saved
carbon (based on
low-end EU emissions
trading scheme price
of carbon)43
Social value ascribed
to saved carbon
(based on value of
carbon assigned by
Stern Report on the
economics of climate
change)
Increasing number of packages attain positive NPV
I
ncre
asin
g n
umb
er o
f p
acka
ges
att
ain
po
siti
ve N
PV
43 A very low-end price of carbon (at €10/tonne of CO2) was used. At time of writing (11.2.08) the trading price per tonne was above €20. The price is intended to increase over time as permit allocations in the EU Emissions Trading Scheme are tightened.
Table 5: Analysis of measures approaching positive net present value
�8
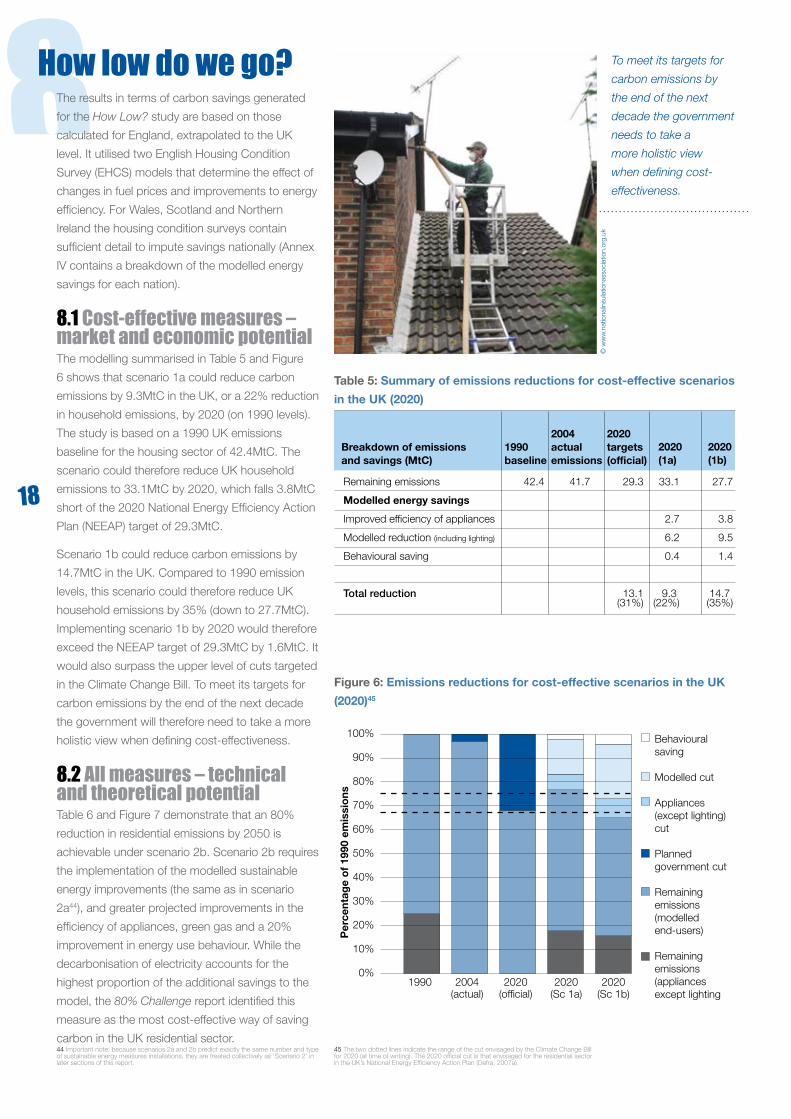
8The results in terms of carbon savings generated
for the How Low? study are based on those
calculated for England, extrapolated to the UK
level. It utilised two English Housing Condition
Survey (EHCS) models that determine the effect of
changes in fuel prices and improvements to energy
efficiency. For Wales, Scotland and Northern
Ireland the housing condition surveys contain
sufficient detail to impute savings nationally (Annex
IV contains a breakdown of the modelled energy
savings for each nation).
8.� Cost-effective measures – market and economic potentialThe modelling summarised in Table 5 and Figure
6 shows that scenario 1a could reduce carbon
emissions by 9.3MtC in the UK, or a 22% reduction
in household emissions, by 2020 (on 1990 levels).
The study is based on a 1990 UK emissions
baseline for the housing sector of 42.4MtC. The
scenario could therefore reduce UK household
emissions to 33.1MtC by 2020, which falls 3.8MtC
short of the 2020 National Energy Efficiency Action
Plan (NEEAP) target of 29.3MtC.
Scenario 1b could reduce carbon emissions by
14.7MtC in the UK. Compared to 1990 emission
levels, this scenario could therefore reduce UK
household emissions by 35% (down to 27.7MtC).
Implementing scenario 1b by 2020 would therefore
exceed the NEEAP target of 29.3MtC by 1.6MtC. It
would also surpass the upper level of cuts targeted
in the Climate Change Bill. To meet its targets for
carbon emissions by the end of the next decade
the government will therefore need to take a more
holistic view when defining cost-effectiveness.
8.� All measures – technical and theoretical potentialTable 6 and Figure 7 demonstrate that an 80%
reduction in residential emissions by 2050 is
achievable under scenario 2b. Scenario 2b requires
the implementation of the modelled sustainable
energy improvements (the same as in scenario
2a44), and greater projected improvements in the
efficiency of appliances, green gas and a 20%
improvement in energy use behaviour. While the
decarbonisation of electricity accounts for the
highest proportion of the additional savings to the
model, the 80% Challenge report identified this
measure as the most cost-effective way of saving
carbon in the UK residential sector.
Remaining emissions
Modelled energy savings
Improved efficiency of appliances
Modelled reduction (including lighting)
Behavioural saving
Total reduction
42.4 41.7 29.3
13.1(31%)
33.1
2.7
6.2
0.4
9.3 (22%)
27.7
3.8
9.5
1.4
14.7 (35%)
Breakdown of emissions and savings (MtC)
1990 baseline
2020 (1a)
2020 (1b)
2020 targets (official)
2004 actual emissions
Table 5: Summary of emissions reductions for cost-effective scenarios
in the UK (2020)
100%
90%
80%
70%
60%
50%
40%
30%
20%
10%
0%1990 2004
(actual)2020
(official)2020
(Sc 1a)2020
(Sc 1b)
Behavioural saving
Modelled cut
Appliances (except lighting) cut
Planned government cut
Remaining emissions (modelled end-users)
Remaining emissions (appliances except lighting
Per
cent
age
of
1990
em
issi
ons
Figure 6: Emissions reductions for cost-effective scenarios in the UK
(2020)45
How low do we go? To meet its targets for
carbon emissions by
the end of the next
decade the government
needs to take a
more holistic view
when defining cost-
effectiveness.
44 Important note: because scenarios 2a and 2b predict exactly the same number and type of sustainable energy measures installations, they are treated collectively as ‘Scenario 2’ in later sections of this report.
�8
45 The two dotted lines indicate the range of the cut envisaged by the Climate Change Bill for 2020 (at time of writing). The 2020 official cut is that envisaged for the residential sector in the UK’s National Energy Efficiency Action Plan (Defra, 2007a).
© w
ww
.nat
iona
linsu
latio
nass
ocia
tion.
org.
uk

�9Remaining emissions
Modelled energy savings
Appliances only
Modelled reduction (including lighting)
Decarbonisation of electricity
Green gas
Behavioural saving
Total reduction
42.4 17.0
25.4(60%)
41.7 11.9
7.3
11.6
10.7
1.3
30.5 (72%)
8.5
7.8
11.6
10.7
2.3
1.5
33.9 (80%)
Breakdown of emissions and savings (MtC)
1990 baseline
2050 (2a)
2050 (2b)
2050 targets (60%)
2004 actual emissions
Table 6: Summary of emissions reductions for scenario 2a and 2b in
the UK
100%
90%
80%
70%
60%
50%
40%
30%
20%
10%
0%1990 2004
(actual)2050
(official)2050
(Sc 2a)2050
(Sc 2b)
Behavioural saving
Modelled cut
Appliances (except lighting) cut
Planned government cut
Remaining emissions (modelled end-users)
Remaining emissions (appliances except lighting
Per
cent
age
of
1990
em
issi
ons
Figure 7: Long-term emissions reductions scenarios for the UK
(2050)
An 80% reduction in
residential emissions
by 2050 is achievable
under scenario 2b.
�9
© w
ww
.nat
iona
linsu
latio
nass
ocia
tion.
org.
uk

�0
9The economic, non-energy benefit of sustainable
energy activity is often ignored by researchers and
policy-makers. The model outputs for the three
scenarios under consideration include estimates
of the total cost of installing the measures (based
on a modelled average cost) and their value to the
economy, or their Gross Value Added (GVA).
GVA = Turnover minus cost of bought-in materials,
components and services.
GVA represents value to the UK economy or money in the pockets of British workers and businesses.
9.� England 9.1.1 Total costs and savings for each scenario in England (all measures)The How Low? model is built using information
from the English Housing Condition Survey
(EHCS). It is therefore possible to impute savings
for other nations based on the profile of their
housing stock, but it is not possible to accurately
quantify the measures installed (see Annex V).
The costs shown here represent the costs for
measures installed in England alone. The costs
for individual measures represent those costs
experienced today, therefore the actual cost
experienced in 2050 should be significantly lower
than that shown here.
Table 7 summarises the potential total economic
costs and benefits of installing the energy
improvements required under all scenarios. The
estimated total cost of the 46 million measures
required by 2020 (including 16 million low energy
light bulbs) for scenario 1a stands at just under
£19 billion, with a resultant GVA of more than £5bn
(see Annex I for GVA assumptions).
For scenario 1b, the number of measures required
by 2020 is 42 million, with subsequent total costs
of over £77 billion and a GVA of nearly £23 billion.
These results show that there is considerable
potential economic benefit of the proposed activity
for the insulation, heating and renewables sectors.
The number of measures required is lower than
Scenario 1a, as lofts with 150mm or more of
loft insulation are not improved. This marginal
improvement is not deemed cost-effective under
this scenario.
Scenario 2 requires a total expenditure of £130
billion, with a GVA of £38 billion. This cost is
based on today’s prices for insulation and LZC
technologies, which are likely to fall significantly
between now and 2050.
The recent Renewables Advisory Board (RAB)
report on the ‘essential role of renewables
generation in achieving zero carbon homes’
examined the projected cost of LZC technologies
from 2007 to 2025. If the cost reductions
Savings from measures
alone (MtC)
Total costs
Lifetime fuel savings47
GVA (£1000s)
Value of carbon – social
Value of carbon – economic
Total benefit (lower)
Total benefit (upper)
Net benefit (lower)
Net benefit (upper)
5.1
£18,970,388,000
£59,417,471,000
£5,226,526,000
£5,357,051,000
£2,525,467,000
£67,169,464,000
£70,001,047,000
£48,199,076,000
£51,030,659,000
8.4
£77,129,531,000
£69,585,329,000
£22,922,603,000
£8,794,463,000
£4,145,961,000
£96,653,892,000
£101,302,394,000
£19,524,361,000
£24,172,863,000
9.4
£129,631,485,000
£50,250,385,000
£38,995,669,000
£9,894,624,000
£4,664,608,000
£93,910,663,000
£99,140,678,000
-£35,720,822,000
-£30,490,807,000
ScenarioScenario 1a (2020)
Scenario 1b (2020) Scenario 246
Table 7: Total costs and economic benefits of measures under the four
scenarios in England
How much to go how low?
46 The carbon savings predicted by the How Low? model are the same in scenarios 2a and 2b. 47 Lifetime costs are based on 2007 fuel prices.
�0

��
predicted are applied to Scenarios 2a and 2b, then
the cost falls by £36 billion to £94 billion in total,
which would mean that they achieve a net positive
economic position.
The three scenarios summarised all demonstrate
that every £3-£4 spent on sustainable energy
measures in the UK result in approximately £1
generated for UK plc. In addition to this annual
investment in UK industries, these households
will also benefit from reduced energy bills and
associated financial savings. Table 7 also shows
the long-term monetary value of these savings.
This represents a conservative estimate of the
actual savings achieved, as the fuel prices are
based on 2007 averages and a 15-year lifetime
for all measures48. In reality, fuel prices are likely to
increase significantly between 2006 and 2020, and
15 years represents the shortest lifetime of those
measures applied.
Scenario 1a generates almost £3.13 of savings for
every £1 of money invested in measures. These
measures will provide considerable benefit to the
3.54 million49 fuel-poor households in the UK in
2006. The How Much?50 study has shown that
a considerable number of LZC technologies and
insulation measures will be required to alleviate fuel
poverty, but there will still be a hardcore group of
fuel poor that cannot be lifted out of fuel poverty
by measures alone. This is due to a combination
of low incomes, high fuel prices, under-occupancy
and extremely inefficient housing. Under
Scenario 2a and 2b it is likely that 75%-80%
of households in fuel poverty would rise out of
this disadvantageous position51. The proportion
remaining would require either improved income
or a change in circumstances – such as the
householder moving to a smaller, more affordable
property. If a cost of carbon is included in these
figures, scenario 1a generates between £3.54
and £3.69 for every £1 invested. The higher figure
represents a carbon cost of £70 per tonne (‘social’
in Table 7, left), while the lower figure represents a
carbon cost of £33 per tonne (‘economic’ in the
table)52.
Under scenario 1b, the total benefit per £1
invested is between £1.25 and £1.31. In scenario
2, the resulting total benefit is less than £1 per £1
invested, but if the costs of LZC technologies fall,
as predicted by the RAB, the resulting benefit is
between £1.19 and £1.26 for each £1 invested.
48 15 years is a conservative estimate, based on the shortest lifetime of all measures applied. 49 Guertler, Moore and Preston (2007). 50 Moore, Preston and Guertler (2008).51 As of 2006-07, approximately 16-17% of households were in fuel poverty (Guertler, Moore and Preston, 2007). 52 Stern (2007).
© B
STI
RTO
N /
GE
TTY
IMA
GE
S /
WW
F-U
K

��
9.� UK9.2.1 Total costs and savings for each scenario in the UK (all measures)
Savings for measures
alone (MtC)
Total costs
Lifetime fuel savings
GVA
Value of carbon
– social
Value of carbon
– economic
Total benefit (lower)
Total benefit (upper)
Net benefit (lower)
Net benefit (upper)
6.2
£23,090,781,000
£71,554,369,000
£6,221,205,000
£6,537,802,000
£3,082,107,000
£80,857,680,000
£84,313,376,000
£57,766,899,000
£61,222,595,000
9.5
£92,471,114,000
£76,331,708,000
£27,285,084,000
£10,003,608,000
£4,715,987,000
£108,332,779,000
£113,620,400,000
£15,861,665,000
£21,149,286,000
11.2
£155,988,710,000
£59,831,616,000
£46,417,073,000
£11,746,150,000
£5,537,471,000
£111,786,160,000
£117,994,839,000
-£44,202,550,000
-£37,993,871,000
ScenarioScenario 1a (2020)
Scenario 1b (2020) Scenario 2
Table 8: Total costs and economic benefits of measures under the
three scenarios in the UK
Table 8 shows the likely cost of achieving each
scenario in the UK, based on the imputation
methodology for the devolved nations shown in
Annex V. The total cost of £156 billion in scenario
2 equates to expenditure of £3.5 billion per year.
If the RAB cost reductions for LZC53 technologies
were applied, then the expenditure would fall to
£113 billion – or £2.6 billion per year. The range of
annual expenditure of £2.6-£3.5 billion per year is
significantly lower than the £12.9 billion required
in the Home Truths report, but does not include
the additional cost to UK plc of decarbonising
electricity, which is outside the scope of this study.
At the UK level, scenario 1a provides almost £3.10
of savings for every £1 invested in measures
(lifetime fuel savings divided by cost). If a cost
for carbon is included in the analysis, in scenario
1a the resulting total benefit (fuel savings plus
carbon savings) is between £3.50 and £3.65 per
£1 invested in measures. Under scenario 1b the
total benefit per £1 invested is between £1.17
and £1.23. For scenario 2, the total benefit per
£1 invested is less than £1, but if the cost of LZC
technologies falls in line with RAB predictions,
costs for scenario 2 will fall by approximately £43
billion to under £113 billion, giving savings per
£1 invested of between £0.99 and £1.05. In this
instance the economic benefit therefore matches
the investment made.
Table 9 and Table 10 show known current UK
government investment in residential sustainable
energy measures and the required investment
per year for each scenario. The regional housing
allocation represents an estimate54 of the
Communities and Local Government (CLG)
expenditure that is made available to local
authorities through the regional offices and
devolved administrations. The table does not
include measures funded by local authorities to
meet Decent Homes Standard (DHS) targets,
as they do not theoretically receive funds to
implement them. It is therefore not possible to
estimate the total funds allocated to energy
efficiency measures by local authorities that have
not been through the Large Scale Voluntary
Transfer (LSVT) process i.e. they still own and
maintain housing.
Scenario 1a (2020)
Scenario 1b (2020)
Scenario 2a and 2b
£23,090,781,000
£92,471,114,000
£155,988,710,000
£1,776,214,000
£7,113,163,000
£3,545,198,000
Scenario Total costs Cost per year for modelled measures
Table 9: Total costs achieved under the three scenarios in the UK
Warm Front
EEC-2
Decent Homes
LCBP (Phase 1 Stream 1)
Regional housing allocation*
Total
£350,000,000
£300,000,000
£100,000,000
£6,500,000
£551,378,000
£1,307,878,000
Current annual investment (UK)
Table 10: Known UK government investment in the existing
housing stock
53 (Element Energy & EST 2007) 54 The estimated funds are based on the share of the South West regional housing allocation which is passed on to local authorities.

��
9.3.1 Total economic benefit for each scenario The analysis of economic impact and deployment
excludes both low energy lighting and double
glazing. The study assumes that the government
will remain committed to phasing out incandescent
light bulbs after 2009, thus making the need for
fiscal or regulatory support obsolete. Double
glazing has not been included in the study as it is
primarily a home improvement measure rather than
an energy efficiency one, and as such is unlikely to
attract regulatory or fiscal support.
Table 11 shows the number of measures
and expenditure required per year for the key
sustainable energy measures identified (excluding
lighting and double glazing). The results, illustrated
in Figure 8 below, have been compared with the
current55 annual costs for key sustainable energy
measures.
This shows that under scenario 1a, just over
2.3 million measures are required to be installed
annually, at a cost of nearly £1.5 billion. This gives
an annual GVA of over £400 million. The number
of measures required annually for scenario 1a is
slightly lower than the current rates of installation
for all key sustainable energy measures shown in
Annex II (by approximately 200,000).
If scenario 1b were to be delivered by 2020, the
annual number of installations required is over
200,000 higher than the current yearly figure for
all key sustainable energy measures. The annual
expenditure required, and the resulting GVA is
nearly double that for all current key sustainable
energy measures. Under this scenario, annual
costs of measures need to rise by nearly £2.6
billion. This would give an additional annual GVA of
approximately £1.7 billion and require a significant
programme of training, investment and policy
support.
Under scenario 2, costs per year and GVA per year
are lower than current activity, as fewer measures
– under a million measures per year – are installed.
This is because it covers a longer time period
and so, although the overall number of measures
installed between now and 2050 are higher than
the scenarios that only reach 2020, the annual
number of measures installed is lower. Although it
was not part of the specification of scenario 2 that
every home should receive at least one LZC, on
average the model shows 1.3 LZC technologies
being installed per household.
7,000
6,000
5,000
4,000
3,000
2,000
1,000
Currentactivity
Scenerio1a (2020)
Scenerio1b (2020)
Scenerio2 (2020)
Mill
ions
Annual economic impact of current installation of key measures and cost effective scenarios
3,322
9851,459
Annual cost of measures Annual GVA
402
5,933
1,754
2,946
877
Figure 8: Annual costs and economic benefits
of measures for each scenario in England
Current (all key measures)
Scenario 1a (2020)
Scenario 1b (2020)
Scenario 2a and 2b
2,509,000
2,309,000
2,751,000
937,000
£3,321,560,000
£1,459,261,000
£5,933,041,000
£2,946,170,000
£984,528,000
£402,040,000
£1,754,269,000
£877,484,000
ScenarioMeasures per year Costs/yr GVA/yr
Table 11: Annual costs and economic benefits of key measures under
scenarios in England
The total funds available could be in the region of
£1.3 billion. In reality this total will be lower, as a
proportion of the regional housing allocation will be
spent on general improvement rather than specific
energy efficiency measures. It is also worth noting
that the English regions have cut the amount of
funding available for existing housing through the
regional housing allocation in 2008. The regions
plan to distribute a proportion of this funding
stream to new affordable housing. The annual
expenditure available is therefore likely to fall to
approximately £1 billion. The current funding
available therefore falls significantly short of
that required for all three scenarios.
9.� Economic benefit in EnglandThe analysis of economic benefit focuses on
England alone as the methodology used to impute
savings for each scenario (see Annex V) cannot
be used to generate the numbers of measures
installed.
55 Current activity represents the cost and measures associated with the installation of all key sustainability measures in England (see Annex II for further details).
��
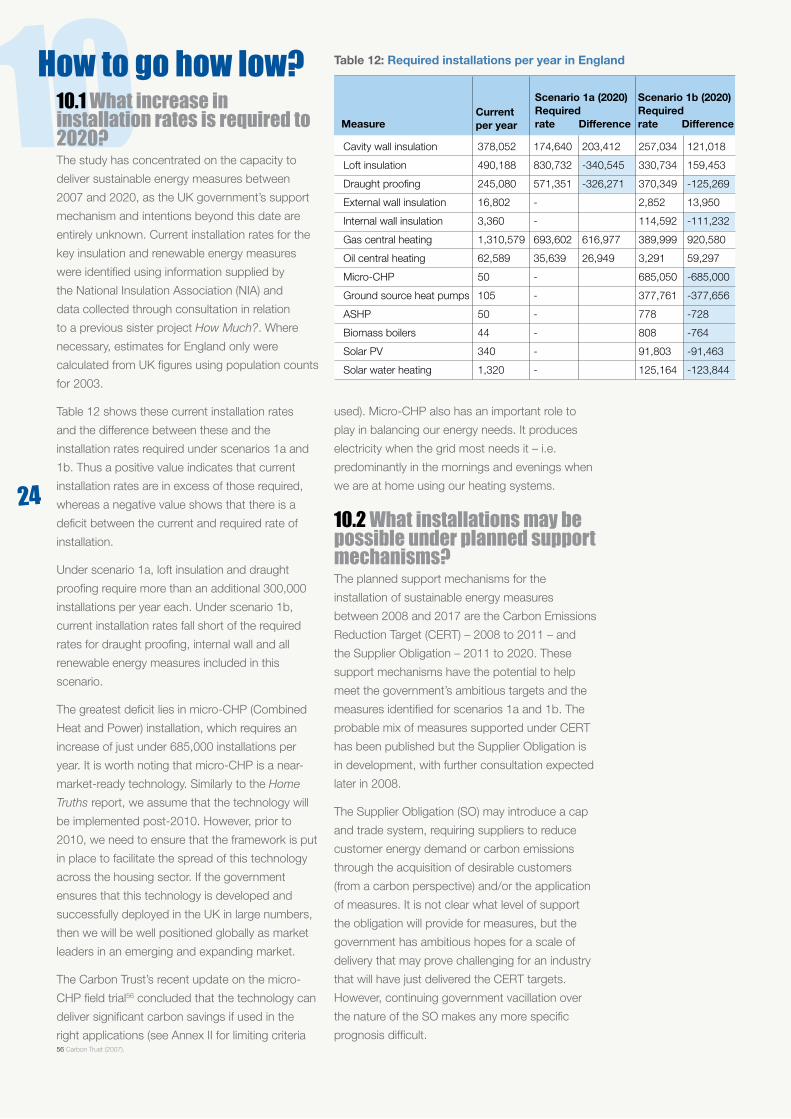
��
�0�0.� What increase in installation rates is required to �0�0? The study has concentrated on the capacity to
deliver sustainable energy measures between
2007 and 2020, as the UK government’s support
mechanism and intentions beyond this date are
entirely unknown. Current installation rates for the
key insulation and renewable energy measures
were identified using information supplied by
the National Insulation Association (NIA) and
data collected through consultation in relation
to a previous sister project How Much?. Where
necessary, estimates for England only were
calculated from UK figures using population counts
for 2003.
Table 12 shows these current installation rates
and the difference between these and the
installation rates required under scenarios 1a and
1b. Thus a positive value indicates that current
installation rates are in excess of those required,
whereas a negative value shows that there is a
deficit between the current and required rate of
installation.
Under scenario 1a, loft insulation and draught
proofing require more than an additional 300,000
installations per year each. Under scenario 1b,
current installation rates fall short of the required
rates for draught proofing, internal wall and all
renewable energy measures included in this
scenario.
The greatest deficit lies in micro-CHP (Combined
Heat and Power) installation, which requires an
increase of just under 685,000 installations per
year. It is worth noting that micro-CHP is a near-
market-ready technology. Similarly to the Home
Truths report, we assume that the technology will
be implemented post-2010. However, prior to
2010, we need to ensure that the framework is put
in place to facilitate the spread of this technology
across the housing sector. If the government
ensures that this technology is developed and
successfully deployed in the UK in large numbers,
then we will be well positioned globally as market
leaders in an emerging and expanding market.
The Carbon Trust’s recent update on the micro-
CHP field trial56 concluded that the technology can
deliver significant carbon savings if used in the
right applications (see Annex II for limiting criteria
Cavity wall insulation
Loft insulation
Draught proofing
External wall insulation
Internal wall insulation
Gas central heating
Oil central heating
Micro-CHP
Ground source heat pumps
ASHP
Biomass boilers
Solar PV
Solar water heating
378,052
490,188
245,080
16,802
3,360
1,310,579
62,589
50
105
50
44
340
1,320
174,640
830,732
571,351
-
-
693,602
35,639
-
-
-
-
-
-
203,412
-340,545
-326,271
616,977
26,949
257,034
330,734
370,349
2,852
114,592
389,999
3,291
685,050
377,761
778
808
91,803
125,164
121,018
159,453
-125,269
13,950
-111,232
920,580
59,297
-685,000
-377,656
-728
-764
-91,463
-123,844
MeasureCurrent per year
Scenario 1a (2020)Required rate Difference
Scenario 1b (2020)Required rate Difference
Table 12: Required installations per year in EnglandHow to go how low?
used). Micro-CHP also has an important role to
play in balancing our energy needs. It produces
electricity when the grid most needs it – i.e.
predominantly in the mornings and evenings when
we are at home using our heating systems.
�0.� What installations may be possible under planned support mechanisms?The planned support mechanisms for the
installation of sustainable energy measures
between 2008 and 2017 are the Carbon Emissions
Reduction Target (CERT) – 2008 to 2011 – and
the Supplier Obligation – 2011 to 2020. These
support mechanisms have the potential to help
meet the government’s ambitious targets and the
measures identified for scenarios 1a and 1b. The
probable mix of measures supported under CERT
has been published but the Supplier Obligation is
in development, with further consultation expected
later in 2008.
The Supplier Obligation (SO) may introduce a cap
and trade system, requiring suppliers to reduce
customer energy demand or carbon emissions
through the acquisition of desirable customers
(from a carbon perspective) and/or the application
of measures. It is not clear what level of support
the obligation will provide for measures, but the
government has ambitious hopes for a scale of
delivery that may prove challenging for an industry
that will have just delivered the CERT targets.
However, continuing government vacillation over
the nature of the SO makes any more specific
prognosis difficult.56 Carbon Trust (2007).
��

�5
Scenario 1a (required)
Scenario 1b (required)
NIA Industry base case
NIA Industry Accelerated LI
Cavity wall insulation
Scenario 1a (required)
Scenario 1b (required)
NIA Industry base case
NIA Industry Accelerated
CWI
Scenario 1a (required)
Scenario 1b (required)
NIA Industry base case
NIA Industry Accelerated SW
Internal wall insulation
Scenario 1a (required)
Scenario 1b (required)
NIA Industry base case
NIA Industry Accelerated SW
10,799,521
4,299,547
8,577,606
11,067,360
Total
2,270,322
3,341,437
6,812,375
7,604,368
0
37,075
278,403
596,482
Total
0
1,489,696
915,861
1,690,986
Loft insulation Total TotalExternal wall insulation
Table 13: Total insulation measures possible by 2020 in England
The National Insulation Association (NIA) provided
the study with projected totals for key insulation
measures under CERT and the Supplier Obligation,
based on an industry base case and accelerated
scenarios for loft insulation (LI), cavity wall insulation
(CWI) and solid walled insulation (SW). The NIA
interpretation of a supplier obligation envisages
a measure-based approach to energy suppliers
achieving their targets, which runs counter to
CSE’s own analysis of how an energy supplier
may choose to achieve its target57. Table 13: Total
insulation measures possible by 2020 in England
shows the total number of measures that would be
required for each scenario and the number that the
industry predicts possible by 2020.
Table 13 shows that there would be insufficient
capacity to insulate all the lofts identified under
scenario 1a unless the accelerated scenario for
loft insulation was implemented. The number
of lofts insulated under 1a is significantly higher
than that for 1b as the scenario also includes the
marginal top-ups of insulation required to meet
building regulations (not deemed cost-effective
by scenario 1b – i.e. 50mm or less). There is
sufficient cavity wall insulation capacity for both
scenarios. However, there is a deficiency in internal wall capacity for scenario 1b unless the national
capacity for solid wall insulation is accelerated.
The project team has been unable to identify
similar studies for residential heating or renewable
energy capacity post CERT; however, Table 14
shows that a huge step change in the deployment
of renewable energy measures would be
necessary to meet the need. This would require
a huge step change in supply chain, training
and delivery. If the Supplier Obligation provides
sufficient incentive for renewables on a large
scale (post-2011) and the Low Carbon Building
Programme (LCBP) continues until at least 2016,
there will be further capacity for LZC technologies.
However, the tightening of the regulations on new
homes post-2013, when the Code for Sustainable
Homes Level 4 is required, will result in significant
conflicting demand for this already insufficient
resource.
While CERT does include uplift for renewable
technologies, Table 12 shows that with the
exception of biomass boilers there are insufficient
numbers of installations per year to meet what is
required for scenario 1b. Furthermore, ASHPs and
micro-CHP are not included in the current mix of
measures covered.
Ground source heat pumps
ASHP
Biomass boilers
Solar PV
Solar water heating
-369,920
-778
7,593
-91,243
-113,962
7,946
0
8,445
900
12,522
48
n/a
n/a
102
10
Measure
CERT and LCBP per year
Scenario 1bYearly difference in installation rates
Increase required (multiples)
Table 14: Potential for LZC technologies by 2020 in England
57 Roberts, White, et al. (2007).
© w
ww
.nat
iona
linsu
latio
nass
ocia
tion.
org.
uk

�6
10.4.1 Large-scale or community District Heating and CHPDistrict Heating and CHP are both technologies
that can achieve cost-effective carbon savings.
There are many large-scale industrial heat
users that could benefit significantly from the
implementation of CHP. The inclusion of 3MW+
heat users in the second phase of the EU
Emissions Trading Scheme (EU ETS) should further
the economic case for CHP by assigning a value
to carbon in these instances.
The How low? study deals with the feasibility of
installing CHP and DH in existing housing stock.
Our literature review has found that its success
is largely dependent on local circumstances and
the organisation leading the development. There
are a number of circumstances where CHP or
district heating may be suitable to retrofit housing,
including:
housing only;
housing and public sector buildings, such as
hospitals and schools;
housing and large business heat and power
users; and
housing, public sector buildings and
businesses.
The most cost-effective schemes are often large-
scale. The International Energy Agency (IEA)
performed a comparison of distributed CHP/DH
with large-scale CHP/DH. It concluded that a
city-wide DH system supplied by a large combined
cycle gas turbine (CCGT) power station would be
most effective from a cost and carbon perspective.
However, such a scheme would require significant
investment and strong local political leadership.
London is the only region in the UK that boasts
such strong leadership and is therefore currently
best placed to deliver a large-scale or borough
wide scheme. The London Energy Partnership
Scenario 1a
(2020)
Scenario 1b
(2020)
Scenario 2
(2050)
7,916
9,526
9,529
Scenario
2006 installers* (FTE)
5,277
6,350
6,352
2006 ancillary* staff (FTE)
13,193
15,876
15,881
2006 total staff (FTE)
15,445
68,309
23,380
Total staff – scenario (FTE/year)
2,252
52,432
7,499
Required increase in FTE
£26,124
£25,703
£37,550
GVA/FTE
Table 15: Employment generated in England under the three scenarios�0.� What employment would be generated in England?Table 15: Employment generated in England
under the three scenarios, shows how many
full time equivalent (FTE) jobs would be created
under each scenario, compared to the current
number of FTEs for each measure. Scenario 1a
results in the creation of 2,252 FTE jobs, each
adding just over £26,000 of GVA. Scenario 1b
results in the creation of 52,432 FTE jobs, with
each adding slightly less GVA than in scenario 1a.
The reason that the number of FTE jobs created
in scenario 1b is so much higher is the inclusion
of almost five million ground source heat pump
installations. Each of these takes longer to install
than any other LZC technology included. Although
scenario 2 includes four million ground source
heat pump installations, the longer timescale to
2050 instead of 2020 means that fewer need to
be installed each year, so not so many installers
are required. Scenario 2 therefore results in the
creation of 7,499 FTE jobs. GVA per FTE is higher
in this scenario because there is increased use of
technologies for which a higher percentage of the
cost is converted into GVA.
�0.� Other measures The How low? study has explored the potential
savings from applying all cost-effective measures
possible to the UK housing stock. The modelling
has shown that savings of 22%-36% are
achievable by 2020 from cost-effective measures.
If the more progressive option under scenario 1b
is followed, this would set us on track for cuts
of 80% by 2050 from all measures – including
measures such as further decarbonisation of the
power sector which, although not included in
the modelled cut, would account for about one
third of the carbon reductions by 2050. There are
additional measures and delivery vehicles that
have not been modelled in this study; the two key
additional measures that have not been analysed
are discussed here.

��
commissioned Sustainable Energy Action (SEA)
and Renewable Energy in the Urban Environment
(RENUE) to develop a ‘stretch’ target for the
reduction of carbon emissions from buildings in
London to 2026. The target reduction chosen was
27% of 2000 emissions from buildings.
SEA/RENUE produced five scenarios showing
how this target could be reached in London’s
buildings sector. The large CHP option had the
highest NPV and carbon savings. In this scenario
it is assumed that 2,400MWe of large gas CHP
would be installed by 2026. The report does
not assess the feasibility of this scale of installed
capacity, although it notes that current UK capacity
is approximately 1,800MWe of installed CHP.
In reality, large-scale schemes are difficult to
implement in the existing housing stock as
the upfront capital costs of retrofitting a heat
distribution system are high and there are
additional risks associated with the long-term
security of customers (see ESCOs) below.
An additional significant inhibiting factor on most
potential CHP developments is the aspect of
project management across a large number
of separate businesses and residences. Local
authorities or public bodies are often the only
organisations that own or operate enough
heat-load to make a sizeable CHP development
financially viable and practical from a management
perspective.
The current regulatory system and financial
incentives therefore mean that the involvement of
a local authority or housing association would be
essential to implementing this type of scheme – i.e.
a not-for-profit (NFP) organisation willing to take
on the perceived risks of the development. For
example, a hospital in Bath proved an excellent
economic case for CHP, which was strengthened
further by its inclusion in the EU ETS; however, the
case was weakened by the inclusion of housing
and other large heat users. In this instance, the
hospital energy manager is unlikely to extend
the system to the local housing without further
incentive as this will add both cost and risk.
Retrofitting CHP and district heating in the existing
housing stock is likely to require leadership from an
agency with a vested interested in the carbon or
fuel cost savings achieved. If the agency is based
locally and/or has an existing relationship with the
householder, then securing a supply contract will
be far more straightforward.
The Aberdeen Heat & Power Co58 is an example
of an arm’s length management organisation
(ALMO), specifically set up to facilitate the
installation of CHP in four multi-storey blocks,
totalling 19 storeys and 288 flats. The council-
owned properties were precast concrete panel,
cavity construction with electric storage heating.
Residents were experiencing significant levels of
fuel poverty and the council undertook a feasibility
study to identify the most cost-effective method
of alleviating fuel poverty. The study considered
various heating options for externally insulated and
un-insulated flats. Heat options included: individual
storage heaters; a central gas boiler; and a gas
CHP plant.
The CHP plant delivered a heat cost of £3.65 per
week to each flat, which was only marginally higher
than the cost for CHP and external cladding of
£3.18. The additional £4.4 million cost of over-
cladding was prohibitive considering the additional
benefit, so the CHP-only system was chosen. The
council’s capital budget would not have been able
to meet the £1.6 million capital cost of the project.
An ALMO was therefore set up to coordinate loan
and grant financing with the council making yearly
contributions of £215,000 until the loans are paid.
While the driver for the project was fuel poverty,
the CHP scheme provided the highest carbon
savings of the heat only options, and the highest
NPV of all options.
A third of the cut in
carbon emissions in the
residential sector by
2050 would come from
the decarbonisation of
the power sector.
58 King (2007).
��
© S
MO
RG
AN
/ W
WF-
UK

�8
customers are free to switch irrespective of supply
time. Despite this, energy supply companies
remain in a similar position and could enter
into energy service contracts with residential
consumers if the correct legal framework were in
place. In reality there is currently no incentive for
them to provide energy services that would add
cost and risk to their business model.
In practice, under the current regulatory
framework, residential energy services companies
are most likely to be provided by not-for-profit
organisations. The Aberdeen Heat Company is a
good example of an ESCO model that enabled the
installation of high efficiency CHP, supplying both
carbon savings and low cost power to residential
consumers in high rise tenement blocks.
The business case for ESCOs could be
significantly improved via the introduction of
either a legally mandated cap and trade Supplier
Obligation (see Policy gap analysis) or a system of
Personal Carbon Allowances (PCAs). A cap and
trade Supplier Obligation, as strongly supported
by WWF60, would encourage energy suppliers to
reduce the emissions of their existing customer
base and/or acquire low emissions customers. The
provision of attractive energy services over a longer
period of time would enable energy suppliers to
both retain and acquire customers. In effect, this
would provide a business model whereby energy
suppliers would maximise profits by providing the
least amount of energy necessary to the widest
customer base.
Personal Carbon Allowances (PCAs) would provide
an incentive for monitoring personal consumption
of carbon and assign a value to carbon in the
public realm. The need to both monitor and
reduce a valuable commodity lends itself to
Carbon Service Companies (CSCs) providing
services to fuel rich households. It is important to
note that a system of PCAs and a cap and trade
Supplier Obligation could not be implemented
simultaneously as the emissions reductions would
be double counted61.
10.4.2 Energy Service Companies – ESCOsEnergy services include a wide range of activities,
such as energy analysis and audits, energy
management, project design and implementation,
maintenance and operation, monitoring and
evaluation of savings, property management, and
equipment supply. The activities of Energy Services
Companies (ESCOs) can be distinguished from
those of other energy service provider companies
in the following ways:
1 they guarantee the energy savings and/or the
provision of the same level of energy service at
a lower cost;
2 their remuneration is directly tied to the energy
savings achieved; and
3 they can finance or assist in arranging financing
for the operation of an energy system by
providing a savings guarantee.
ESCOs are a potential delivery mechanism rather
than a measure themselves. In theory they provide
an ideal method of supporting the deployment
of sustainable energy measures that are deemed
cost-effective – i.e. that have a positive NPV with a
discount rate of 3.5%. While more commonplace
in the management of public authority buildings
such as schools or hospitals where savings
are achieved from lighting systems and boiler
management controls, they are not widespread
and have had little success in the residential
sector.
The Unlocking the Power House59 report examines
barriers to the deployment of micro-generation
technologies and the support mechanisms
that may overcome them. The report identifies
energy service companies as one mechanism of
supporting their deployment. The 28-day rule was
specifically identified by energy supply companies
as a key barrier to the supply of energy services to
residential customers.
The 28-day rule allowed residential energy customers to change energy supplier within 28 days of the last time they switched (Ofgem).
While the removal of this rule could enable energy
companies to retain customers for longer by
signing them up to long-term energy service
contracts, in reality only 30% of consumers switch
regularly, with 30% never having switched. The
28-day rule has recently been removed, meaning
59 Watson, et al. (2006). 60 wwf.org.uk/filelibrary/pdf/response_defra_evid_so.pdf61 Roberts and Thumim (2006).
�8
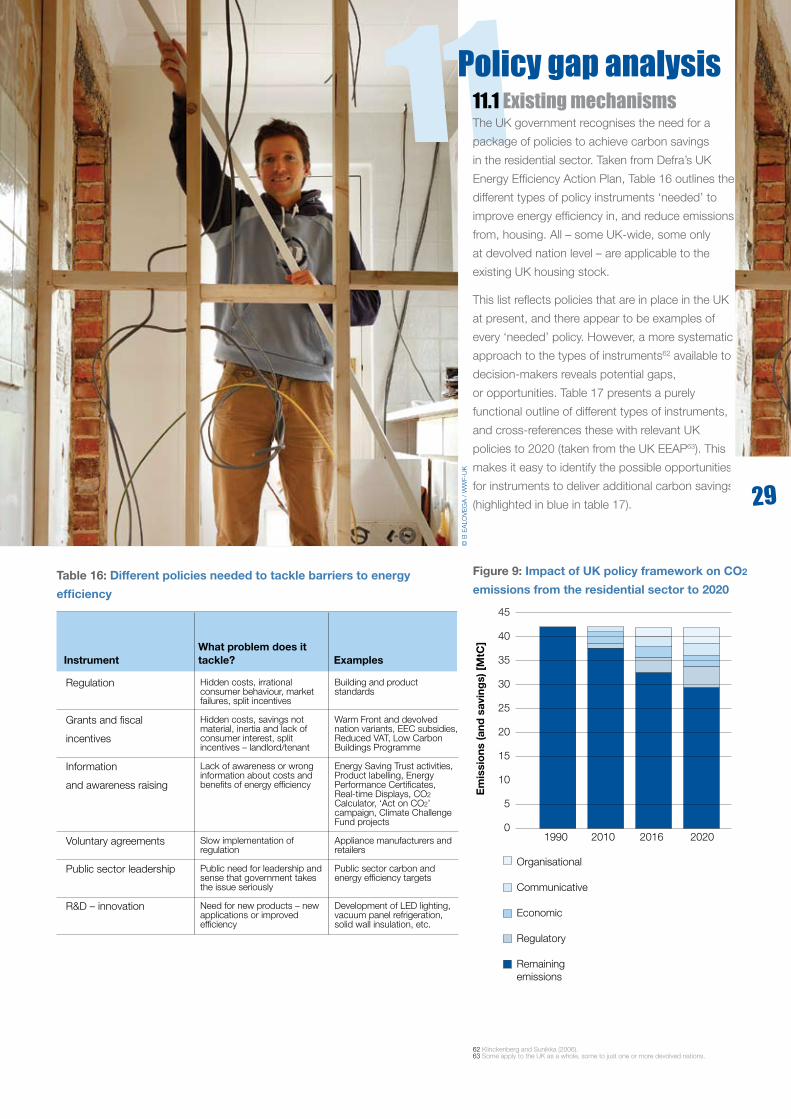
�9
����.� Existing mechanisms The UK government recognises the need for a
package of policies to achieve carbon savings
in the residential sector. Taken from Defra’s UK
Energy Efficiency Action Plan, Table 16 outlines the
different types of policy instruments ‘needed’ to
improve energy efficiency in, and reduce emissions
from, housing. All – some UK-wide, some only
at devolved nation level – are applicable to the
existing UK housing stock.
This list reflects policies that are in place in the UK
at present, and there appear to be examples of
every ‘needed’ policy. However, a more systematic
approach to the types of instruments62 available to
decision-makers reveals potential gaps,
or opportunities. Table 17 presents a purely
functional outline of different types of instruments,
and cross-references these with relevant UK
policies to 2020 (taken from the UK EEAP63). This
makes it easy to identify the possible opportunities
for instruments to deliver additional carbon savings
(highlighted in blue in table 17).
Regulation
Grants and fiscal
incentives
Information
and awareness raising
Voluntary agreements
Public sector leadership
R&D – innovation
Hidden costs, irrational consumer behaviour, market failures, split incentives
Hidden costs, savings not material, inertia and lack of consumer interest, split incentives – landlord/tenant
Lack of awareness or wrong information about costs and benefits of energy efficiency
Slow implementation of regulation
Public need for leadership and sense that government takes the issue seriously
Need for new products – new applications or improved efficiency
Building and product standards
Warm Front and devolved nation variants, EEC subsidies, Reduced VAT, Low Carbon Buildings Programme
Energy Saving Trust activities, Product labelling, Energy Performance Certificates, Real-time Displays, CO2 Calculator, ‘Act on CO2’ campaign, Climate Challenge Fund projects
Appliance manufacturers and retailers
Public sector carbon and energy efficiency targets
Development of LED lighting, vacuum panel refrigeration, solid wall insulation, etc.
InstrumentWhat problem does it tackle? Examples
Table 16: Different policies needed to tackle barriers to energy
efficiency
Policy gap analysis
45
40
35
30
25
20
15
10
5
01990 2010 2016 2020
Organisational
Communicative
Economic
Regulatory
Remaining emissions
Em
issi
ons
(and
sav
ing
s) [
MtC
]
Figure 9: Impact of UK policy framework on CO2
emissions from the residential sector to 2020
62 Klinckenberg and Sunikka (2006). 63 Some apply to the UK as a whole, some to just one or more devolved nations.
�9
45
40
35
30
25
20
15
10
5
01990 2010 2016 2020
Organisational
Communicative
Economic
Regulatory
Remaining emissions
Em
issi
ons
(and
sav
ing
s) [
MtC
]
© B
EA
LOV
EG
A /
WW
F-U
K

�0
Regulatory
Economic
Communicative
Organisational/ framework
Regulatory benefits for above-minimum energy performanceMinimum energy performance requirementsProduct phase-outs and quotasEnergy performance improvement requirements for refurbishmentMinimum energy standards at point of sale
Tax reliefSubsidiesProduct taxEnergy/carbon taxEnergy export/block tariffs performance improvements
Building energy auditsR&D and demonstration projectsVoluntary energy conservation/carbon saving agreementsConsumer advice and promotionProduct labelling
Independent energy auditsProfessional management for multi-family housingEnergy service contractsPublic sector leadershipTraining and accreditation schemesPersonal carbon allowances
Building Regulations (England & Wales 2002, 2006; Scotland 2007), Building a Greener Future – Towards zero carbon homes*64 (includes Code for Sustainable Homes), improved enforcement of the Building Regulations, phase-out of incandescant bulbs
EEC-1, EEC-2, CERT, NI Energy Efficiency Levy, Northern Ireland Environment and Renewable Energy Fund (NI EREF), Fuel Poverty Schemes (Warm Front and Devolved Administration variants), Green Landlord Scheme, reduced VAT rates66, Low Carbon Buildings Programme, Stamp Duty exemptions for zero carbon homes, Scottish Communities and Householder Renewables Initiative
Energy Performance of Buildings Directive (Energy Performance Certificates), metering and billing, Market Transformation Programme (promotion of voluntary product standards), Climate Change Communica-tions Initiative (and Devolved Administration counterparts), Energy Saving Trust advice and promotion activities, appliance energy labelling
Major targets, Supplier Obligation, Planning Policy Statement on Planning and Climate Change, Scottish Planning Policy 6 on Renewable Energy, accreditation of microgeneration technologies (products and installers) Ministerial Interim Planning Policy Statement, Wales
Introducing phased minimum standards for homes65 at point of resale – e.g. no G-rated property can be re-sold after 2010, no F-rated after 2013 and no E-rated ones after 2016
Extending landlord scheme to corporate (not just private) landlords, tariffs for exported electricity
Series of demonstration projects
Type InstrumentsRelevant UK-wide instruments to 2020
Proposed UK instruments to 2020
Table 17: Possible instruments compared with relevant
UK instruments to 2020
The impact of the current policy framework on UK
residential emissions outlined by the government
to 2020 is illustrated in Figure 9.
64 Consultation paper – representative of aim for all new homes to be zero carbon (CLG, 2007). 65 Boardman (2007). 66 Covering all (professional installation of) insulation, draught stripping, hot water and central heating controls; solar panels, wind and water turbines, ground-source and air-source heat pumps and micro-CHP; wood-fuelled boilers.

��
Significant lowering of the threshold (below 1,000 sq m) at which minimum energy performance requirements must be applied to buildings undergoing major renovations
EU minimum standards for energy performance of components (e.g. windows, passive heating/cooling)
EU minimum efficiency requirements for electricity/heating/cooling plant smaller than 20MW (includes district heating and micro-CHP)
EU plans to expand lowered rates of VAT on energy efficient appliances and equipment
EU development of teaching aids to be included in primary, secondary and vocational educational curricula
EU proposals for more detailed metering and billing requirements
Possibility of an EU-wide white certification scheme
EU Commission will seek to identify and remove legal barriers to ESCOs
Remove the threshold for major renovations to capture all dwellings
Extend lowered rates of VAT to all ‘Energy Saving Recom-mended’ appliances and equipment, including for DIY
Introduce Stamp Duty and council tax rebates linked to Energy Performance Certificate recommendations
Develop and implement home refurbishment low-interest loans, contingent on refurbishment incorporating low-carbon
Introduce block tariffs on the back of smart meters
Full public consultation and debate on personal carbon allowances/carbon tax from 2011, with a view to introducing either from 2020
Mandate the rollout of smart energy meters67 with an agreed industry standard for connectivity to energy displays
Full public consultation and debate on personal carbon allowances/carbon tax from 2011, with a view to introducing either from 2020
Regulatory
Economic
Communicative
Organisational/ framework
Type
In the pipeline from Europe to the UK (prior to 2020)
Further proposals (including post-2020) – UK wide)
Table 18: Potential mechanisms – in the pipeline and beyond ��.� Potential mechanismsJust because there is a gap in policy types
available does not mean they are necessary in the
UK’s policy mix. However, given the scale of what
might have to be achieved by 2020 and 2050, all
available tools need to be considered. The most
significant omissions from the UK’s current and
future policy mix are financial (as opposed to fiscal)
instruments – a subset of ‘economic’ instruments.
The post-2011 Supplier Obligation has been
categorised as an ‘organisational/framework’
instrument because energy suppliers are likely to
have the flexibility to implement their own choice
of ‘economic’ and ‘communicative’ instruments to
achieve their obligations – as they currently have
under the Energy Efficiency Commitment.
Table 18 outlines policies that go beyond what is
stated in the UK Energy Efficiency Action Plan,
based in the first instance on what is in the pipeline
following the European Commission’s ‘Action
Plan on Energy Efficiency’, and what further
mechanisms are necessary to minimise emissions
from housing.
67 ‘Smart’ meters are broadly defined by their ability to provide real-time and historical energy consumption and cost information, to both households and energy suppliers (two-way). Energy displays, additionally, provide the information in a more accessible and interactive form.
��

��
��.� Deployment strategy – key supporting mechanisms The review of existing literature and research
findings has uncovered a number of key
mechanisms that may have a direct influence on
or benefit to the implementation of the measures
here. The mechanisms and the timeframe
associated with them have been summarised here.
11.3.1 Low interest loans for energy (German model) – 2008-20Measures – Scenario 1b measuresBorrowers are able to take out low interest loans
for measures that help older properties reach new-
build standard through refurbishment (only pre-
1984 dwellings are eligible for the loans scheme).
Upon reaching this standard, the government will
repay 10% of the loan to the householder. Prior
to 1 June 2006, the government repaid 15% for
meeting this condition. The contribution fell from
15% to 10% because of the rapid update and the
increase in people reaching new-build standard
with their refurbishments. In other words, this has
been a huge success, with solely voluntary take-up
at present.
Up-to-date features of the loans include:
a fixed (and heavily subsidised) interest rate
for 10 years – the rate varies depending on
the loan amount and duration, and is revised
annually;
repayment over 4 to 30 years;
up to €50,000 per dwelling, regardless of which
package (see below) is chosen;
loans can cover 100% of the investment, as
well as labour cost and secondary costs, such
as scaffolding;
flexible repayment (increasing repayments
incurs no additional cost);
can be used in combination with other (non-
energy) refurbishment loans – for example,
additional subsidised finance can be used for
including added individual measures (the CO2
refurbishment programme can only finance
packages of measures, see below); and
ESCOs carrying out refurbishments are eligible
for the loan.
Furthermore, the programme takes a ‘whole
house’ view. To be eligible for finance,
refurbishments must achieve a reduction in CO2
emissions of 40kg/m2/year. This is to be achieved
through one of five packages of measures on offer.
Packages 1 to 4 are different combinations of:
loft insulation, wall insulation, basement ceiling/
ground floor insulation, window ‘renewal’, heating
‘renewal’, and fuel switching. These packages can
be applied to most dwellings, and are ‘guaranteed’
to achieve the required reduction if fully applicable.
Package 5 is designed for unusual cases or
buildings that already have some measures
installed, and is more tailor-made. Under package
5, a certified expert will help determine the
measures necessary for achieving the emissions
reduction.
11.3.2 Fiscal Incentives – 2008 onwardsMeasures – Scenario 1a and 1b
It is vital that the government employs a suite
of economic instruments to encourage the
development of more energy efficient homes (and
sustainable homes more widely). In particular the
report recommends the Government reduces
the rate of VAT on energy efficiency measures,
introduces stamp duty rebates (which could
be easily linked to the deployment of minimum
standards at point of sale, as set out in 11.3.3),
provides a nationwide council tax rebate system
and ensures that the appropriate grant funding for
fuel poverty measures (Warm Front) and LZC (Low
Carbon Buildings Programme) are sustained and
increased in line with the identified need.
Value Added Tax (VAT)
The rate of VAT on energy efficiency measures
should be reduced, to perhaps 5 per cent, on; the
supply and installation of energy efficient products
or materials; DIY energy saving materials bought
by householders; and the most energy efficient
equipment, i.e. appliances and products. In terms
of the equipment and appliances that could be
covered by reduced VAT, the report team suggests
the inclusion of energy efficient products such as
micro-CHP, lights, insulation and appliances68.
Widespread council tax
rebates would provide
a simple opportunity
to reward sustainable
actions, and help
change the perception
that environmental
action is somehow
‘painful’.
68 Defined as A-rated / Energy Saving Recommended (ESR)
��
© ir
tsur
veys
.co.
uk
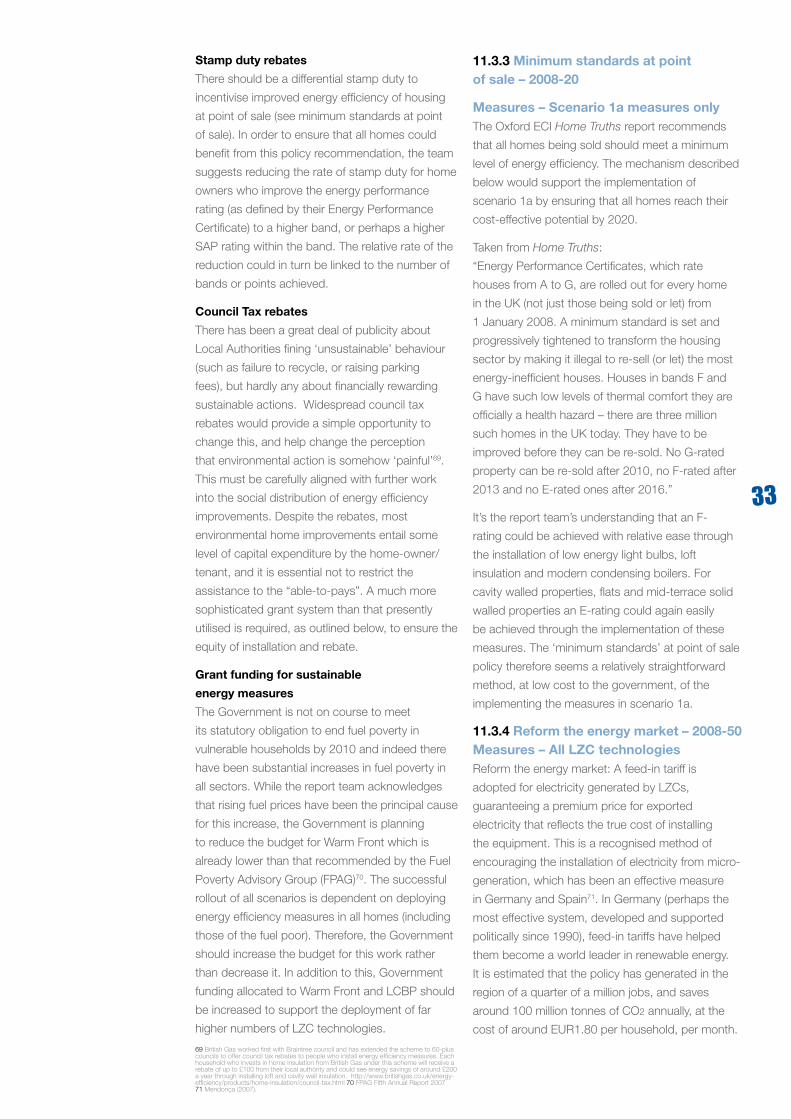
��
Stamp duty rebates
There should be a differential stamp duty to
incentivise improved energy efficiency of housing
at point of sale (see minimum standards at point
of sale). In order to ensure that all homes could
benefit from this policy recommendation, the team
suggests reducing the rate of stamp duty for home
owners who improve the energy performance
rating (as defined by their Energy Performance
Certificate) to a higher band, or perhaps a higher
SAP rating within the band. The relative rate of the
reduction could in turn be linked to the number of
bands or points achieved.
Council Tax rebates
There has been a great deal of publicity about
Local Authorities fining ‘unsustainable’ behaviour
(such as failure to recycle, or raising parking
fees), but hardly any about financially rewarding
sustainable actions. Widespread council tax
rebates would provide a simple opportunity to
change this, and help change the perception
that environmental action is somehow ‘painful’69.
This must be carefully aligned with further work
into the social distribution of energy efficiency
improvements. Despite the rebates, most
environmental home improvements entail some
level of capital expenditure by the home-owner/
tenant, and it is essential not to restrict the
assistance to the “able-to-pays”. A much more
sophisticated grant system than that presently
utilised is required, as outlined below, to ensure the
equity of installation and rebate.
Grant funding for sustainable
energy measures
The Government is not on course to meet
its statutory obligation to end fuel poverty in
vulnerable households by 2010 and indeed there
have been substantial increases in fuel poverty in
all sectors. While the report team acknowledges
that rising fuel prices have been the principal cause
for this increase, the Government is planning
to reduce the budget for Warm Front which is
already lower than that recommended by the Fuel
Poverty Advisory Group (FPAG)70. The successful
rollout of all scenarios is dependent on deploying
energy efficiency measures in all homes (including
those of the fuel poor). Therefore, the Government
should increase the budget for this work rather
than decrease it. In addition to this, Government
funding allocated to Warm Front and LCBP should
be increased to support the deployment of far
higher numbers of LZC technologies.
11.3.3 Minimum standards at point of sale – 2008-20
Measures – Scenario 1a measures only The Oxford ECI Home Truths report recommends
that all homes being sold should meet a minimum
level of energy efficiency. The mechanism described
below would support the implementation of
scenario 1a by ensuring that all homes reach their
cost-effective potential by 2020.
Taken from Home Truths:
“Energy Performance Certificates, which rate
houses from A to G, are rolled out for every home
in the UK (not just those being sold or let) from
1 January 2008. A minimum standard is set and
progressively tightened to transform the housing
sector by making it illegal to re-sell (or let) the most
energy-inefficient houses. Houses in bands F and
G have such low levels of thermal comfort they are
officially a health hazard – there are three million
such homes in the UK today. They have to be
improved before they can be re-sold. No G-rated
property can be re-sold after 2010, no F-rated after
2013 and no E-rated ones after 2016.”
It’s the report team’s understanding that an F-
rating could be achieved with relative ease through
the installation of low energy light bulbs, loft
insulation and modern condensing boilers. For
cavity walled properties, flats and mid-terrace solid
walled properties an E-rating could again easily
be achieved through the implementation of these
measures. The ‘minimum standards’ at point of sale
policy therefore seems a relatively straightforward
method, at low cost to the government, of the
implementing the measures in scenario 1a.
11.3.4 Reform the energy market – 2008-50Measures – All LZC technologiesReform the energy market: A feed-in tariff is
adopted for electricity generated by LZCs,
guaranteeing a premium price for exported
electricity that reflects the true cost of installing
the equipment. This is a recognised method of
encouraging the installation of electricity from micro-
generation, which has been an effective measure
in Germany and Spain71. In Germany (perhaps the
most effective system, developed and supported
politically since 1990), feed-in tariffs have helped
them become a world leader in renewable energy.
It is estimated that the policy has generated in the
region of a quarter of a million jobs, and saves
around 100 million tonnes of CO2 annually, at the
cost of around EUR1.80 per household, per month.
69 British Gas worked first with Braintree council and has extended the scheme to 60-plus councils to offer council tax rebates to people who install energy efficiency measures. Each household who invests in home insulation from British Gas under this scheme will receive a rebate of up to £100 from their local authority and could see energy savings of around £200 a year through installing loft and cavity wall insulation. http://www.britishgas.co.uk/energy-efficiency/products/home-insulation/council-tax.html 70 FPAG Fifth Annual Report 200771 Mendonça (2007).
© ir
tsur
veys
.co.
uk

��
A renewable heat obligation should be introduced
requiring a proportion of household heat to come
from LZC sources. It would be complemented by a
properly delineated and monitored green gas tariff.
Energy tariffs are reformed so that they reward
energy saving rather than high consumption.
11.3.5 Supplier Obligation – 2011-20Measures – Most likely those under scenario 1bThe Supplier Obligation (SO) is the successor
to the Carbon Reduction Commitment (which
itself is the successor to the current Energy
Efficiency Commitment), and will start in 2011. The
government is currently looking at possible designs
for the SO.
A recent (August 2007) study by Centre
for Sustainable Energy, in response to the
government’s call for evidence as part of the
process of designing the SO, examined the social
impacts relating to a cap-and-trade supplier
obligation. Such a supplier obligation would
potentially create far more significant changes
in energy supplier practices compared with the
possible alternative of a further development of
a measures-based approach, as characterised
by the Energy Efficiency Commitment (EEC) and
forthcoming Carbon Emission Reduction Target
(CERT). Not least among these changes is that
suppliers would be required to reduce the carbon
emissions of only their own customers; measures-
based approaches have not, to date, featured this
focus.
11.3.6 Personal Carbon Trading (PCT)/carbon taxes – 2015/20 to 2050Measures – Unknown, dependent on the public’s personal opportunity and willingness to actPersonal Carbon Trading (PCT) is potentially a
very effective, fiscally progressive measure for
carbon reduction in the household sector, but
further research is needed into the likely equity and
distributional impacts of such a system, and its
technical feasibility, before public acceptability is
tested. Under a system of PCT a trusted agency
or body would set the overall cap for emissions
with the size of the cap defining the carbon saving
achieved.
A possible outcome of PCT would be that richer
households, which tend to be high carbon
emitters, will seek measures to reduce carbon
emissions from their household energy use, or buy
carbon allowances from others. Those with carbon
allowances to sell are likely to be less well-off
households, who may then use the money they
gain from selling allowances to take measures to
reduce their energy use, freeing up more carbon
allowances for them to sell in the future.
Carbon taxes are a more regressive72 measure
which are easier to administer than a system
of PCT. However, their ability to reduce carbon
emissions is dependent upon the elasticity of the
market place – i.e. the rate at which the change
in cost is translated to a change in demand. The
price of cigarettes is an excellent example of a
commodity where increasing price has had little
effect on demand, which is of course in part
linked to the end users’ nicotine addiction. It
could be argued that we are addicted to oil, with
petrol prices now equalling the highest point in
the 1970s. These prices have not resulted in a
wholesale change in end-user transport behaviour,
such as increased cycling or public transport use,
so why would one assume carbon taxes would do
so in the future.
Prior to the introduction of either carbon taxes
or PCTs, the government must seek a better
understanding of the distribution of emissions
by household; those households that stand to
lose and gain; and the opportunities that these
households have to reduce their emissions. The
impact of PCTs depends upon the cap placed
on total emissions and the associated share
distributed to the public. It is likely that the first
five years of a PCT scheme would cut the ‘carbon
fat’ – or the wastage that can easily be trimmed
by simple behavioural changes and consumer
purchasing decisions.
��.� Overview The How Low? report joins a growing body
of research that demonstrates an 80% cut by
2050 is feasible with negligible impact on the UK
economy. The IPPR, RSPB, WWF report, 80%
Challenge: Delivering a low-carbon UK and the
Oxford ECI Home Truths report both agree that
the residential sector can meet this target, with
the 80% Challenge study recommending further
savings to offset growth in other sectors. While
these studies don’t necessarily agree on the platter
72 See http://en.wikipedia.org/wiki/Regressive_tax (Wikipedia, 2007).

�5
of measures required to achieve the 80% cut, they
suggest that the most cost-effective sustainable
energy measures must be applied to the residential
sector first – preferably by 2020. It will be required
to deliver savings in all sectors, but the residential
sector is an early and strong priority.
The government’s 2007 budget presented the
aim that: ‘by the end of the next decade, all
householders will have been offered help to
introduce energy efficient measures with the
aim that, where practicably possible, all homes
will have achieved their cost-effective energy
efficiency potential’. The How Low? study
examined the potential carbon reductions from the
residential sector based on the government’s own
definition of cost-effectiveness and our own more
meaningful definition looking at lifetime benefits
of measures. However, a strict interpretation of
government policy would indicate that a cost
for carbon must be incorporated into this cost-
effective definition for policy decision-making.
Scenario 1a, based on the government’s definition,
achieved a 9.3MtC reduction (33.1 MtC total
emissions), which falls short of both the National
Energy Efficiency Action Plan (NEEAP) and Climate
Change Bill targets (apportioned to the housing
sector) of 29.3 and 28.8-31.4MtC respectively.
Our more meaningful definition of cost-effective,
scenario 1b, exceeded both these targets,
achieving a 14.7MtC reduction. This conclusion
concurs with the findings of the recent BRE study
Delivering cost-effective carbon savings to existing
homes by 2020, which showed there is significant
potential for savings from solid wall insulation,
efficient glazing, floor insulation and renewable
generation technologies between now and 2020.
Scenario 1b relies on the deployment of significant
numbers of solid wall insulation and LZC
technologies. If the government is to only achieve
the savings associated with Scenario 1a by 2020,
it must still ensure that significant numbers of
insulation and heating measures are implemented.
However, these savings are dependent on
householders taking these measures when they
are offered them, which will require them to have a
vested interest in taking those measures; a better
understanding of their own energy use and carbon
emissions; and more engaging and creative
marketing techniques.
The 80% reduction in residential emissions by
2050 is achievable under scenario 2b. This
requires the implementation of the modelled
sustainable energy improvements, projected
improvements in the efficiency of appliances, the
decarbonisation of electricity, green gas, and a
20% improvement in energy use behaviour. In
order to implement scenario 2b by 2050, we will
need to first implement scenario 1b by 2020.
In February 2007, the IPCC released a summary
of the forthcoming Fourth Assessment Report.
According to this summary, the Fourth Assessment
Report finds that human actions are “very likely” to
be the cause of global warming, meaning a 90%
or greater probability73. There is consensus among
the scientific community that an 80% reduction in
residential carbon emissions by 2050 is possible.
It is clear that we need to act now if we are to
meet this 2050 target, which will require the
government to introduce strong supporting
policies and provide further financial support for
sustainable energy measures. The £2.6-£3.5 billion
per year required to deliver the residential sector
measures in Scenario 2b is minimal compared
to the cost of doing nothing. The Stern Review74
estimated the cost to the economy of mitigating
the harmful impacts of climate change to be 10
times that of acting now. For scenario 2b, the total
benefit per £1 invested is less than £1, but if the
cost of LZC technologies falls in line with RAB
predictions, total cost will fall by approximately
£43 billion to under £113 billion, giving savings per
£1 invested of between £0.99 and £1.05. In this
instance the economic benefit therefore matches
the investment made.
The findings of this study provide a further
imperative for the government to introduce a
framework of policies and mechanisms that ensure
these measures are implemented. The introduction
of further funding through direct subsidy such
as LCBP, or regulation such as CERT, will not
necessarily ensure that this implementation
occurs. The public needs to have a stake in the
implementation of these measures in their own
homes, which will require the measures to deliver
tangible benefits – for example, increasing the
value of their property or saving tradable/taxable
carbon emissions.
73 http://news.bbc.co.uk/1/hi/sci/tech/6321351.stm 74 Stern (2007).
�5

�6
BBC. “Climate bill sets carbon target.” BBC News. 15
November 2006. http://news.bbc.co.uk/2/hi/science/
nature/6148416.stm (accessed 8 February 2008).
BERR. Strategic Environmental Assessment for
Offshore Oil & Gas Licensing and Wind Leasing.
Scoping for environmental report, London:
Department for Business Enterprise & Regulatory
Reform, 2007.
Black, R. “Humans blamed for climate
change.” BBC News. 2 February 2007.
http://news.bbc.co.uk/2/hi/science/nature/6321351.
stm (accessed 11 February 2008).
Boardman, B. Home Truths: A low-carbon strategy
to reduce UK housing emissions by 80% by 2050.
Environmental Change Institute, Oxford: University of
Oxford, 2007.
Carbon Trust. Micro-CHP Accelerator – Interim
report. Research, London: The Carbon Trust, 2007.
CLG. Building a Greener Future: policy statement.
Planning, building and the environment, West
Yorkshire: Communities and Local Government
Publications, 2007.
Council of the European Union. “Brussels
European Council – 8/9 March 2007; Presidency
Conclusions.” Brussels: 2 May 2007.
Darby, S. The Effectiveness of Feedback on Energy
Consumption. Literature review, Environmental
Change Institute, University of Oxford, Oxford:
University of Oxford, 2006.
Defra. Climate Change – The UK Programme 2006.
London: The Stationery Office, 2006.
Defra. The Social Cost of Carbon And The Shadow
Price of Carbon: What They Are, And How To Use
Them in Economic Appraisal In The UK. Economics
Group, London: Department for Environment, Food
and Rural Affairs, 2007.
Defra. UK Energy Efficiency Action Plan 2007.
London: Defra, 2007.
Element Energy & EST. The Role of Onsite Energy
Generation in Delivering Zero Carbon Homes.
London: Renewables Advisory Board, 2007.
Guertler, P, Moore, R and Preston, I. The Impact
of Rising Fuel Prices in the Managed Housing Sector.
Research, London: Energy Efficiency Partnership for
Homes, 2007.
HM Treasury. Budget 2007: Building Britain’s long-
term future. London: The Stationery Office, 2007.
Höhne, N, Phylipsen, D and Moltmann, S. Factors
underpinning future action – 2007 update. Report for
Defra, Cologne: Ecofys, 2007.
IPCC. Fourth Assessment Report – Climate Change
2007: Synthesis Report. Cambridge: Cambridge
University Press, 2007.
IPPR, WWF and RSPB. 80% Challenge: Delivering
a low-carbon UK. London: Institute of Public Policy
Research, 2007.
King, M. Conference: The next frontier for sustainable
energy – tackling the third of homes that are hard-to-
treat London: Energy Efficiency Partnership for Homes
(31 October 2007).
Klinckenberg, F and Sunikka, M. Better Buildings
Through Energy Efficiency: A Roadmap for Europe.
Brussels: Eurima, 2006.
Mendonça, M. Feed-In Tariffs – Accelerating the
Deployment of Renewable Energy. London: Earthscan,
2007.
Moore, R, Preston, I and Guertler, P. How Much?
The cost of alleviating fuel poverty in England.
Research, Penrith: Eaga PCT, 2008.
MTP. About MTP. 2008. www.mtprog.com/AboutMTP.
aspx (accessed 11 February 2008).
—. What-If? Tool: Home. Market Transformation
Programme. 4 December 2007. http://whatif.mtprog.
com (accessed 8 February 2008).
Panthol Ltd. “Consideration of Bio-gas in the Reform
of the Renewables Obligation Order.” Submissions to
the DTI consultation on ‘Reform of the Renewables
Obligation & Statutory Consultation on the Renewables
Obligation Order 2007’. Department for Business
Enterprise & Regulatory Reform, January 2007.
RCEP. Energy – The Changing Climate. London: The
Stationery Office, 2000.
Roberts, S and Thumim, J. A Rough Guide to
Individual Carbon Trading: The ideas, the issues and
the next steps. London: Defra, 2006.
Roberts, S, White, V, Preston, I and Thumim, J.
Assessing the Social Impacts of a Supplier Obligation.
Bristol: Centre for Sustainable Energy, 2007.
SDC. Building houses or creating communities?
London: Sustainable Development Commission, 2007.
Stern, N. The Economics of Climate Change: The
Stern Review. Cambridge: Cambridge University
Press, 2007.
Watson, J, Sauter, R, Bahaj, B, James, PA, Myers,
L and Wing, R. Unlocking the Power House: Policy
and system change for domestic micro-generation
in the UK. Research, University of Sussex, University
of Southampton, Imperial College London, Brighton:
University of Sussex, 2006.
Wikipedia. “Regressive tax.” Wikipedia. Edited by
various. 2007. http://en.wikipedia.org/wiki/Regressive_
tax (accessed February 11, 2008).
Zavody, Z. “Pathway to zero-carbon homes.” eceee
2007 Summer Study proceedings. La Colle sur Loup:
European Council for an Energy Efficieny Economy,
2007.
Bibliography
�6

��
����.� Overriding scenario criteria
Scenario 1a – The ‘cost-effective measures’
selected were defined by Gordon Brown, as
then Chancellor, in the 2007 Budget statement.
Scenario 1b – These measures were deemed
cost-effective by the report team’s analysis of
measures, and packages thereof, that have a
positive NPV (see Annex II).
Scenario 2 – This scenario included all
measures.
The platter of measures applied under each
scenario was then subjected to the
following criteria that limit their application
to suitable sites and ensure that the most
pragmatic measures are applied.
��.� General criteria Where they can be fitted, low cost insulation
measures such as draught-proofing, loft
insulation and cavity wall insulation (plus cfls
– low energy light bulbs) are fitted in preference
to all other measures.
Where property is in a gas supply area, a gas
condensing boiler is next selected if the above
insulation measures fail to provide the required
saving.
Where the property is off-gas, an oil condensing
boiler is generally selected as the next most
appropriate measure.
An LPG condensing boiler may be next
selected where there is already an existing LPG
boiler and bulk storage tank and the property is
off-gas.
Renewable energy measures are applied
only where the above heating and insulation
measures fail to provide the required saving.
Heating measures are only selected without
insulation measures where the dwelling
already has a satisfactory existing level of
draught-proofing, loft insulation and cavity wall
insulation.
In solid wall dwellings, condensing boilers alone
can be installed if there is no external or internal
insulation, provided the other elements are
insulated to a satisfactory standard.
Ground or air source heat pumps are only
installed where the dwellings are fully insulated,
including solid wall insulation.
��.� Specific criteria for insulation measures Draught stripping is confined to single glazed
windows and doors.
Double glazing is confined to single glazed
windows and doors.
Existing draught-proofed and double glazed
windows are considered to be already
satisfactorily draught-proofed, but double
glazing can be installed to replace fully draught-
proof single glazing.
Loft insulation is only installed in houses and not
flats. (The latter includes top floor flats as the
Fuel Prophet model does not provide energy
savings from LI for these.)
Insulation for flat roofs is assumed to give the
same savings as LI but to cost three times as
much to install.
Loft insulation, including top-up insulation,
is limited to dwellings that have existing loft
insulation of below 125mm.
Existing loft insulation greater than 125mm is
considered to be already satisfactory.
All totally un-insulated cavity walls are assumed
to be suitable for cavity insulation, unless in a
severely exposed location.
External wall insulation is not selected for
listed buildings with solid walls or homes in a
conservation area.
Internal wall insulation is not selected for
individually listed buildings with solid walls and/
or where the habitable rooms are already small.
Annex I – Model criteria

�8
��.� Specific criteria for heating measures A condensing boiler is not selected where the
existing boiler is a condensing or combi boiler
or CHP system and less than five years old.
A condensing boiler is not selected where the
existing boiler is another type and less than
three years old.
Boilers of less than three and five years old
can be replaced if another fuel and/or heating
system is required.
Oil and LPG-fired heating is only upgraded
using the same fuel in off-gas areas.
Ground source heat pumps are only selected
for houses and bungalows (not flats) and where
the garden is 25 metres in depth or larger.
Air source heat pumps are only selected where
the total floor area of the house, bungalow or
flat is less than 60 square metres.
Biomass boilers are not selected where the
area has gas, for flats, or where the youngest
occupant is aged 60 years or over .
Solar hot water (SHW) installations are not
selected for flats or houses/bungalows with flat
roofs or for any dwellings that are listed or in
a conservation area. The model also limits the
application to a representative number of south-
oriented roof spaces.
The Fuel Prophet model does not record the
separate savings or installation cost of improved
heating controls, but allows for modern heating
controls in the savings and installation costs given
for new heating appliances. The latter are thereby
included in the model wherever a new heating
boiler/system is installed. Similarly, the new AFP
does not include hot water tank insulation, but
again this is covered where new heating is installed,
for example by using a condensing combi boiler.
��.5 Specific criteria for electricity generation measures Solar photovoltaics are not selected for flats
or houses/bungalows with flat roofs or for any
dwellings that are listed or in a conservation
area. The model also limits the application to a
representative number of south-oriented roof
spaces.
The model has applied a 6kW Proven and an
Ampair 600 to the housing stock. The model
limits the application to exposed sites with
sufficient numbers of storeys (dependent upon
exposure).
��.6 Criteria for GVA assumed
Cavity wall insulation
Loft insulation
Hot water tank insulation
Draught proofing
External wall insulation
Internal wall insulation
Replacement boilers
Central heating systems
Oil central heating and replacement
Ground source heat pumps
ASHP
Biomass boilers
Solar water heating
Micro-CHP
Solar PV
Micro wind
40%
25%
5%
10%
25%
25%
30%
30%
30%
30%
30%
30%
30%
30%
30%
30%
Measure GVA

�9
Packages of measures installed in England under Scenario 1a
1 cfls only
2 dp only
3 dp + cfls
4 cwi only
5 li only
6 insl
7 li + cwi
8 insc
17 gcb only
18 insl + gcb
19 insc + gcb
31 ocb
36 insl + ocb
38 insc + ocb
117 pcb only
118 insl + pcb
119 insc + pcb
Total packages
52.2
46.0
46.0
53.8
50.6
18.9
50.8
49.7
56.8
47.0
63.5
37.7
31.7
48.7
25.8
17.2
25.8
52.4
27
229
294
156
349
311
444
365
1,570
1,380
1,474
1,533
1,012
935
1,301
1,342
1,659
927
1,180,052
12,395
1,868,190
291,728
3,933,813
325,249
3,369
1,122,924
228,783
4,447,953
6,135,024
4,433
401,781
939,731
12,003
13,013
10,664
20,931,105
5.6
0.1
8.9
1.4
18.8
1.6
0.0
5.4
1.1
21.3
29.3
0.0
1.9
4.5
0.1
0.1
0.1
100.0
31,580,000
2,842,000
549,423,000
45,613,000
1,372,121,000
101,166,000
1,494,000
410,363,000
359,078,000
6,136,516,000
9,045,943,000
6,796,000
406,627,000
878,574,000
15,613,000
17,468,000
17,689,000
19,398,907,000
54.2
48.7
50.0
72.4
53.8
23.6
59.6
70.2
73.0
60.5
94.7
50.1
45.8
73.4
43.0
46.9
84.3
68.5
Packages*Av. SAP ratingsbefore after
Average Total costcost (£) (£)
Householdsnumber percent
�� cfl compact fluorescent lights
dp draught proofing
cwi cavity wall insulation
li 270mm loft insulation
iwi internal wall insulation
dg double glazing
wri wall reform insulation
ewi external wall insulation
Insulation packages
insl insulation package with LI only
insc insulation package with cavity insulation
insi insulation package with internal wall insulation
insw insulation package with wall reform insulation
inse insulation package with external wall insulation
Heating measures
gcb gas condensing boiler
chp micro-chp
ashp air source heat pump
bio biomass boiler
ocb oil condensing boiler
gshp ground source heat pump
Pcb LPG condensing boiler
Renewables
SHW solar hot water
MWT micro wind turbine
SPV solar photovoltaic
Single insulation measures and low energy lighting
�9
Annex II – Packages of measures
by scenario©
B E
ALO
VE
GA
/ W
WF-
UK

�0
Packages of measures installed in England
under Scenario 1b
8
8.2
10
12
12.2
15
16
17
18
19
21
21.2
22
23
24
27
29
32
32.2
37
42
42.2
51.2
52
53
57
57.2
65
66.2
72
80
88
91.2
95
119
132
Total packages
insc
insc + SPV
cwi dg
insi
insi + SPV
insc + SHW
li cwi dg
ccb
insl + gcb
insc + gcb
chp
chp + SPV
insi + SHW
insw
ashp
insc+chp
insl+bio
insi+ccb
insi+gcb+SPV
insc+gcb+SHW
gshp
gshp + SPV
insc+gshp+SPV
inse
insl+ashp+SHW
insi+ocb
insi+ocb+SPV
gshp + SHW
insi+gshp+SPV
insc+gshp+SHW
insi+gshp+SHW
inse+ocb
inse+gshp+SPV
inse+gshp+SHW
ins+pcb
insi+pcb
53.5
39.8
35.0
58.9
43.7
43.3
26.5
34.1
30.3
53.1
60.0
33.7
19.7
44.6
38.7
46.7
43.1
44.7
35.7
38.7
48.2
37.0
21.9
13.6
25.9
4.1
46.3
37.1
14.6
19.1
1.0
16.8
53.4
34.0
25.9
16.1
52.4
550
6,900
2,342
801
7,869
2,870
6,192
4,167
3,431
1,823
2,679
11,253
3,564
4,594
3,000
3,348
4,697
2,573
10,334
6,353
5,616
12,591
10,548
2,827
8,248
6,438
10,651
8,674
13,626
10,477
10,295
10,543
12,049
12,221
1,884
2,726
3,712
695,493
251,019
15,150
39,485
656,390
159,819
64,143
34,231
32,581
3,260,895
8,834,288
14,484
24,352
3,809
1,932
56,884
10,508
1,709,548
2,958
50,935
3,269,739
248,335
5,056
28,397
8,179
667
9,441
1,371,882
5,046
1,352
2,202
37,985
709
8,407
7,404
7,400
20,931,105
3.3
1.2
0.1
0.2
3.1
0.8
0.3
0.2
0.2
15.6
42.2
0.1
0.1
0.0
0.0
0.3
0.1
8.2
0.0
0.2
15.6
1.2
0.0
0.1
0.0
0.0
0.0
6.6
0.0
0.0
0.0
0.2
0.0
0.0
0.0
0.0
100.0
382,491
1,732,078
35,485
31,635
5,164,816
458,739
397,155
142,634
111,774
5,946,094
23,671,264
162,982
86,784
17,500
5,796
190,427
49,357
4,398,490
30,569
323,567
18,363,261
3,126,863
53,328
80,267
67,461
4,294
100,561
11,899,198
68,754
14,165
22,669
400,492
8,543
102,738
13,949
20,170
77,686,350
81.2
55.4
68.9
92.0
73.8
90.9
70.4
45.3
48.6
92.9
69.1
58.6
81.8
90.1
112.5
60.7
71.3
90.8
93.5
107.2
120.0
120.0
38.5
47.0
120.0
34.4
76.6
120
97.1
108.8
92.0
79.3
120.0
115.6
75.8
100.6
91.0
Packages*Av. SAP ratingsbefore after
Average Total costcost (£) (£ x 1,000)
Householdsnumber percent
�0

��
��Annex III – Current installation rates and economic statistics for key measures, England
Cav
ity w
all i
nsul
atio
n
Loft
insu
latio
n
Dra
ught
pro
ofin
g
Ext
erna
l wal
l ins
ulat
ion
Inte
rnal
wal
l ins
ulat
ion
Gas
cen
tral
hea
ting
and
repl
acem
ent
Cen
tral
hea
ting
syst
ems
Oil
cent
ral h
eatin
g an
d re
plac
emen
t
Gro
und
sour
ce
heat
pum
ps
AS
HP
Bio
mas
s bo
ilers
Sol
ar P
V
Sol
ar w
ater
hea
ting
Win
d tu
rbin
e
Tota
l
Mea
sure
378,
052
490,
188
245,
080
16,8
02
3,36
0
920,
774
389,
805
62,5
89
105
50 44 340
1,32
0
243
2,50
8,50
9
Tota
l m
easu
res
0.4
0.25
0.3
15 6 1 3 2 13 3.5
8 4 6 2Lab
our
/ jo
b
(day
s) [
1]
859
696
418
1,43
2
115
5,23
2
6,64
4
711
8 1 2 8 45 3 16,1
71
Inst
alle
r (F
TE
) [2]
1,43
2
1,16
0
696
2,38
7
191
8,71
9
11,0
74
1,18
5
13 2 3 13 75 5 26,9
51
Plu
s an
cilla
ry
staf
f [3
,4]
300
262
200
8000
2000
1200
3700
5367
5100
3000
6000
6500
2500
4000
Inst
alle
d c
ost
/ m
easu
re [
5]
£113
,415
,497
£128
,429
,202
£49,
015,
996
£134
,418
,366
£6,7
20,9
18
£1,1
04,9
28,8
15
£1,4
42,2
78,7
15
£335
,891
,895
£536
,400
£150
,000
£266
,824
£2,2
06,9
41
£3,3
00,0
00
£971
,294
£3,3
21,5
59,5
69
Inst
alle
d c
ost
/ m
easu
re [
5]
£45,
366,
199
£32,
107,
301
£4,9
01,6
00
£33,
604,
592
£1,6
80,2
30
£331
,478
,645
£432
,683
,615
£100
,767
,568
£160
,920
£45,
000
£80,
047
£662
,082
£990
,000
£291
,388
£984
,527
,797
Tota
l co
sts
£45,
366,
199
£32,
107,
301
£4,9
01,6
00
£33,
604,
592
£1,6
80,2
30
£331
,478
,645
£432
,683
,615
£100
,767
,568
£160
,920
£45,
000
£80,
047
£662
,082
£990
,000
£291
,388
£984
,527
,797
GVA
£52,
800
£46,
112
£11,
733
£23,
467
£14,
667
£63,
360
£65,
120
£141
,680
£20,
714
£45,
257
£39,
600
£85,
800
£22,
000
£105
,600
£632
,310
GVA
/FT
E
© is
tock
© B
EA
LOV
EG
A /
WW
F-U
K

��
�5Annex IV – Summary of modelled savings
for devolved nations
UK (inc new homes)
UK
England
Wales
Scotland
Northern Ireland
* Doesn’t include decarbonisation of electricity
42.4
42.4
41.7
41.7
34.9
2.2
3.9
0.8
6.2
8.1
6.7
0.5
0.8
0.1
9.5
11.4
10.0
0.3
0.9
0.2
11.6
13.1
11.0
0.5
1.3
0.3
1990 emissions
2004 emissions
Scenario 1a
Scenario 1b
Scenario 2 (modelled)*
Modelled carbon savings (MtC) for England with imputed totals for the
devolved nations and the UK
UK
England
Wales
Scotland
Northern Ireland
19.5%
19.2%
23.0%
21.0%
15.2%
27.4%
28.6%
15.9%
23.0%
28.4%
31.4%
31.6%
22.7%
32.7%
40.3%
Scenario 1a
Scenario 1b
Scenario 2 (modelled)*
Modelled percentage reductions in carbon emissions
for each nation based on 200475 baseline
75 A 2004 baseline has been used here as the breakdown of UK emissions for 1990 are unknown.
��

��
codes of the SHCS and LIW are used to randomly
distribute the Scottish and Welsh samples to the
same fuel or a new fuel, in the same proportions
as those generated by the English improvement
model. Including the use of gas CHP, up to five
fuel switch categories are used for each existing
fuel – for example, solid/gas, solid/CHP, solid/
electricity, solid/solid and solid/oil.
A common variable comprising the 20 generic
dwelling types, 22 possible fuel switches and the
5 SAP bands, and including up to 380 potential
categories, is then computed for the EHCS and
similarly for the SHCS and LIW survey samples.
For the imputation of the installation costs,
the mean cost is determined for each of these
categories from the results of the English model
and then applied to the same categories in
the Scottish and Welsh samples. To determine
the total costs, the imputed means are simply
multiplied by the number of occupied dwellings in
each category in Scotland and Wales. Finally, the
outputs are provided, broken down by each type
of fuel switch, wall type and house/flat type.
To determine the energy savings, the same
380 potential categories are used to impute the
energy requirements for space heating both
before and after improvement. However, as the
energy requirements for water heating, lights and
appliances and cooking are less dependent on the
thermal standard of the dwelling, each of these is
imputed using only 76 categories, derived from the
generic dwelling types and possible fuel switches
alone. Also here the outputs for space and water
heating, lights and appliances and cooking are
provided, broken down by the fuel switch type
alone. As in the calculation of fuel costs in the
EHCS, dual fuel (gas and electric) cookers are
assumed where there is gas heating, with all
electric cookers being assumed elsewhere.
�6�6.� Imputations for devolved nations – Scotland and Wales In the full improvement model, the type of measure
or package selected for each sample dwelling
is governed mainly by the generic dwelling type,
particularly the original heating fuel used, the
wall construction and whether the dwelling is a
house/bungalow or a flat. The selected measure
or package is also defined by the fuel used after
improvement. The extent of measures required is
determined by the existing standard of heating and
insulation in each dwelling prior to improvement.
The imputation is based on the assumption that
dwellings in Scotland and Wales of the same
generic type – i.e. with the same main heating fuel,
wall construction, the same built form, and with the
same level of energy efficiency as those in England
– will require the same type of energy measures
and generate the same savings and improvement
costs.
For the imputation, the full list of 36 generic
dwelling types has been reduced to 20. This
has been achieved by combining non-traditional
construction with solid walls, and by using just
two built forms – houses/bungalows and flats – for
dwellings heated by electricity, solid fuel, oil and
LPG (which tend to be the least frequent generic
types).
Each of these 20 generic dwelling types, however,
has been broken down by the fuel used after
improvement, and by the original level of energy
efficiency. For the final fuel used, six categories are
used: electricity, solid fuel, oil, LPG and gas, with
the latter fuel being sub-divided into that used in a
condensing boiler and that used in CHP systems.
For the level of energy efficiency, five SAP bands
are used – under 35; 35 to 45; 45 to 55; 55 to 65;
and 65 or more – to reflect the existing standard of
heating and insulation.
Like the English Housing Condition Survey (EHCS),
both the Scottish Housing Condition Survey
(SHCS) and Living in Wales (LIW) survey include
the variables required to determine the generic
dwelling type and SAP rating of each sample
dwelling. However, as the fuel after improvement
is unknown for Scotland and Wales, the address
Annex V – Imputation methodology
��

��
the imputed means are simply multiplied by the
number of homes in each category in Northern
Ireland. Finally, the outputs are provided, broken
down by each type of fuel switch and the dwelling
age.
To determine the energy savings, the same 84
categories are used to impute separately the
energy requirements for space heating, water
heating, lights and appliances, and cooking both
before and after improvement. However, the
outputs for space and water heating, lights and
appliances and cooking are provided, broken
down by the fuel switch type alone. As in the
calculation of fuel costs in the EHCS, dual fuel
(gas and electric) cookers are assumed where
there is gas heating, with all electric cookers being
assumed elsewhere.
��
�6.� Northern IrelandEquivalent public datasets to the EHCS, SHCS
and LIW survey are not available for the 2004
Northern Ireland House Condition Survey.
Consequently, for Northern Ireland, the imputation
has had to rely on the tables available in the
2004 Interim House Condition Survey Statistical
Annex, published by the Northern Ireland Housing
Executive.
Although the NIHCS Statistical Annex provides
breakdowns by SAP rating, none of these
particular tables also provides a breakdown with
the main fuel used in the dwelling. The latter
is essential to determining the carbon savings
generated by the energy (kWh) savings. However,
tables of the main heating fuel are provided,
broken down separately by tenure, dwelling age,
built form, location and household characteristics.
Of these, Table 7.2, showing the main fuel by the
dwelling age, has been used in the imputation. Of
the five variables available, the dwelling age/
construction date provides the best proxy for the
thermal standards of the housing.
The list of fuels provided by Table 7.2 includes dual
fuels used for central heating, but the main NIHCS
report records the primary fuel in most of these
cases to be heating oil. The small percentage of
other central heating is assumed to be LPG, while
due to the traditional lack of mains gas in Northern
Ireland, other non-central heating is assumed to be
fuelled by electricity.
As with Scotland and Wales, the fuel used after
improvement is not known. For each original fuel,
the proportion of households switching to each
new fuel is assumed to be the same as generated
by the full improvement model for England. In
this way, the grossed Northern Ireland sample of
680,000 homes is broken down into 22 types of
fuel switch and each fuel switch further divided
into up to five different dwelling ages. Assuming
that, as in England, not all fuel switches have all
five age bands, a common variable combining
the fuel before and after improvement with the
construction date, and comprising a total of 84
different categories, is finally created for both the
Northern Ireland and England HCS samples.
For the imputation of the installation costs, the
mean cost is determined for each of these 84
categories from the results of the English model
and then applied to the same categories in
Northern Ireland. To determine the total costs, © is
tock

�5�5

�6�6
��The study has made a number of conservative
assumptions about the technologies that have
been applied and the magnitude of savings
generated. This conservative approach should
reassure readers that the savings we present are
achievable with concerted government action.
Furthermore, the costs of the measures required
and the magnitude of the savings generated
represent the worst-case scenario. The measures
associated with scenario 2 more than pay for
themselves if projected system costs are used and
the full payback is included – i.e. GVA, lifetime fuel
savings and value of carbon.
��.� Discount rates and cost of carbon Scenario 1b represents a cost-effective scenario
based upon a Treasury 3.5% discount rate for
the savings achieved. The study could have
alternatively looked at those measures deemed
cost-effective when the value of carbon has
been added (see Analysis of cost-effectiveness).
However, the majority of measures become
cost-effective when the value of carbon has been
added; meaning scenario 2, where all measures
are applied, represents this carbon valued
scenario. While this definition of cost-effective
would be even more holistic than that used for
scenario 1b, the installation rates required would
be even more challenging and almost certainly not
possible by 2020.
��.� Areas of Outstanding Natural BeautyThe How Low? study has assumed that solar
power systems and internal/external wall insulation
will not be applied systematically to listed buildings
or to homes in conservation areas. While there are
clearly further carbon savings to be made, there
is likely to be significant public resistance to the
wide-scale deployment of micro-renewables and
external cladding in rural communities and historic
towns. The negative press coverage of large-
scale wind generation suggests that the further
deployment of these measures is unlikely to be
politically favourable at present.
Annex VI – Conservative assumptions
© W
WF
/ C
hris
Mar
tin B
AH
R

��
��.� Green gas percentageErnst & Young’s recent study of the initial business
case for supporting the UK renewable heat
sector did not examine the feasibility of biogas
injection to the domestic gas supply network.
However, a response to the Renewable Heat
Obligation consultation by Panthol Ltd76 (a supplier
of domestic oil and biofuels) stated that the UK
could possibly secure 10% of its current natural
gas energy needs, or 15% of its current electricity
needs, by 2020, through the production and use
of biogas from indigenous UK agricultural output.
The study has therefore made a conservative
assumption of a total residential green gas supply
of 10% by 2050.
��.� Decarbonisation of electricity The report team has linearly extrapolated the
projected carbon intensity of delivered electricity
(2008-20) to estimate a 2050 carbon factor of
0.059kgC/kWh (see Figure 2). The recent IPPR,
RSPB and WWF study to identify whether it would
be possible to reduce the UK’s carbon emissions
by 80% of 1990 levels by 2050 identified
decarbonised electricity as a key measure – i.e.
a carbon factor of 0.005kgC/kWh. For reasons
of conservatism this study has not assumed as
high a level of decarbonisation as the IPPR report,
which took a downward path to a zero carbon
electricity sector by 2050. This serves to highlight
that there is room to manoeuvre and go beyond an
80% cut in the residential sector.
Solid fuel
Gas
Electricity
Oil
7.5%
16.5%
40.5%
19.4%
Fuel 2020 increase
��.5 Measures costs – mass marketing LZC technologies Scenario 2 requires a total expenditure of
£130 billion, with a GVA of £38 billion. This cost
is based on today’s prices for insulation and LZC
technologies, which are likely to fall significantly
between now and 2050. The recent Renewables
Advisory Board (RAB) report on the ‘Essential
role of renewables generation in achieving zero
carbon homes’ examined the projected cost of
LZC technologies from 2007 to 2025. If the cost
reductions predicted are applied to scenario 2,
costs fall by £36 billion to £94 billion in total, which
would mean that as compared to the £99 billion
cost of this scenario, they achieve a net positive
economic position.
��.6 Fuel pricesThis represents a conservative estimate of the
actual savings achieved, as the fuel prices are
based on 2007 averages. The DTI baseline
projections for fuel prices by 2020, shown below,
demonstrate an average price rise of 21%. If the
figures for each fuel are applied to the lifetime
savings generated at 2007 fuel prices, the total
savings for scenario 1a and 1b rise by 25% and
13% respectively. Conversely, they fall for Scenario
2a and 2b, as electricity has the largest overall
price rise, and this scenario creates an additional
demand for this fuel.
��.� Measures lifetimes – �5 yearsThe study has assumed a 15-year lifetime for all
measures. This is a conservative estimate based
on the shortest lifetime among the measures
applied. The insulation measures and solar power
systems typically have a 20-30 year lifetime. If a
20-year lifetime were applied, the lifetime savings
would increase by 33%.
76 Panthol Ltd (2007).

�8
WWF-UKPanda House, Weyside ParkGodalming, Surrey GU7 1XRt: +44 (0)1483 426333f: +44 (0)1483 426409
The mission of WWF is to stop the degradation of the planet’s natural environment and to build a future in which humans live in harmony with nature, by• conserving the world’s biological diversity• ensuring that the use of renewable natural resources is sustainable• reducing pollution and wasteful consumption
wwf.org.uk
WW
F-U
K re
gist
ered
cha
rity
num
ber
1081
247
A c
ompa
ny li
mite
d by
gua
rant
ee n
umbe
r 40
1672
5
© 1
986
Pan
da s
ymbo
l and
® “
WW
F” R
egis
tere
d Tr
adem
ark
of W
WF-
Wor
ld W
ide
Fund
For
Nat
ure
(form
erly
Wor
ld W
ildlif
e Fu
nd)
P
rinte
d on
recy
cled
pap
er P
roje
ct n
umbe
r 25
10 /
Mar
ch 2
008,
FR
ON
T C
OV
ER
IMA
GE
: © C
ON
STR
UC
TIO
N P
HO
TOG
RA
PH
Y
With thanks to:
www.ukace.org
www.cse.org.uk
Dr Richard Moore