energy audits for water and wastewater treatment plants
TRANSCRIPT

Energy Audits for Water and Wastewater Treatment Plants and Pump Stations Course No: M02-041
Credit: 2 PDH
Ely Greenberg, P.E., CEM
Continuing Education and Development, Inc. 9 Greyridge Farm Court Stony Point, NY 10980 P: (877) 322-5800 F: (877) 322-4774 [email protected]

Table of Contents
Introduction..................................................................................................................................... 1
Energy Balances.............................................................................................................................. 3
Completing a Process Energy Audit ............................................................................................... 6
Calculations................................................................................................................................... 10
Analyzing and Implementing Findings......................................................................................... 15
Preparing an Audit Report ............................................................................................................ 17
Future Reading.............................................................................................................................. 19
Energy Audits for Water and Wastewater Treatment Plants and Pump Stations
1
Introduction
Water and wastewater utilities consume approximately 4% of the power in the United States. For water utilities the largest energy consuming operation is pumping, while for wastewater utilities secondary and tertiary treatment are the processes consuming the largest quantities of power. Reducing process energy consumption in a water or wastewater treatment plant starts with a process energy audit specific to this type of facility. This course will cover how to plan, prepare, and execute a process energy audit for a water or wastewater treatment plant or pump station as well as analyze the results and discuss energy saving strategies and energy conservation measures.
There are several types of water and wastewater treatment. This course will cover energy audits for domestic water and wastewater treatment plants. These are the facilities operated by city, town, county, or regional water authorities. Generally, these are referred to as municipal water and wastewater treatment plants. However, these audit techniques could apply to industrial wastewater treatment systems. Not to be forgotten are water reuse and desalination. These are energy intensive processes. The energy auditing techniques outlined in this course are applicable to these facilities as well.
Serving these water and wastewater treatment plants is a network of pump stations. Water systems have pump stations for sending raw water to a treatment plant or pumping treated water through a distribution network. Likewise, wastewater systems have pump stations in the collection system for delivering wastewater to a treatment plant. The size and location of these pump stations is dictated by the geography and boundaries of the water or wastewater utility.
Water treatment generally has three parts.
1. Raw water pumping to a treatment plant2. Treatment: Coagulation and Flocculation, Sedimentation, Filtration, Disinfection3. Distribution pumping
The technologies employed for each part will vary by community.
Wastewater treatment has four levels of treatment:
1. Preliminary2. Primary3. Secondary4. Tertiary or Advanced Treatment
Wastewater treatment plants in the United States are required to have at least secondary treatment, but under emergency conditions wastewater treatment plants may, depending on their permit, operate with only primary treatment. Tertiary or advanced treatment is becoming more common, but depends on local wastewater effluent standards.
Energy Audits for Water and Wastewater Treatment Plants and Pump Stations
2
Wastewater contains up to ten times the amount of potential energy as the energy used to treat that water. Current treatment methods are removing that potential energy rather than recovering it for beneficial use. In 2011, the total electricity consumption in the United States was 4,125,060 thousand megawatt hours, for which 4% was consumed by water and wastewater processes. The Water Environmental Federation (WEF), a trade group for the wastewater treatment sector recently began an effort to rebrand Wastewater Treatment Plants (WWTP) as Wastewater Resource and Recovery Facilities (WRRF) highlighting their promise to recover energy.
However, the first step to recovering energy for beneficial use is an energy audit. This course will provide the background and tools needed for engineers or treatment plant operators to complete an energy audit, calculate an energy benchmark, and set goals for future energy reduction and possible energy recovery and generation.
Treatment Standards and Their Effect on Energy
Water and wastewater treatment standards affect overall energy consumption. More treatment processes require more energy. In the United States the Environmental Protection Agency (EPA) sets water treatment standards through the National Primary Drinking Water Regulations (NPDWRs or primary standards), which is governed by the Safe Drinking Water Act (SDWA). These are legally enforceable standards for public water systems that apply to microorganisms, disinfectants, disinfection byproducts, inorganic chemicals, organic chemicals, and radionuclides. Each contaminant has a Maximum Contaminant Level (MCL).
Wastewater treatment standards are also set by the EPA, which mandates secondary treatment of wastewater. Secondary treatment refers to the biological treatment component of a municipal wastewater treatment plant. This standard applies to publicly owned treatment works (POTWs), and sets the minimum level of effluent quality in terms of 5-day biochemical oxygen demand (BOD5) and total suspended solids (TSS) removal. BOD and TSS represent the strength of the wastewater. These measures will be used later in this course for energy benchmarking. EPA’s secondary treatment standards provide flexibility for combined sewers, industrial wastes, waste stabilization ponds, and less concentrated influent wastewater. This means that some communities may have more stringent or less stringent permit regulations.
As noted above, wastewater treatment has four levels of treatment: preliminary, primary, secondary, and tertiary. Primary treatment which includes only pumping and setting processes requires the least amount of energy, while more advanced treatment to achieve nutrient removal requires more processes, and hence more energy.
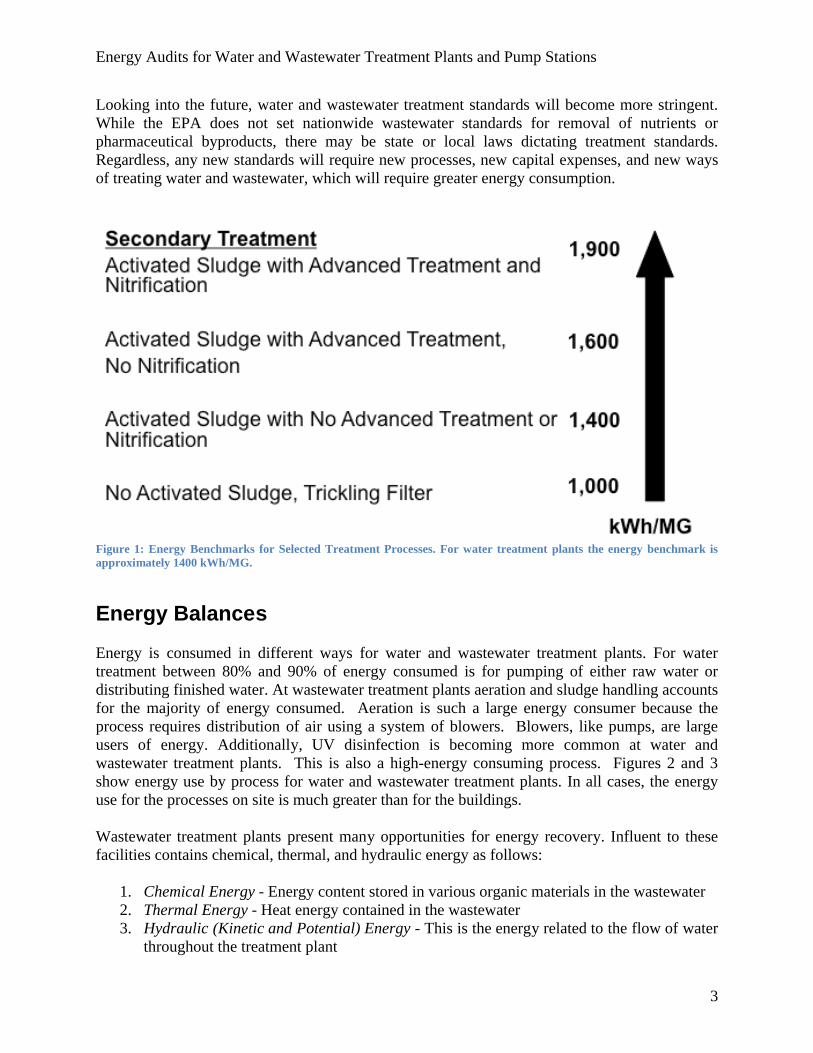
The Water Environment Federation Manual of Practice (MOP) 32, Energy Conservation in Water and Wastewater Treatment Facilities, describes energy use by process. Figure 1, below, from MOP 32 outlines the energy consumption for various wastewater treatment processes showing how energy increases for more complex processes. In this figure energy is benchmarked as kWh per million gallons (kWh/MG), which is a common measure. Benchmarking will be discussed in more detail later in the course.
Energy Audits for Water and Wastewater Treatment Plants and Pump Stations
3
Looking into the future, water and wastewater treatment standards will become more stringent. While the EPA does not set nationwide wastewater standards for removal of nutrients or pharmaceutical byproducts, there may be state or local laws dictating treatment standards. Regardless, any new standards will require new processes, new capital expenses, and new ways of treating water and wastewater, which will require greater energy consumption.
Figure 1: Energy Benchmarks for Selected Treatment Processes. For water treatment plants the energy benchmark is approximately 1400 kWh/MG.
Energy Balances
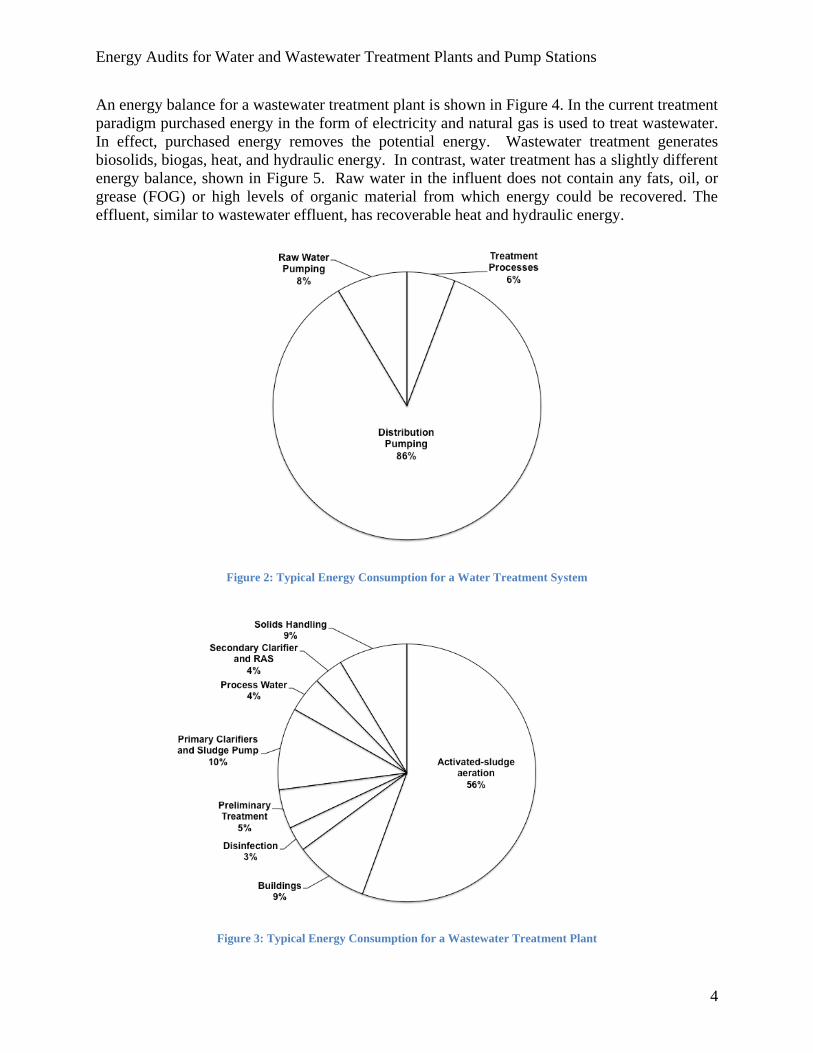
Energy is consumed in different ways for water and wastewater treatment plants. For water treatment between 80% and 90% of energy consumed is for pumping of either raw water or distributing finished water. At wastewater treatment plants aeration and sludge handling accounts for the majority of energy consumed. Aeration is such a large energy consumer because the process requires distribution of air using a system of blowers. Blowers, like pumps, are large users of energy. Additionally, UV disinfection is becoming more common at water and wastewater treatment plants. This is also a high-energy consuming process. Figures 2 and 3 show energy use by process for water and wastewater treatment plants. In all cases, the energy use for the processes on site is much greater than for the buildings.
Wastewater treatment plants present many opportunities for energy recovery. Influent to these facilities contains chemical, thermal, and hydraulic energy as follows:
1. Chemical Energy - Energy content stored in various organic materials in the wastewater2. Thermal Energy - Heat energy contained in the wastewater 3. Hydraulic (Kinetic and Potential) Energy - This is the energy related to the flow of water
throughout the treatment plant
Energy Audits for Water and Wastewater Treatment Plants and Pump Stations
4
An energy balance for a wastewater treatment plant is shown in Figure 4. In the current treatment paradigm purchased energy in the form of electricity and natural gas is used to treat wastewater. In effect, purchased energy removes the potential energy. Wastewater treatment generates biosolids, biogas, heat, and hydraulic energy. In contrast, water treatment has a slightly different energy balance, shown in Figure 5. Raw water in the influent does not contain any fats, oil, or grease (FOG) or high levels of organic material from which energy could be recovered. The effluent, similar to wastewater effluent, has recoverable heat and hydraulic energy.
Figure 2: Typical Energy Consumption for a Water Treatment System
Figure 3: Typical Energy Consumption for a Wastewater Treatment Plant

Energy Audits for Water and Wastewater Treatment Plants and Pump Stations
5
Figure 4: Wastewater Treatment Energy Balance
Figure 5: Water Treatment Plant Energy Balance

Energy Audits for Water and Wastewater Treatment Plants and Pump Stations
6
Completing a Process Energy Audit
An energy audit may be referred to in several ways: energy assessment, energy survey, energy study, energy analysis, energy evaluation, or energy investigation. These names are all interchangeable, and all carry the same meaning; they are energy audits.
For commercial and residential buildings, ASHRAE has designated three types of energy audits:
Level 1 – Walk-Through SurveyLevel 2 – Energy Survey and AnalysisLevel 3 – Detailed Analysis of Capital-Intensive Modifications
For water and wastewater facilities there is more value to the client to complete a Level 1 and Level 2 energy audit at the same time. A Level 3 energy audit would be part of a detailed engineering design.
According to ASHRAE, Level 1, Level 2, and Level 3 energy audits are defined as follows to show their varying level of effort:
Level 1 – Walk-Through Survey
A Level 1 – Walk-Through Survey audit includes analysis of previous energy bills and process data (typically up to three years if available), a visit to the facility and interview with the keydecision makers, and basic energy measurements. The end product is a report outlining the energy use on site, an energy benchmark, and recommendations for low-cost or no cost energy efficiency improvements. The report will also list possible future energy saving capital projects.
Level 2 – Energy Survey and Analysis
A Level 2 Energy Survey and Analysis audit builds on a Level 1 audit and includes a detailed breakdown on energy use by process, more in-depth measurements, an electrical peak demand analysis, analysis of the savings generated by possible energy efficiency measures; developspossible changes to control strategies; and lays out a plan for a Level 3 analysis which would require more intensive data collection. The report for a Level 2 audit will be similar to that of a Level 1 audit, but will include more energy and cost analysis.
Level 3 – Detailed Analysis of Capital-Intensive Modifications
A Level 3 – Detailed Analysis of Capital-Intensive Modifications audit focuses on further developing the capital projects identified as part of the Level 2 audit. This audit requires more data collection as well as energy and process modeling to evaluate the benefits of a particular energy saving capital project. This audit will also include more detailed payback calculations. Typically, the products of a Level 3 audit are design drawings for a capital project.
Practically speaking a Level 1 and Level 2 audits can be completed simultaneously. As noted above, for the time spent it is a good value to provide the client with a Level 1 and Level 2
Energy Audits for Water and Wastewater Treatment Plants and Pump Stations
7
energy audit at the same time. Therefore, for this course we will assume that the “Energy Audit” is a combined Level 1 and Level 2 audit. The Level 3 audit would be part of a detailed engineering design effort.
Planning
Before beginning a process energy audit for a water or wastewater treatment plant or pump station, request from the client energy bills and process data for the last three years, if available. At the very least one-year’s worth of data should be available. Additionally, obtain:
Site drawings Flow diagrams Previous energy audits Agreements with the electricity and gas companies Climate data Pump and blower curves A copy of the SPEDS permit
The SPEDS (State Pollution Elimination Discharge System) permit will provide background on the permitted flows and effluent requirements.
Determine if the client has an energy team, an energy leader, and who the decision makers are within the organization. Implementing future changes will require their support. Before scheduling the first site visit, discuss with the client what they hope to achieve through the energy audit, the timeframe, expectations, the driving factors of why they are completing an energy audit, time of day available for a site visit, site specific safety and access issues, and ensure that all contractual terms are negotiated. Lastly, review the drawings to ascertain what equipment is at the plant, and generate a list of equipment that will be evaluated during the visit.
Visiting the Site
Begin the site visit with a meeting of the client’s energy team, energy leader, and key decision makers, and anyone who will show you around the facility. Briefly review the expectations for the energy audit, and discuss the plan for the site visit and how many site visits you plan to make. Clearly identify what you as the auditor want to see, how you will take measurements, and what measurements or other assistance you will need from the client. Remember that plant personnel have many tasks and the time spent with an energy auditor takes away from their other daily responsibilities.
Site visits may take place over several days depending upon the size and scope of the energy audit. There may also be access issues for data collection that you will need to review on-site before deciding how to proceed with data collection. If you will be logging data over a period of days or weeks, you will need to set up the equipment, advise the plant staff if they need to check-on the equipment, if necessary, and then return to retrieve the equipment and download the data.
Energy Audits for Water and Wastewater Treatment Plants and Pump Stations
8
Additionally, be prepared with the necessary safety equipment including hardhat, safety shoes, safety glasses, hearing and respiratory protection as may be required. Obey all safety rules during the site visit.
During the audit walk the process trains as shown on the flow diagrams to understand the plant processes and the equipment involved. Several processes may be in one building or may be spread across several buildings depending on the size of the facility. Begin the audit at thetreatment plant influent and move toward the effluent. Complete the audit of the liquid train prior to the audit of the solids train.
Ask lots of questions during the site visit. Common questions may include:
Are buildings or processes on the site sub-metered? How many electrical feeders are there? What is the water or wastewater utility’s relationship with the electric utility? Does the water or wastewater utility have any ongoing capital projects? What are the future process challenges facing the water or wastewater utility? Does the water or wastewater utility have a choice of electricity and gas suppliers? Are there city or state mandates for renewable energy? What is the makeup of the water and wastewater customers who are part of the system?
Measurements
The measurements taken during a site visit will vary. As previously noted energy use for the water and wastewater processes is higher than for building loads. However, it is still necessary to record building information. Much of the process data may be available from the treatment plant or pump station through the SCADA (supervisory control and data acquisition) system. The SCADA system should be recording flows, pressures, and the run time for major equipment. Be sure to obtain as much of this data as possible for future analysis. The plant laboratory will record data for water and wastewater quality including BOD and TSS data. All water and wastewater testing must take place in a certified laboratory.
During the energy audit verify the operating speed of any rotating equipment with a tachometer. See that the speed measured by the tachometer matches the speed recorded in the SCADA system.
Record the temperature of the process areas to ensure that they meet the OSHA requirements for occupants. Temperatures not in accordance with OSHA not only affect worker health, but alsoequipment performance. In many cases process spaces do not require dedicated heating or air conditioning. However, temperatures that are too hot or too cold may be a reason for poorly operating equipment.
Energy Audits for Water and Wastewater Treatment Plants and Pump Stations
9
Additionally, measure the temperatures of motors and pump bearings to verify the temperatures being recorded by the SCADA system. Rotating equipment that is operating too hot is operating inefficiently. This may indicate a need for maintenance or incorrect operation of the equipment.
Similarly, noise should be measured during the energy audit. OSHA standard 1910.95 regulates noise above 90 dBA. Like temperature, extreme noise not only affects worker health, but is also an indication of equipment performance.
Pumps are large energy consumers for water and wastewater utilities, and usually provide lots of room for improvement. Record the pump operating points, flow ranges, turndown range of the VFDs, wet-well levels, and the maximum and minimum wet-well set point possible. Check the actual pump speed and flow versus the pump curve.
Procedures for testing process systems are published by the American Society of Mechanical Engineers. The following standards will be useful.
ANSI/ASME EA-1-2009 - Energy Assessment for Process Heating Systems ANSI/ASME EA-2-2009 - Energy Assessment for Pumping Systems ANSI/ASME EA-3-2009 - Energy Assessment for Steam Systems ANSI/ASME EA-4-2010 - Energy Assessment for Compressed Air Systems
For buildings collect the number of rooms, square footage of each room within the building, number of light fixtures and types, and details of the HVAC system. Record the temperature of all spaces and obtain the temperature set points for the buildings during summer and winter.
Use a data logger to record the startup sequence for blowers and major pumps, if not available from the plant SCADA system. Some facilities may have an Electrical Monitoring and Control System (EMCS). Recording the startup sequence provides important data to understand start-up loads that have a large impact on electricity demand charges.
Recording Data
As previously mentioned, before the site visit review you should review the as-built facility drawings to determine what equipment is at the plant, and generate a list of items to be tested. Construct a spreadsheet to track all of the data you want to collect. The data can then be easily recorded on printouts of the spread or on a tablet, which is more ideal. At a minimum, the spreadsheet should have the following columns for each piece of equipment:
Equipment Type Run-time per day Process Run-time per month Treatment Type Run-time per year*
Location Average Load Factor (%)*
Nameplate hp or kW Average Electric Load (kW) *
Motor Efficiency Estimated Annual Energy Use (kWh/yr) *
Motor Full Load Amperage (FLA) Estimated Annual Operating Costs ($/Yr) *
Average Motor Operating Current Wet Weather Operation+
Energy Audits for Water and Wastewater Treatment Plants and Pump Stations
10
Emergency Operation+ Peak Dry Weather Operation+
Dry Weather Operation+
+ Determine whether the equipment operates during this time, yes or no* Value may be calculated
Calculations
Before, during, and after the energy audit the calculations for determining energy benchmarks, energy costs, aeration demand, and pumping requirements will be useful.
Electric Utility Billing Structures
Only a small portion of water or wastewater treatment plant operators see the electric or gas bills. Without seeing these bills it is not possible to fully understand how much energy is being used and how much that energy costs. Energy bills may have several charges or different billing structures:
Demand Charge – A charge based on instantaneous demand, typically averaged over a 15 minute or 30 minute period. The demand charge may also be set based on highest monthly demand or a pre-negotiated level. The demand charge is usually used to recover the capital costs of electricity generating equipment.
Electricity or Gas Consumption Charge – The charge for the amount of electricity or gas consumed during the billing period. The electricity consumption charge may change depending on the time of day.
Facility Charge – Fixed charges that are not dependent on electricity consumption or demand. Typically, facility charges are billed to recover the cost of equipment or other administrative costs.
Power Factor – Power factor is the ratio of true power (kW) to apparent power (kVA). The power factor is a dimensionless number between 0 and 1 that measures how effectively electrical power is used. A high power factor demonstrates efficient utilization of electrical power, while a low power factor represents poor utilization of electrical power. Electric utilities may therefore charge more for a lower power factor.
Block Rates – The price charged for a fixed quantity of electricity or gas. As electricity or gas consumption exceeds the first fixed amount, successive quantities of electricity or gas have a lower price.
Time of Use Rates – An electricity rate schedule where the customer is charged different prices for electricity consumption or demand based on the time of day and/or season.
Some electric utilities use the power factor to adjust the demand charge. They may set a minimum power factor, and if the power factor is less than the set value the consumer will pay more.
Formula: Power Factor Adjusted Demand
1 + (Set PF – Metered PF) x Metered Demand = Power Factor Adjusted Demand
Energy Audits for Water and Wastewater Treatment Plants and Pump Stations
11
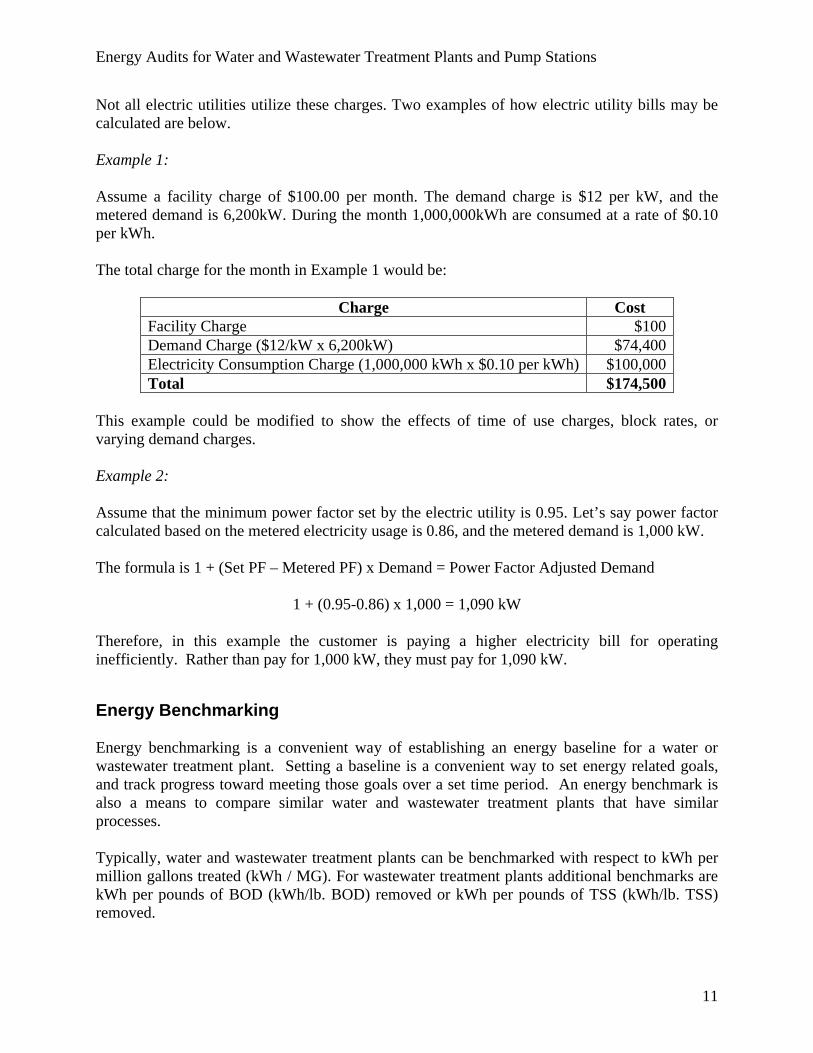
Not all electric utilities utilize these charges. Two examples of how electric utility bills may be calculated are below.
Example 1:
Assume a facility charge of $100.00 per month. The demand charge is $12 per kW, and the metered demand is 6,200kW. During the month 1,000,000kWh are consumed at a rate of $0.10 per kWh.
The total charge for the month in Example 1 would be:
Charge CostFacility Charge $100Demand Charge ($12/kW x 6,200kW) $74,400Electricity Consumption Charge (1,000,000 kWh x $0.10 per kWh) $100,000Total $174,500
This example could be modified to show the effects of time of use charges, block rates, or varying demand charges.
Example 2:
Assume that the minimum power factor set by the electric utility is 0.95. Let’s say power factor calculated based on the metered electricity usage is 0.86, and the metered demand is 1,000 kW.
The formula is 1 + (Set PF – Metered PF) x Demand = Power Factor Adjusted Demand
1 + (0.95-0.86) x 1,000 = 1,090 kW
Therefore, in this example the customer is paying a higher electricity bill for operating inefficiently. Rather than pay for 1,000 kW, they must pay for 1,090 kW.
Energy Benchmarking
Energy benchmarking is a convenient way of establishing an energy baseline for a water or wastewater treatment plant. Setting a baseline is a convenient way to set energy related goals, and track progress toward meeting those goals over a set time period. An energy benchmark is also a means to compare similar water and wastewater treatment plants that have similar processes.
Typically, water and wastewater treatment plants can be benchmarked with respect to kWh per million gallons treated (kWh / MG). For wastewater treatment plants additional benchmarks are kWh per pounds of BOD (kWh/lb. BOD) removed or kWh per pounds of TSS (kWh/lb. TSS) removed.
Energy Audits for Water and Wastewater Treatment Plants and Pump Stations
12
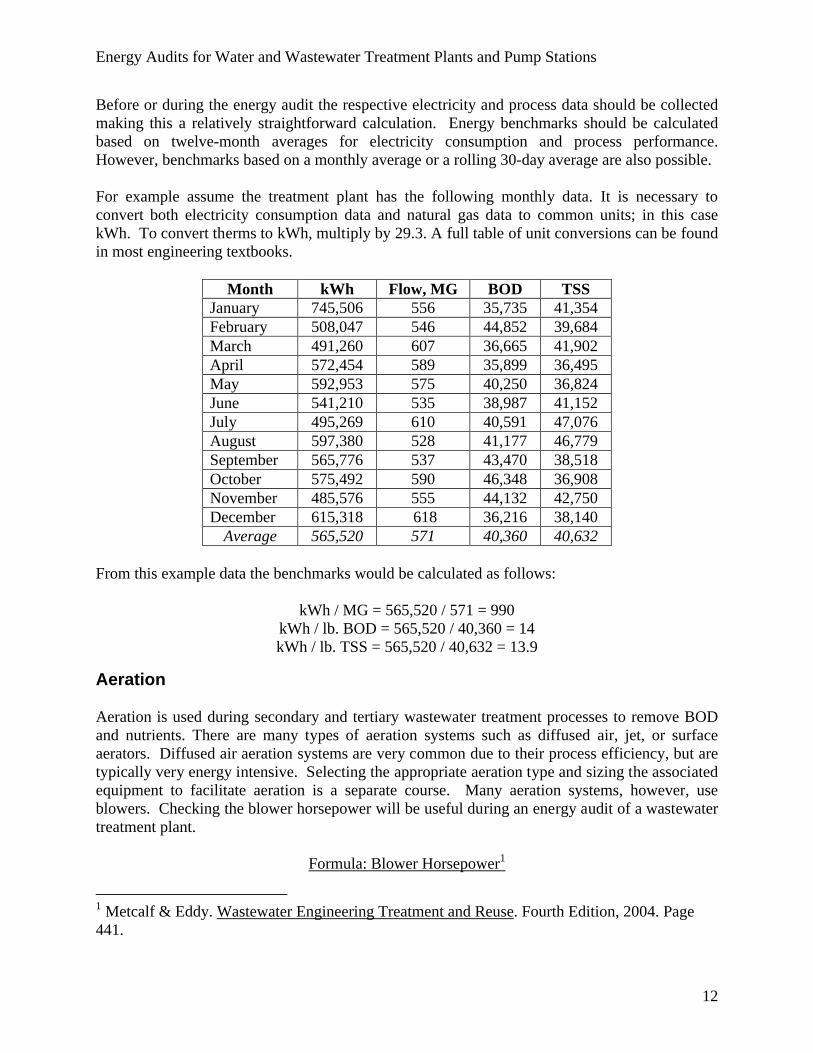
Before or during the energy audit the respective electricity and process data should be collectedmaking this a relatively straightforward calculation. Energy benchmarks should be calculated based on twelve-month averages for electricity consumption and process performance. However, benchmarks based on a monthly average or a rolling 30-day average are also possible.
For example assume the treatment plant has the following monthly data. It is necessary to convert both electricity consumption data and natural gas data to common units; in this case kWh. To convert therms to kWh, multiply by 29.3. A full table of unit conversions can be found in most engineering textbooks.
Month kWh Flow, MG BOD TSSJanuary 745,506 556 35,735 41,354February 508,047 546 44,852 39,684March 491,260 607 36,665 41,902April 572,454 589 35,899 36,495May 592,953 575 40,250 36,824June 541,210 535 38,987 41,152July 495,269 610 40,591 47,076August 597,380 528 41,177 46,779September 565,776 537 43,470 38,518October 575,492 590 46,348 36,908November 485,576 555 44,132 42,750December 615,318 618 36,216 38,140
Average 565,520 571 40,360 40,632
From this example data the benchmarks would be calculated as follows:
kWh / MG = 565,520 / 571 = 990kWh / lb. BOD = 565,520 / 40,360 = 14kWh / lb. TSS = 565,520 / 40,632 = 13.9
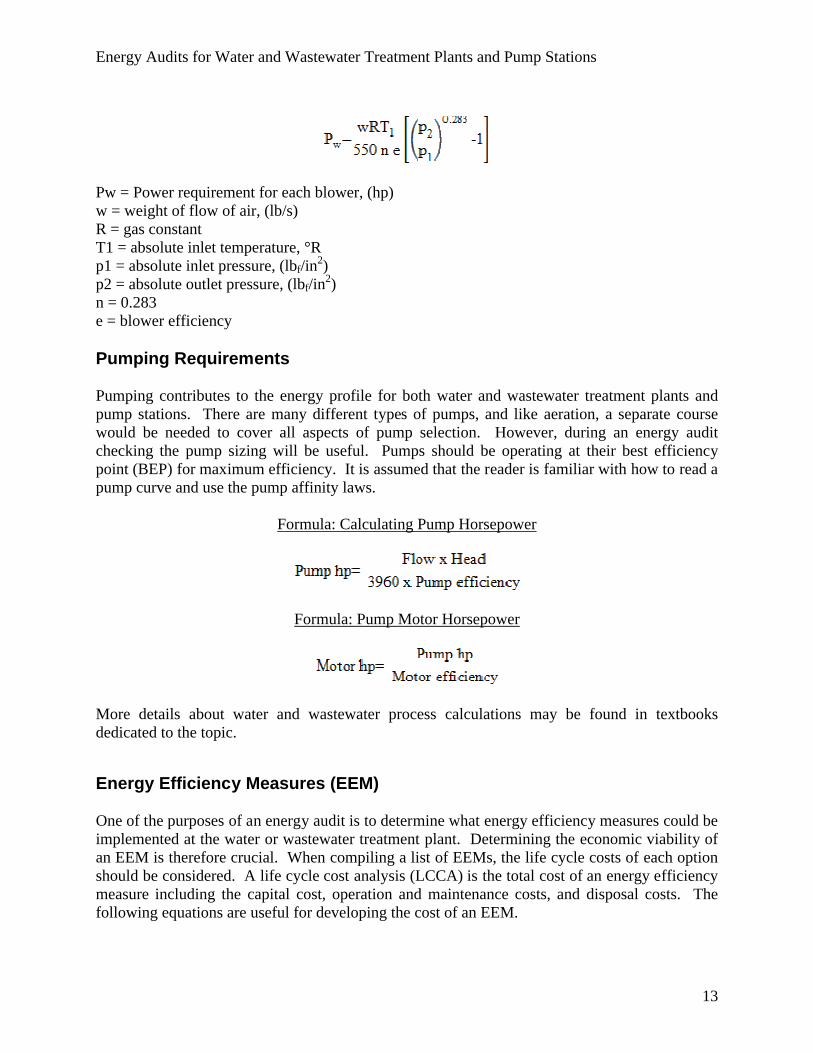
Aeration
Aeration is used during secondary and tertiary wastewater treatment processes to remove BOD and nutrients. There are many types of aeration systems such as diffused air, jet, or surface aerators. Diffused air aeration systems are very common due to their process efficiency, but are typically very energy intensive. Selecting the appropriate aeration type and sizing the associated equipment to facilitate aeration is a separate course. Many aeration systems, however, use blowers. Checking the blower horsepower will be useful during an energy audit of a wastewater treatment plant.
Formula: Blower Horsepower1
1 Metcalf & Eddy. Wastewater Engineering Treatment and Reuse. Fourth Edition, 2004. Page 441.
Energy Audits for Water and Wastewater Treatment Plants and Pump Stations
13
Pw = Power requirement for each blower, (hp)w = weight of flow of air, (lb/s)R = gas constantT1 = absolute inlet temperature, °Rp1 = absolute inlet pressure, (lbf/in
2)p2 = absolute outlet pressure, (lbf/in
2)n = 0.283e = blower efficiency
Pumping Requirements
Pumping contributes to the energy profile for both water and wastewater treatment plants and pump stations. There are many different types of pumps, and like aeration, a separate course would be needed to cover all aspects of pump selection. However, during an energy audit checking the pump sizing will be useful. Pumps should be operating at their best efficiency point (BEP) for maximum efficiency. It is assumed that the reader is familiar with how to read a pump curve and use the pump affinity laws.
Formula: Calculating Pump Horsepower
Formula: Pump Motor Horsepower
More details about water and wastewater process calculations may be found in textbooks dedicated to the topic.
Energy Efficiency Measures (EEM)
One of the purposes of an energy audit is to determine what energy efficiency measures could be implemented at the water or wastewater treatment plant. Determining the economic viability of an EEM is therefore crucial. When compiling a list of EEMs, the life cycle costs of each option should be considered. A life cycle cost analysis (LCCA) is the total cost of an energy efficiency measure including the capital cost, operation and maintenance costs, and disposal costs. The following equations are useful for developing the cost of an EEM.
Energy Audits for Water and Wastewater Treatment Plants and Pump Stations
14
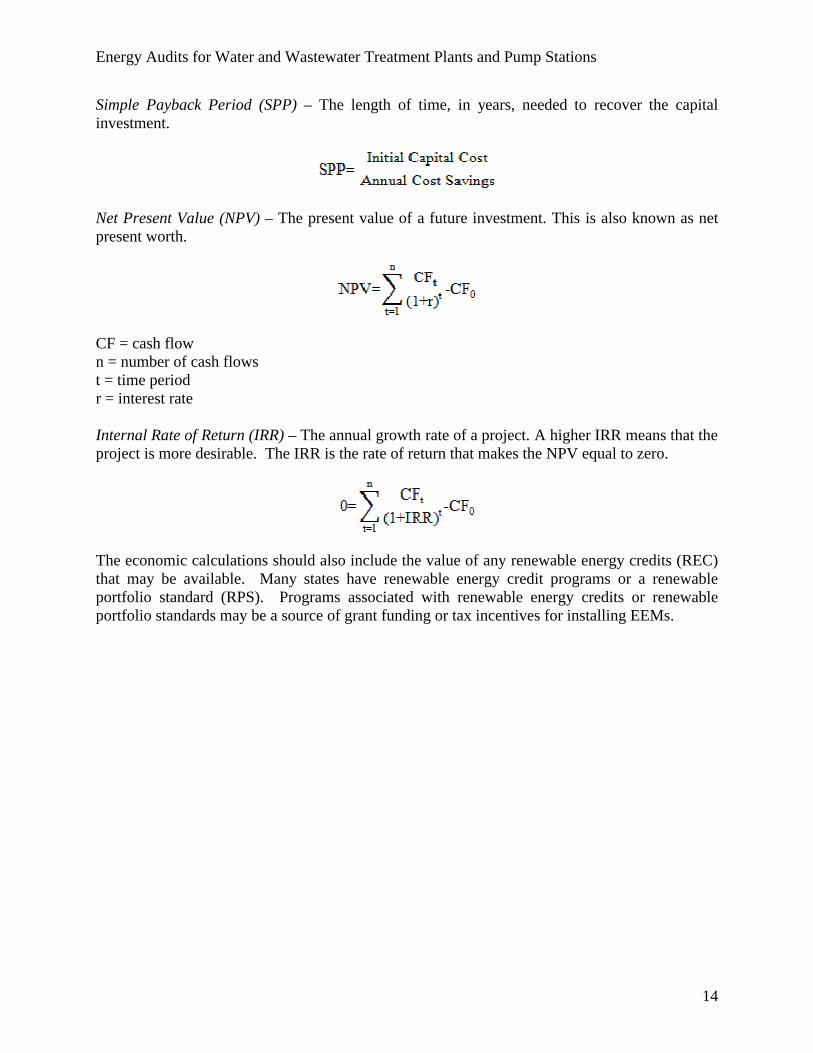
Simple Payback Period (SPP) – The length of time, in years, needed to recover the capital investment.
Net Present Value (NPV) – The present value of a future investment. This is also known as net present worth.
CF = cash flown = number of cash flowst = time periodr = interest rate
Internal Rate of Return (IRR) – The annual growth rate of a project. A higher IRR means that theproject is more desirable. The IRR is the rate of return that makes the NPV equal to zero.
The economic calculations should also include the value of any renewable energy credits (REC) that may be available. Many states have renewable energy credit programs or a renewable portfolio standard (RPS). Programs associated with renewable energy credits or renewable portfolio standards may be a source of grant funding or tax incentives for installing EEMs.
Energy Audits for Water and Wastewater Treatment Plants and Pump Stations
15
Analyzing and Implementing Findings
Completing a process energy audit paints a vivid picture of the energy use at a water or wastewater treatment plant. The data collected will identify where energy is being consumed, how it is being consumed, and lays the groundwork for a future energy management program to optimize energy use. Data should be collected in a spreadsheet program for further analysis and graphing.
Among the calculations and graphs in the spreadsheet should be:
Total electricity and fuel use per year and the associated costs A breakdown of the total energy use by process, treatment regime, building, and for
various flow conditions A bar chart showing the energy benchmarks for a period of months or years A graph of the energy use and process data versus time to analyze trends, patterns, and
the effects of weather A table of possible energy efficiency measures, their costs, time to implement, and the
excepted energy savings
During the energy audit, the engineers or operators completing the audit should look for some of the common methods of saving energy as they are completing their work. Often these changes can be implemented without additional capital investment. Possible energy savings tips for water or wastewater treatment plant and pump stations include:
Ensuring pumps operate at the best efficiency point Changing pump wet well set points. Low wet well levels translate to a higher static head,
which means greater pump horsepower. Identify areas where peak demand can be trimmed or shifted Shift peak energy loads to off-peak hours Stagger/spread out equipment/motor start-ups to avoid spikes in electricity demand Develop an operational strategy to minimize pumping, aeration, or other high power demand
system operation during periods of peak electrical demand or peak electricity consumption
Energy savings methods that require further engineering analysis include:
Developing a calibrated treatment plant process model to simulate plant performance and predict energy use during different scenarios.
Modifying control strategies to monitor energy performance of key processes and systems, and properly schedule equipment run-times
Installing premium-efficiency motors and variable frequency drives Reducing the energy required for aeration by using fine bubble diffusers to improve oxygen
transfer efficiency (OTE) or using cyclic aeration Installing dissolved oxygen (DO) probes to allow operators or an automated control system
to adjust blower systems in real-time Implementing dose pacing instead of flow pacing for ultraviolet (UV) disinfection systems

Energy Audits for Water and Wastewater Treatment Plants and Pump Stations
16
Purchasing smaller, more efficient equipment Generating power on-site and using this power source during periods of peak power demand Installing a combined heat and power (CHP) system or gas-driven generator that uses biogas
from wastewater Installing solar panels or wind turbines to offset purchased power
Energy Audits for Water and Wastewater Treatment Plants and Pump Stations
17
Preparing an Audit Report
The energy audit report should provide an in-depth informative overview of the energy use at the water or wastewater treatment plant or pump station. Typically, the report will have the following sections:
1. Executive Summary
The executive summary should include a brief description of the facility, history, and scope of the energy audit as well as the time period when the energy audit occurred. Additionally, this section should include a summary of any energy efficiency measures and a summary of the energy benchmarks.
2. Introduction and Background Information
In this section describe the site, location, treatment processes, design, average and peak flows, as well as the local population that relies on the facility. Also, include the contact information for the energy team or key decision makers at the water or wastewater utility. Describe the client’s motivations for completing an energy audit.
3. Existing Infrastructure and Processes
This section should include an overall plant performance summary, as well as a list of all plant equipment indicating which process uses the equipment, how often it operates, and how much energy the equipment consumes during different flow conditions. Also, provide information on the buildings such as building occupancy, construction type, lighting systems, HVAC systems, security systems, and include a site map and or relevant photos.
4. Audit Findings
Describe the historical energy consumption and costs, and compare it to the current energy benchmarks and energy-use analysis. The energy consumption should be provided for the whole treatment plant or pump station, and broken down by process, if possible.
5. Energy Efficiency Measures (EEM)
This section should describe all EEM’s broken down by the no-cost or low-cost measures and those requiring capital investments. Describe possible demand response measures, distributed generation and/or renewable energy options, and O&M measures. Provide an overview of the current financial market including electric or gas utility incentives and federal or state tax incentives.

Energy Audits for Water and Wastewater Treatment Plants and Pump Stations
18
6. Appendices
The appendices should include any supporting information such as raw data for all measurements taken during the energy audit, relevant equipment manufacturers’ information and cut sheets referenced in the report, or site plans and sketches.
Energy Audits for Water and Wastewater Treatment Plants and Pump Stations
19
Future Reading and References
The following resources provide good information for future reading:
ANSI/ASME EA-1-2009. Energy Assessment for Process Heating Systems, American Society of Mechanical Engineers. 22-Jan-2010. ISBN: 9780791832783.
ANSI/ASME EA-2-2009. Energy Assessment for Pumping Systems, American Society of Mechanical Engineers. 22-Jan-2010. ISBN: 9780791832790.
ANSI/ASME EA-3-2009. Energy Assessment for Steam Systems, American Society of Mechanical Engineers. 22-Jan-2010. ISBN: 9780791832806.
ANSI/ASME EA-4-2010. Energy Assessment for Compressed Air Systems, American Society of Mechanical Engineers. 23-Apr-2010.
Best Practices Handbook, Water and Wastewater Energy Management. New York State Energy Research and Development Authority, March 2010.
Energy Conservation in Water and Wastewater Facilities - MOP 32 (WEF Manual of Practice). Water Environment Federation, 2009.
Evaluation of Energy Conservation Measures for Wastewater Treatment Facilities.Environmental Protection Agency. EPA 832-R-10-005. September 2010.
Procedures for Commercial Building Energy Audits, 2nd Edition. ASHRAE, 2011.
Thumann, Albert and Woodruff, Eric. Energy Project Financing: Resources and Strategies for Success. Fairmont Press, September 24, 2008.
Metcalf & Eddy. Wastewater Engineering Treatment and Reuse. Fourth Edition, 2004.