energy audit tool manual - eemo.govmu.orgeemo.govmu.org/english/documents/manual_audit_tool.pdf ·...
TRANSCRIPT

1
Energy Audit Tool Manual
Client Name

2
CONTENTS
I. About the ISO 50002 standard
II. Introduction to the tool functionality
III. Basic Interface and Menus
IV. EA Tool Screens Detail

3
ABOUT THE ISO 50002 STANDARD
The ISO 50002 standard was developed to provide
a standard framework for the process of an energy
audit.
Audit Steps:
Step 1
Step 2
Step 3
Step 4 Step 5 Step 6
Step 7 Step 8

4
ABOUT THE ISO 50002 STANDARD
The energy audit tool has been developed in accordance
with the ISO 50002 standard.
The ISO 50002 standard is a holistic approach to energy
auditing that elaborates a framework for organizational
engagement, facility assessment, energy analysis, and
planning of measures to reduce energy use.
The ISO 5002 audit standard is designed to compliment the
ISO 50001 energy management system.

5
ABOUT THE EA TOOL
The tool is not just for technical analysis, but to
guide the energy auditor through the ISO 50002
energy audit process.
Proactive client engagement
Encourage a focus on energy efficiency barriers, not only technical analysis
Identify key personnel at the client site and ensure their involvement for
developing the audit and recommendations
Follow a structured process for data collection and planning a site visit
Optimize time and budget through good data collection planning processes
6
ABOUT THE EA TOOL
Optimize time and budget through planning data collection and ensuring
that measurements are performed at the appropriate accuracy
Prepare the auditor for a site visit strategy that not only emphasizes
technical data collection activities, but also a focus on human factors
Guide the auditor through energy analysis and developing the energy
balance
Providing a guide to outlining a well structured energy audit report
7
ABOUT THE EA TOOL
The purpose of the tool is to step the auditor
through step 1 through step 7 of the ISO 50002
audit process:
Energy Audit Planning (ISO 50002 step 1)
Opening Meeting (ISO 50002 step 2)
Data Collection (ISO 50002 step 3)
Measurement Planning (ISO 50002 step 4)
Conducting the Site Visit (ISO 50002 step 5)
Analysis (ISO 50002 step 6)
Reporting (ISO 50002 step 7)

8
TOOL MENU TABS ACCORDING TO AUDIT STEPS
The tool menu tabs correspond to the ISO 50002
audit steps.
Step
1
Step
2
Step
3
Step
4 Step
5
Step
6 Step
7
Step
8
Tool menu tabs: Step 1 Step 2 / Step 3 Step 4 Step 5 Step 6 Step 7

9
EA TOOL - FUNCTIONALITY AND
MINIMUM DATA INPUT REQUIREMENTS
10
TOOL FUNCTIONALITY
The EA tool is designed to support the development of an
energy audit including:
- Generally documenting client and facility details
- Tools for preparing for on site data collection tasks
- Collection of data to support analysis
- Tools for analyzing energy management practices,
energy use patterns, and developing an energy balance
- Tools for simple analysis of equipment retrofits
11
TOOL STRUCTURE
For the energy analysis to be performed, only data in the yellow screens
need to be entered. All other screens are standalone or read only. The
stand alone screens include forms (EA-3,EA-5, OM-1 to Om-5), and
tools (EA-2, EA-4, OM-7, MP-7, MP-1 to MP-3, AN-1 to AN-6).
The yellow screens are mandatory to fill to generate an energy balance.

12
TOOL STRUCTURE
As shown Below,
13
MINIMUM DATA REQUIREMENTS
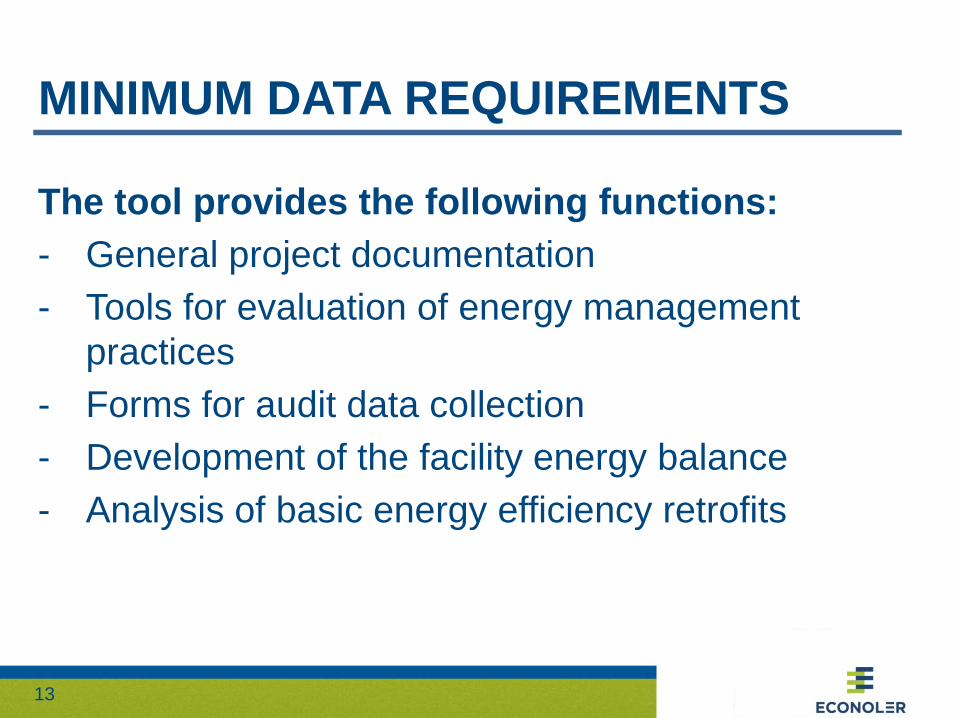
The tool provides the following functions:
- General project documentation
- Tools for evaluation of energy management
practices
- Forms for audit data collection
- Development of the facility energy balance
- Analysis of basic energy efficiency retrofits
14
MINIMUM DATA REQUIREMENTS
The tool provides several functions to assist the
energy auditor
However, for the energy balance analysis, there
are is fundamental data that are required.

15
MINIMUM DATA REQUIREMENTS
Tool Function Data Type Scope of Data Relevant
Screens
Energy Balance Analysis
Utility data 1 year kWh per month kW demand per month
(electricity only) Monthly cost
OM-6
Installed equipment specifications
Power rating Efficiency
SS-3 to SS-12
Equipment schedule Equipment
Hourly operating profile for weekdays, weekends, holidays
SS-2
Retrofit Analysis
Installed equipment specifications
Power rating Efficiency
AN-1 to AN-6
Equipment schedule Equipment
Hourly operating profile for weekdays, weekends, holidays
SS-2
16
EA TOOL – ANALYSIS METHODOLOGY

17
ANALYSIS METHODOLOGY
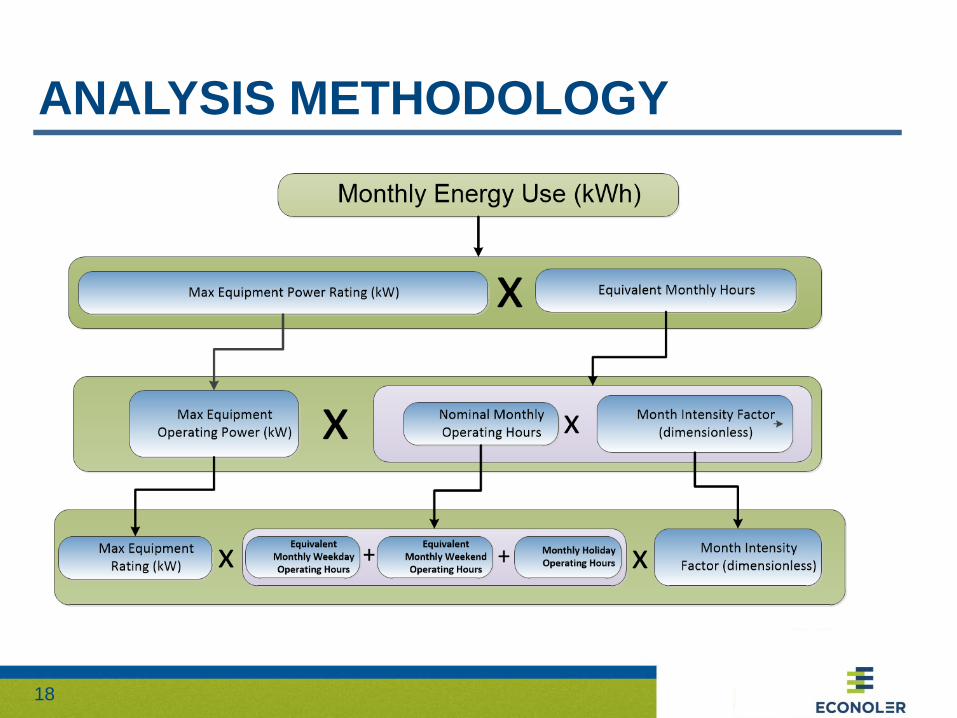
Calculations for energy system can become highly complex. The objective of the tool is to provide
a way to analyze energy use with simplified techniques.
The consumption and demand of energy for a facility is always an estimate which is determined
through a relationship between key operating variables and the physical specifications of
equipment
As with many other analyses, the energy analysis of facilities can be guided by the 80/20 rule
(“Pareto Principle”) whereby an accuracy of 80% can be achieved through sound estimating
techniques.
Energy balances are developed in the tool by guiding the auditor to collect the principle
specifications of equipment to which operation variables (hours, operating intensity) are applied.
The analysis capability of the tool is simple but effective. It is not a complex engineering modeling
tool, but rather a tool to assist in a energy accounting for the auditor. The auditor my use best
engineering judgement to estimate the tool inputs, typically hours of operation and operating
intensities, so that energy use and demand can be estimated.
Energy consumption is estimated on a monthly basis, but is informed by application of hourly
scheduling.
18
ANALYSIS METHODOLOGY

19
ANALYSIS METHODOLOGY
The monthly intensity factor is only for equipment for which operating intensity is affected by weather
severity. The tool assumes that a value of “1” means the equipment is operating at typical maximum
operating power.
For a piece of air conditioning equipment, a value of 1 would be selected if the design temperature was met
or exceeded for that month. Typically, the monthly intensity factor will be below 1.
The user must select an average for this value for the month. The value is typically selected based on the
number of degree days in a month for the case of air conditioning equipment
However, it is possible that the equipment operating
intensity is associated with another independent variable. For example, production intensity at a factory.

20
ANALYSIS METHODOLOGY
The nominal monthly operating hours is the summation of the operating hours for all weekdays, weekends, and holidays in a particular month.
A model day weekends (WE), weekdays (WD), and holidays (HO) is defined in the
tool.
Every hour for each model day for a WE, WD or HO is can be defined as either “on” or “off” which is represented by a “1” or “0”.
A setback factor for each hour in each model day can be defined. The setback factor is
a value between 0 and 1. The purpose of the setback factor is to simulate control of equipment in response to a change in the operating needs of the equipment.
For example, an automation system could be used to either dim or turn off lights in a
certain building space (e.g. hallway). During unoccupied hours, the lights would be expected to then only operate about maybe 10% of the total. For air conditioning
cooling units, this setback factor could also be used to further adjust hourly operating profiles according to the expected hourly change in average outside air temperature.
Just remember that the hourly setback factor is applied to all model day types for the
particular month.
The tool only works to make adjustments for monthly averages, it does not allow customization for each individual day of the month. This is perhaps less accurate, but
is a simplification that should allow for a reasonable level of accuracy.

21
ANALYSIS METHODOLOGY

22
ANALYSIS METHODOLOGY (CONT)
The setback factor can be defined for each
operating hour during the day. This intensity
factor accounts for the following:
Equipment duty cycle (e.g. air conditioning
compressor)
% of full load equipment is operating
Depreciation of loading due to faults: • Lamps burned out in fixture;
• Age factors;
• etc.

23
EA TOOL INTERFACE
24
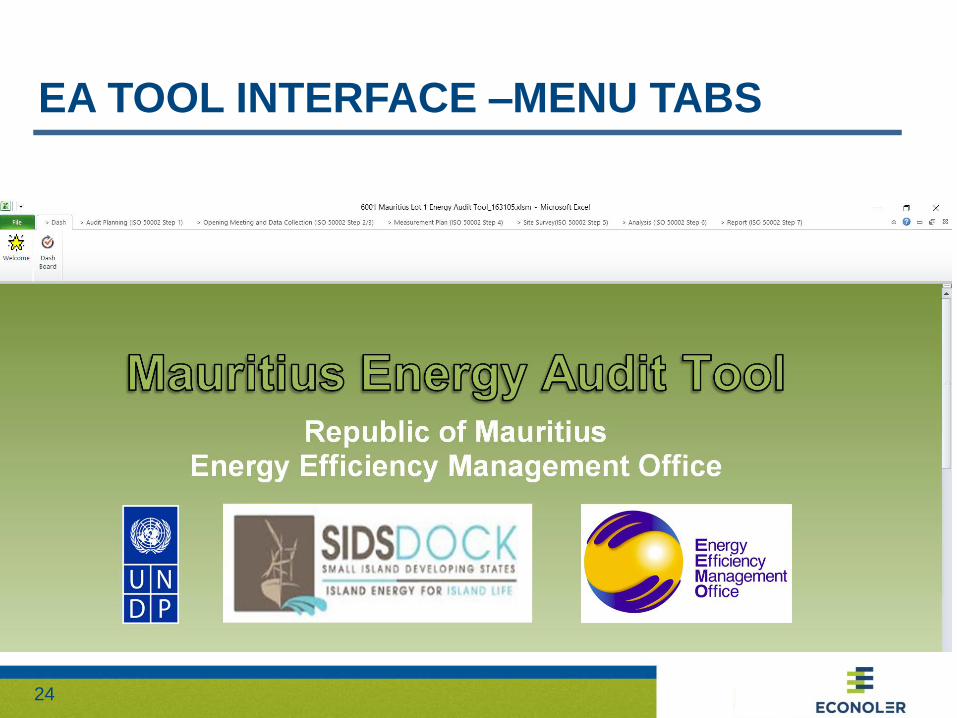
EA TOOL INTERFACE –MENU TABS

25
EA TOOL INTERFACE – RIBBON MENUS
Top ribbon tabs correspond to ISO 50002 step 1-7
Step
1
Step
2
Step
3
Step
4 Step
5
Step
6 Step
7
Step
8
Step 1 Step 2 / Step 3 Step 4 Step 5 Step 6 Step 7
26
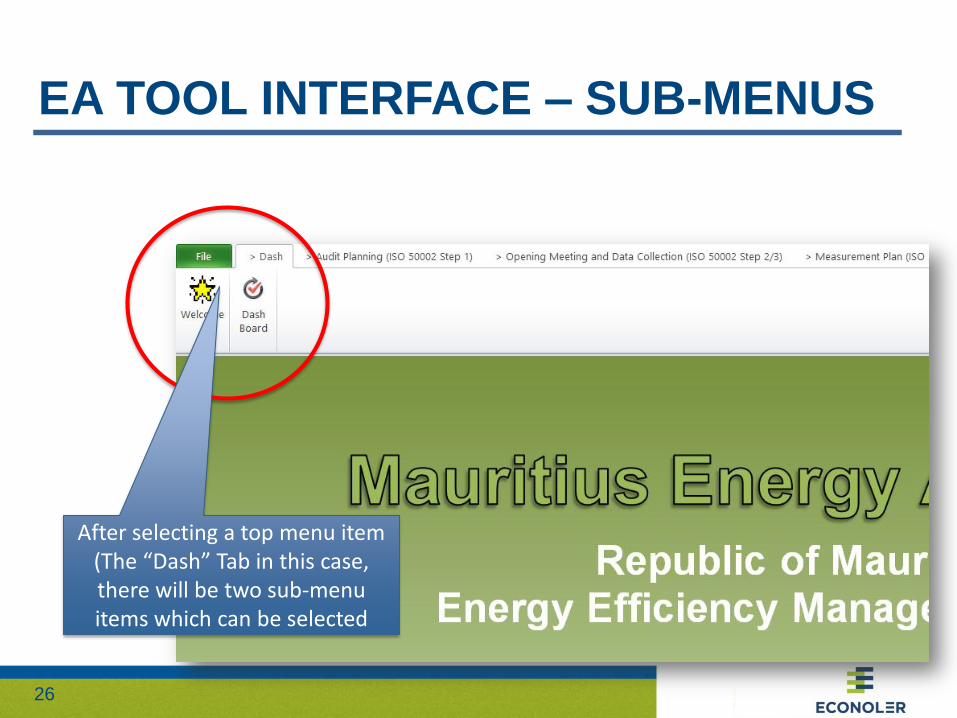
EA TOOL INTERFACE – SUB-MENUS
After selecting a top menu item (The “Dash” Tab in this case, there will be two sub-menu items which can be selected
27
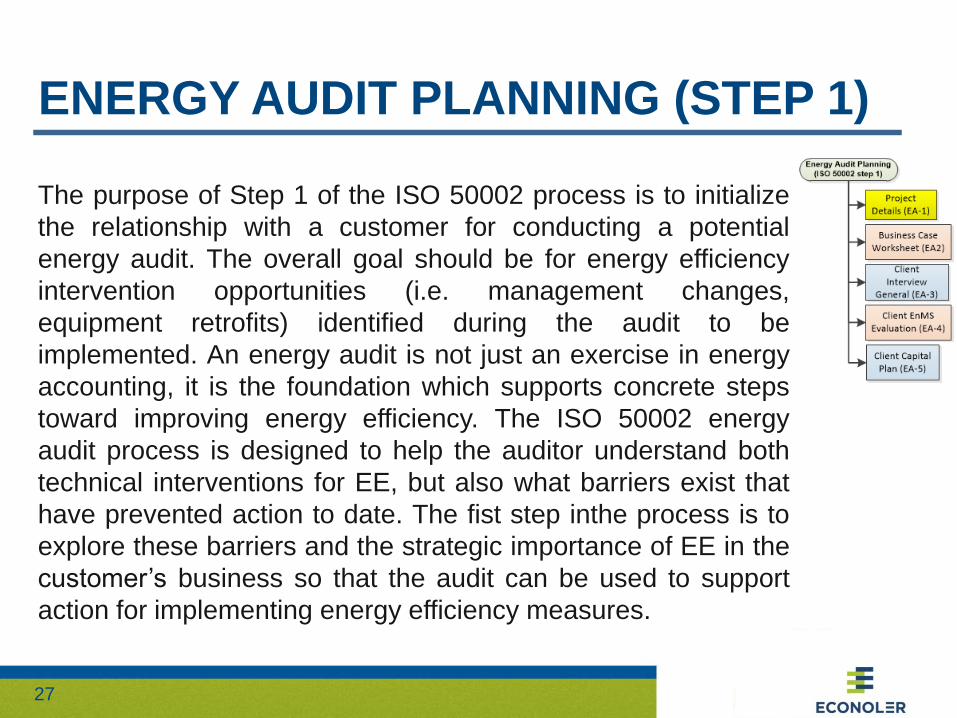
ENERGY AUDIT PLANNING (STEP 1)
The purpose of Step 1 of the ISO 50002 process is to initialize
the relationship with a customer for conducting a potential
energy audit. The overall goal should be for energy efficiency
intervention opportunities (i.e. management changes,
equipment retrofits) identified during the audit to be
implemented. An energy audit is not just an exercise in energy
accounting, it is the foundation which supports concrete steps
toward improving energy efficiency. The ISO 50002 energy
audit process is designed to help the auditor understand both
technical interventions for EE, but also what barriers exist that
have prevented action to date. The fist step inthe process is to
explore these barriers and the strategic importance of EE in the
customer’s business so that the audit can be used to support
action for implementing energy efficiency measures.
28
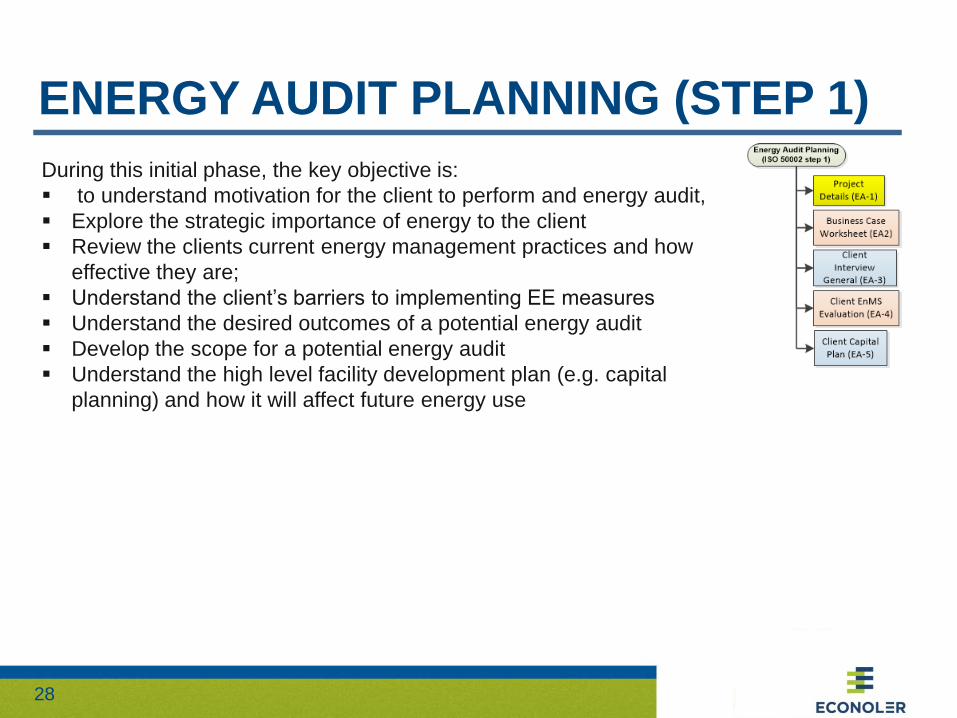
ENERGY AUDIT PLANNING (STEP 1)
During this initial phase, the key objective is:
to understand motivation for the client to perform and energy audit,
Explore the strategic importance of energy to the client
Review the clients current energy management practices and how
effective they are;
Understand the client’s barriers to implementing EE measures
Understand the desired outcomes of a potential energy audit
Develop the scope for a potential energy audit
Understand the high level facility development plan (e.g. capital
planning) and how it will affect future energy use

29
ENERGY AUDIT PLANNING (STEP 1)
EE Barriers
Lack of access to adapted financing
Lack of capacity
Lack of knowledge or
expertise Lack of time/priority
Lack of capacity to take on risk
These are common examples. There can be others. During Step 1, the auditor
should document barriers. The technical solutions will not be implemented
without overcoming EE barriers.

30
DASHBOARD SCREEN
31
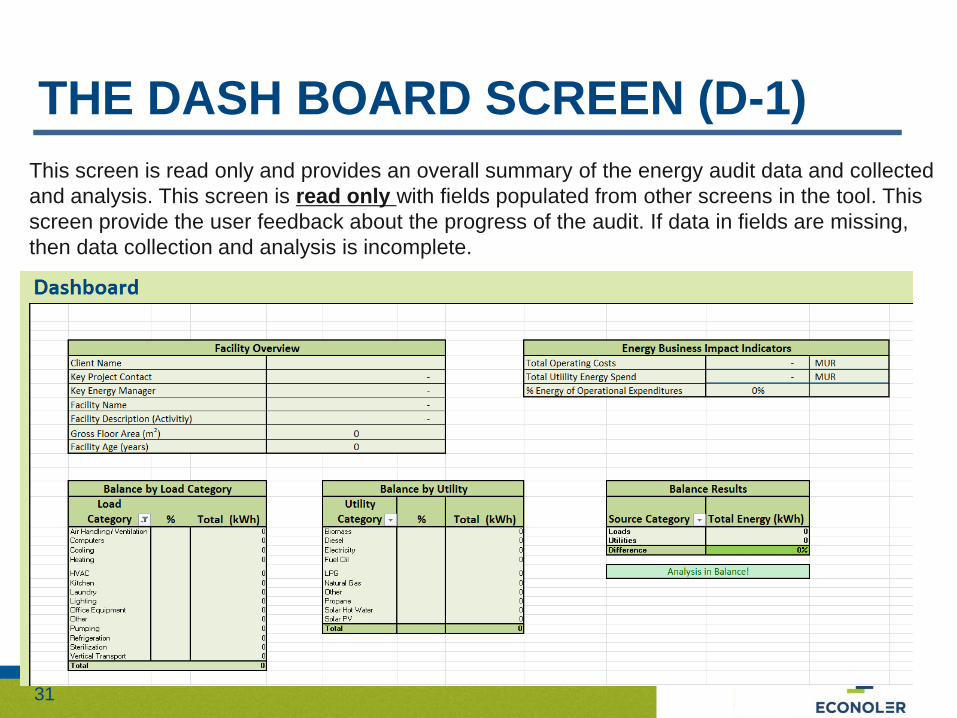
THE DASH BOARD SCREEN (D-1)
This screen is read only and provides an overall summary of the energy audit data and collected
and analysis. This screen is read only with fields populated from other screens in the tool. This
screen provide the user feedback about the progress of the audit. If data in fields are missing,
then data collection and analysis is incomplete.

32
THE DASH BOARD SCREEN FACILITY OVERVIEW
The facility overview screen is just basic data about the client and project. The
fields are populated form the project details screen (EA-1).
33
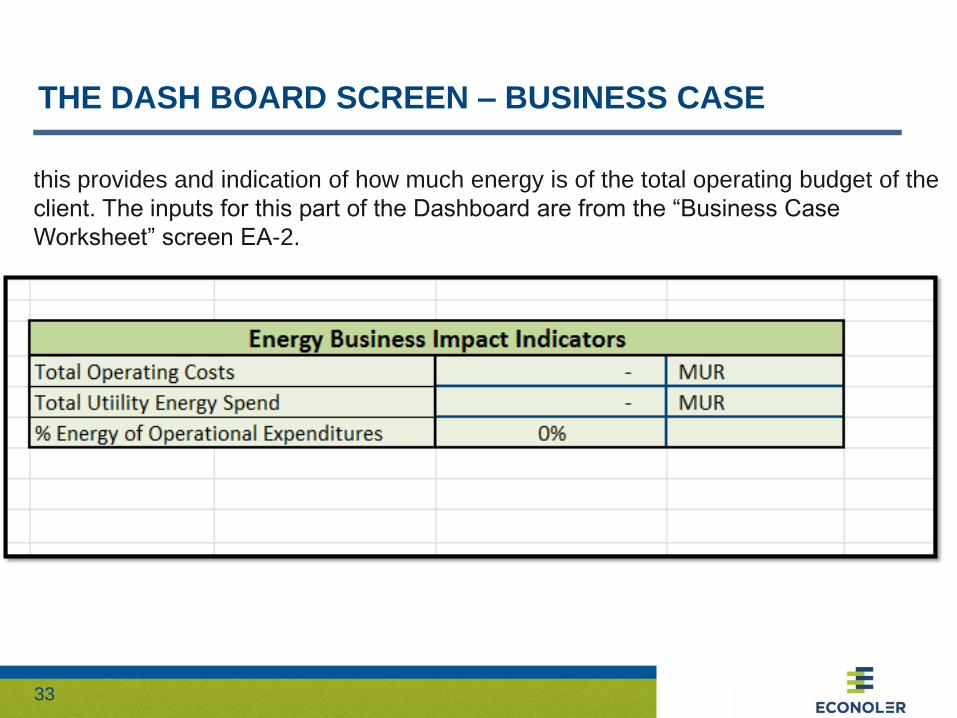
THE DASH BOARD SCREEN – BUSINESS CASE
this provides and indication of how much energy is of the total operating budget of the
client. The inputs for this part of the Dashboard are from the “Business Case
Worksheet” screen EA-2.
34
THE DASH BOARD SCREEN – BUSINESS CASE
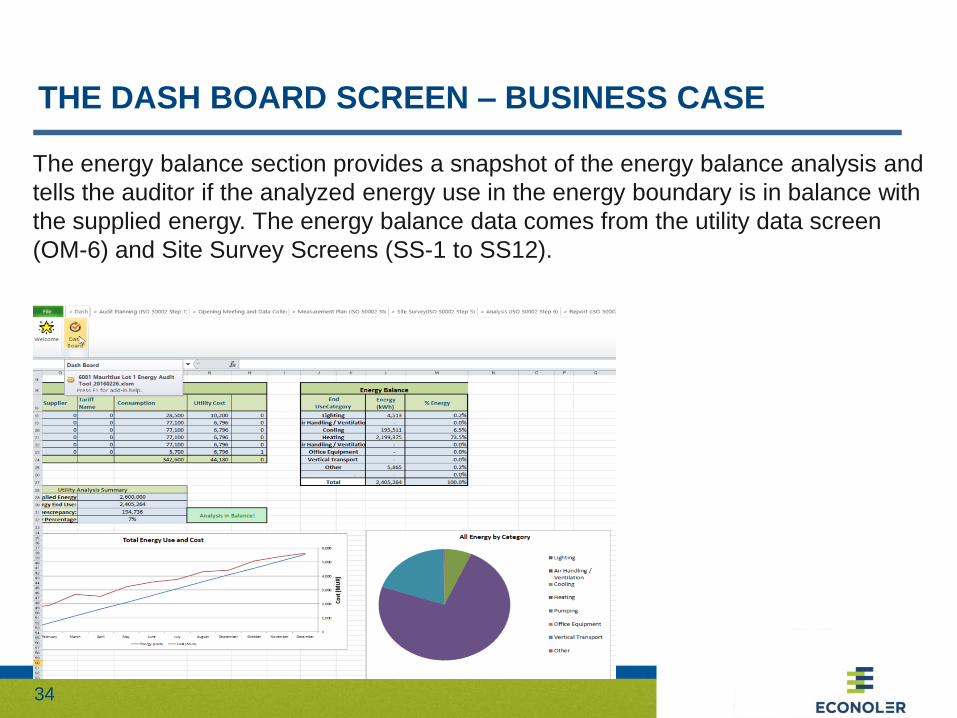
The energy balance section provides a snapshot of the energy balance analysis and
tells the auditor if the analyzed energy use in the energy boundary is in balance with
the supplied energy. The energy balance data comes from the utility data screen
(OM-6) and Site Survey Screens (SS-1 to SS12).

35
THE DASH BOARD SCREEN – SUMMARY OF MEASURES
This last table in the dashboard is a summary of recommended measures. This data
comes from the analysis screens in the tool (AN-1 to AN-6).

36
AUDIT PLANNING – ISO 5002 STEP 1

37
AUDIT PLANNING-PROJECT DETAILS SCREEN
These are the basic project details for the audit, including client and site descriptions. The analyses in the
tool does not depend on this data. The purpose of the data in this screen is to document the basic site and
project data. The data in this screen is actually optional, but highly recommended to properly document the
audit. None of the data in this screen will affect the energy analysis.

38
AUDIT PLANNING-PROJECT DETAILS SCREEN
The purpose of the business case screen is to help the auditor and client determine how much impact energy has on
operating costs. This screen is a tool only and should be used by the auditor to help understand the strategic context of
energy (importance of energy) in the organization. This will help the auditor and customer in the discussion about the object
of the audit and to identify the level of emphasis that should be put on “non-energy” benefits of energy efficiency (e.g.
improved production quality, increased production reliability, environmental sustainability, health and human safety, etc. If
energy expenditure is more than 10%, then energy savings is probably very important. If energy expenditure is less than 5%
then energy expenditure is probably no a significant concern. The information helps the auditor to understand strategies for
development of energy efficiency measures. If there is low interest in saving energy then other rationale must be found for
justifying projects. This screen is only a stand alone tool for informaing retrofit strategy and does not affect the energy
analysis.

39
AUDIT PLANNING – CLIENT INTERVIEW QUESTIONS
The purpose of this screen EA-3 is to provide a form to help the auditor with further engaging the clients about how the
organization manages energy and what the strategic business context of energy is in the company. This screen should be
printed out and taken with the auditor during initial discussions about planning an energy audit with the client. These questions
can be used again when speaking with other people involved with energy at the company as well even after a formal
agreement for performing an energy audit has been signed.

40
AUDIT PLANNING – EVALUATION OF CLIENT ENERGY MANAGEMENT
The purpose of screen EA-3 is to provide the auditor with a tool to objectively score energy management
practices at an organization. The tool has a series of criteria for which the auditor can select a weight. This
tool is stand alone and input into this screen does not affect the energy analysis on other screens.
41
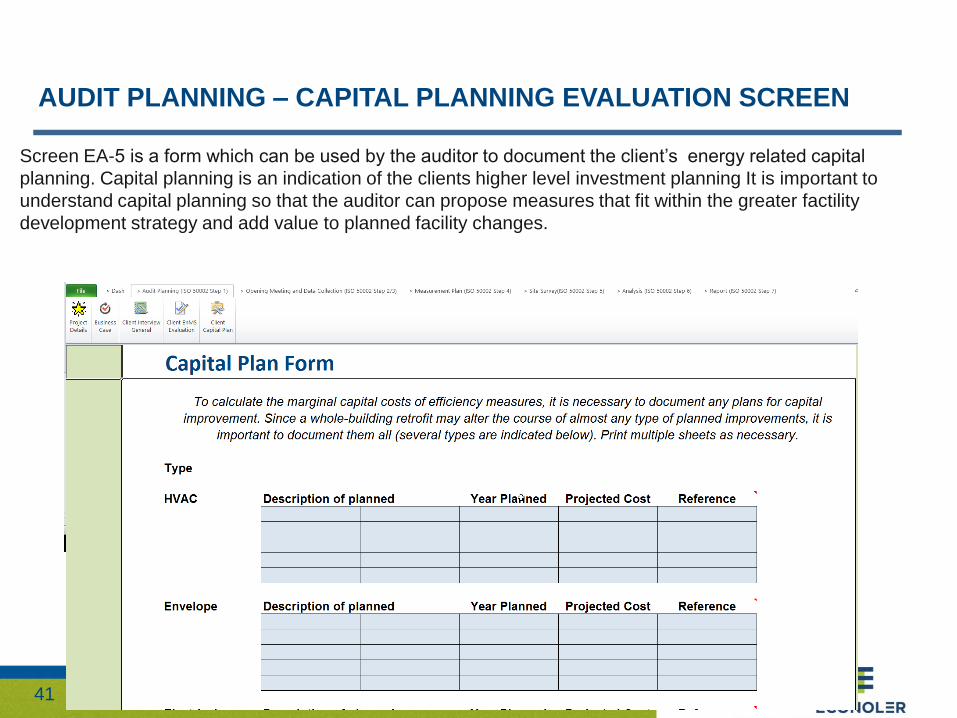
AUDIT PLANNING – CAPITAL PLANNING EVALUATION SCREEN
Screen EA-5 is a form which can be used by the auditor to document the client’s energy related capital
planning. Capital planning is an indication of the clients higher level investment planning It is important to
understand capital planning so that the auditor can propose measures that fit within the greater factility
development strategy and add value to planned facility changes.

42
AUDIT PLANNING - OUTPUTS
The outcome of step 1 of the energy audit process should be an
agreement with the client regarding the scope and goals of the energy
audit. Ideally, the client and auditor should develop and agree upon a
terms of reference for the audit. The audit tool provides some guidance
and tools for the auditor to explore the organization’s requirements,
identification of goals (including investment criteria), and the scope for
the energy audit. The forms and tools under the Energy Audit Planning
tab are design to assist the auditor in the process. The next step of the
audit process is to have an official kick off meeting for the energy audit
itself and to begin initial data collection tasks.

43
OPENING MEETING / DATA COLLECTION
ISO 50002 – STEP 2/3
44
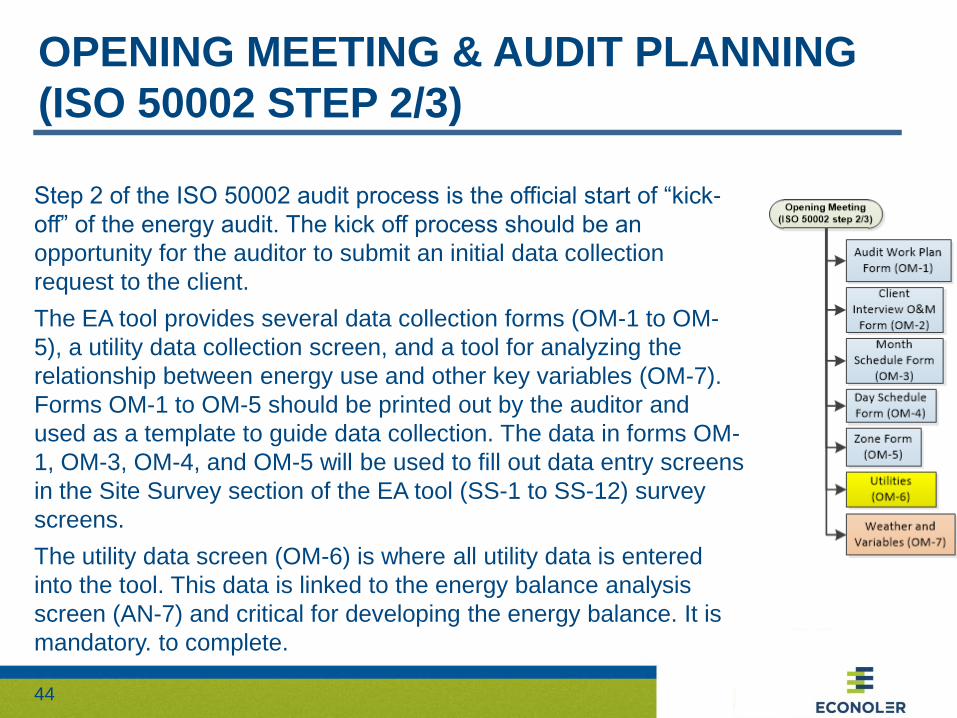
OPENING MEETING & AUDIT PLANNING
(ISO 50002 STEP 2/3)
Step 2 of the ISO 50002 audit process is the official start of “kick-
off” of the energy audit. The kick off process should be an
opportunity for the auditor to submit an initial data collection
request to the client.
The EA tool provides several data collection forms (OM-1 to OM-
5), a utility data collection screen, and a tool for analyzing the
relationship between energy use and other key variables (OM-7).
Forms OM-1 to OM-5 should be printed out by the auditor and
used as a template to guide data collection. The data in forms OM-
1, OM-3, OM-4, and OM-5 will be used to fill out data entry screens
in the Site Survey section of the EA tool (SS-1 to SS-12) survey
screens.
The utility data screen (OM-6) is where all utility data is entered
into the tool. This data is linked to the energy balance analysis
screen (AN-7) and critical for developing the energy balance. It is
mandatory. to complete.
45
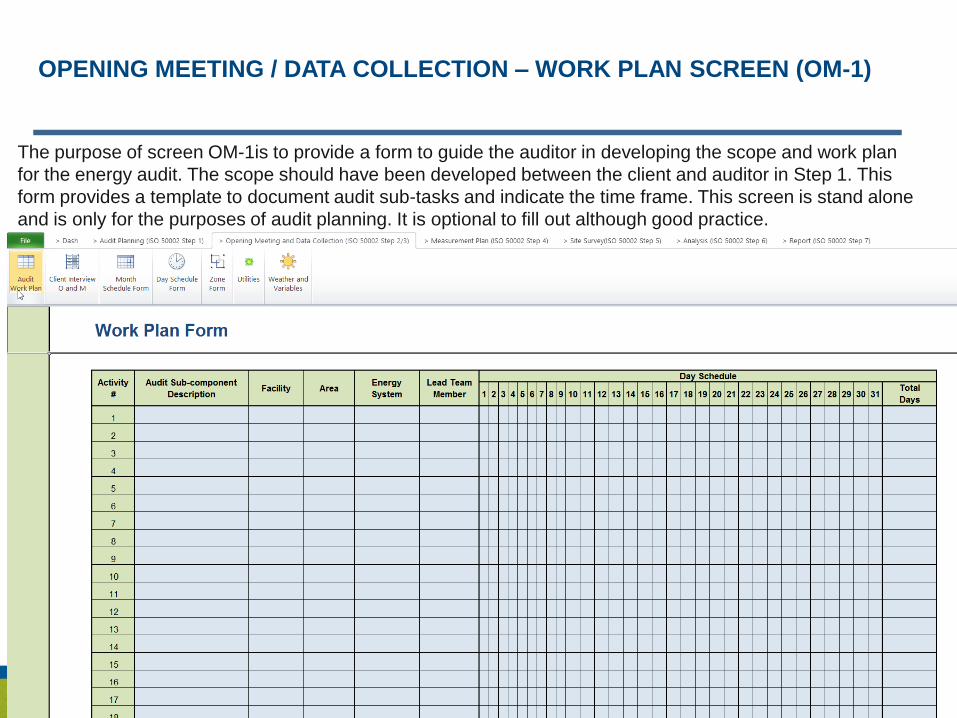
OPENING MEETING / DATA COLLECTION – WORK PLAN SCREEN (OM-1)
The purpose of screen OM-1is to provide a form to guide the auditor in developing the scope and work plan
for the energy audit. The scope should have been developed between the client and auditor in Step 1. This
form provides a template to document audit sub-tasks and indicate the time frame. This screen is stand alone
and is only for the purposes of audit planning. It is optional to fill out although good practice.

46
OPENING MEETING / DATA COLLECTION – O&M RECORD FORM SCREEN (OM-2)
The purpose of screen OM-2 is to guide the energy auditor in recording the existing operations and
maintenance issues and historical O&M works. This will help the auditor and client plan the audit and
focus on the most strategic operational areas. This screen is stand alone and is only provided to guide the
auditor to explore current O&M that affect energy use.

47
OPENING MEETING / DATA COLLECTION – MONTHLY SCHEDULE FORM SCREEN
The purpose of this screen is to provide the auditor a form to record typical daily operating schedules for
each month. This screen is provided to guide the auditor in collecting data about the facility schedule. This
is a stand alone screen and does not link to any analysis screens. Filling out data fields in this form is
optional.

48
OPENING MEETING / DATA COLLECTION – DAILY OPERATING PROFILE SCREEN
The purpose of this screen is to provide the auditor a form to record daily operating profiles of the facility for indicated
periods. The profiles should be defined by schedule, which typically associated with a piece of equipment, area of a building,
etc. The data fields in this form do not link to any other screens. Completing the data fields in this form is optional. The
auditor will use the data collected for the fomr in screen OM-4 to complete the data required for screen SS-2.

49
OPENING MEETING / DATA COLLECTION – O&M RECORD FORM SCREEN
The purpose of screen OM-5 is to guide the energy auditor in collected zone data. This form should be printed out and taken
to the initial audit kick off meeting and to subsequent site data collection visits. A zone is typically the delineation of specific
energy sub-system boundaries. For example, a particular room in a building, the central plant, a production line, etc. Screen
OM-5 is stand alone and does not link to any other screens. It is only provided to assist the auditor in organizing data
collection. Data collected for zones is used in screens SS-1 to SS-12.

50
OPENING MEETING / DATA COLLECTION – UTILITY DATA ENTRY SCREEN
Screen OM-6 is a critical data entry screen. The data used to fill in the fields in screen OM-6 is the utility data provided by the
clients – typically in the form of a utility bill. Screen OM-6 has a series of navigation buttons at the top to access the individual
utility data entry sections on the sheet. This energy summary screen at the top is populated by utility entry fields below. The
data in this screen IS NOT optional and is critical to the energy analysis. This data is primarily used as input for the “Weather
and Variables” screen (OM-7) and the Energy Balance screen (AN-7).
The blended utility rate is simply the total utility cost divided by the total energy use. This rate should only be used for
initial savings estimates.

51
OPENING MEETING / DATA COLLECTION – UTILITY DATA ENTRY SCREEN
If the button for an individual utility is pressed (electricity in the example below), the portion of the sheet that has the
electricity data entry section will be shown. This part of the screen is editable and should be used to enter the utility data.
Fields are provided for billed and metered energy. In the cost section, there are fields for various utility bill charges. All
charge components should be entered as appropriate. For the tool to function correctly, minimally, the metered energy and
all the utility bills charges should be entered.
Graphs to assist in analyzing usage patterns.
52
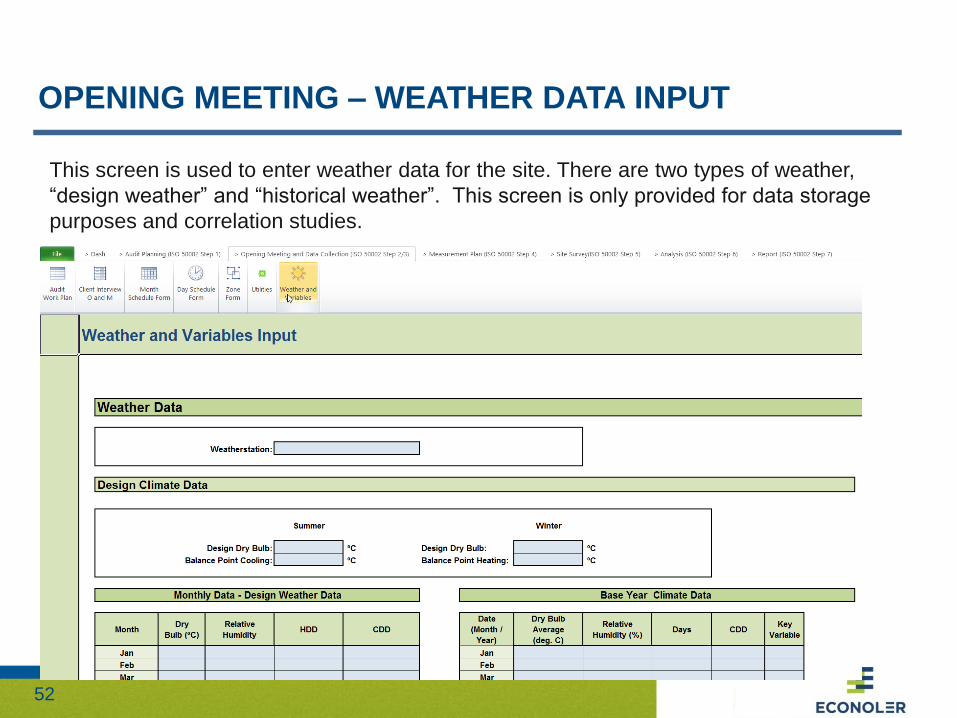
OPENING MEETING – WEATHER DATA INPUT
This screen is used to enter weather data for the site. There are two types of weather,
“design weather” and “historical weather”. This screen is only provided for data storage
purposes and correlation studies.
53
OPENING MEETING– WEATHER DATA INPUT
The design weather data is used to predict energy
savings. It is based on a statistical set of data
published by the local weather service or a number
of other providers.
The base year weather should correspond to the
selected base period. This is the actual recorded
weather data that corresponds to the base period.
54
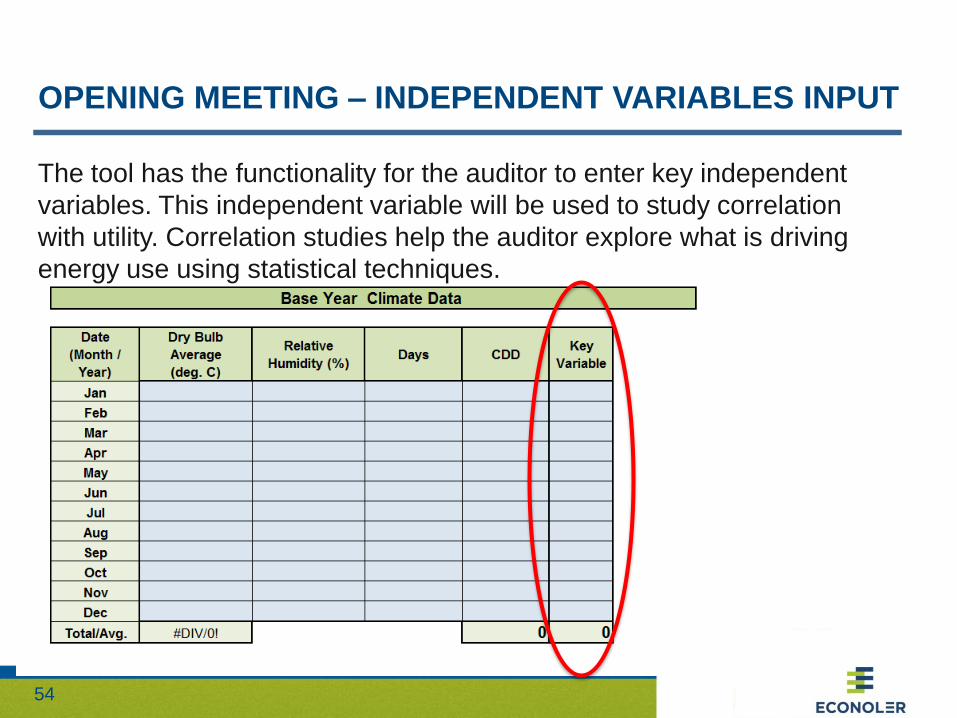
OPENING MEETING – INDEPENDENT VARIABLES INPUT
The tool has the functionality for the auditor to enter key independent
variables. This independent variable will be used to study correlation
with utility. Correlation studies help the auditor explore what is driving
energy use using statistical techniques.

55
OPENING MEETING – INDEPENDENT VARIABLES INPUT
Like weather, there may be other key independent
variables that are important to the auditor in
analyzing the factors that drive energy
consumption:
- Production volume
- Patients in a hospital
- Guests in a hotel
- etc.
56
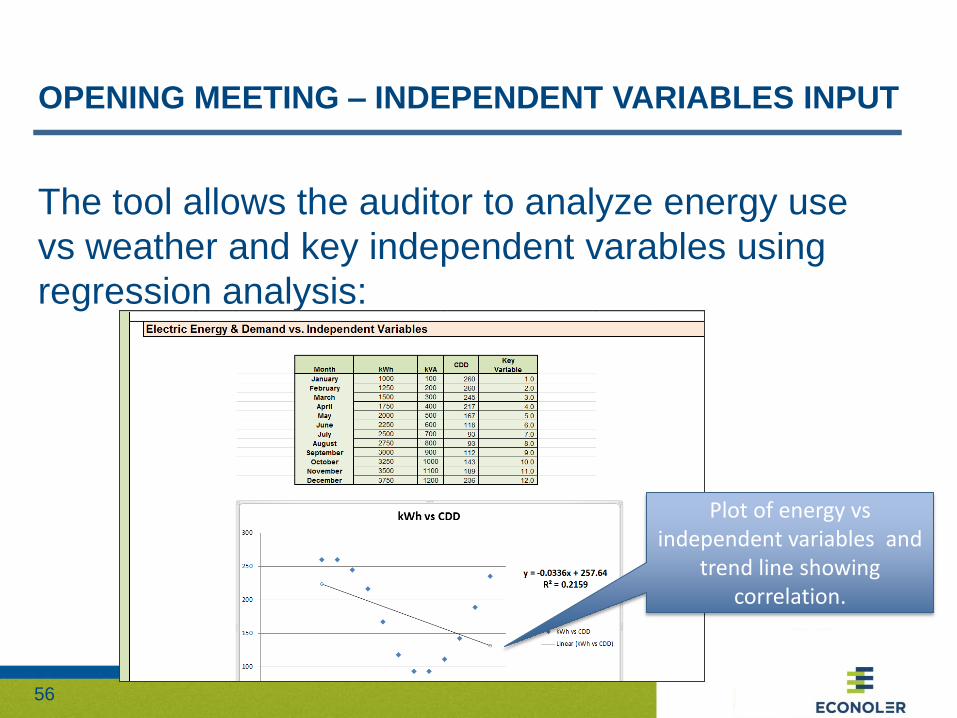
OPENING MEETING – INDEPENDENT VARIABLES INPUT
The tool allows the auditor to analyze energy use
vs weather and key independent varables using
regression analysis:
Plot of energy vs independent variables and
trend line showing correlation.
57
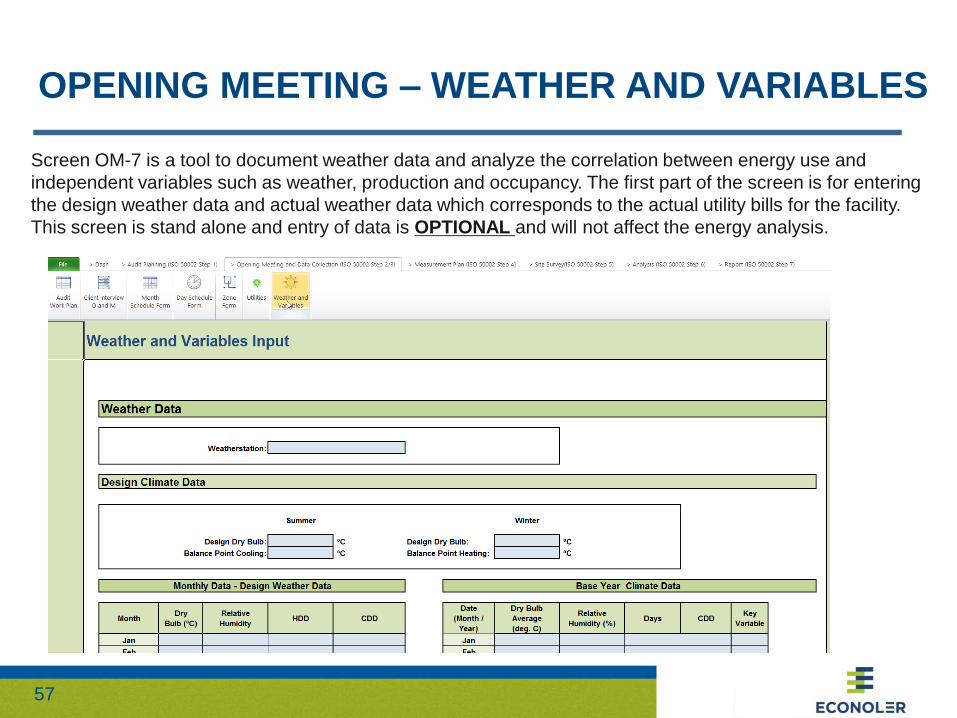
OPENING MEETING – WEATHER AND VARIABLES
Screen OM-7 is a tool to document weather data and analyze the correlation between energy use and
independent variables such as weather, production and occupancy. The first part of the screen is for entering
the design weather data and actual weather data which corresponds to the actual utility bills for the facility.
This screen is stand alone and entry of data is OPTIONAL and will not affect the energy analysis.

58
OPENING MEETING – WEATHER AND VARIABLES
Screen OM-7 has a section for the user to fill in design weather data. Design weather
data is the average data for a location taken over 20 years. There is also a weather
data section for the actual weather data. This should be the actual weather data that
corresponds to the base period being examined. The base year climate data table
also has a field for a “key variable”. Minimally, to use the tools below in this screen for
correlation studies, the cooling degree days and key variable must be entered in the
Base Year Climate Data table.

59
OPENING MEETING – WEATHER AND VARIABLES
Screen OM-7 also provide a regression tool to help the auditor test the correlation between a energy use
associated with a particular utility and a selected independent or “key” variable. The energy data for each utility
is filled from the utility data screen (OM-6). The key variable is filled from the first part of the screen in the
weather data sections. In the weather data section under the base year climate data table there is a column to
fill in the value of an independent variable. It is critical to enter the key independent variable and Cooling
degree days so that the correlation data can be generated below.

60
OPENING MEETING – WEATHER AND VARIABLES
Shown to the right is the two
correlation graphs that will be
generated when the energy data,
weather data, and key variable value
is entered. The correlation graphs will
help the auditor determine what key
variable the energy use pattern is
correlated. In a typical office buidling,
this would be weather (represented
by cooling degree days. However, in
a factory, this would be represented
by production or some other
production variable. In a hotel, the
key variable might be guest
occupancy.
61
MEASUREMENT PLANNING
ISO 50002 STEP 4

62
MEASUREMENT PLANNING – MEASUREMENT PLANNING FORM
This first screen in the Measurement Plan step of the ISO process is to
guide the auditor in planning the requirement measurements required
before going to the site. This form will assist in identifying equipment
required and site coordination requirements.
63
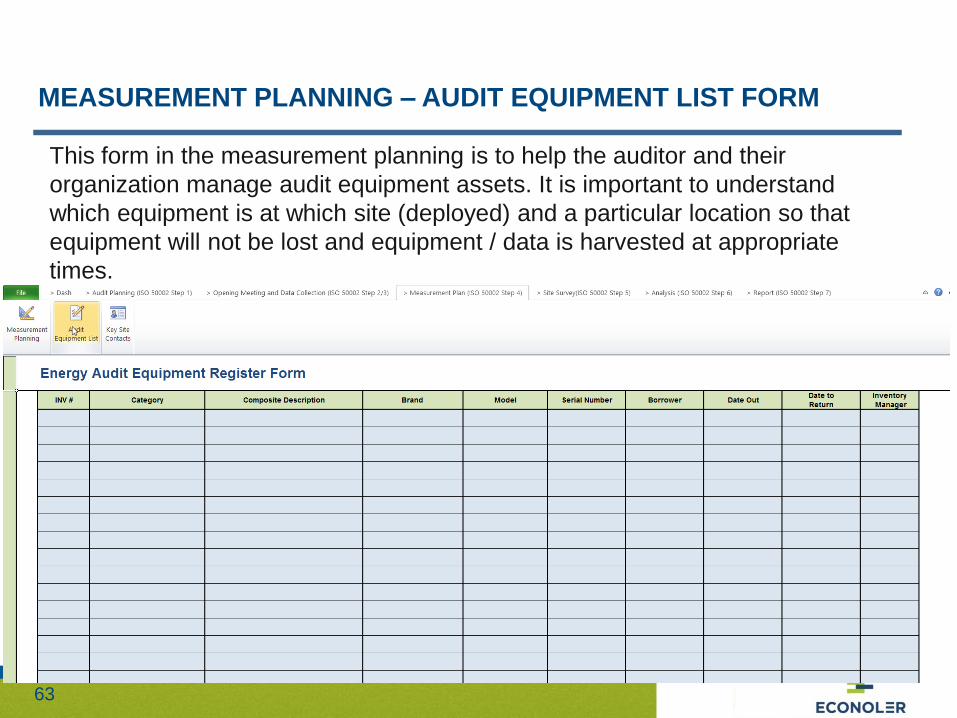
MEASUREMENT PLANNING – AUDIT EQUIPMENT LIST FORM
This form in the measurement planning is to help the auditor and their
organization manage audit equipment assets. It is important to understand
which equipment is at which site (deployed) and a particular location so that
equipment will not be lost and equipment / data is harvested at appropriate
times.

64
MEASUREMENT PLANNING – MEASUREMENT PLANNING FORM
This screen in the measurement planning step is to assist the auditor in on
site coordination with appropriate contact in particular areas of the facility
where the audit will take place. It is mean as a reminder for on site
interviews.

65
SITE SURVEY – ISO 50002 STEP 5
66
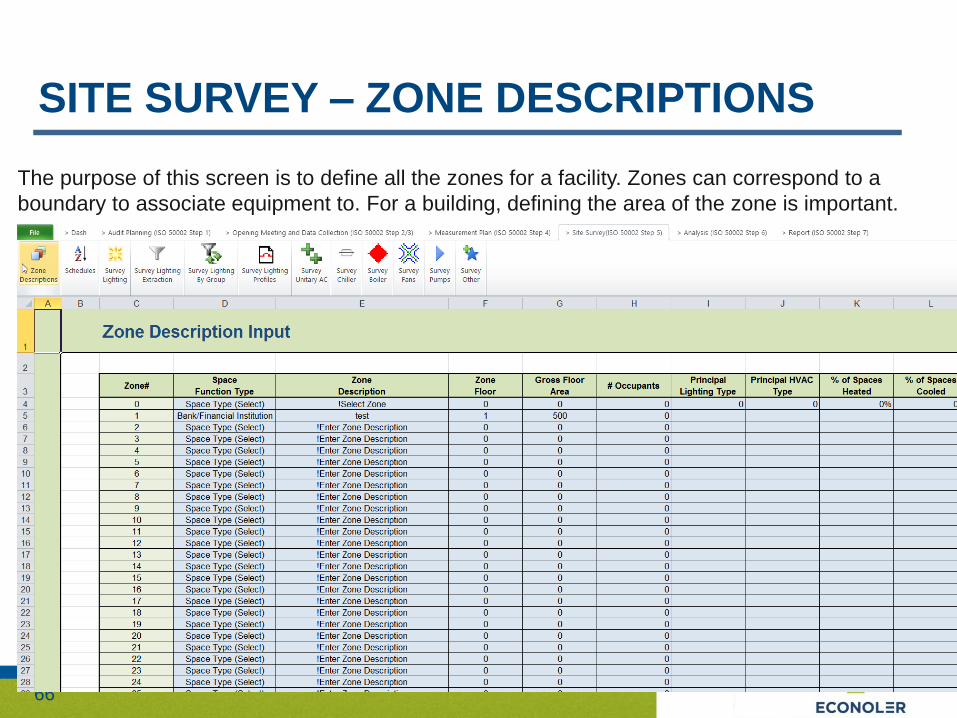
SITE SURVEY – ZONE DESCRIPTIONS
The purpose of this screen is to define all the zones for a facility. Zones can correspond to a
boundary to associate equipment to. For a building, defining the area of the zone is important.

67
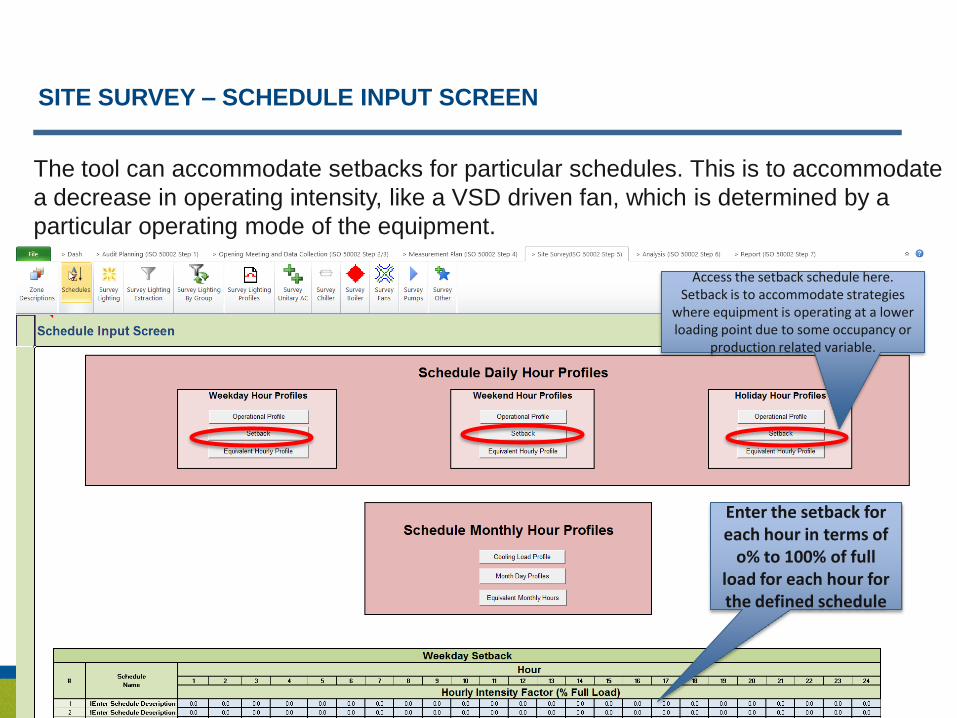
SITE SURVEY – SCHEDULE INPUT SCREEN
The scheduling screen is a key part of the analysis input. Schedules are defined on
the basis of day profiles, month day profiles, and intensity factors for daily and the
monthly schedule profiles.

68
SITE SURVEY – SCHEDULE INPUT SCREEN
The daily operating profiles are defined for weekdays, weekends, and holidays on a 24 hour
basis. The daily operating profile for weekdays are where schedules are initially defined for each
piece of equipment. Minimally, the schedule name must be entered. Access the appropriate day profile and then define the schedule on a 24 hour basis
Define each schedule here.
69
SITE SURVEY – SCHEDULE INPUT SCREEN
The tool can accommodate setbacks for particular schedules. This is to accommodate
a decrease in operating intensity, like a VSD driven fan, which is determined by a
particular operating mode of the equipment.
Access the setback schedule here. Setback is to accommodate strategies
where equipment is operating at a lower loading point due to some occupancy or
production related variable.
Enter the setback for each hour in terms of
o% to 100% of full load for each hour for the defined schedule
70
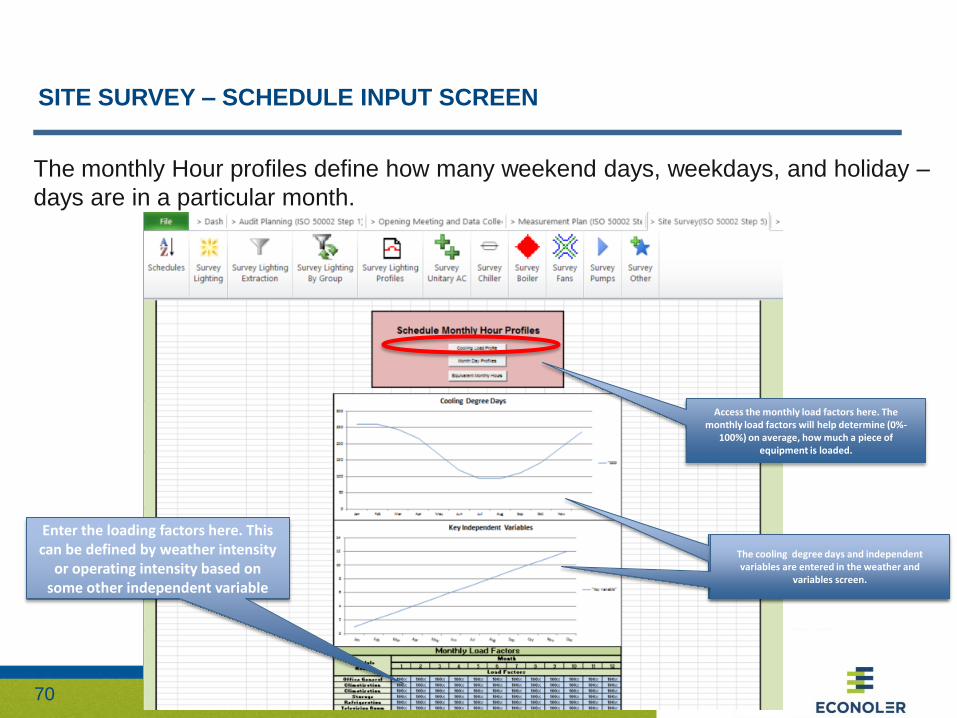
SITE SURVEY – SCHEDULE INPUT SCREEN
The monthly Hour profiles define how many weekend days, weekdays, and holiday –
days are in a particular month.
Enter the loading factors here. This can be defined by weather intensity
or operating intensity based on some other independent variable
Access the monthly load factors here. The monthly load factors will help determine (0%-
100%) on average, how much a piece of equipment is loaded.
The cooling degree days are entered in the weather and variables schree.
The cooling degree days and independent variables are entered in the weather and
variables screen.

71
SITE SURVEY – SCHEDULE INPUT SCREEN
The monthly Hour profiles define how many weekend days, weekdays, and holiday –
days are in a particular month.
Define the number of days in a month here for each category
(weekend, holiday, etc)
Access the month day profile here

72
SITE SURVEY – EQUIVALENT MONTHLY HOURS
The equivalent monthly hours will show, after all schedule, setback, and monthly
intensity factors are entered, what the equivalent monthly hours are.
Access the equivalent monthly
hours here
Shows the equivalent monthly
hours.
73
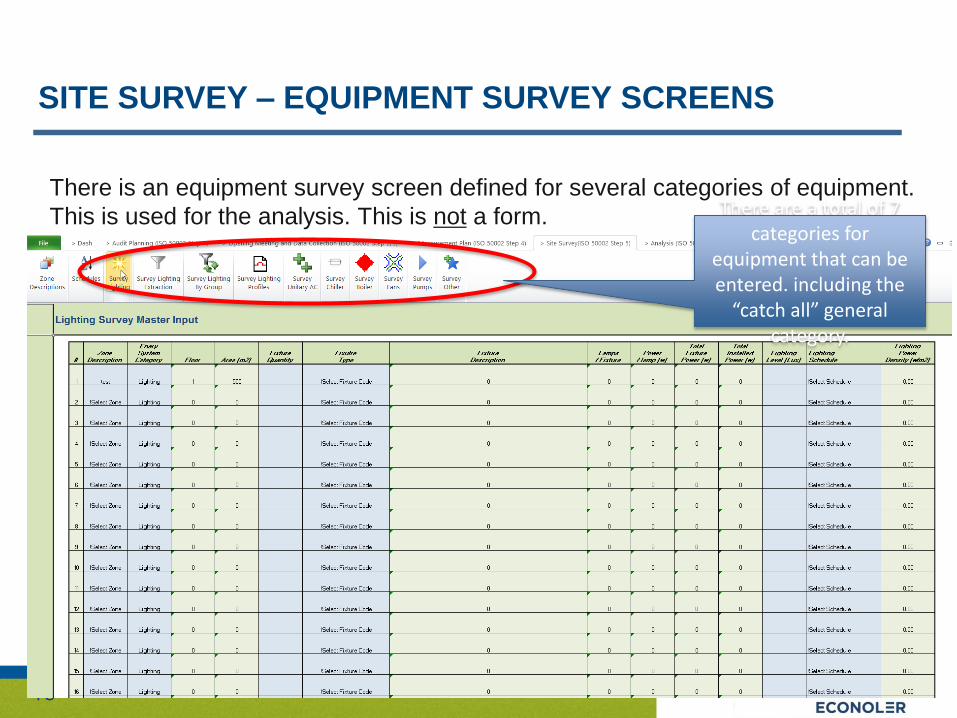
SITE SURVEY – EQUIPMENT SURVEY SCREENS
There is an equipment survey screen defined for several categories of equipment.
This is used for the analysis. This is not a form. There are a total of 7 categories for
equipment that can be entered. including the
“catch all” general category.

74
ANALYSIS – ISO STEP 6

75
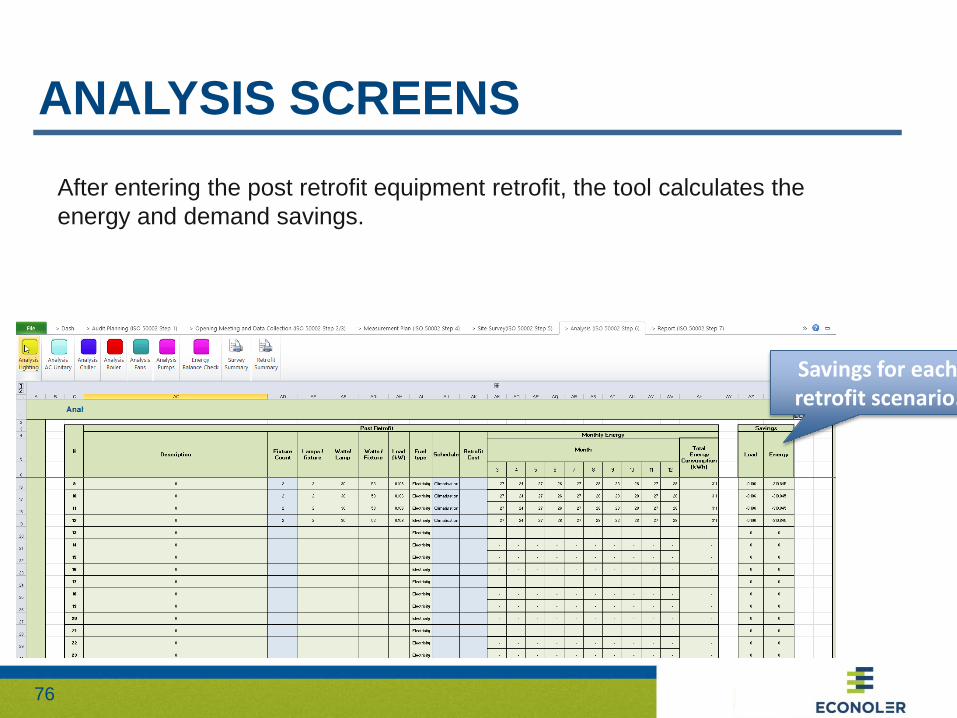
ANALYSIS SCREENS
The site survey data automatically populates the survey portion of the analysis
screen. For each piece of equipment, the auditor can then enter a corresponding
new piece of equipment with new schedule if desired. This represents the retrofit.
Retrofit table entry.
Survey table entry auto populated.
76
ANALYSIS SCREENS
After entering the post retrofit equipment retrofit, the tool calculates the
energy and demand savings.
Savings for each retrofit scenario.
77
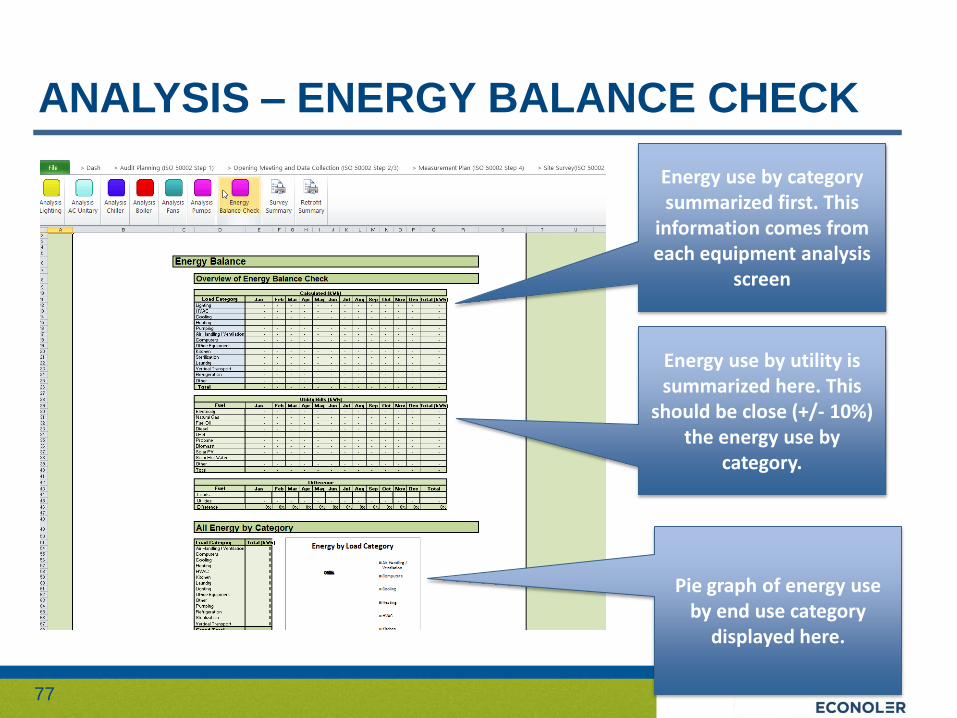
ANALYSIS – ENERGY BALANCE CHECK
Energy use by category summarized first. This
information comes from each equipment analysis
screen
Energy use by utility is summarized here. This
should be close (+/- 10%) the energy use by
category.
Pie graph of energy use by end use category
displayed here.
78
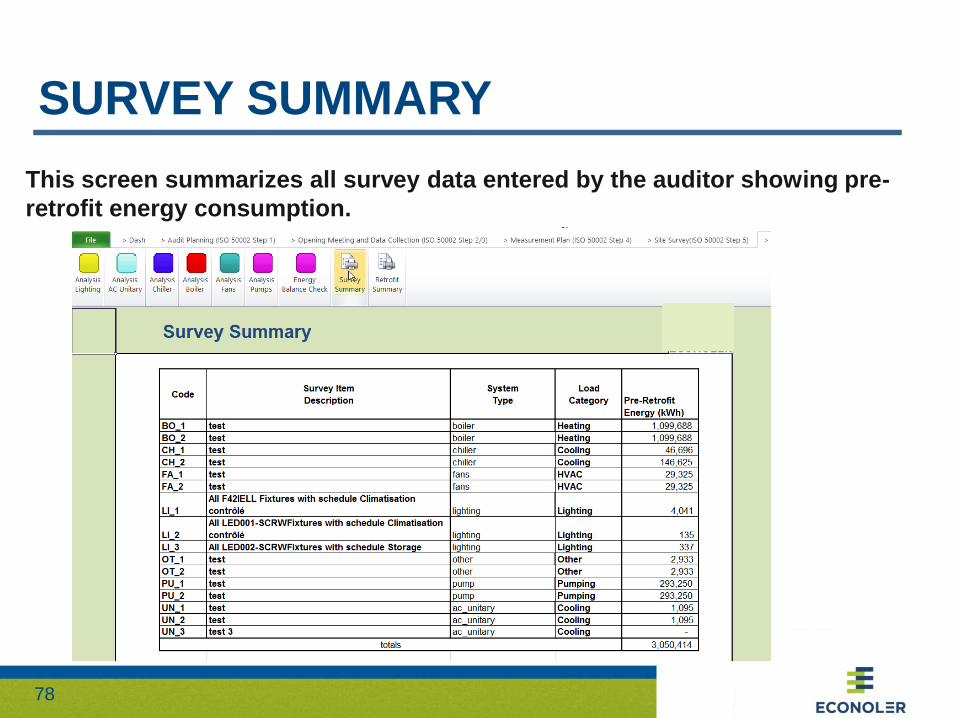
SURVEY SUMMARY
This screen summarizes all survey data entered by the auditor showing pre-
retrofit energy consumption.

79
RETROFIT SUMMARY
This screen summarizes the retrofits entered by the auditor with a summary of
energy savings and cost savings.

80
REPORTING - ISO 5002 STEP 7

81
REPORTING
The tool provides for an energy audit summary template. This summary report
template can be filled in with text, but the main purpose is to guide the energy auditor
in developing an outline for a longer audit report.