employment of youth with disabilities after high school - nlts2
TRANSCRIPT
5-1
5. EMPLOYMENT OF YOUTH WITH DISABILITIES AFTER HIGH SCHOOL
By Renée Cameto
Employment is the norm in American society, and it often begins at an early age. Approximately half of 12- and 13-year-olds in the general population report that they work (Rothstein & Herz, 2000), and by age 17, 86% of high school students do (Bureau of Labor Statistics, 2004a). The opportunity to hold a job while in high school can provide all youth with important experiences that help prepare them for taking on one of the most important adult roles—that of a productive adult worker. Employment experiences may be particularly important for youth with disabilities because they can provide a new outlet for demonstrating skills and competencies and for formulating friendships. An analysis of the employment experiences of youth with disabilities during high school (Marder, Cardoso, & Wagner, 2003) concluded that they are employed about as frequently as youth in the general population, and they demonstrate the same variations by gender, age, and other demographic factors that are common in the general population. For example, girls are more likely than boys to work in personal care jobs, including babysitting, whereas boys are more likely than girls to work in maintenance jobs (many of which are lawn mowing or gardening). While in high school, youth’s jobs are typically part-time, and about half of working youth with disabilities earn the minimum wage or more.
Exiting high school can present increased opportunities and expectations for employment, and working can begin to resemble more closely adult roles for both youth with disabilities and youth in the general population. Although some youth go on to postsecondary education or training and do not work, and others both work and go to school, for many this is the time to take on the challenge of adulthood and begin to engage in employment as a means of support. Data for the general population demonstrate that 55% of 2003 high school graduates were employed by the following fall, including 42% of those who were going to college and 78% of those who were not (Bureau of Labor Statistics, 2004b). How do youth with disabilities compare?
This chapter examines changes in the employment experiences of youth with disabilities who have been out of high school up to 2 years. It begins by providing two perspectives on the employment of out-of-school youth with disabilities as context for understanding their experiences: their parents’ expectations regarding their future employment prospects and their own transition goals related to employment. It continues with a discussion of changes in the current employment status of youth who had been out of school up to 2 years between the time of the Wave 1 interview, when the large majority of these youth were in secondary school, and the Wave 2 interview, when all these youth had left high school.1 Results of multivariate analyses are reported, which indicate characteristics of youth with disabilities that are associated with a higher likelihood of employment.2 The chapter then examines changes in youth’s employment experiences, including: 1 Employment rates of youth with disabilities represented in NLTS2 are not compared with those reported for the original NLTS because age differences in the two samples make straightforward comparisons misleading. A subsequent report will present findings of analyses that include the adjustments necessary for accurate comparisons between NLTS and NLTS2. 2 Multivariate analyses do not include factors related to youth’s school programs because complete data on those programs are not yet available.
5-2
• Types of jobs held
• Number of hours worked
• Wages and benefits received.
Additional findings are reported for youth’s current or most recent job in Wave 2 regarding:
• Duration of employment
• Accommodations received
• Job satisfaction.
Job search activities for unemployed youth also are described. Findings are reported for youth with disabilities as a whole for whom data are available for both Waves 1 (2001) and 2 (2003) of NLTS2 and for those who differ in their school-leaving status, primary disability classification while in secondary school, and selected demographic characteristics when differences are significant.
Parents’ and Youth’s Aspirations for Youth’s Employment Both parents’ expectations for the future of their adolescent children with disabilities and
youth’s own preferences and goals can help shape their trajectory into the early postschool years. To document the perspectives of parents and youth with disabilities, information was collected when these out-of-school youth were still in secondary school about parents’ expectations for youth’s future employment and about their postschool employment goals. Parents reported their expectations in a telephone interview, and school staff provided information about youth’s employment goals in a survey about transition planning.
Parents’ Expectations for Youth’s Employment As is the case for postsecondary school participation, parents’ expectations can be a
powerful influence on the employment options, experiences, and outcomes of youth as they become young adults. When youth with disabilities were in high school, parents of those who were not currently working were asked “How likely do you think it is that [youth] eventually will get a paid job?” Parents reported that they thought their son or daughter “definitely” or “probably” would or “definitely” or “probably” would not get a paid job.3 Because they had already achieved paid employment, youth who had a paid job at the time of the interview were included among youth who “definitely” were expected to have paid employment in the future.
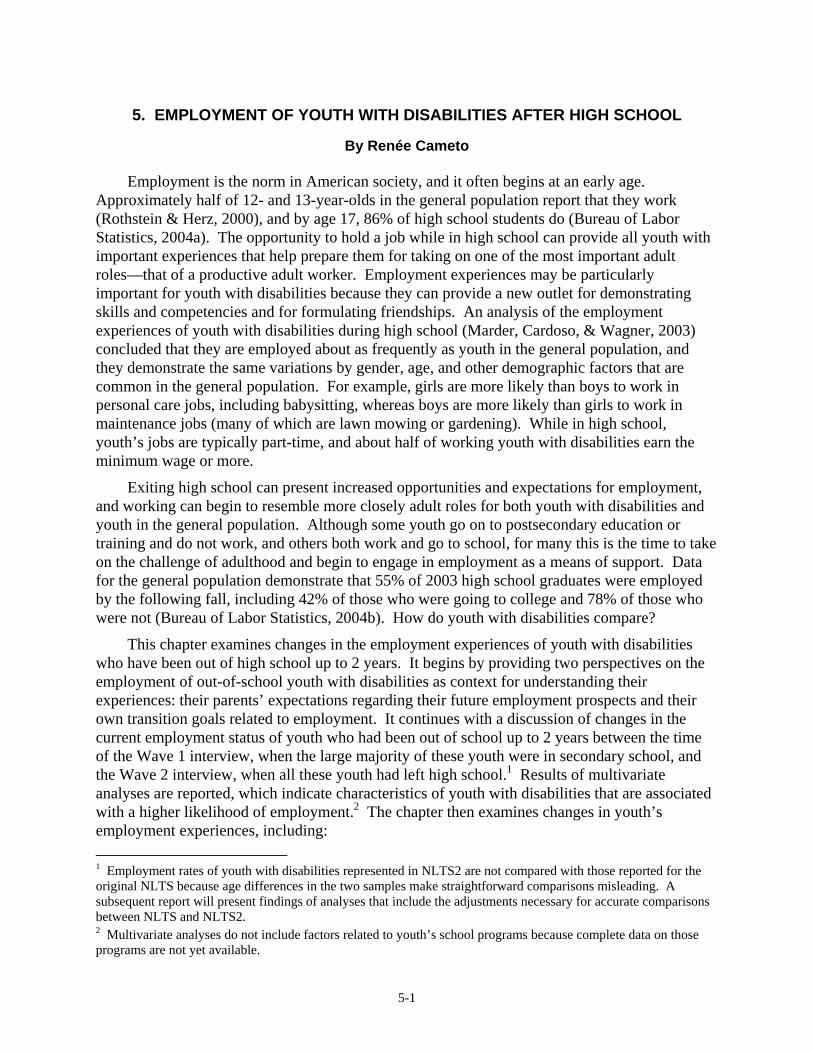
At Wave 1, it was quite rare that parents did not expect their son or daughter to work for pay in the future; only 2% had parents who thought that their son or daughter “probably” or “definitely” would not get a paid job. In contrast, 90% of youth had parents who thought they “definitely” would get a paid job, and 8% had parents who thought they “probably” would. However, parents’ expectations differed with the disability category of youth (Exhibit 5-1). Parents were less positive about the employment prospects of their sons or daughters with mental retardation, orthopedic impairments, autism, or multiple disabilities than those of youth with other kinds of disabilities. Compared with youth with learning disabilities, for example, a
3 Employment did not require earning enough for the youth to support themselves, and it could include supported or sheltered employment.
5-3
Exhibit 5-1 PARENTS’ EXPECTATIONS FOR YOUTH’S FUTURE PAID EMPLOYMENT,
BY DISABILITY CATEGORY
Learning Disability
Speech/ Language
Impair-ment
Mental Retar-dation
Emo-tional
Distur-bance
Hearing Impair-ment
Visual Impair-ment
Ortho-pedic
Impair-ment
Other Health Impair-ment Autism
Trau-matic Brain Injury
Multiple Disabili-
ties
Percentage whose parents have the following expec-tations for youth’s having future paid employment:
Definitely will 93.1 91.2 76.0 87.0 93.5 86.5 75.8 92.7 75.2 84.3 65.8 (2.8) (4.5) (6.8) (3.7) (3.5) (6.5) (7.1) (2.9) (8.4) (7.6) (9.3) Probably will 6.9 6.0 15.5 8.3 6.5 9.5 22.2 5.9 17.5 13.5 19.1 (2.8) (3.7) (5.8) (3.0) (3.5) (5.6) (6.9) (2.6) (7.4) (7.1) (7.7) Definitely/probably won’t
.0
2.8 (2.6)
8.6(4.5)
4.7(2.3)
.0
4.0(3.8)
2.0(2.3)
1.4(1.3)
7.3 (5.0)
2.2(3.1)
15.2(7.0)
Source: NLTS2 Wave 1 parent interviews. Standard errors are in parentheses.
significantly smaller percentage of these youth had parents who expected them “definitely” to get a job (93% vs. 66% to 76%, p<.05 or p<.01). Youth with multiple disabilities were the most likely to have parents think they “probably” or “definitely” would not get paid employment (15%, p<.05 compared with youth with learning disabilities).
Youth’s Post-High-School Employment Goals Youth, too, have aspirations regarding their future employment. As part of the process of
developing an individualized education program (IEP) for special education services during high school, youth, in conjunction with their parents, teachers, and others, identified their postschool goals. School staff most knowledgeable about students’ school programs described these goals. Employment following high school is the postschool goal most commonly identified by secondary school students with disabilities (Cameto et al., 2004). Overall 70% identified some type of employment as a goal for the years after secondary school, including competitive (62%), supported (6%), or sheltered (3%) employment. Those who did not identify work as a postschool goal include a small percentage of youth with disabilities who did not expect to be able to work for pay but who may participate in other types of programs, and a larger percentage of youth who expected to postpone employment while pursuing postsecondary education or training.
There is wide variation among youth in different disability categories in the likelihood of having an employment goal and in the types of employment they hoped to have in their early adult years. The majority of youth with learning disabilities, mental retardation, emotional disturbances, other health impairments, or autism had an employment goal, ranging from 55% of youth with other health impairments to 94% of those with mental retardation. Exceptions are youth with hearing, visual, or orthopedic impairments, whose goals focused more on postsecondary education, as noted in Chapter 4. The percentage of youth with a transition goal of competitive employment ranges from 69% of youth with learning disabilities and 53% of
5-4
those with emotional disturbances to 20% of youth with autism (p<.05, Exhibit 5-2). Supported employment often was the employment goal for youth with mental retardation (38%) or autism (25%), but it was not a goal for any youth with visual impairments. Fewer than about 5% of youth in any disability category had a goal of sheltered employment, with the exception of 14% of youth with mental retardation or autism and 5% to 6% of youth with orthopedic or other health impairments, respectively.
Exhibit 5-2 EMPLOYMENT-RELATED TRANSITION GOALS OF YOUTH, BY DISABILITY CATEGORY
Learning Disability
Mental Retar-dation
Emo-tional
Distur-bance
Hearing Impair-ment
Visual Impair-ment
Ortho-pedic
Impair-ment
Other Health Impair-ment Autism
Percentage with goal of: Competitive employment 68.7 41.0 52.9 34.2 28.9 25.6 43.2 20.2
(7.7) (11.1) (11.4) (9.5) (11.4) (11.3) (8.1) (10.4) Supported employment 1.0 38.0 11.1 3.3 .0 11.9 6.0 25.1 (1.7) (11.0) (7.2) (3.6) (8.4) (3.9) (11.2) Sheltered employment 1.0 14.5 .0 2.9 3.1 5.0 5.9 15.6 (1.7) (8.0) (3.4) (4.3) (5.7) (3.8) (9.4)
Source: NLTS2 Wave 1 parent interviews. Note: There are too few out-of-school youth with speech impairments, traumatic brain injuries, or multiple disabilities who have data on transition goals to report those categories separately. Standard errors are in parentheses.
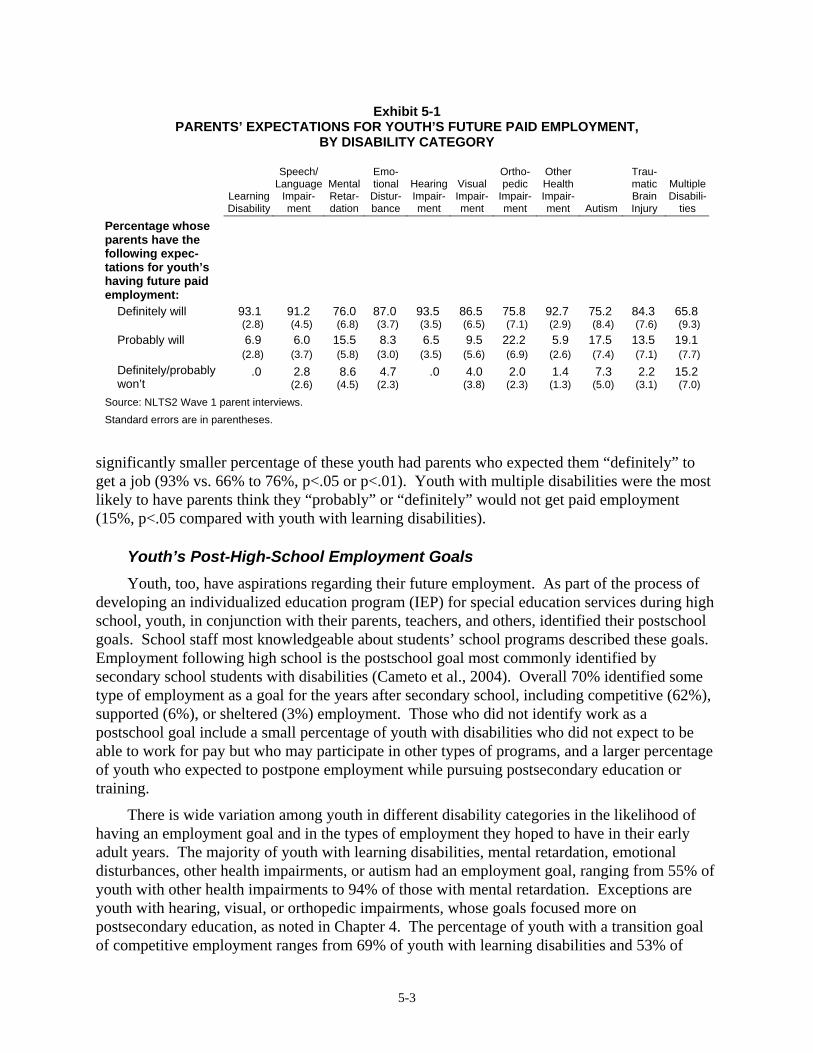
Changes in Youth Employment Interviews at both Waves 1 and 2
ascertained youth’s current employment status (i.e., having “a paid job now, other than work around the house”). At Wave 1, while most of these youth were still in school, about one-third of currently out-of-school youth with disabilities (32%) were employed (Exhibit 5-3). At Wave 2, 43% of these same youth are currently working for pay outside the home, reflecting about a 10-percentage-point increase in employment as out-of-school youth age. Although that improvement in employment status is not significant for youth with disabilities as a whole, when examined by school-exit status,4 significant
4 Overall, 72% of out-of-school youth with disabilities completed high school by graduating or receiving a certificate of completion (see Chapter 2); 28% left school without finishing.
Exhibit 5-3 CHANGES IN CURRENT EMPLOYMENT OF
OUT-OF-SCHOOL YOUTH WITH DISABILITIES
Sources: NLTS2 Wave 1 parent interviews and Wave 2 parent/youth interviews. Statistically significant difference in a two-tailed test at the following level: **p<.01. Standard errors are in parentheses.
5-5
differences are found. Youth who dropped out of school have experienced a 24-percentage-point increase in current employment (p<.01, Exhibit 5-3), which eliminates the large disparity in employment rates that existed in Wave 1 between youth who eventually completed high school and those who did not. Nonetheless, neither high school completers nor dropouts work at nearly the same rate as youth of similar ages in the general population (63%, p<.001).5
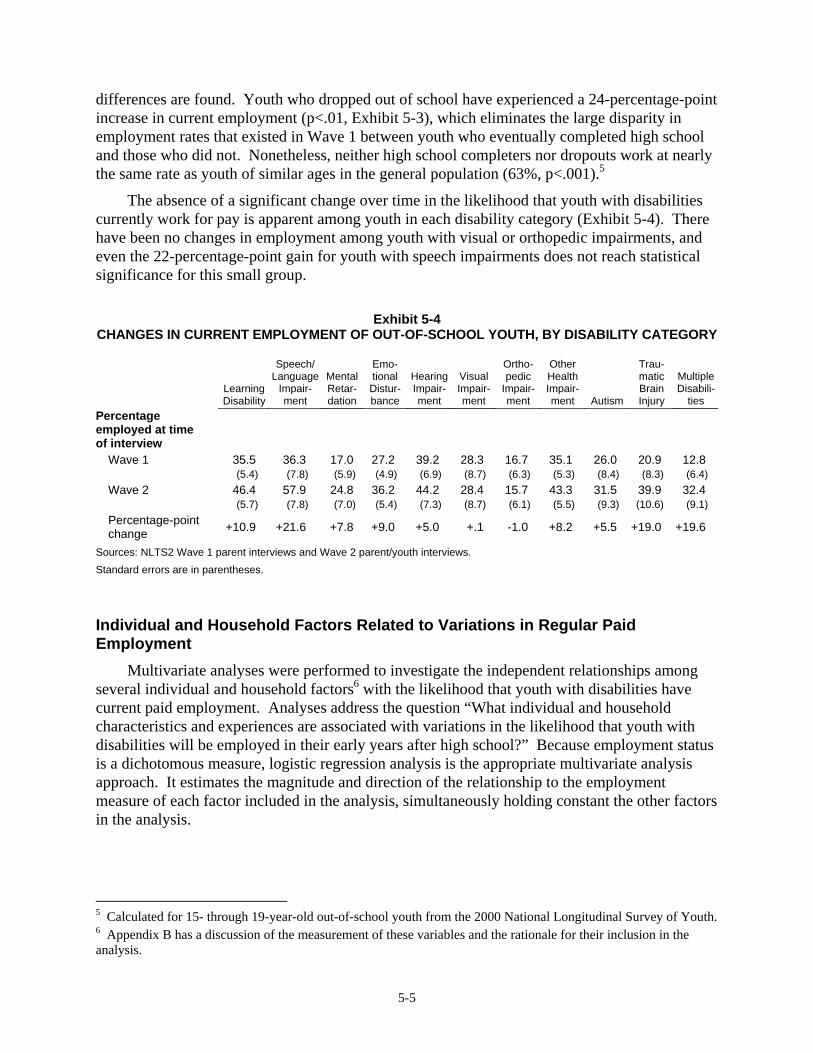
The absence of a significant change over time in the likelihood that youth with disabilities currently work for pay is apparent among youth in each disability category (Exhibit 5-4). There have been no changes in employment among youth with visual or orthopedic impairments, and even the 22-percentage-point gain for youth with speech impairments does not reach statistical significance for this small group.
Exhibit 5-4 CHANGES IN CURRENT EMPLOYMENT OF OUT-OF-SCHOOL YOUTH, BY DISABILITY CATEGORY
Learning Disability
Speech/ Language
Impair-ment
Mental Retar-dation
Emo-tional
Distur-bance
Hearing Impair-ment
Visual Impair-ment
Ortho-pedic
Impair-ment
Other Health Impair-ment Autism
Trau-matic Brain Injury
Multiple Disabili-
ties Percentage employed at time of interview
Wave 1 35.5 36.3 17.0 27.2 39.2 28.3 16.7 35.1 26.0 20.9 12.8 (5.4) (7.8) (5.9) (4.9) (6.9) (8.7) (6.3) (5.3) (8.4) (8.3) (6.4) Wave 2 46.4 57.9 24.8 36.2 44.2 28.4 15.7 43.3 31.5 39.9 32.4 (5.7) (7.8) (7.0) (5.4) (7.3) (8.7) (6.1) (5.5) (9.3) (10.6) (9.1) Percentage-point change +10.9 +21.6 +7.8 +9.0 +5.0 +.1 -1.0 +8.2 +5.5 +19.0 +19.6
Sources: NLTS2 Wave 1 parent interviews and Wave 2 parent/youth interviews. Standard errors are in parentheses.
Individual and Household Factors Related to Variations in Regular Paid Employment
Multivariate analyses were performed to investigate the independent relationships among several individual and household factors6 with the likelihood that youth with disabilities have current paid employment. Analyses address the question “What individual and household characteristics and experiences are associated with variations in the likelihood that youth with disabilities will be employed in their early years after high school?” Because employment status is a dichotomous measure, logistic regression analysis is the appropriate multivariate analysis approach. It estimates the magnitude and direction of the relationship to the employment measure of each factor included in the analysis, simultaneously holding constant the other factors in the analysis.
5 Calculated for 15- through 19-year-old out-of-school youth from the 2000 National Longitudinal Survey of Youth. 6 Appendix B has a discussion of the measurement of these variables and the rationale for their inclusion in the analysis.
5-6
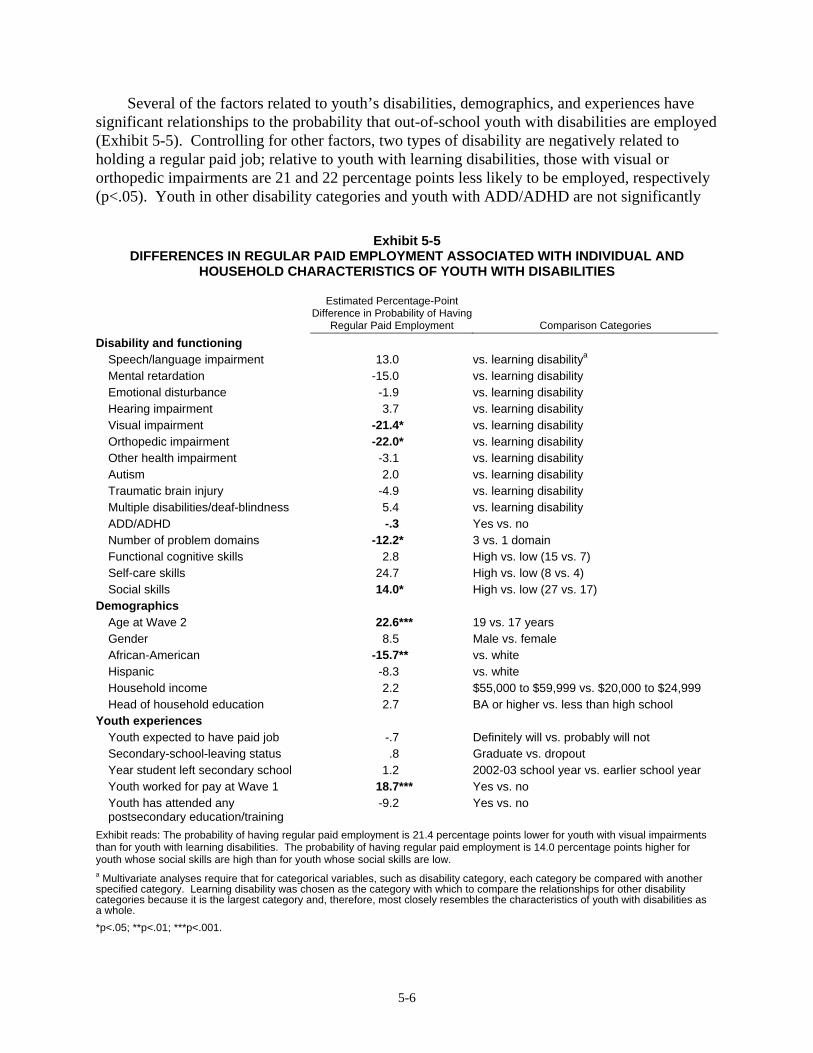
Several of the factors related to youth’s disabilities, demographics, and experiences have significant relationships to the probability that out-of-school youth with disabilities are employed (Exhibit 5-5). Controlling for other factors, two types of disability are negatively related to holding a regular paid job; relative to youth with learning disabilities, those with visual or orthopedic impairments are 21 and 22 percentage points less likely to be employed, respectively (p<.05). Youth in other disability categories and youth with ADD/ADHD are not significantly
Exhibit 5-5 DIFFERENCES IN REGULAR PAID EMPLOYMENT ASSOCIATED WITH INDIVIDUAL AND
HOUSEHOLD CHARACTERISTICS OF YOUTH WITH DISABILITIES
Estimated Percentage-Point
Difference in Probability of Having Regular Paid Employment Comparison Categories
Disability and functioning Speech/language impairment 13.0 vs. learning disabilitya Mental retardation -15.0 vs. learning disability Emotional disturbance -1.9 vs. learning disability Hearing impairment 3.7 vs. learning disability Visual impairment -21.4* vs. learning disability Orthopedic impairment -22.0* vs. learning disability Other health impairment -3.1 vs. learning disability Autism 2.0 vs. learning disability Traumatic brain injury -4.9 vs. learning disability Multiple disabilities/deaf-blindness 5.4 vs. learning disability ADD/ADHD -.3 Yes vs. no Number of problem domains -12.2* 3 vs. 1 domain Functional cognitive skills 2.8 High vs. low (15 vs. 7) Self-care skills 24.7 High vs. low (8 vs. 4) Social skills 14.0* High vs. low (27 vs. 17)
Demographics Age at Wave 2 22.6*** 19 vs. 17 years Gender 8.5 Male vs. female African-American -15.7** vs. white Hispanic -8.3 vs. white Household income 2.2 $55,000 to $59,999 vs. $20,000 to $24,999 Head of household education 2.7 BA or higher vs. less than high school
Youth experiences Youth expected to have paid job -.7 Definitely will vs. probably will not Secondary-school-leaving status .8 Graduate vs. dropout Year student left secondary school 1.2 2002-03 school year vs. earlier school year Youth worked for pay at Wave 1 18.7*** Yes vs. no Youth has attended any postsecondary education/training
-9.2 Yes vs. no
Exhibit reads: The probability of having regular paid employment is 21.4 percentage points lower for youth with visual impairments than for youth with learning disabilities. The probability of having regular paid employment is 14.0 percentage points higher for youth whose social skills are high than for youth whose social skills are low. a Multivariate analyses require that for categorical variables, such as disability category, each category be compared with another specified category. Learning disability was chosen as the category with which to compare the relationships for other disability categories because it is the largest category and, therefore, most closely resembles the characteristics of youth with disabilities as a whole. *p<.05; **p<.01; ***p<.001.
5-7
more or less likely to be employed than youth with learning disabilities. However, independent of the nature of their disability, youth whose disabilities affect a larger number of functional domains are less likely to be employed; for example, those with three domains affected are 12 percentage points less likely to be employed than those whose disability affects a single domain (p<.05). Having high social skills ratings, on the other hand, is associated with a 14-percentage-point higher likelihood of being employed, compared with youth with low social skills ratings (p<.05).
Two demographic factors are related to the frequency with which out-of-school youth with disabilities are employed, but in opposite directions. Age is among the strongest positive influences on the employment patterns of both youth in the general population (Herz & Kosanovich, 2000; Rothstein & Herz, 2000) and youth with disabilities. For example, 19-year-old youth with disabilities are 23 percentage points more likely to be employed than 17-year-olds (p<.001). Similarly, NLTS2 analyses of employment of secondary school youth with disabilities (Marder, Cardoso, et al., 2003) show that youth are more likely to be employed with each additional year of age. Race/ethnicity also has a strong independent relationship to the likelihood of employment for youth in the general population (National Longitudinal Survey of Youth, 1997) and those with disabilities. NLTS2 analyses show that African-American youth are 16 percentage points less likely to be employed than white youth (p<.01).
Only one measure of youth’s prior experience included here relates to their likelihood of employment. Independent of other factors, youth who had held a job at the time of the Wave 1 interview are 19 percentage points more likely to be employed at Wave 2 than youth without that previous employment experience (p<.001).
This multivariate analysis explains a statistically significant portion of the variation in youth employment (PI=.18).7 More than half the explanatory power of the model comes from the disability and functional characteristics of youth (10 percentage points). Demographic characteristics increase that power by another 4 percentage points. Youth’s experiences increase the explained variation of the model by an additional 4 percentage points.
Characteristics of Employment of Out-of-School Youth with Disabilities With this background regarding the rates at which out-of-school youth with disabilities hold
paid jobs and the characteristics of youth that are associated with a higher rate of employment, the focus now shifts to understanding the characteristics of the jobs held by out-of-school youth with disabilities, including the types of work they do; the number of hours they work; the wages, benefits, and accommodations they receive; and their job satisfaction.8
7 Because logistic regression analyses do not produce the typical measure of explained variation (r2), an alternative statistic was calculated for the employment analysis, which indicates the “predictive improvement,” or PI, that can be obtained by adding an independent variable to a logistic regression. Possible PI values range from 0 to 1 in a similar way to conventional r2 statistics. See Appendix A for a more complete description of PI. 8 There are too few out-of-school working youth in most disability categories to report their job characteristics separately.

5-8
Types of employment. Youth with disabilities have experienced relatively few changes in the types of jobs they typically hold in the 2 years between Waves 1 and 2 (Exhibit 5-6); changes have been significant in only two fields of employment. There has been a 16-percentage-point decrease in the percentage of youth with personal-care jobs (p<.001), including such jobs as babysitting, so that only 3% of youth with disabilities work in these types of jobs in Wave 2. Also, youth have experienced a 10-percentage-point increase in working in trades (p<.05) (e.g., carpentry, plumbing), with 20% currently employed in such jobs.
Hours worked. With potentially more time available to work when youth with disabilities no longer attend high school, the number of hours they work has increased from Wave 1 to Wave 2 (Exhibit 5-7). Full time employment (i.e., 35 hours or more per week) has increased 18 percentage points (p<.05), to 40% of working youth who have been out of high school up to 2 years. The average hours worked per week also has increased by 6 hours, to 29 hours per week (p<.05).
Exhibit 5-6 CHANGES IN TYPES OF JOBS HELD BY
OUT-OF-SCHOOL YOUTH WITH DISABILITIES
Sources: NLTS2 Wave 1 parent interviews and Wave 2 parent/youth interviews. a For youth’s current or most recent job. Statistically significant difference in a two-tailed test at the following levels: *p<.05; ***p<.001. Standard errors are in parentheses.
Exhibit 5-7 CHANGES IN HOURS WORKED BY
OUT-OF-SCHOOL YOUTH WITH DISABILITIES
Sources: NLTS2 Wave 1 parent interviews and Wave 2 parent/youth interviews. a For youth’s current or most recent job. Statistically significant difference in a two-tailed test at the following level: *p<.05. Standard errors are in parentheses.
5-9
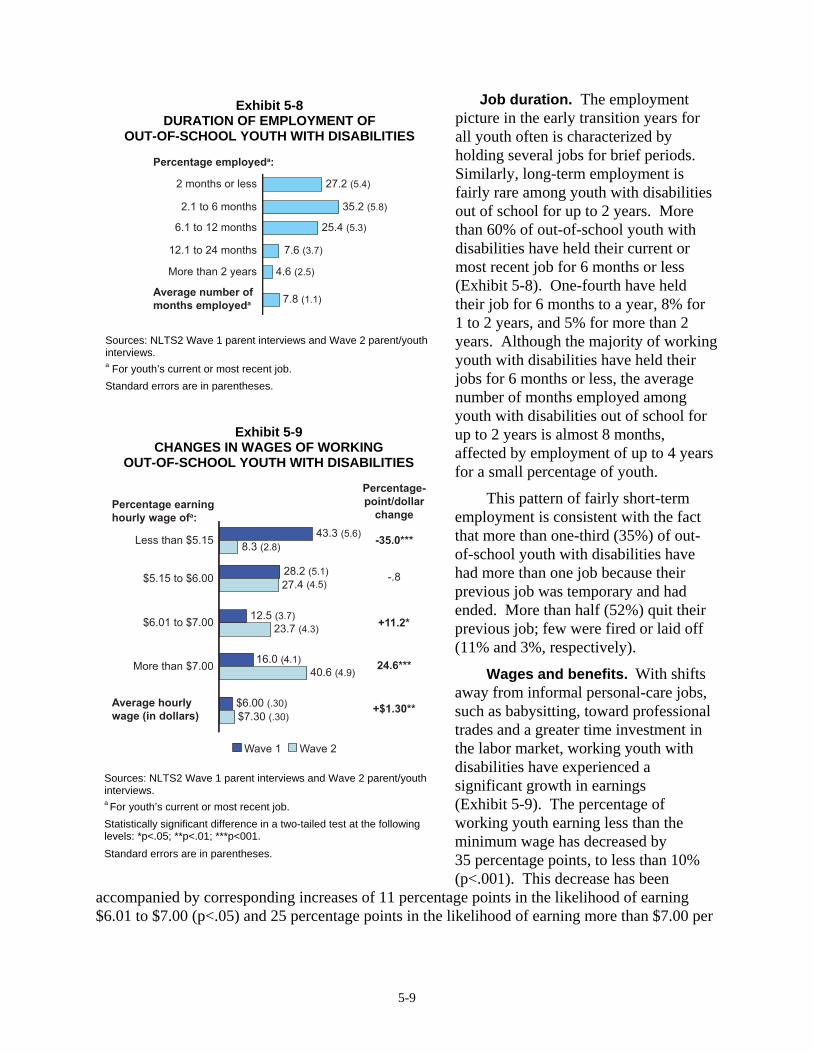
Job duration. The employment picture in the early transition years for all youth often is characterized by holding several jobs for brief periods. Similarly, long-term employment is fairly rare among youth with disabilities out of school for up to 2 years. More than 60% of out-of-school youth with disabilities have held their current or most recent job for 6 months or less (Exhibit 5-8). One-fourth have held their job for 6 months to a year, 8% for 1 to 2 years, and 5% for more than 2 years. Although the majority of working youth with disabilities have held their jobs for 6 months or less, the average number of months employed among youth with disabilities out of school for up to 2 years is almost 8 months, affected by employment of up to 4 years for a small percentage of youth.
This pattern of fairly short-term employment is consistent with the fact that more than one-third (35%) of out-of-school youth with disabilities have had more than one job because their previous job was temporary and had ended. More than half (52%) quit their previous job; few were fired or laid off (11% and 3%, respectively).
Wages and benefits. With shifts away from informal personal-care jobs, such as babysitting, toward professional trades and a greater time investment in the labor market, working youth with disabilities have experienced a significant growth in earnings (Exhibit 5-9). The percentage of working youth earning less than the minimum wage has decreased by 35 percentage points, to less than 10% (p<.001). This decrease has been
accompanied by corresponding increases of 11 percentage points in the likelihood of earning $6.01 to $7.00 (p<.05) and 25 percentage points in the likelihood of earning more than $7.00 per
Exhibit 5-9 CHANGES IN WAGES OF WORKING
OUT-OF-SCHOOL YOUTH WITH DISABILITIES
Sources: NLTS2 Wave 1 parent interviews and Wave 2 parent/youth interviews. a For youth’s current or most recent job. Statistically significant difference in a two-tailed test at the following levels: *p<.05; **p<.01; ***p<001. Standard errors are in parentheses.
Exhibit 5-8 DURATION OF EMPLOYMENT OF
OUT-OF-SCHOOL YOUTH WITH DISABILITIES
Sources: NLTS2 Wave 1 parent interviews and Wave 2 parent/youth interviews. a For youth’s current or most recent job. Standard errors are in parentheses.
5-10
hour (p<.001). The average hourly wage has increased by $1.30 in a 2-year period, to $7.30 (p<.01).
In Wave 2, 30% of employed youth receive paid vacation or sick leave, health insurance, or retirement benefits associated with their employment. Paid vacation or sick leave (28%) and health insurance (23%) are part of the jobs of employed youth more often than are retirement benefits (14%).
Accommodations. The Americans with Disabilities Act (ADA) requires employers to provide reasonable accommodations to employees with disabilities who are otherwise qualified for their jobs. However, not all disabilities are apparent to employers, nor do they all have implications for job performance. NLTS2 has investigated the extent to which employers of youth with disabilities are aware of those disabilities and provide accommodations for them.
The large majority (84%) of youth with disabilities who have been out of secondary school up to 2 years, including the two-thirds of out-of-school youth who do not consider themselves to have a disability at all, reportedly have employers who are not aware of their disabilities. As one might expect, however, employers’ awareness is much more common for youth with some kinds of disabilities than for others. Youth with hearing, visual, or orthopedic impairments are much more likely to have employers who are aware of their disability (51%, 64%, and 41%, respectively) than youth with learning disabilities (15% vs. 51% or 64%, p<.001, and vs. 41%, p<.05). Nevertheless, only 4% of youth overall reported or were reported to be receiving “any
accommodations or other help from [your/his/her] employer because [you/he/she] [have/has] any kind of learning problem, disability, or other special need.” The rates of receiving accommodations at work range from 2% to 10% for most categories of youth; only those with visual impairments are more likely than youth in other disability categories to receive accommodations on the job (22% vs. 2% of youth with emotional disturbances, p<.05).
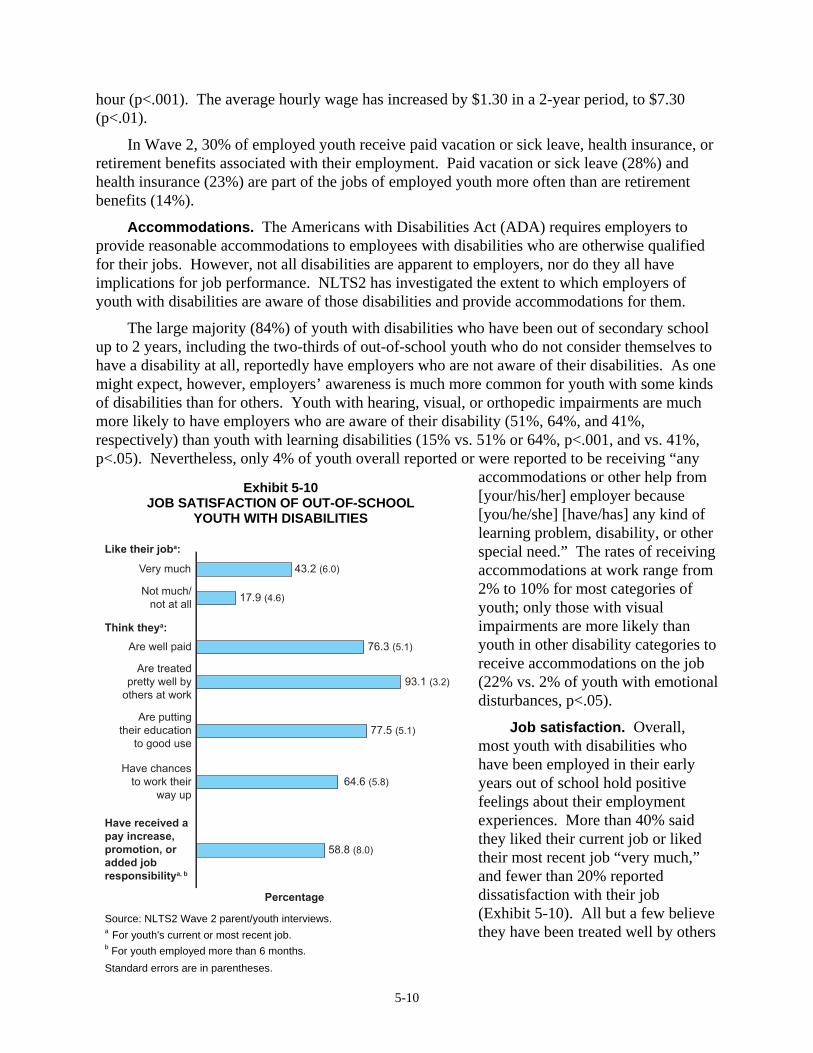
Job satisfaction. Overall, most youth with disabilities who have been employed in their early years out of school hold positive feelings about their employment experiences. More than 40% said they liked their current job or liked their most recent job “very much,” and fewer than 20% reported dissatisfaction with their job (Exhibit 5-10). All but a few believe they have been treated well by others
Exhibit 5-10 JOB SATISFACTION OF OUT-OF-SCHOOL
YOUTH WITH DISABILITIES
Source: NLTS2 Wave 2 parent/youth interviews. a For youth's current or most recent job. b For youth employed more than 6 months. Standard errors are in parentheses.
5-11
at work (93%). About three-fourths (78%) believe their job has put their education to good use, and a similar proportion (76%) reported they have been well paid. Sixty-five percent of youth who have been employed feel that they have had chances to work their way up to a better position. Among those who have held a job for more than 6 months, 59% have been promoted, taken on greater responsibility, or received a pay increase.
School-Leaving Status Differences in Changes in Employment Characteristics Although the multivariate analysis reported earlier in this chapter showed no significant
difference in the rate of current paid employment between high school completers and dropouts, independent of other group differences explored here, it is possible that secondary-school-leaving status could have an impact on the characteristics of the jobs out-of-school youth with disabilities obtain. NLTS2 investigated whether changes in the job characteristics of these youth between Waves 1 and 2 differ for school completers and dropouts and found no differences in the duration of employment, the way youth left their previous job, benefits or accommodations received, or job satisfaction. The changes that do differ for the two groups are outlined below.
Types of employment. The change in the likelihood that youth with disabilities have a personal-care job differs between high school completers and dropouts. Completers are 16 percentage points less likely to hold personal-care jobs at Wave 2 than at Wave 1 (p<.01). Although there has been a similar decrease in dropouts holding personal-care jobs (15 percentage
points), the difference is not statistically significant for the smaller group of dropouts.
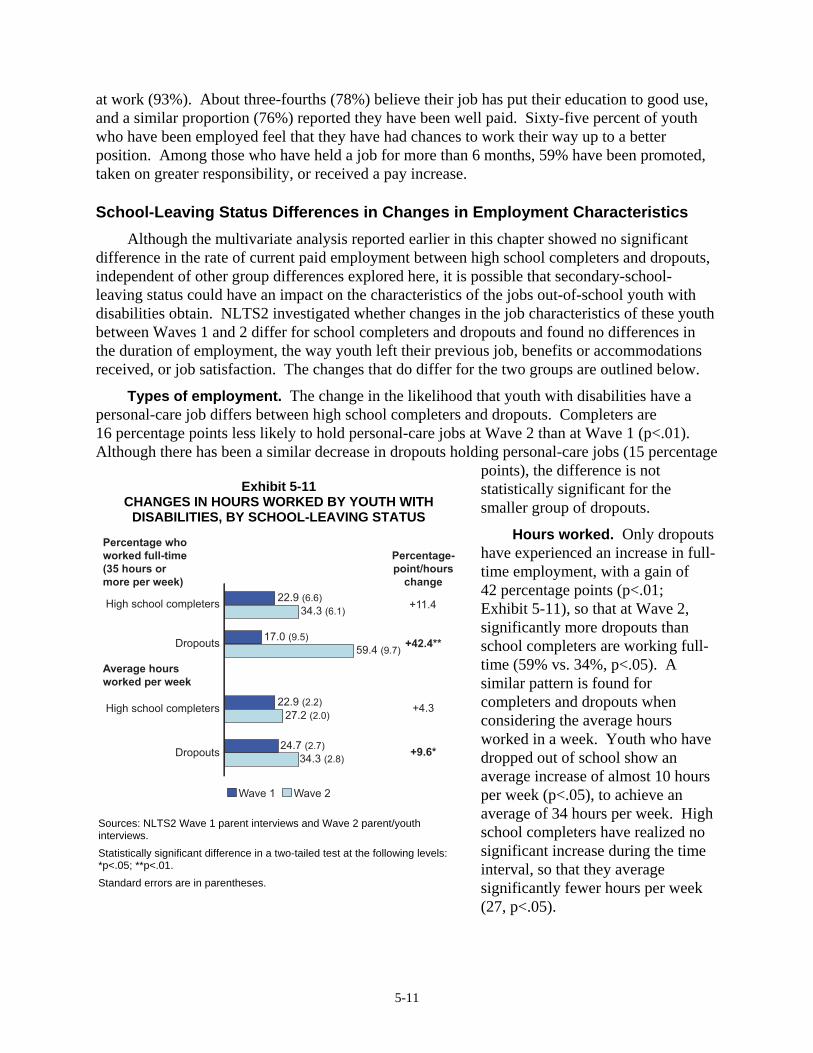
Hours worked. Only dropouts have experienced an increase in full-time employment, with a gain of 42 percentage points (p<.01; Exhibit 5-11), so that at Wave 2, significantly more dropouts than school completers are working full-time (59% vs. 34%, p<.05). A similar pattern is found for completers and dropouts when considering the average hours worked in a week. Youth who have dropped out of school show an average increase of almost 10 hours per week (p<.05), to achieve an average of 34 hours per week. High school completers have realized no significant increase during the time interval, so that they average significantly fewer hours per week (27, p<.05).
Exhibit 5-11 CHANGES IN HOURS WORKED BY YOUTH WITH
DISABILITIES, BY SCHOOL-LEAVING STATUS
Sources: NLTS2 Wave 1 parent interviews and Wave 2 parent/youth interviews. Statistically significant difference in a two-tailed test at the following levels: *p<.05; **p<.01. Standard errors are in parentheses.
5-12
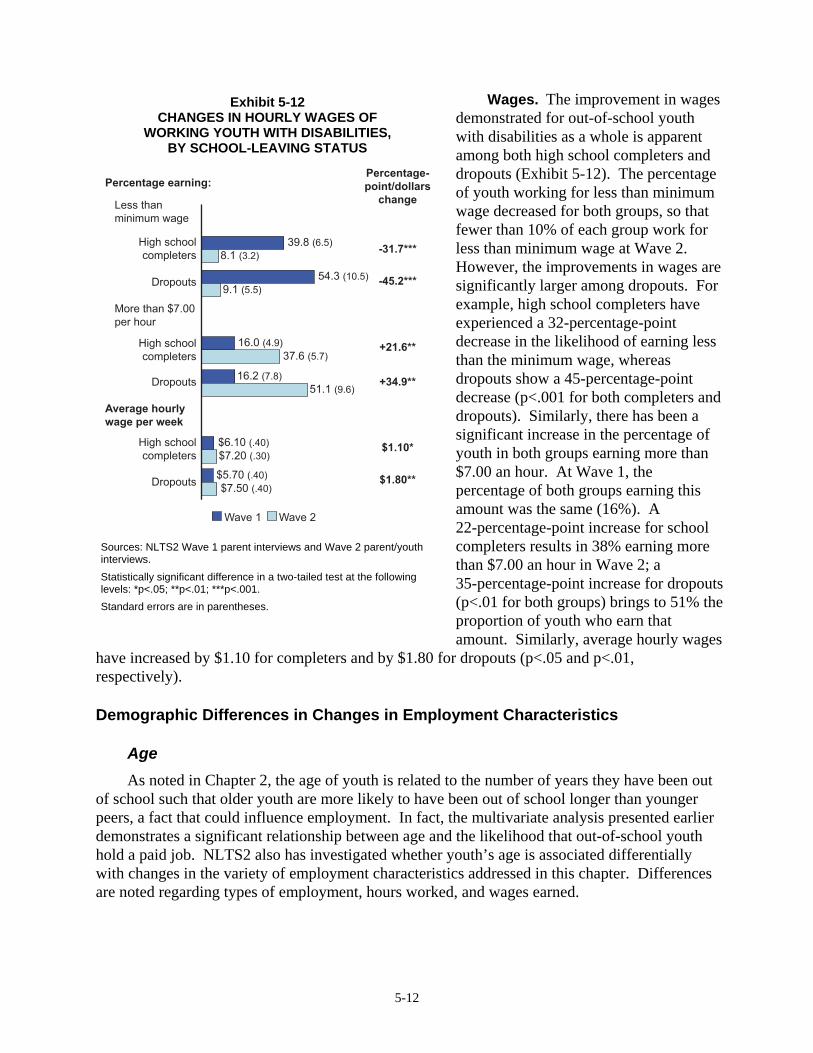
Wages. The improvement in wages demonstrated for out-of-school youth with disabilities as a whole is apparent among both high school completers and dropouts (Exhibit 5-12). The percentage of youth working for less than minimum wage decreased for both groups, so that fewer than 10% of each group work for less than minimum wage at Wave 2. However, the improvements in wages are significantly larger among dropouts. For example, high school completers have experienced a 32-percentage-point decrease in the likelihood of earning less than the minimum wage, whereas dropouts show a 45-percentage-point decrease (p<.001 for both completers and dropouts). Similarly, there has been a significant increase in the percentage of youth in both groups earning more than $7.00 an hour. At Wave 1, the percentage of both groups earning this amount was the same (16%). A 22-percentage-point increase for school completers results in 38% earning more than $7.00 an hour in Wave 2; a 35-percentage-point increase for dropouts (p<.01 for both groups) brings to 51% the proportion of youth who earn that amount. Similarly, average hourly wages
have increased by $1.10 for completers and by $1.80 for dropouts (p<.05 and p<.01, respectively).
Demographic Differences in Changes in Employment Characteristics
Age As noted in Chapter 2, the age of youth is related to the number of years they have been out
of school such that older youth are more likely to have been out of school longer than younger peers, a fact that could influence employment. In fact, the multivariate analysis presented earlier demonstrates a significant relationship between age and the likelihood that out-of-school youth hold a paid job. NLTS2 also has investigated whether youth’s age is associated differentially with changes in the variety of employment characteristics addressed in this chapter. Differences are noted regarding types of employment, hours worked, and wages earned.
Exhibit 5-12 CHANGES IN HOURLY WAGES OF
WORKING YOUTH WITH DISABILITIES, BY SCHOOL-LEAVING STATUS
Sources: NLTS2 Wave 1 parent interviews and Wave 2 parent/youth interviews. Statistically significant difference in a two-tailed test at the following levels: *p<.05; **p<.01; ***p<.001. Standard errors are in parentheses.
5-13
Types of employment. Both 18- and 19-year-olds are less likely to work in personal-care jobs at Wave 2 than they were at Wave 1, reducing the percentage employed in these types of jobs to 2% and 3%, respectively (16- and 14-percentage-point decreases, p<.01 and p<.05, respectively); younger peers have not experienced a similar decline. The only other notable change is an 18-percentage-point increase in retail employment among 19-year-olds (p<.05), bringing the proportion employed in this type of job to 28%.
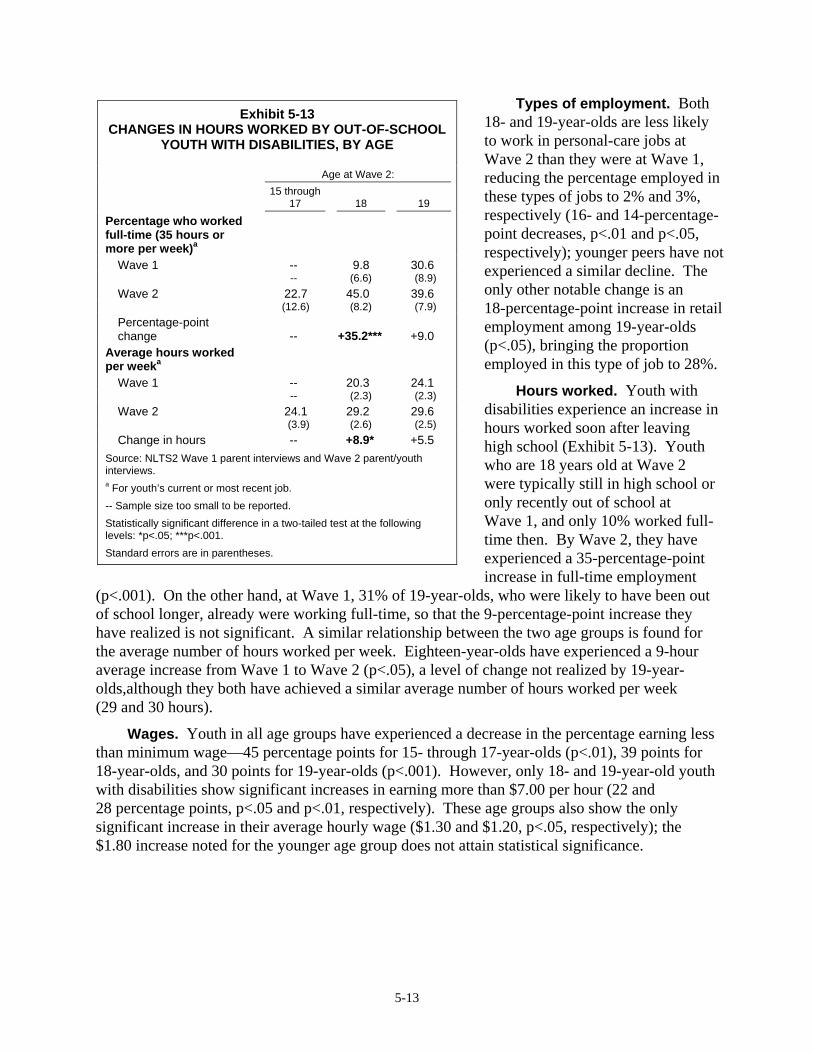
Hours worked. Youth with disabilities experience an increase in hours worked soon after leaving high school (Exhibit 5-13). Youth who are 18 years old at Wave 2 were typically still in high school or only recently out of school at Wave 1, and only 10% worked full-time then. By Wave 2, they have experienced a 35-percentage-point increase in full-time employment
(p<.001). On the other hand, at Wave 1, 31% of 19-year-olds, who were likely to have been out of school longer, already were working full-time, so that the 9-percentage-point increase they have realized is not significant. A similar relationship between the two age groups is found for the average number of hours worked per week. Eighteen-year-olds have experienced a 9-hour average increase from Wave 1 to Wave 2 (p<.05), a level of change not realized by 19-year-olds,although they both have achieved a similar average number of hours worked per week (29 and 30 hours).
Wages. Youth in all age groups have experienced a decrease in the percentage earning less than minimum wage—45 percentage points for 15- through 17-year-olds (p<.01), 39 points for 18-year-olds, and 30 points for 19-year-olds (p<.001). However, only 18- and 19-year-old youth with disabilities show significant increases in earning more than $7.00 per hour (22 and 28 percentage points, p<.05 and p<.01, respectively). These age groups also show the only significant increase in their average hourly wage ($1.30 and $1.20, p<.05, respectively); the $1.80 increase noted for the younger age group does not attain statistical significance.
Exhibit 5-13 CHANGES IN HOURS WORKED BY OUT-OF-SCHOOL
YOUTH WITH DISABILITIES, BY AGE
Age at Wave 2:
15 through
17 18 19
Percentage who worked full-time (35 hours or more per week)a
Wave 1 -- 9.8 30.6 -- (6.6) (8.9) Wave 2 22.7 45.0 39.6 (12.6) (8.2) (7.9) Percentage-point change -- +35.2*** +9.0
Average hours worked per weeka
Wave 1 -- 20.3 24.1 -- (2.3) (2.3) Wave 2 24.1 29.2 29.6 (3.9) (2.6) (2.5) Change in hours -- +8.9* +5.5
Source: NLTS2 Wave 1 parent interviews and Wave 2 parent/youth interviews. a For youth’s current or most recent job. -- Sample size too small to be reported. Statistically significant difference in a two-tailed test at the following levels: *p<.05; ***p<.001. Standard errors are in parentheses.

5-14
Gender In the general population, boys and girls have similar employment rates, but gender is related
to a variety of differences in employment characteristics, such as type of job and wages (Rothstein, 2001; Herz & Kosanovich, 2000). However, the multivariate analysis reported earlier in this chapter does not show a similar significant relationship with the likelihood of employment among out-of-school youth with disabilities. Yet, the gender of out-of-school youth with disabilities is associated with differences with the following job characteristics.
Types of employment. Boys and girls with disabilities have experienced changes between Waves 1 and 2 in the types of jobs held (Exhibit 5-14). Specifically, the large decrease in youth with disabilities working in personal care jobs, such as babysitting, has occurred entirely among girls (42 percentage points, p<.001). Although most jobs held by girls at Wave 1 were in personal care, with this decline, the previously large difference between boys and girls holding these types of jobs no longer exists at Wave 2, suggesting that the range of employment options for girls may have expanded. A 20-percentage-point increase in “other” types of jobs, which include a variety of service-sector jobs, such as working in animal care or a movie theater, also has been realized by girls (p<.05). In contrast, the increase in out-of-school youth with disabilities working in trades has occurred entirely among boys; they have experienced a 14-percentage-point increase in such jobs, perhaps signaling their entrance into skill-based employment (p<.05).
Exhibit 5-14 CHANGES IN TYPES OF JOBS HELD BY
OUT-OF-SCHOOL YOUTH WITH DISABILITIES, BY GENDER
Sources: NLTS2 Wave 1 parent interviews and Wave 2 parent/youth interviews. Statistically significant difference in a two-tailed test at the following levels: *p<.05; ***p<.001. Standard errors are in parentheses.
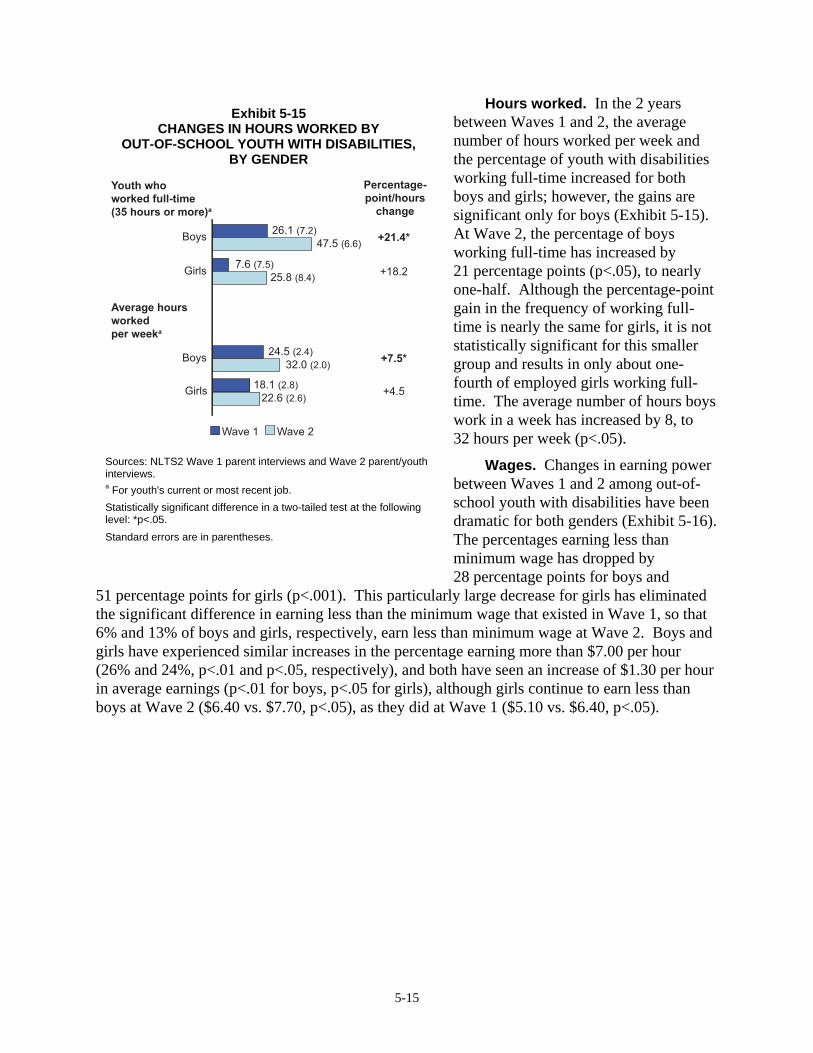
5-15
Hours worked. In the 2 years between Waves 1 and 2, the average number of hours worked per week and the percentage of youth with disabilities working full-time increased for both boys and girls; however, the gains are significant only for boys (Exhibit 5-15). At Wave 2, the percentage of boys working full-time has increased by 21 percentage points (p<.05), to nearly one-half. Although the percentage-point gain in the frequency of working full-time is nearly the same for girls, it is not statistically significant for this smaller group and results in only about one-fourth of employed girls working full-time. The average number of hours boys work in a week has increased by 8, to 32 hours per week (p<.05).
Wages. Changes in earning power between Waves 1 and 2 among out-of-school youth with disabilities have been dramatic for both genders (Exhibit 5-16). The percentages earning less than minimum wage has dropped by 28 percentage points for boys and
51 percentage points for girls (p<.001). This particularly large decrease for girls has eliminated the significant difference in earning less than the minimum wage that existed in Wave 1, so that 6% and 13% of boys and girls, respectively, earn less than minimum wage at Wave 2. Boys and girls have experienced similar increases in the percentage earning more than $7.00 per hour (26% and 24%, p<.01 and p<.05, respectively), and both have seen an increase of $1.30 per hour in average earnings (p<.01 for boys, p<.05 for girls), although girls continue to earn less than boys at Wave 2 ($6.40 vs. $7.70, p<.05), as they did at Wave 1 ($5.10 vs. $6.40, p<.05).
Exhibit 5-15 CHANGES IN HOURS WORKED BY
OUT-OF-SCHOOL YOUTH WITH DISABILITIES, BY GENDER
Sources: NLTS2 Wave 1 parent interviews and Wave 2 parent/youth interviews. a For youth's current or most recent job. Statistically significant difference in a two-tailed test at the following level: *p<.05. Standard errors are in parentheses.

5-16
Household Income and Race/Ethnicity
In the general population, youth from higher-income households tend to earn higher wages (Huang, Pergamit, & Shkolnik, 2001; Rothstein, 2001, Johnson & Lino, 2000). Higher wages also are associated with race/ethnicity in the general population (Gardecki, 2001; Huang et al., 2001; Rothstein, 2001), and multivariate analyses reported earlier in this chapter confirm that African-American youth with disabilities are less likely than white peers to be employed, independent of other differences between them, although no relationship was found between household income and the likelihood of employment. NLTS2 has investigated whether there are relationships between household income or race/ethnicity and the various job characteristics presented above for youth with disabilities.
Types of employment. The decrease from Wave 1 to Wave 2 in personal-care jobs held by youth with disabilities overall is seen only among
youth in the two higher income groups (20 and 23 percentage points, p<.05 and p<.01; Exhibit 5-17). Significant decreases from Wave 1 to Wave 2 in the percentage of youth with disabilities holding personal-care jobs also are found among white youth (14 percentage points, p<.01) and Hispanic youth (35 percentage points, p<.05). Increases in employment in the trades between Wave 1 and Wave 2 are not significant for any income group. However, white youth do show an increase in working in the trades (13 percentage points, p<.05).
Hours worked. The increase in the percentage of youth with disabilities working full-time ranges from 17 to 22 percentage points across household income groups but does not reach statistical significance for any group (Exhibit 5-18). Youth from medium-income households, however, have experienced a 10-hour increase in their weekly hours worked, so that their weekly average has reached 34 hours (p<.05). The increase in average weekly hours worked is significant only for white youth (8 hours, p<.01), among whom the likelihood of working full-time has increased 24 percentage points (p<.05), to reach 46% working full-time.
Exhibit 5-16 CHANGES IN WAGES OF OUT-OF-SCHOOL
WORKING YOUTH WITH DISABILITIES, BY GENDER
Sources: NLTS2 Wave 1 parent interviews and Wave 2 parent/youth interviews. Statistically significant difference in a two-tailed test at the following levels: *p<.05; **p<.01; ***p<.001. Standard errors are in parentheses.

5-17
Exhibit 5-17
CHANGES IN THE TYPES OF JOBS HELD BY OUT-OF-SCHOOL YOUTH WITH DISABILITIES, BY HOUSEHOLD INCOME AND RACE/ETHNICITY
Income Race/Ethnicity
Lowest Medium Highest White African-
American Hispanic
Percentage employed in: Personal care
Wave 1 8.6 21.4 25.9 16.4 19.1 38.8 (5.3) (8.4) (7.2) (4.3) (10.7) (15.6) Wave 2 5.4 1.1 2.8 2.7 1.9 4.0 (3.9) (2.1) (2.6) (1.9) (3.2) (5.8) Percentage-point change -3.2 -20.3* -23.1** -13.7** -17.2 -34.8*
Trades Wave 1 10.7 15.1 9.7 11.1 5.5 9.5 (5.8) (7.4) (4.9) (3.7) (6.2) (9.4) Wave 2 24.9 13.5 19.6 24.3 10.4 14.4 (7.5) (6.8) (6.3) (5.0) (7.2) (10.4) Percentage-point change +14.2 -1.6 +9.9 +13.2* +4.9 +4.9
Sources: NLTS2 Wave 1 parent interviews and Wave 2 parent/youth interviews. Statistically significant difference in a two-tailed test at the following levels: *p<.05; **p<.01. Standard errors are in parentheses.
Exhibit 5-18
CHANGES IN THE HOURS WORKED BY OUT-OF-SCHOOL YOUTH WITH DISABILITIES, BY HOUSEHOLD INCOME AND RACE/ETHNICITY
Income Race/Ethnicity
Lowest Medium Highest White African-
American Hispanic
Percentage who worked full-time (35 hours or more)a
Wave 1 16.0 22.7 23.7 22.5 19.5 -- (11.0) (12.1) (8.9) (6.7) (16.2) -- Wave 2 37.2 45.1 40.5 46.3 31.3 30.6 (9.1) (11.1) (8.9) (6.6) (11.6) (15.0) Percentage-point change +21.2 +22.4 +16.8 +23.8* +11.8 --
Average hours worked per weeka Wave 1 26.6 23.5 21.7 22.4 23.7 -- (6.3) (3.1) (2.6) (1.9) (3.3) -- Wave 2 27.2 33.7 27.6 30.5 28.0 24.1 (3.4) (3.4) (2.5) (1.9) (4.7) (4.9) Change in number of hours +.6 +10.2* +5.9 +8.1** +4.3 --
Sources: NLTS2 Wave 1 parent interviews and Wave 2 parent/youth interviews. a For youth’s current or most recent job. -- Sample size too small to be reported. Statistically significant difference in a two-tailed test at the following levels: *p<.05; **p<.01. Standard errors are in parentheses.
5-18
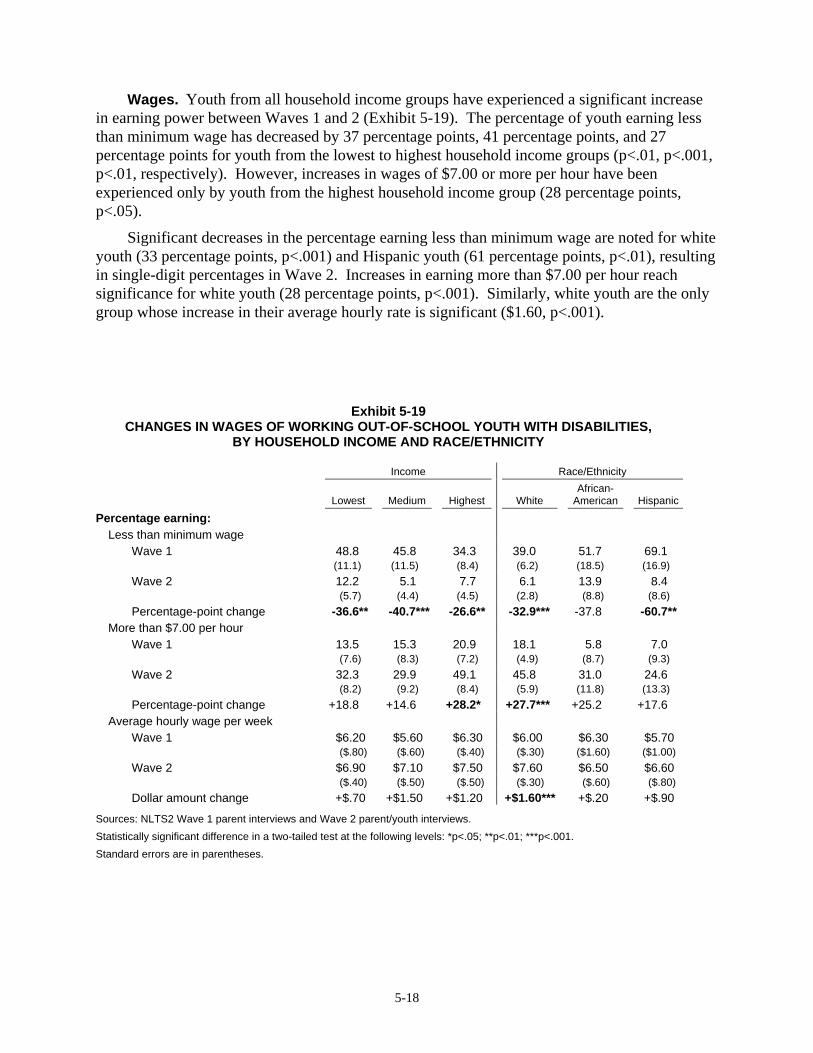
Wages. Youth from all household income groups have experienced a significant increase in earning power between Waves 1 and 2 (Exhibit 5-19). The percentage of youth earning less than minimum wage has decreased by 37 percentage points, 41 percentage points, and 27 percentage points for youth from the lowest to highest household income groups (p<.01, p<.001, p<.01, respectively). However, increases in wages of $7.00 or more per hour have been experienced only by youth from the highest household income group (28 percentage points, p<.05).
Significant decreases in the percentage earning less than minimum wage are noted for white youth (33 percentage points, p<.001) and Hispanic youth (61 percentage points, p<.01), resulting in single-digit percentages in Wave 2. Increases in earning more than $7.00 per hour reach significance for white youth (28 percentage points, p<.001). Similarly, white youth are the only group whose increase in their average hourly rate is significant ($1.60, p<.001).
Exhibit 5-19
CHANGES IN WAGES OF WORKING OUT-OF-SCHOOL YOUTH WITH DISABILITIES, BY HOUSEHOLD INCOME AND RACE/ETHNICITY
Income Race/Ethnicity
Lowest Medium Highest White African-
American Hispanic
Percentage earning: Less than minimum wage
Wave 1 48.8 45.8 34.3 39.0 51.7 69.1 (11.1) (11.5) (8.4) (6.2) (18.5) (16.9) Wave 2 12.2 5.1 7.7 6.1 13.9 8.4 (5.7) (4.4) (4.5) (2.8) (8.8) (8.6) Percentage-point change -36.6** -40.7*** -26.6** -32.9*** -37.8 -60.7**
More than $7.00 per hour Wave 1 13.5 15.3 20.9 18.1 5.8 7.0 (7.6) (8.3) (7.2) (4.9) (8.7) (9.3) Wave 2 32.3 29.9 49.1 45.8 31.0 24.6 (8.2) (9.2) (8.4) (5.9) (11.8) (13.3) Percentage-point change +18.8 +14.6 +28.2* +27.7*** +25.2 +17.6
Average hourly wage per week Wave 1 $6.20 $5.60 $6.30 $6.00 $6.30 $5.70 ($.80) ($.60) ($.40) ($.30) ($1.60) ($1.00) Wave 2 $6.90 $7.10 $7.50 $7.60 $6.50 $6.60 ($.40) ($.50) ($.50) ($.30) ($.60) ($.80) Dollar amount change +$.70 +$1.50 +$1.20 +$1.60*** +$.20 +$.90
Sources: NLTS2 Wave 1 parent interviews and Wave 2 parent/youth interviews. Statistically significant difference in a two-tailed test at the following levels: *p<.05; **p<.01; ***p<.001. Standard errors are in parentheses.
5-19
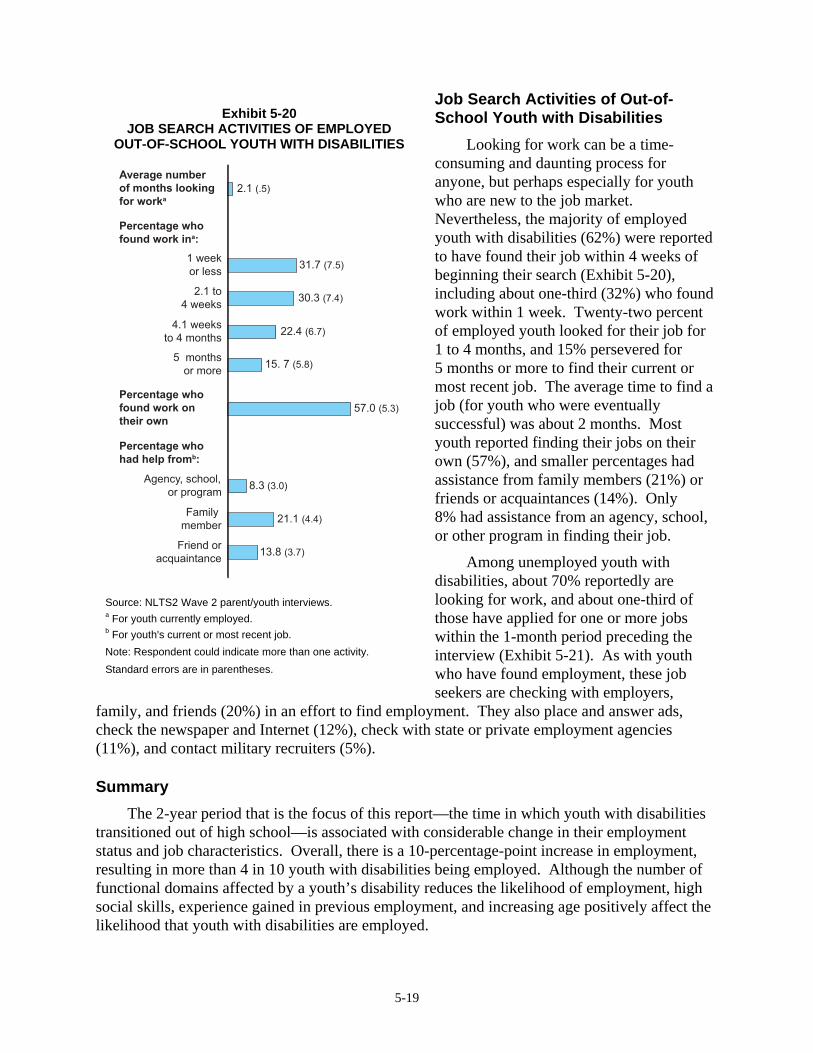
Job Search Activities of Out-of-School Youth with Disabilities
Looking for work can be a time-consuming and daunting process for anyone, but perhaps especially for youth who are new to the job market. Nevertheless, the majority of employed youth with disabilities (62%) were reported to have found their job within 4 weeks of beginning their search (Exhibit 5-20), including about one-third (32%) who found work within 1 week. Twenty-two percent of employed youth looked for their job for 1 to 4 months, and 15% persevered for 5 months or more to find their current or most recent job. The average time to find a job (for youth who were eventually successful) was about 2 months. Most youth reported finding their jobs on their own (57%), and smaller percentages had assistance from family members (21%) or friends or acquaintances (14%). Only 8% had assistance from an agency, school, or other program in finding their job.
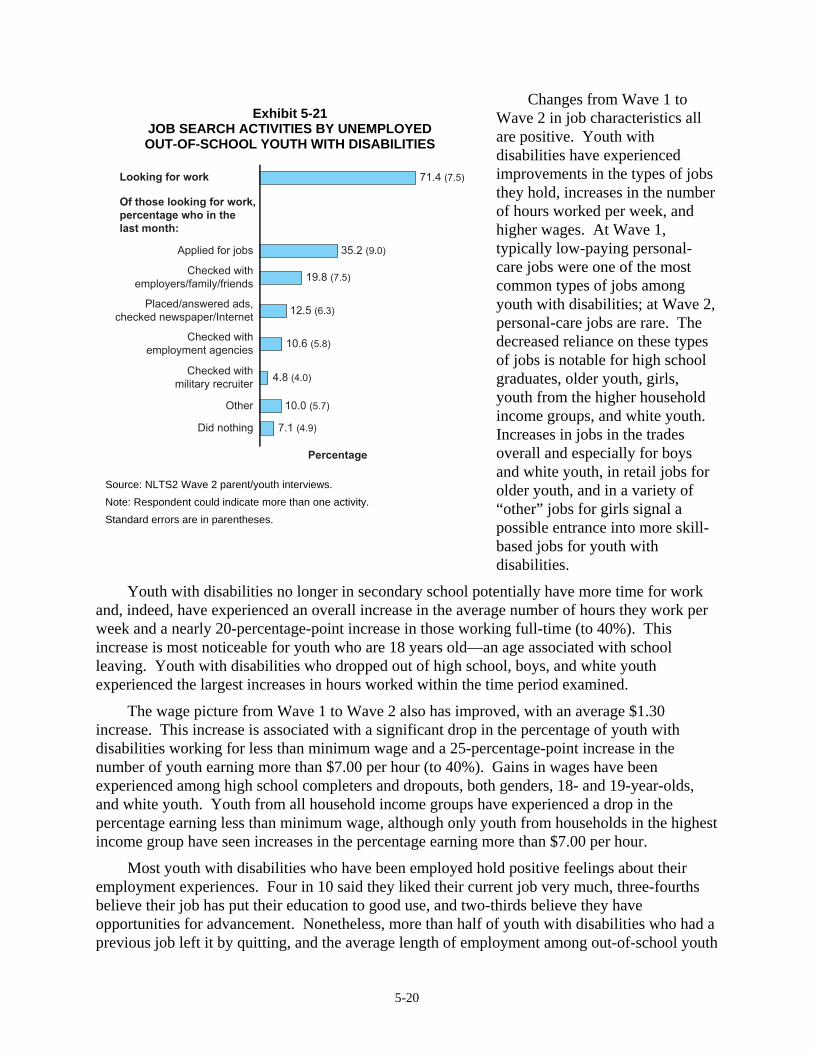
Among unemployed youth with disabilities, about 70% reportedly are looking for work, and about one-third of those have applied for one or more jobs within the 1-month period preceding the interview (Exhibit 5-21). As with youth who have found employment, these job seekers are checking with employers,
family, and friends (20%) in an effort to find employment. They also place and answer ads, check the newspaper and Internet (12%), check with state or private employment agencies (11%), and contact military recruiters (5%).
Summary The 2-year period that is the focus of this report—the time in which youth with disabilities
transitioned out of high school—is associated with considerable change in their employment status and job characteristics. Overall, there is a 10-percentage-point increase in employment, resulting in more than 4 in 10 youth with disabilities being employed. Although the number of functional domains affected by a youth’s disability reduces the likelihood of employment, high social skills, experience gained in previous employment, and increasing age positively affect the likelihood that youth with disabilities are employed.
Exhibit 5-20 JOB SEARCH ACTIVITIES OF EMPLOYED
OUT-OF-SCHOOL YOUTH WITH DISABILITIES
Source: NLTS2 Wave 2 parent/youth interviews. a For youth currently employed. b For youth's current or most recent job. Note: Respondent could indicate more than one activity. Standard errors are in parentheses.
5-20
Changes from Wave 1 to Wave 2 in job characteristics all are positive. Youth with disabilities have experienced improvements in the types of jobs they hold, increases in the number of hours worked per week, and higher wages. At Wave 1, typically low-paying personal-care jobs were one of the most common types of jobs among youth with disabilities; at Wave 2, personal-care jobs are rare. The decreased reliance on these types of jobs is notable for high school graduates, older youth, girls, youth from the higher household income groups, and white youth. Increases in jobs in the trades overall and especially for boys and white youth, in retail jobs for older youth, and in a variety of “other” jobs for girls signal a possible entrance into more skill-based jobs for youth with disabilities.
Youth with disabilities no longer in secondary school potentially have more time for work and, indeed, have experienced an overall increase in the average number of hours they work per week and a nearly 20-percentage-point increase in those working full-time (to 40%). This increase is most noticeable for youth who are 18 years old—an age associated with school leaving. Youth with disabilities who dropped out of high school, boys, and white youth experienced the largest increases in hours worked within the time period examined.
The wage picture from Wave 1 to Wave 2 also has improved, with an average $1.30 increase. This increase is associated with a significant drop in the percentage of youth with disabilities working for less than minimum wage and a 25-percentage-point increase in the number of youth earning more than $7.00 per hour (to 40%). Gains in wages have been experienced among high school completers and dropouts, both genders, 18- and 19-year-olds, and white youth. Youth from all household income groups have experienced a drop in the percentage earning less than minimum wage, although only youth from households in the highest income group have seen increases in the percentage earning more than $7.00 per hour.
Most youth with disabilities who have been employed hold positive feelings about their employment experiences. Four in 10 said they liked their current job very much, three-fourths believe their job has put their education to good use, and two-thirds believe they have opportunities for advancement. Nonetheless, more than half of youth with disabilities who had a previous job left it by quitting, and the average length of employment among out-of-school youth
Exhibit 5-21 JOB SEARCH ACTIVITIES BY UNEMPLOYED OUT-OF-SCHOOL YOUTH WITH DISABILITIES
Source: NLTS2 Wave 2 parent/youth interviews. Note: Respondent could indicate more than one activity. Standard errors are in parentheses.

5-21
is 6 months. However, among youth employed more than 6 months, about 60% reported being promoted, taking on more responsibility, or receiving a pay increase. The early experiences of these youth in the job market demonstrate that many are making positive gains toward assuming the very important adult role of productive worker.
Future reports on employment will be able to present employment characteristics by disability category as sample size of youth out of school grows. Subsequent reports also will be able to examine the impact of postsecondary education and training on employment characteristics.