trends in the postschool experiences of youth with disabilities findings from the national...
TRANSCRIPT
Trends in the Postschool Experiences ofYouth With Disabilities
Findings From the National Longitudinal Transition Study-2
(NLTS2)
Mary Wagner, Ph.D.SRI International
Secondary Transition State Planning Institute: Building for the Future
Charlotte, North Carolina
May 12-14, 2009

2
Stratified random sample
Nationally representative sample of 501 LEAs and 38 special schools, stratified by:• Geographic region
• Enrollment size
• District wealth
11,275 students by disability category
Focuses on Youth, ages 13 to 16 at start of study
Study began 2000–2001 school year
Generalizes to Each disability category and age cohort
Longitudinal9 years
5 waves of data collection (wave 5 underway)
NLTS2 has been funded with federal funds from the U.S. Department of Education, Institute of Education Sciences, National Center for Special Education Research, under contract number ED-01-CO-0003. The content of this presentation does not necessarily reflect the view or policies of the U.S. Department of Education, nor does mention of trade names, commercial products, or organizations imply endorsement by the U.S. government.
NLTS2 overview

3
Data sources
• Parent telephone interviews
• Youth telephone interviews/survey
• NLTS2 Waves 2, 3, and 4 (2003, 2005, 2007)– Wave 4 responses for youth who have been out
of high school up to 6 years
– Ages 19 through 23
4
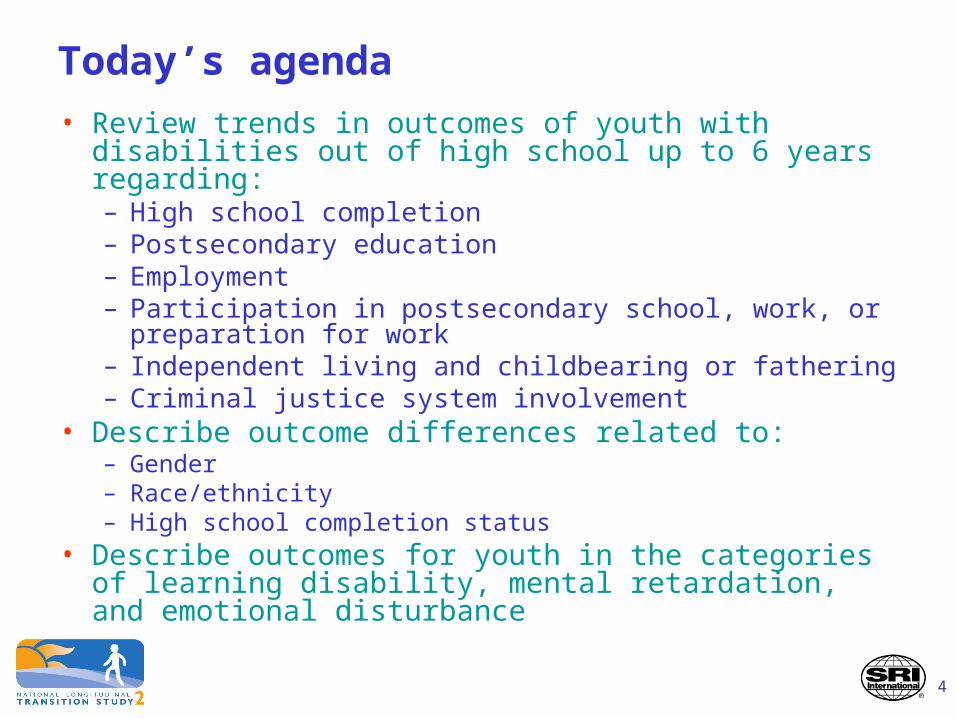
Today’s agenda
• Review trends in outcomes of youth with disabilities out of high school up to 6 years regarding:– High school completion– Postsecondary education– Employment– Participation in postsecondary school, work, or preparation
for work– Independent living and childbearing or fathering– Criminal justice system involvement
• Describe outcome differences related to:– Gender– Race/ethnicity– High school completion status
• Describe outcomes for youth in the categories of learning disability, mental retardation, and emotional disturbance

5
High School Completion

6
High school completion by youth with disabilities out of high school up to 6 years, by year
Percent
858072
0
20
40
60
80
100
2003 2005 2007
Out-of-high school youth who had finished high school
SOURCE: U.S. Department of Education, Institute of Education Sciences, National Center for Special Education Research, National Longitudinal Transition Study-2 (NLTS2), Waves 2, 3, and 4 parent interviews and youth interviews/surveys, 2003, 2005, 2007.

7
Participation in high school equivalency programs by youth with disabilities out of high school up to 6 years who left high school without finishing, by year
Percent
2937
43
33
87
0
20
40
60
80
100
2003 2005 2007
High school noncompleters who had ever enrolled in an equivalency programEnrollees in equivalency program who completed it
NOTE: Data on completion not available for 2003.SOURCE: U.S. Department of Education, Institute of Education Sciences, National Center for Special Education Research, National Longitudinal Transition Study-2 (NLTS2), Waves 2, 3, and 4 parent interviews and youth interviews/surveys, 2003, 2005, 2007.

8
Postsecondary Education, Work, and Preparation for Work
9
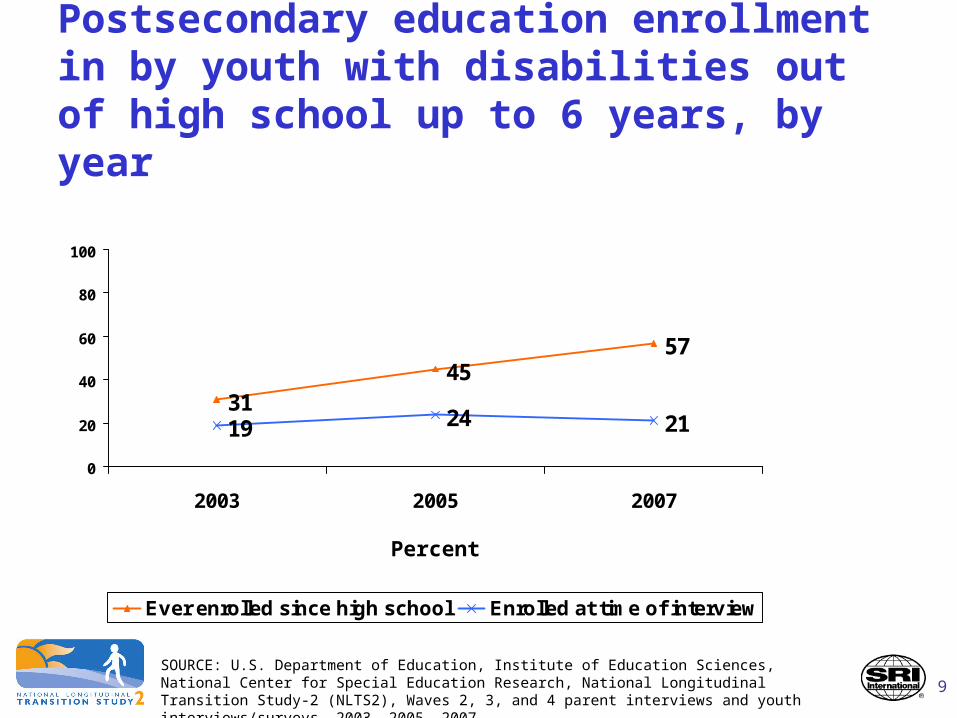
Postsecondary education enrollment in by youth with disabilities out of high school up to 6 years, by year
19 24 2131
4557
0
20
40
60
80
100
2003 2005 2007
Ever enrolled since high school Enrolled at time of interview
SOURCE: U.S. Department of Education, Institute of Education Sciences, National Center for Special Education Research, National Longitudinal Transition Study-2 (NLTS2), Waves 2, 3, and 4 parent interviews and youth interviews/surveys, 2003, 2005, 2007.
Percent

10
Enrollment in postsecondary education by youth with disabilities out of high school up to 6 years, by year and type of school
20
32
41
2823
6
149 16
0
10
20
30
40
50
2003 2005 2007
Vocational/technical/business school 2-year college
4-year college/university
SOURCE: U.S. Department of Education, Institute of Education Sciences, National Center for Special Education Research, National Longitudinal Transition Study-2 (NLTS2), Waves 2, 3, and 4 parent interviews and youth interviews/surveys, 2003, 2005, 2007.
Percentage ever enrolled since high school

11
Postsecondary program completion by youth with disabilities out of high school up to 6 years ever enrolled, by type of school
24
50
19
10
SOURCE: U.S. Department of Education, Institute of Education Sciences, National Center for Special Education Research, National Longitudinal Transition Study-2 (NLTS2) Wave 4 parent interviews and youth interviews/surveys, 2007.
Percentage ever enrolled who received a certificate or diploma from:
Any postsecondary school
Vocational/technical/business school
2-year college
4-year college/university
Percent

12
Employment of youth with disabilities out of high school up to 6 years, by year
NOTE: Percentage employed ever since high school not available for 2003.SOURCE: U.S. Department of Education, Institute of Education Sciences, National Center for Special Education Research, National Longitudinal Transition Study-2 (NLTS2), Waves 2, 3, and 4 parent interviews and youth interviews/surveys, 2003, 2005, 2007.
32
5669
7589
0
20
40
60
80
100
2003 2005 2007
Ever since high school At time of interview
Percent

13
Full-time work by youth with disabilities out of high school up to 6 years, by year
40
5868
0
20
40
60
80
100
2003 2005 2007
Worked 35 hours per week or more
SOURCE: U.S. Department of Education, Institute of Education Sciences, National Center for Special Education Research, National Longitudinal Transition Study-2 (NLTS2), Waves 2, 3, and 4 parent interviews and youth interviews/surveys, 2003, 2005, 2007.
Percent

14
Mean hourly wage of employed youth with disabilities out of high school up to 6 years, by year
$7.30$8.20
$9.37
$1.00
$3.00
$5.00
$7.00
$9.00
$11.00
$13.00
$15.00
Wave 2 Wave 3 Wave 4
Mean hourly wage
SOURCE: U.S. Department of Education, Institute of Education Sciences, National Center for Special Education Research, National Longitudinal Transition Study-2 (NLTS2), Waves 2, 3, and 4 parent interviews and youth interviews/surveys, 2003, 2005, 2007.

15
Participation in postsecondary education, paid employment, or job training of youth with disabilities out of high school up to 6 years, by year
Percent
5265
73
9485
79
0
20
40
60
80
100
2003 2005 2007
Ever engaged in one or more of these activities since high school
Engaged in one or more of these activities at time of interview
SOURCE: U.S. Department of Education, Institute of Education Sciences, National Center for Special Education Research, National Longitudinal Transition Study-2 (NLTS2), Waves 2, 3, and 4 parent interviews and youth interviews/surveys, 2003, 2005, 2007.

16
Living Arrangements and Childbearing or Fathering
17
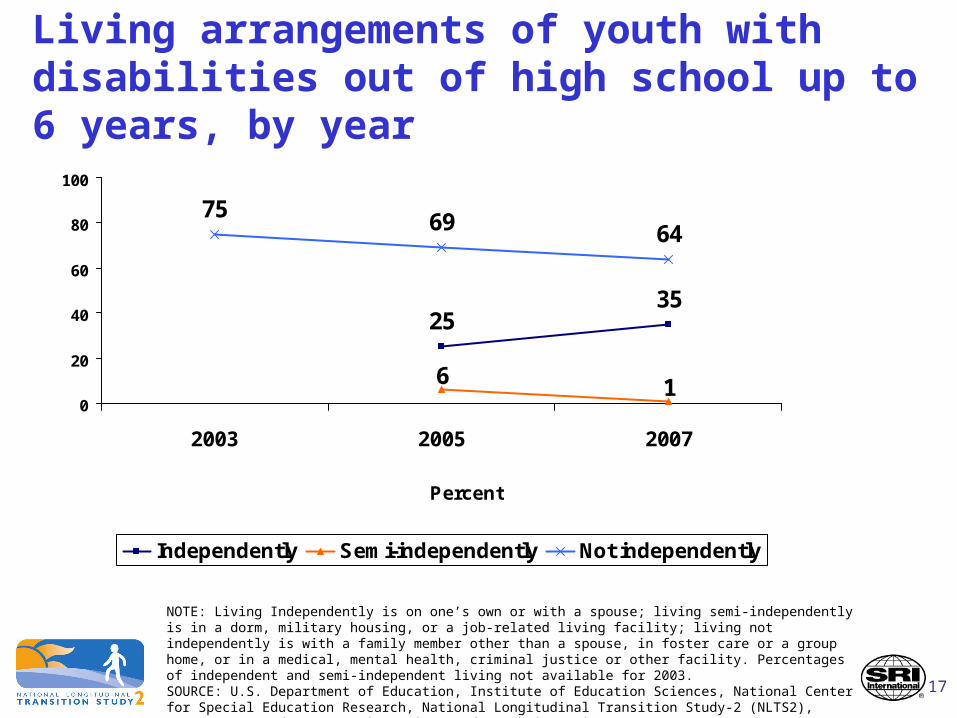
Living arrangements of youth with disabilities out of high school up to 6 years, by year
NOTE: Living Independently is on one’s own or with a spouse; living semi-independently is in a dorm, military housing, or a job-related living facility; living not independently is with a family member other than a spouse, in foster care or a group home, or in a medical, mental health, criminal justice or other facility. Percentages of independent and semi-independent living not available for 2003.SOURCE: U.S. Department of Education, Institute of Education Sciences, National Center for Special Education Research, National Longitudinal Transition Study-2 (NLTS2), Waves 2, 3, and 4 parent interviews and youth interviews/surveys, 2003, 2005, 2007.
Percent
75 69 64
3525
160
20
40
60
80
100
2003 2005 2007
Independently Semi-independently Not independently
18
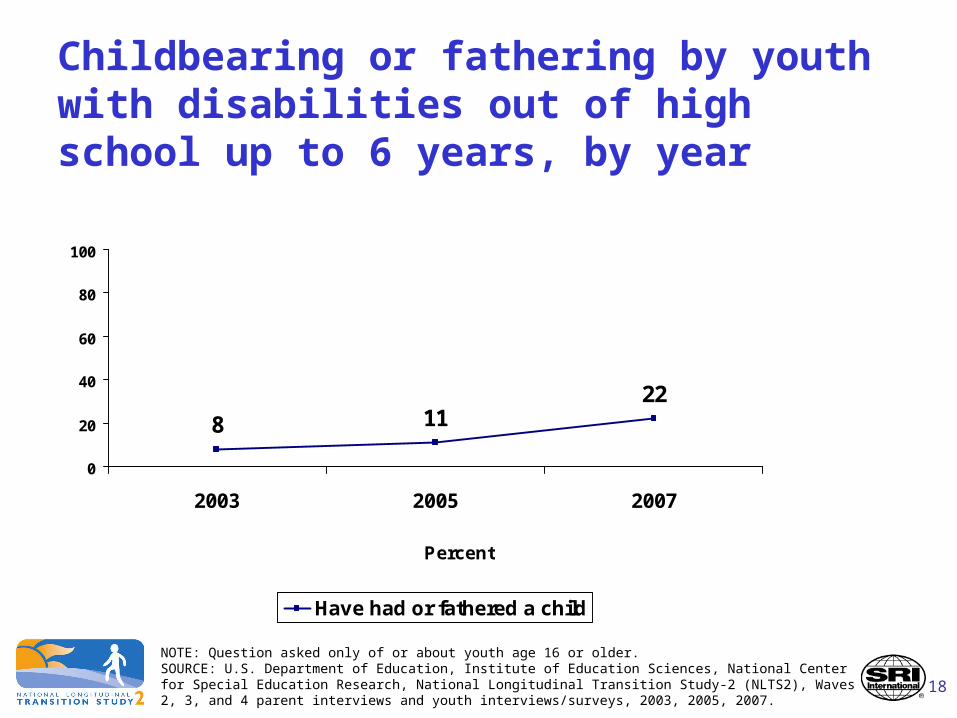
Childbearing or fathering by youth with disabilities out of high school up to 6 years, by year
Percent
22118
0
20
40
60
80
100
2003 2005 2007
Have had or fathered a child
NOTE: Question asked only of or about youth age 16 or older.SOURCE: U.S. Department of Education, Institute of Education Sciences, National Center for Special Education Research, National Longitudinal Transition Study-2 (NLTS2), Waves 2, 3, and 4 parent interviews and youth interviews/surveys, 2003, 2005, 2007.
19
Criminal Justice System Involvement

20
Criminal justice system involvement of youth with disabilities out of high school up to 6 years, by year
29 28 26
17 14
51 53 51
20
0
10
20
30
40
50
60
2003 2005 2007
Stopped by police Arrested
Incarcerated overnight On probation or parole
17 1515
SOURCE: U.S. Department of Education, Institute of Education Sciences, National Center for Special Education Research, National Longitudinal Transition Study-2 (NLTS2), Waves 2, 3, and 4 parent interviews and youth interviews/surveys, 2003, 2005, 2007.
Percentage ever involved since high school

21
Gender Differences in Postschool Outcomes

22
High school completion and equivalency program participation by youth with disabilities out of high school up to 6 years, by gender
8982
46
87
34
87
Completed high school
Noncompleters enrolled in highschool equivalency program
Enrollees who completed highschool equivalency program
Percent
Females Males
SOURCE: U.S. Department of Education, Institute of Education Sciences, National Center for Special Education Research, National Longitudinal Transition Study-2 (NLTS2) Wave 4 parent interviews and youth interviews/surveys, 2007.

23
Postsecondary education enrollment by youth with disabilities out of high school up to 6 years, by gender
56
19
57
33
43
14
20
39
Any postsecondary school
Business, vocational, technical school
2-year college
4-year college/university
Percent
Females Males
SOURCE: U.S. Department of Education, Institute of Education Sciences, National Center for Special Education Research, National Longitudinal Transition Study-2 (NLTS2) Wave 4 parent interviews and youth interviews/surveys, 2007.
Ever attended since high school:
24
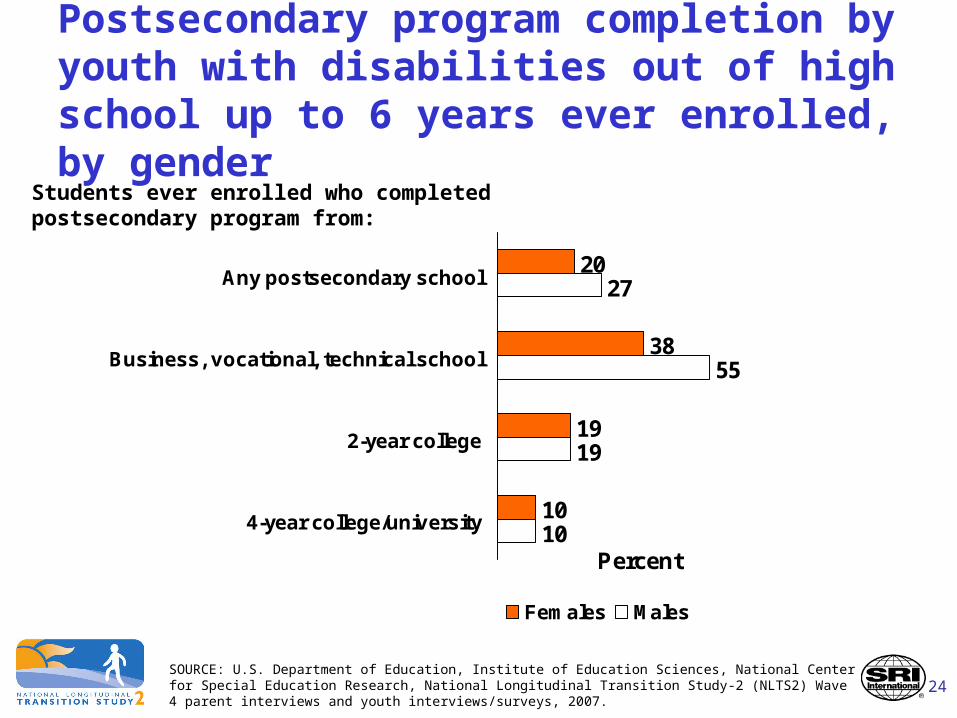
Postsecondary program completion by youth with disabilities out of high school up to 6 years ever enrolled, by gender
20
10
27
55
19
10
38
19
Any postsecondary school
Business, vocational, technical school
2-year college
4-year college/university
Percent
Females Males
SOURCE: U.S. Department of Education, Institute of Education Sciences, National Center for Special Education Research, National Longitudinal Transition Study-2 (NLTS2) Wave 4 parent interviews and youth interviews/surveys, 2007.
Students ever enrolled who completed postsecondary program from:

25
Employment by youth with disabilities out of high school up to 6 years, by gender
83
$8.18
93
74
79
$10.09
59
54*
Worked for pay since high school
Worked for pay at time of interview
Worked at least 35 hours per week
Average hourly wage
Females Males
**
** p > .01 * p < .05SOURCE: U.S. Department of Education, Institute of Education Sciences, National Center for Special Education Research, National Longitudinal Transition Study-2 (NLTS2) Wave 4 parent interviews and youth interviews/surveys, 2007.
Percentage who:

26
Participation in postsecondary education, paid employment, or job training by youth with disabilities out of high school up to 6 years, by gender
92
96
78
65
Ever engaged inone or more ofthese activities
since highschool
Engaged in oneor more of theseactivities at time
of interview
Percent
Females Males
SOURCE: U.S. Department of Education, Institute of Education Sciences, National Center for Special Education Research, National Longitudinal Transition Study-2 (NLTS2) Wave 4 parent interviews and youth interviews/surveys, 2007.
27
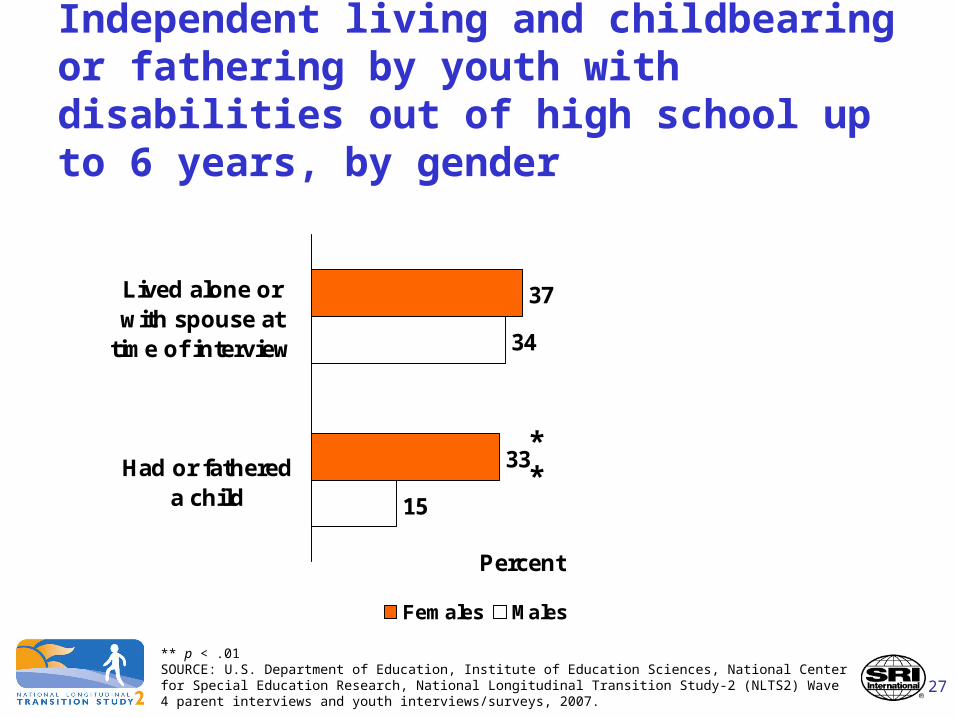
Independent living and childbearing or fathering by youth with disabilities out of high school up to 6 years, by gender
37
34
15
33
Lived alone orwith spouse at
time of interview
Had or fathereda child
Percent
Females Males
** p < .01SOURCE: U.S. Department of Education, Institute of Education Sciences, National Center for Special Education Research, National Longitudinal Transition Study-2 (NLTS2) Wave 4 parent interviews and youth interviews/surveys, 2007.
**
28
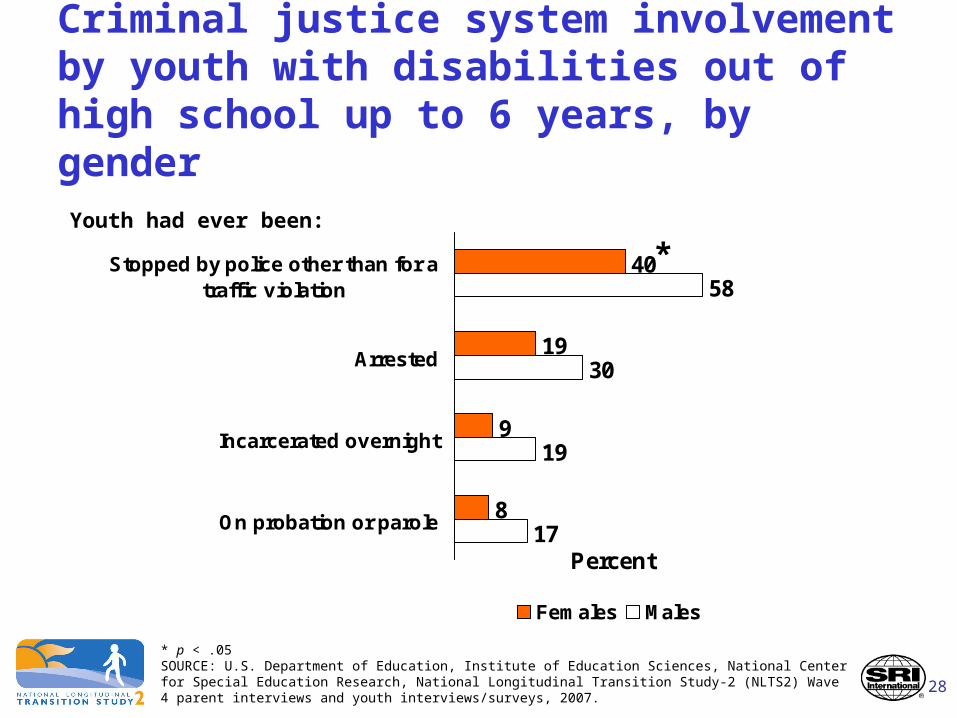
Criminal justice system involvement by youth with disabilities out of high school up to 6 years, by gender
40
8
58
30
19
17
19
9
Stopped by police other than for atraffic violation
Arrested
Incarcerated overnight
On probation or parole
Percent
Females Males
* p < .05SOURCE: U.S. Department of Education, Institute of Education Sciences, National Center for Special Education Research, National Longitudinal Transition Study-2 (NLTS2) Wave 4 parent interviews and youth interviews/surveys, 2007.
Youth had ever been:
*

29
Racial/Ethnic Differences in Postschool Outcomes

30
High school completion and equivalency program participation by youth with disabilities out of high school up to 6 years, by race/ethnicity
8877
41
84
83
29
94
54
87
Completed high school
Noncompleters enrolled in equivalencyprogram
Enrollees who completed equivalencyprogram
Percent
White African American Hispanic
SOURCE: U.S. Department of Education, Institute of Education Sciences, National Center for Special Education Research, National Longitudinal Transition Study-2 (NLTS2) Wave 4 parent interviews and youth interviews/surveys, 2007.

31
Postsecondary education enrollment by youth with disabilities out of high school up to 6 years, by race/ethnicity
58
17
52
24
34
15
66
27
60
13
30
41
Any postsecondary school
Business, vocational, technical school
2-year college
4-year college/university
Percent
White African American Hispanic
SOURCE: U.S. Department of Education, Institute of Education Sciences, National Center for Special Education Research, National Longitudinal Transition Study-2 (NLTS2) Wave 4 parent interviews and youth interviews/surveys, 2007.
Ever attended since high school:
32
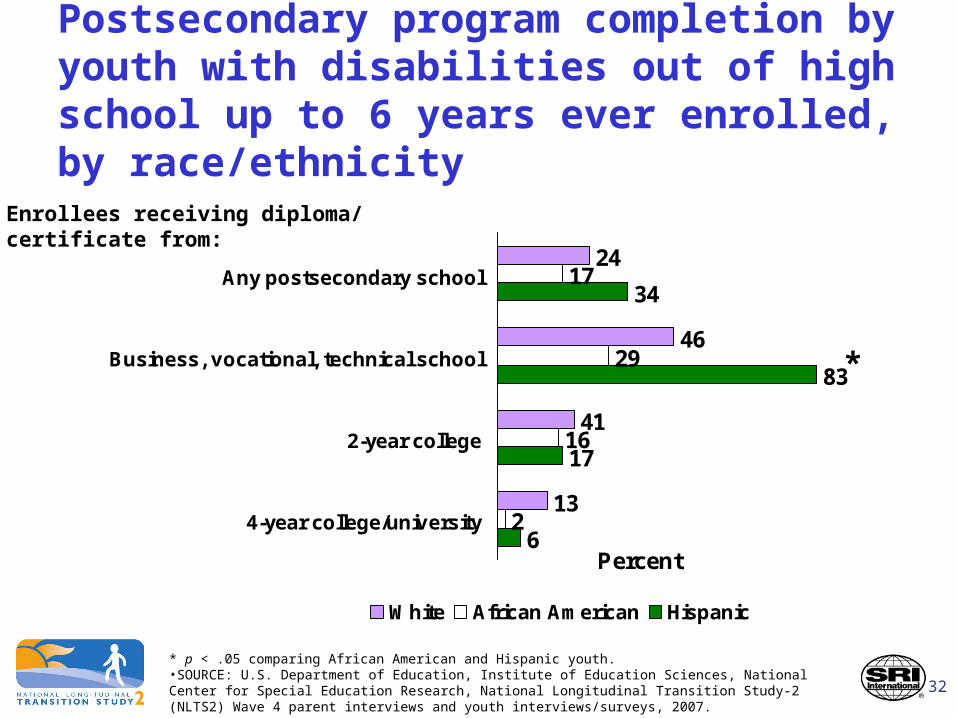
Postsecondary program completion by youth with disabilities out of high school up to 6 years ever enrolled, by race/ethnicity
24
13
17
29
16
2
34
83
17
6
46
41
Any postsecondary school
Business, vocational, technical school
2-year college
4-year college/university
Percent
White African American Hispanic
* p < .05 comparing African American and Hispanic youth.•SOURCE: U.S. Department of Education, Institute of Education Sciences, National Center for Special Education Research, National Longitudinal Transition Study-2 (NLTS2) Wave 4 parent interviews and youth interviews/surveys, 2007.
Enrollees receiving diploma/certificate from:
*
33
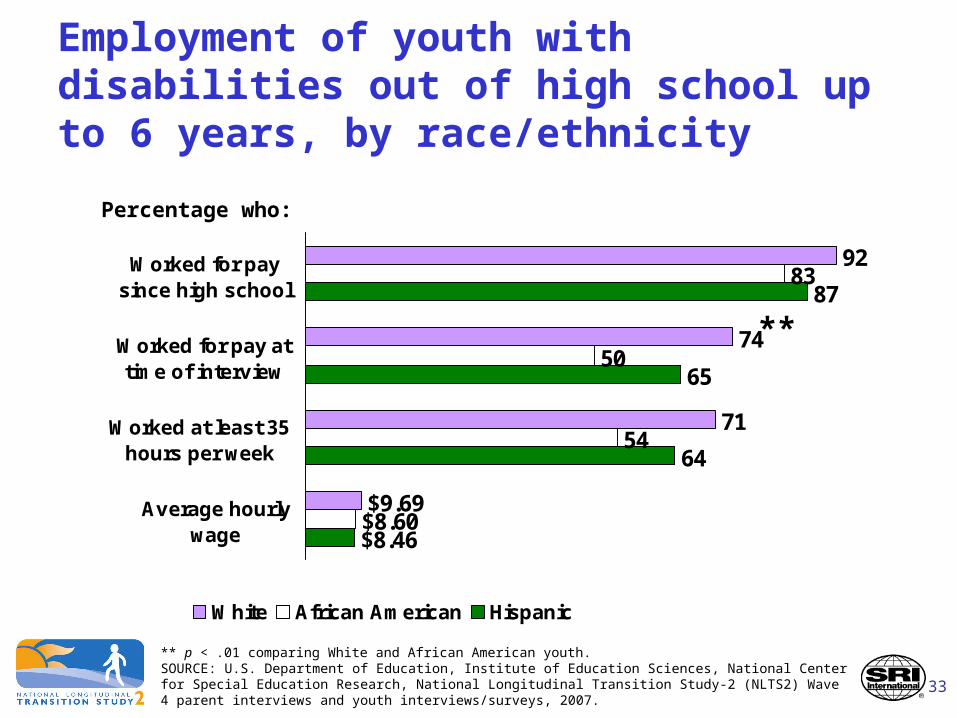
Employment of youth with disabilities out of high school up to 6 years, by race/ethnicity
92
$9.69
83
50
54
$8.60
87
65
64
$8.46
74
71
Worked for paysince high school
Worked for pay attime of interview
Worked at least 35hours per week
Average hourlywage
White African American Hispanic
** p < .01 comparing White and African American youth.SOURCE: U.S. Department of Education, Institute of Education Sciences, National Center for Special Education Research, National Longitudinal Transition Study-2 (NLTS2) Wave 4 parent interviews and youth interviews/surveys, 2007.
Percentage who:
**

34
Participation in postsecondary education, paid employment, or job training by youth with disabilities out of high school up to 6 years, by race/ethnicity
96
89
59
94
69
77
Ever engaged inone or more ofthese activities
since high school
Engaged in one ormore of these
activities at time ofinterview
White African American Hispanic
SOURCE: U.S. Department of Education, Institute of Education Sciences, National Center for Special Education Research, National Longitudinal Transition Study-2 (NLTS2) Wave 4 parent interviews and youth interviews/surveys, 2007.

35
Independent living and childbearing or fathering by youth with disabilities out of high school up to 6 years, by race/ethnicity
37
23
38
40
18
19
Lived alone or withspouse at time of
interview
Had or fathered achild
White African American Hispanic
**
**p < .01 comparing White and African American youth.SOURCE: U.S. Department of Education, Institute of Education Sciences, National Center for Special Education Research, National Longitudinal Transition Study-2 (NLTS2) Wave 4 parent interviews and youth interviews/surveys, 2007.

36
Criminal justice system involvement by youth with disabilities out of high school up to 6 years, by race/ethnicity
48
14
59
31
24
14
49
31
17
12
24
13
Stopped by police other than for atraffic violation
Arrested
Incarcerated overnight
On probation or parole
White African American Hispanic
SOURCE: U.S. Department of Education, Institute of Education Sciences, National Center for Special Education Research, National Longitudinal Transition Study-2 (NLTS2) Wave 4 parent interviews and youth interviews/surveys, 2007.
Youth has ever been:

37
Postschool Outcomes for Youth With Learning Disabilities, Mental Retardation, or Emotional Disturbances

38
High school completion and equivalency program participation by youth with learning disabilities, mental retardation, or emotional disturbances out of high school up to 6 years
8680
29
84
43
89
74
59
75Completed high school
Noncompleters enrolled in highschool equivalency program
Enrollees completed equivalencyprogram
Percent
Learning disabilities Mental retardation Emotional disturbances
SOURCE: U.S. Department of Education, Institute of Education Sciences, National Center for Special Education Research, National Longitudinal Transition Study-2 (NLTS2) Wave 4 parent interviews and youth interviews/surveys, 2007.

39
Postsecondary education enrollment by youth with learning disabilities, mental retardation, or emotional disturbances out of high school up to 6 years, by type of school
61
16
36
21
27
9
42
25
31
8
29
44
Any postsecondary school
Business, vocational, technical school
2-year college
4-year college/university
Percent
Learning disabilities Mental retardation Emotional disturbances
** p < .01, * p < .05 compared with youth with mental retardation.SOURCE: U.S. Department of Education, Institute of Education Sciences, National Center for Special Education Research, National Longitudinal Transition Study-2 (NLTS2) Wave 4 parent interviews and youth interviews/surveys, 2007.
Ever attended since high school:**
*

40
Postsecondary program completion by youth with learning disabilities, mental retardation, or emotional disturbances out of high school up to 6 years
22
5
23
16
32
41
30
11
55
16
Any postsecondary school
Business, vocational, technical school
2-year college
4-year college/university
Percent
Learning disabilities Mental retardation Emotional disturbances
NOTE: There are too few youth with mental retardation who had enrolled in a business/vocational/technical school or a 4-year college/university to report completion rates for them.SOURCE: U.S. Department of Education, Institute of Education Sciences, National Center for Special Education Research, National Longitudinal Transition Study-2 (NLTS2) Wave 4 parent interviews and youth interviews/surveys, 2007.
Ever enrolled and received diploma/certificate from:

41
Employment of youth with learning disabilities, mental retardation, or emotional disturbances out of high school up to 6 years
93
$9.49
73
44
64
$7.49
90
66
75
$10.40
74
69
Ever worked for pay since high school
Worked for pay at time of interview
Worked at least 35 hours per week atcurrent or most recent job
Average hourly wage at current ormost recent job
Percent
Learning disabilities Mental retardation Emotional disturbances
*** p < .001, ** p < .01, * p < .05 compared with youth with mental retardation.SOURCE: U.S. Department of Education, Institute of Education Sciences, National Center for Special Education Research, National Longitudinal Transition Study-2 (NLTS2) Wave 4 parent interviews and youth interviews/surveys, 2007.
Percentage who:
**
*
***
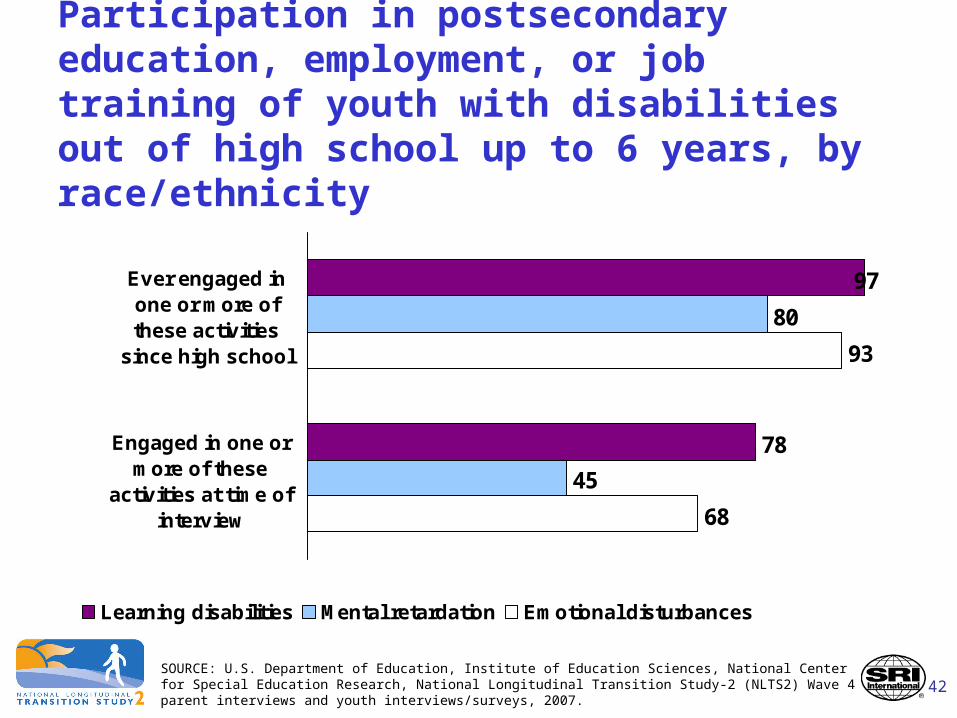
42
Participation in postsecondary education, employment, or job training of youth with disabilities out of high school up to 6 years, by race/ethnicity
97
80
45
93
68
78
Ever engaged inone or more ofthese activities
since high school
Engaged in one ormore of these
activities at time ofinterview
Learning disabilities Mental retardation Emotional disturbances
SOURCE: U.S. Department of Education, Institute of Education Sciences, National Center for Special Education Research, National Longitudinal Transition Study-2 (NLTS2) Wave 4 parent interviews and youth interviews/surveys, 2007.

43
Independent living and childbearing or fathering by youth with learning disabilities, mental retardation, or emotional disturbances out of high school up to6 years
93
73
19
90
11
24
Lived alone or withspouse at time of
interview
Had or fathered achild
Percent
Learning disabilities Mental retardation Emotional disturbances
** p < .01, * p < .05 comparing youth with learning disabilities and those with mental retardation.SOURCE: U.S. Department of Education, Institute of Education Sciences, National Center for Special Education Research, National Longitudinal Transition Study-2 (NLTS2) Wave 4 parent interviews and youth interviews/surveys, 2007.
**
*

44
Criminal justice system involvement by youth with learning disabilities, mental retardation, or emotional disturbances out of high school up to 6 years
52
12
35
14
10
7
74
53
33
36
25
14
Stopped by police other than for atraffic violation
Arrested
Incarcerated overnight
On probation or parole
Percent
Learning disabilities Mental retardation Emotional disturbances
*** p < .001, ** p < .01 compared with youth with emotional disturbances.SOURCE: U.S. Department of Education, Institute of Education Sciences, National Center for Special Education Research, National Longitudinal Transition Study-2 (NLTS2) Wave 4 parent interviews and youth interviews/surveys, 2007.
Youth has ever been:
***
***
***
******
***
*****

45
Postschool Outcomes by School Completion Status

46
Postsecondary education enrollment by youth with disabilities out of high school up to 6 years, by school completion status
64
19
20
5
15
1
32
46
Any postsecondary school
Business, vocational, technical school
2-year college
4-year college/university
Percent
High school completers Noncompleters
*** p < .001SOURCE: U.S. Department of Education, Institute of Education Sciences, National Center for Special Education Research, National Longitudinal Transition Study-2 (NLTS2) Wave 4 parent interviews and youth interviews/surveys, 2007.
Ever attended since high school:***
***
***
***
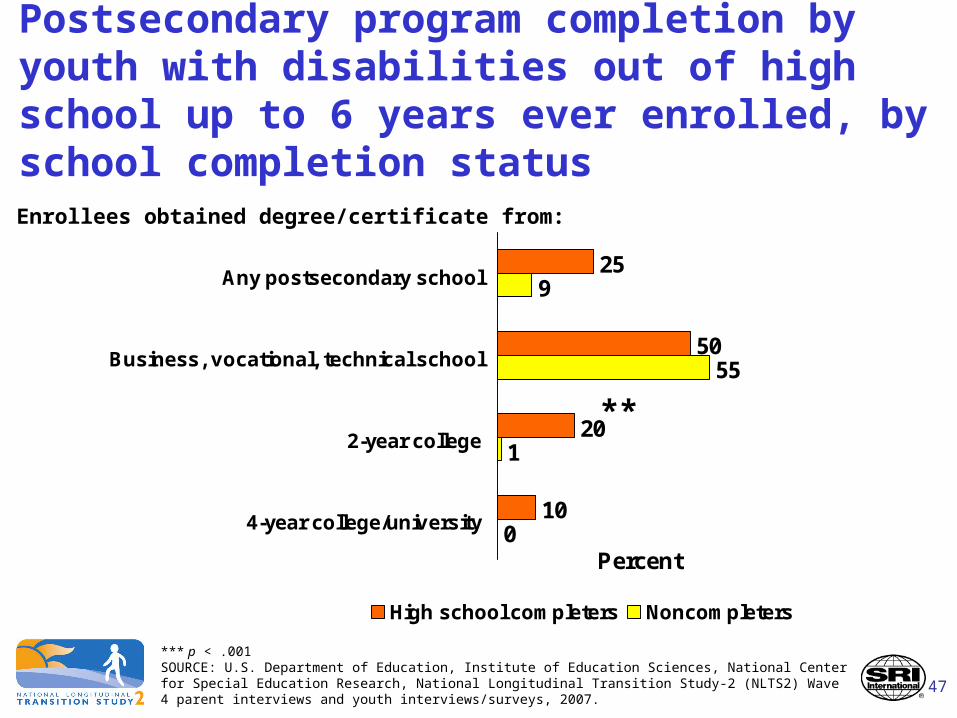
47
Postsecondary program completion by youth with disabilities out of high school up to 6 years ever enrolled, by school completion status
25
10
9
55
1
0
50
20
Any postsecondary school
Business, vocational, technical school
2-year college
4-year college/university
Percent
High school completers Noncompleters
*** p < .001SOURCE: U.S. Department of Education, Institute of Education Sciences, National Center for Special Education Research, National Longitudinal Transition Study-2 (NLTS2) Wave 4 parent interviews and youth interviews/surveys, 2007.
Enrollees obtained degree/certificate from:
**

48
Employment of youth with disabilities out of high school up to 6 years, by high schoolcompletion status
90
$9.35
84
53
79
$9.67
66
71
Worked for pay since high school
Worked for pay at time of interview
Worked at least 35 hours per week
Average hourly wage
Percent
High school completers Noncompleters
** p > .01SOURCE: U.S. Department of Education, Institute of Education Sciences, National Center for Special Education Research, National Longitudinal Transition Study-2 (NLTS2) Wave 4 parent interviews and youth interviews/surveys, 2007.
Percent who:

49
Participation in postsecondary education, paid employment, or job training by youth with disabilities out of high school up to 6 years, by high school completion status
83
43
96
76
Ever engaged inone or more ofthese activities
since highschool
Engaged in oneor more of theseactivities at time
of interview
Percent
High school completers Noncompleters
** p > .01SOURCE: U.S. Department of Education, Institute of Education Sciences, National Center for Special Education Research, National Longitudinal Transition Study-2 (NLTS2) Wave 4 parent interviews and youth interviews/surveys, 2007.
**

50
Independent living and childbearing or fathering by youth with disabilities out of high school up to 6 years, by high school completion status
34
39
36
19
Lived alone orwith spouse at
time of interview
Had or fathereda child
Percent
High school completers Noncompleters
SOURCE: U.S. Department of Education, Institute of Education Sciences, National Center for Special Education Research, National Longitudinal Transition Study-2 (NLTS2) Wave 4 parent interviews and youth interviews/surveys, 2007.
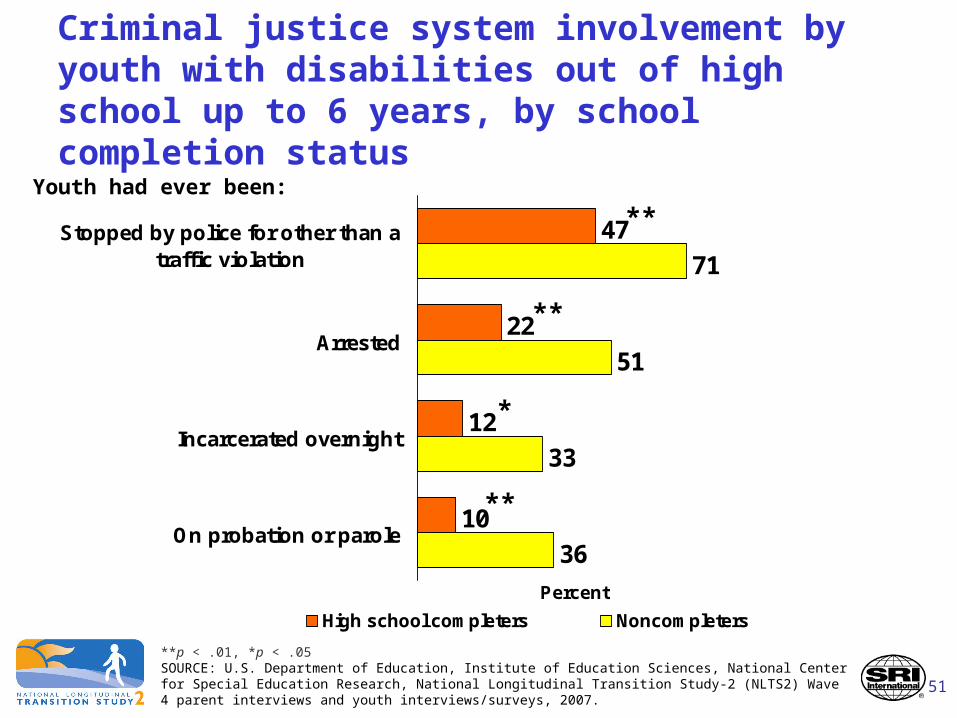
51
Criminal justice system involvement by youth with disabilities out of high school up to 6 years, by school completion status
47
22
12
10
71
51
33
36
Stopped by police for other than atraffic violation
Arrested
Incarcerated overnight
On probation or parole
Percent
High school completers Noncompleters
**p < .01, *p < .05SOURCE: U.S. Department of Education, Institute of Education Sciences, National Center for Special Education Research, National Longitudinal Transition Study-2 (NLTS2) Wave 4 parent interviews and youth interviews/surveys, 2007.
**
**
*
**
Youth had ever been:

52
For more information:
www.nlts2.org
Full Reports Fact Sheets & Data Briefs
Executive Summaries Data Tables