empathy building through data analysis conference/presentatio… · empathy building through data...
TRANSCRIPT

Empathy Building through Data AnalysisUsing Data Analysis geared towards understanding the population you are engaging with
- About Benefits Data Trust (BDT)- Empathy Building Data Analysis: Character Defining Elements, definitions and examples- Using Character Defining Elements, a Machine Learning example- Overcoming technical barriers
PA State Data Users Conference May 9, 2019Organization: Benefits Data TrustSpeaker: David O’Malley

BDT helps people live healthier, more independent lives by creating smarter ways to access essential benefits and services.
About Benefits Data Trust
2

Who We Are & What We Do
FOUNDED: 2005HEADQUARTERED: Philadelphia, PA
MISSION: BDT helps people live healthier, more independent lives by creating smarter ways to access essential benefits and services.
VISION: We envision a world that connect people to essential benefits and services while treating them with dignity and respect. We envision lower healthcare costs, more efficient government, and people who are healthy, economically mobile, and thriving.
When services are well coordinated across sectors people are healthier and more economically Secure, the system is more efficient and cost-effective, and our communities are stronger.
3

4 in 5 Physicians…• feel that unmet social needs are leading to worsening health
•are not confident in their ability to address their patients’ social needs
Why it Matters: Unmet Social Needs
4

Why it Matters: Unmet Social Needs
people in America live in
povertychildren are
food insecurePennsylvanians are
food insecureof adults forgo healthcare due
to cost
27%39million
…and therefore are more likely to struggle in school, experience poor health, and live in constant crisis
13million
5
1.7mil l ion

6
Programs Exist to Help

National Gaps in Access
39% of eligible mothers are not enrolled in WIC
9 million individuals are eligible but not enrolled in SNAP
30% of working poor are eligible but not enrolled in SNAP
6.5 million families are eligible but do not receive the EITC
2 million seniors are eligible but not enrolled in Medicare Part D (LIS)7

• Lack of knowledge
• Cumbersome applications
• Mobility
• Stigma
• Technology
Barriers to Access

Programs Work to Improve Outcomes
9
SNAP saves $1,400 per year in healthcare expenditures for low-income adults
SNAP participation leads to gains in reading and math skills among elementary children and is associated with higher graduation rates
Children who receive SNAP and WIC score higher on mental development assessments, have higher academic achievement, and are healthier vs. non-participants
Medicaid exposure during early childhood leads to better overall health in adulthood
EITC boosts employment rates among parents and has long-term positive impacts on their children
Senior SNAP enrollment reduces the likelihood of hospitalization by 14% and nursing home utilization by 23%

10
BDT’s Model
Data-Driven Human-Centered Multi-Channel Outcomes-Driven
Focused on interventions that improve outcomes
Enrollment tracked to demonstrate outcome
Results-oriented access platform
Dignified service delivery
Nudges embedded to ensure success
Seamless referral to other important services
Coordinated service provision across channels (web/text/phone/in-person)
Client choice embedded across channels
Tailored communication to deliver maximum efficiency
Predictive modeling used to target intervention
Targeted outreach at scale
Model transferable across populations and geographies

Strategies to Deliver Impact at Scale
Data, Analytics & Technology
•Data-driven, targeted outreach & assistance• Customized enrollment management software•Tech-enabled, cross-channel, community-wide assistance
Policy & Practice Solutions
•Policy and process change to streamline comprehensive access•Cross-sector data sharing•Outcomes-focused research
Direct Service•Person-centered service delivery: web, phone, text, and in-person•Predictive, individualized outreach & engagement•Dignity at scale
Partner Engagement•Philanthropy•Local, state & federal government•National organizations•Community based organizations•Healthcare plans and providers•Academia
Multi-pronged approach required to achieve better economic, health, and social outcomes for individuals and families
11

12
PRIVATE SECTOR STRATEGIES
EFFICIENT & EFFECTIVE
SIMPLE, COMPREHENSIVE, COST-EFFECTIVE
PERSON-CENTERED
OUTCOMES DRIVEN AT SCALE
Strategic Evolution

Submitted over 650,000 benefit applications nationwide – more than any other single organization in the countryGenerated more than $7 billion in benefits to help low-income
households pay for food, shelter, utilities, healthcare, and childcare Simplified Medicaid enrollment so 200,000 Pennsylvanians need to
only check a box to enrollBrokered and secured 34 data share agreements with government
agencies, private sector entities, and community-based organizationsBenePhilly increased senior SNAP participation by 23% in 18 monthsSimplified SNAP enrollment in Pennsylvania and MarylandCreated Community PRISM for in-person, person-centered assistance
with 19 benefits
BDT’s Results to Date
13

•Help clients at scale•Commitment to Pennsylvanians•Proven, replicable & transferrable model•Cost-effective•Increased customer engagement & retention rates•Improved client satisfaction scores•Reduced per-member-per-month (PMPM) cost of care•Focus on the social Determinants of Health
Why BDT?

Why apply an Empathy Building approach in Data Analysis ?
- Better identify Social Determinants of Health- Better identify where your services are/aren’t needed- Know which key factors would need to be addressed
when working with a community- Be better informed and have more appropriate
recommendations- Build trust with community members- Build rapport with community leaders and partners
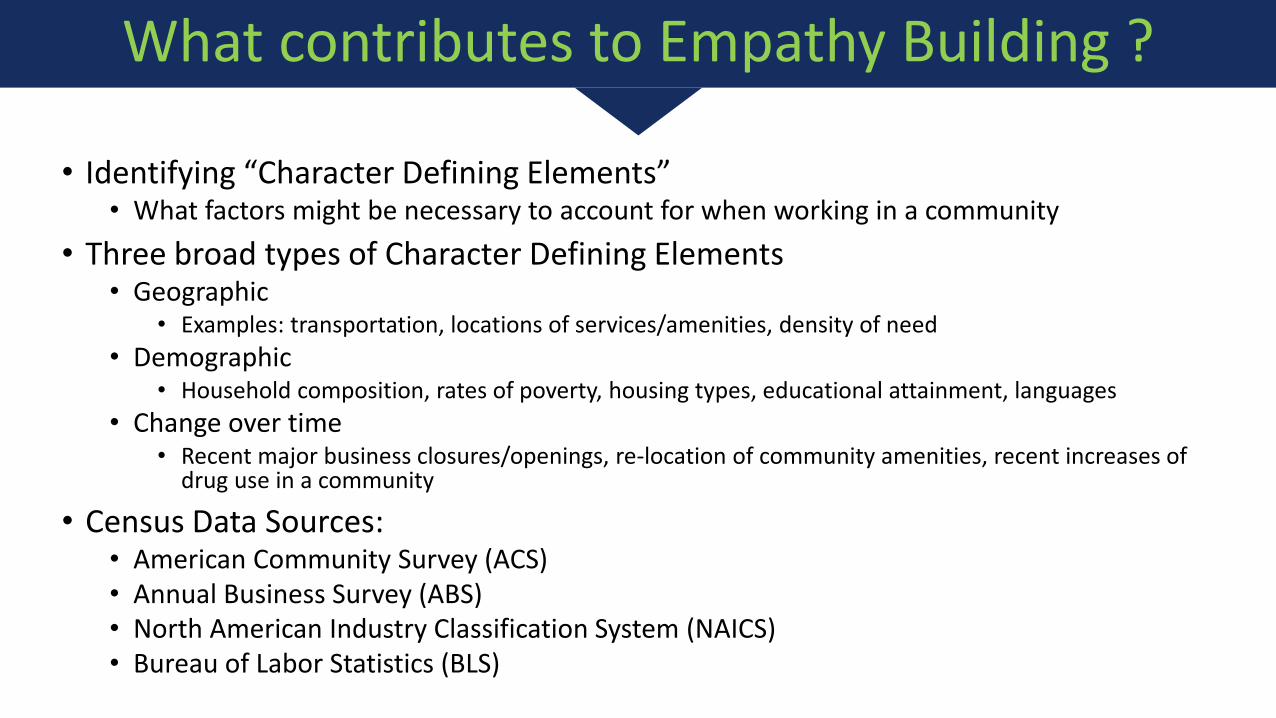
• Identifying “Character Defining Elements”• What factors might be necessary to account for when working in a community
• Three broad types of Character Defining Elements• Geographic
• Examples: transportation, locations of services/amenities, density of need• Demographic
• Household composition, rates of poverty, housing types, educational attainment, languages• Change over time
• Recent major business closures/openings, re-location of community amenities, recent increases of drug use in a community
• Census Data Sources:• American Community Survey (ACS)• Annual Business Survey (ABS)• North American Industry Classification System (NAICS)• Bureau of Labor Statistics (BLS)
What contributes to Empathy Building ?

Geographic Character Defining Elements Example
Lehigh Valley zip codes and availability of grocery stores, weighted by population
Lehigh Valley zip codes and households reporting no vehicle access, weighted by population
Highlighted here is a look into access Lehigh Valley households have to grocery stores. The map to the left shows the Lehigh Valley has a geographically uniform distribution of food access, with little or no clustering. The map on the right shows a lower rate of car ownership in Allentown. Given there is no clustering of food access points in Allentown, a conclusion can be made that residents in Allentown face difficulty in food store access due to a lack of personal transportation options.
Source: North American Industry Classification System (https://www.census.gov/eos/www/naics/)

Demographic Character Defining Elements Example
The five zip codes in Allegheny County with the highest percentage of multi-generational households
Percentage of Households in these zip codes who reported being in poverty in the previous year, with 15110 being the highest.
What can other Census data points tell us about zip code 15110?
Census Variable Percentage (of total population)
On public assistance 5%
Under 100% the Federal Poverty Level 38%
No retirement income reported 36%
Owner Occupied housing 18%
Number of Community Service Organizations 10
What factors might we need to take
into consideration if working in this
community?
Source: American Community Survey: https://factfinder.census.gov/faces/nav/jsf/pages/download_center.xhtml

Change over time Character Defining Elements ExampleScranton
Gettysburg Erie
Graphs source: U.S. Bureau of Labor Statistics (https://www.bls.gov/regions/mid-atlantic/pennsylvania.htm)

Making CDE data work for you
Your Organization’s
Data
External Data (Census, etc.)
Applying Machine Learning
Predictive Analytics
informing the organization a
more appropriate way to move
forward
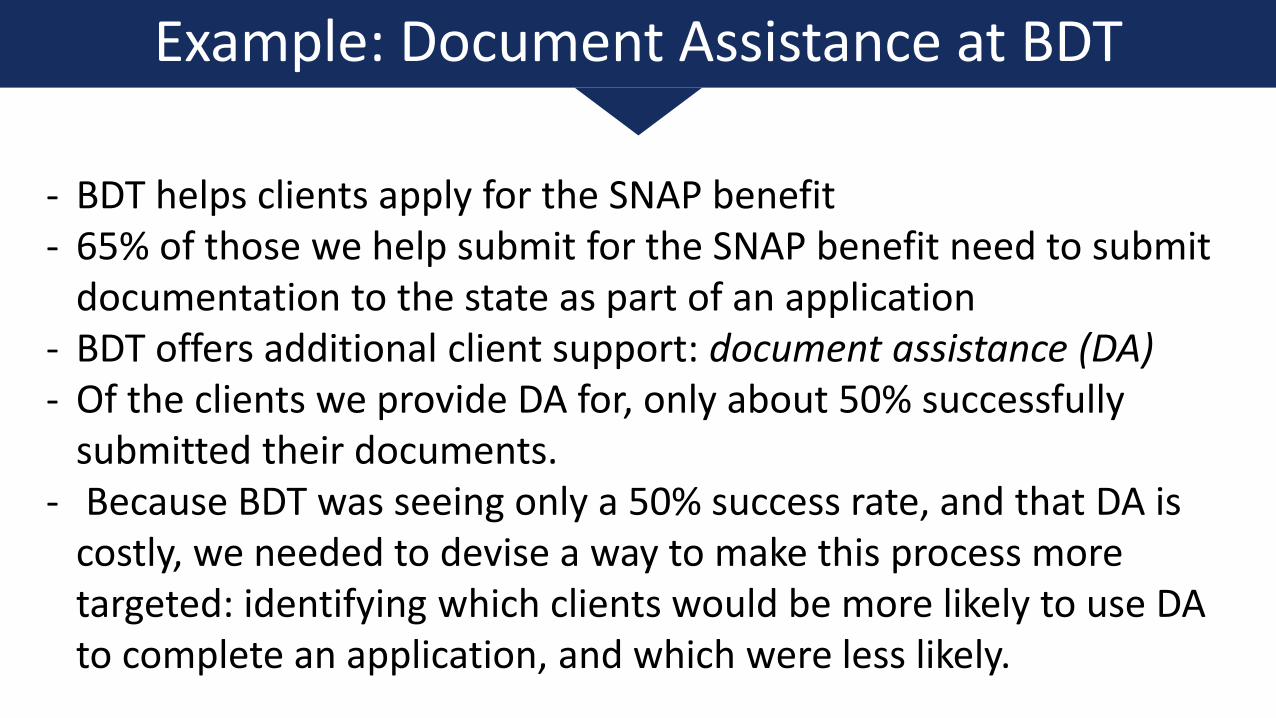
Example: Document Assistance at BDT
- BDT helps clients apply for the SNAP benefit- 65% of those we help submit for the SNAP benefit need to submit
documentation to the state as part of an application- BDT offers additional client support: document assistance (DA)- Of the clients we provide DA for, only about 50% successfully
submitted their documents.- Because BDT was seeing only a 50% success rate, and that DA is
costly, we needed to devise a way to make this process more targeted: identifying which clients would be more likely to use DA to complete an application, and which were less likely.
Example: Document Assistance at BDT

Example: Document Assistance at BDT
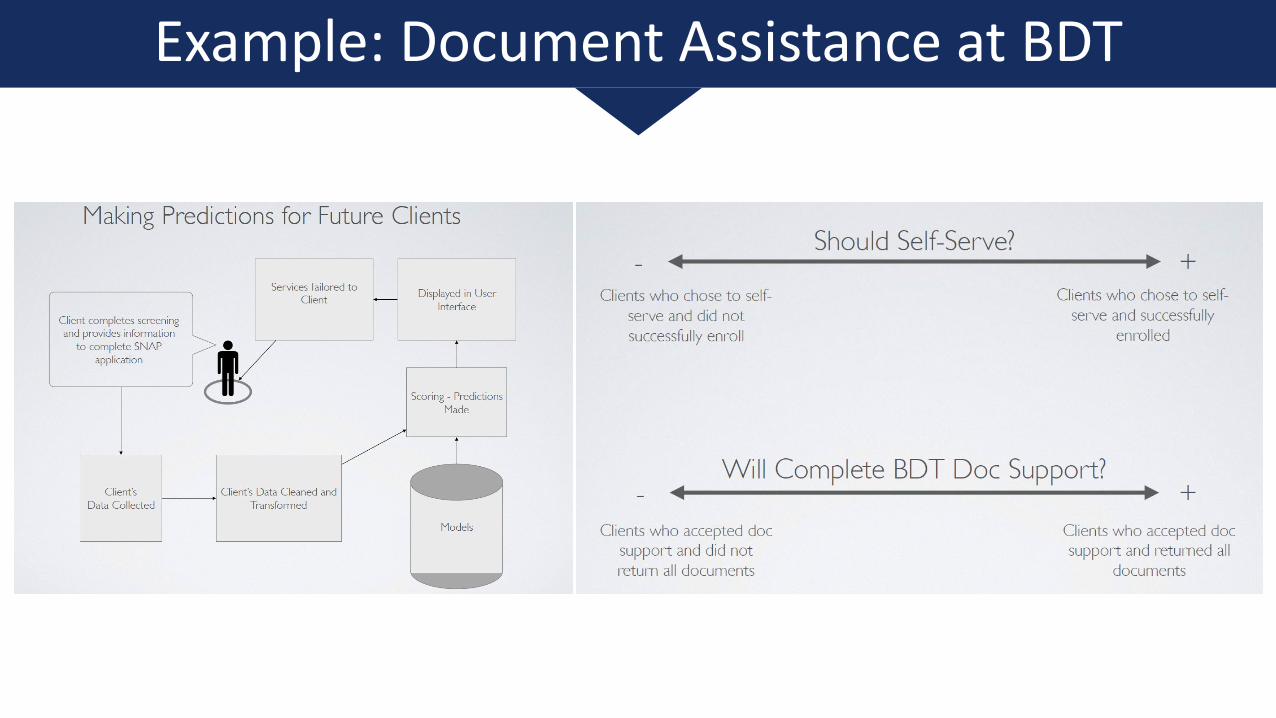
Which Character Defining Elements present within a client’s community could have impact on whether or not a client would utilize DA ?
internal data (outreach, response,
applications, enrollments)
External Data (Census, etc.)
Applying Machine Learning
Informed decisions: which
clients DA is more/less
appropriate for

Example: Document Assistance at BDT

Example: Document Assistance at BDT
Incorporating Geographic,
Demographic and Change-over-time Character Defining Elements Data will better inform the
model to make more accurate
and robust predictions.

Overcoming Technical Barriers
Identifying Character Defining Elements, synthesizing internal data and performing Machine Learning can be quite challenging.
This process can be made more difficult by not having standardized data ingestion procedures.
Save time Extracting, Transforming and Loading (ETL) your data and transfer that time to identifying CDEs and building/training Machine Learning models.

Standardizing and automating data ingestion
- If you receive data from an external partner, communicate to them:1) How you need the data to arrive (SFTP or secure file share)2) How you need the data to be stored as (.csv, .txt, .xlsx) 3) How you need the data to appear (column headings and order). • This helps develop data processing systems that can be standardized
and not needing to be changed each time a new file is received. - Create an ETL pipeline (Python is excellent for doing this)- Set automatic jobs for ETL pipelines (Airflow is excellent for doing this) - Consider using Cloud storage for data protection, security and ease of
use between multiple employees

Census Data Python API
https://pypi.org/project/CensusData/
- Manually downloading Census Data can be quite aggravating.- Census Data files often come with erroneous data points that aren’t
beneficial to analysis, therefore would need to be manually cleaned in programs like Excel.
- This Application Programming Interface (API) helps you download only what you need
- It also helps you download large amounts of data in an easily ingestible format that comes standardized and ready for analysis.
- Using other Python packages and operations, you can incorporate Census Data into an ETL process

Other points to keep in mind
- Collaborate and apply others’ perspectives and know-how- Don’t be afraid to discard old data and code- Identify the data you need and nothing more- Consider using a Business Intelligence tool for better
communication of findings- Begin asking questions about your internal data
- Ex: Why might we be seeing this outcome?- Identify one or two issues your organization needs to address,
start simple- Utilize online training resources

Questions ?
Thank you