emissions testing of gas-powered commercial … testing of gas-powered commercial vehicles the...
TRANSCRIPT

Emissions Testing of Gas-Powered Commercial Vehicles The results of tests to measure the greenhouse gas and air pollutant emission performance of various gas-powered HGVs, on behalf of Department for Transport.
Prepared by Low Carbon Vehicle Partnership
January 2017
Written by: Brian Robinson CEng CEnv MIMechE
Programme Manager (Commercial Vehicles)
Reviewed by: Andy Eastlake CEng FIMechE Managing Director
Acknowledgements
The Low Carbon Vehicle Partnership are enormously grateful to the many individuals and organizations from industry and academia who contributed resources, vehicles and expertise to this study, as well as to the Department for Transport and Transport for London for funding it. Some, but by no means all those organizations are as indicated here.

Executive Summary .............................................................................................................................................. 1
1 Introduction ................................................................................................................................................ 7
1.1 Background .................................................................................................................................................... 7
1.2 Programme management .............................................................................................................................. 9
2 Vehicles and technologies selected for testing .......................................................................................... 10
3 Test procedures and cycles ....................................................................................................................... 12
3.1 Test method ................................................................................................................................................. 12
3.2 Instrumentation ........................................................................................................................................... 12
3.2.1 Air pollutant emissions ....................................................................................................................... 13
3.2.2 Greenhouse Gas emissions ................................................................................................................ 13
3.3 Test cycles .................................................................................................................................................... 15
4 Test results ................................................................................................................................................ 16
4.1 Greenhouse gas emissions ........................................................................................................................... 16
4.1.1 Greenhouse gas emissions, dedicated gas vehicles ........................................................................... 17
4.1.2 Greenhouse gas emissions, dual fuel vehicles ................................................................................... 18
4.1.3 Nitrous oxide emissions ..................................................................................................................... 18
4.1.4 Overall GHG emissions summary ....................................................................................................... 19
4.2 Pollutant emissions ...................................................................................................................................... 21
4.2.1 Pollutant emissions, dedicated gas vehicles ...................................................................................... 21
4.2.2 Pollutant emissions, dual fuel vehicles ............................................................................................... 22
4.3 Substitution rates and efficiency losses ....................................................................................................... 22
5 Discussion ................................................................................................................................................. 25
5.1 Greenhouse gas emissions ........................................................................................................................... 25
5.1.1 Dedicated gas vehicles ....................................................................................................................... 25
5.1.2 Dual-fuel vehicles ............................................................................................................................... 26
5.2 Future technology developments ................................................................................................................. 26
5.2.1 OEM dedicated gas technologies ....................................................................................................... 27
5.2.2 OEM dual-fuel technologies ............................................................................................................... 28
5.2.3 Retrofit dual-fuel conversions ............................................................................................................ 29
6 Conclusions & Recommendations ............................................................................................................. 31
6.1 Conclusions .................................................................................................................................................. 31
6.2 Recommendations: ...................................................................................................................................... 32
Glossary ............................................................................................................................................................. 33
Annex 1: LowCVP Accreditation Scheme Test Procedure .................................................................................... 34


1
Executive Summary Background Freight transport is vital to economic growth, but also has significant environmental impacts. Heavy goods vehicles (HGVs) are currently estimated to account for around 16% of UK greenhouse gas (GHG) emissions from road transport and around 21% of road transport NOx emissions, while making up just 5% of vehicle miles1. The 2008 Climate Change Act set an ultimate target for 2050 of an 80% reduction in GHG emissions from 1990 levels. Meeting this target will be challenging and the transport sector is under increasing pressure to decarbonize. Displacing conventional fuels with alternative fuels such as methane has the potential to significantly reduce GHG emissions from difficult-to-decarbonize sectors such as road freight.
There is considerable interest amongst fleet operators in the use of methane as a road fuel, either in its fossil fuel form as natural gas or as a biofuel, bio-methane. It attracts lower fuel duties than diesel and offers the potential for air quality (AQ) benefits and lower GHG emissions. However, there is currently a limited evidence base on the cost effectiveness, carbon abatement potential and wider impacts (e.g. air quality) of displacing diesel with methane in commercial vehicles.
The £11.3 million Low Carbon Truck Trial (LCTT)2, which ran between 2012 and 2016, part-funded industry consortia to purchase and trial around 370 alternatively-fuelled commercial vehicles (most of which were dual fuel, diesel/natural gas aftermarket conversions), and to commission refuelling infrastructure. Nearly all the vehicles trialled were Euro V but the Trial came at a time when the commercial vehicle market was making the major shift (and investment) to Euro VI. Euro VI gas-fuelled trucks were unavailable until towards the end of the trial period and the project was therefore unable to gather comprehensive evidence on the emissions performance of these vehicles. Evidence to date strongly supports the view that the shift to Euro VI has led to very significant reductions in pollutant emissions, including NOx, for conventional diesel vehicles.
Methane Slip Furthermore, the LCTT has indicated, via a limited, non-standardized set of tests by some of the participating consortia, but not through systematic measurement, that there has been an issue with emissions of unburnt methane (methane slip) from some of the participating vehicles, particularly the retrofit dual-fuel diesel/natural gas conversions. Methane is a potent GHG and if emissions are significant, they could outweigh any reductions in CO2 emissions from using gas in place of diesel. Measurement of methane emissions was outside the scope of the LCTT and, more generally, there is currently a lack of real-world data on both methane slip and air quality pollutant emissions from dedicated gas and dual-fuel commercial vehicles.
In the first phase of research into this methane slip issue, a DfT research project in 2014/15 designed and trialled an HGV emissions testing protocol and made recommendations for further tests. That research, by Ricardo-AEA, also explored the causes of methane slip and summarized previous research into the phenomenon. It showed how well designed and calibrated spark
1 https://www.gov.uk/government/collections/transport-statistics-great-britain#data-tables - 2014 data, calculated from Tables TSGB0306 (ENV0202), TSGB0308 (ENV0301) and TSGB0701 (TRA0101). 2 At the time of drafting, the final report into the LCTT was also in draft. The latest published summary is available via https://www.gov.uk/government/uploads/system/uploads/attachment_data/file/448049/low-carbon-truck-trial-2.pdf

2
ignition engines, running on dedicated gas, combined with exhaust after-treatment catalysis can minimize methane slip. It also highlighted how dual fuel, diesel/natural gas engines could be particularly susceptible to methane slip3.
The Ricardo-AEA report also noted how methane emissions are regulated via the type approval process for dedicated gas engines, but not for aftermarket conversions to dual-fuel operation. The report estimated that methane emissions higher than about 2.6 g/km would, for the converted vehicles typically operating in the LCTT, be sufficient to cancel out the reported reductions in CO2 emissions. Furthermore, it highlighted how little research had already been carried out internationally into the methane slip issue, with previous studies using differing and therefore not directly comparable approaches to measuring methane emissions, and thus there was a need to develop and use a representative, standardized test protocol.
Vehicle Testing As a second, follow-up phase, the DfT commissioned this HGV emissions testing project with the Low Carbon Vehicle Partnership (LowCVP) and its members to carry out vehicle testing across a representative range of gas-fuelled HGVs to quantify the scale of the methane slip issue and to identify possible mitigation options. This programme of testing was designed to help the Department for Transport to develop its evidence base to inform future policy on gas vehicles, and allow the results of the Low Carbon Truck Trial to be set in their proper GHG impacts context.
With due consideration given to the priorities identified, the funding available and the availability of vehicles and technologies, the tests covered the following vehicles/technologies:
Four dedicated OEM Euro VI natural gas vehicles, including two 40t artics, one 18t rigid and one 7t van
One LCTT dual fuel (DF) diesel/natural gas retrofit conversion to a Euro V 44t artic vehicle
One DF (diesel/natural gas) retrofit conversion to a Euro VI 44t artic vehicle
One DF (diesel/LPG) retrofit conversion to a Euro VI 44t artic vehicle4
To provide proper baseline data, each dedicated gas vehicle was evaluated against an equivalent, conventional Euro VI diesel truck. The baseline case for the dual fuel vehicles was provided by comparing emissions performance under dual fuel operating conditions with those when the same vehicle was operating in diesel-only mode.
The test programme used the track-based test procedures and three drive cycles developed originally by LowCVP for its HGV retrofit (CO2 reducing) technology accreditation scheme (simulating long haul, regional delivery and urban delivery operations), with emissions measurement via Portable Emissions Monitoring System (PEMS). A fourth, city-centre delivery cycle was also developed as part of the programme to better represent operations typical of trucks delivering into congested city centres.
It was thought at the outset of the research that nitrous oxide (N2O) was likely to be emitted in very low (and similar) quantities from both diesel and gas-fuelled vehicles. During the project,
3 Provision of HGV Emissions Testing: Final Report. Ricardo-AEA, August 2015. Available via https://www.gov.uk/government/uploads/system/uploads/attachment_data/file/468172/hgv-emissions-testing.pdf 4 As LPG was considered outside of the original scope of the (methane) work funded by DfT, funding for testing of this technology was provided directly by the technology supplier.

3
however, evidence began to emerge from stakeholders consulted and other sources that emissions of nitrous oxide, which are currently unregulated in Europe and unmeasured in vehicle certification, may not be as uniformly low (and inconsequential to an overall GHG assessment) as previously thought. In particular, the suggestion was that diesel-powered vehicles equipped with Selective Catalytic Reduction (SCR) technology (typical of Euro VI specifications) may be prone to emitting sufficient quantities of nitrous oxide to materially affect their overall GHG impacts. Nitrous oxide has a 100-year GWP of 298 (current GHG reporting guidelines), an order of magnitude greater than methane.
The available evidence, albeit for bus engines operating to bus duty cycles, indicated that nitrous oxide emissions from Euro VI diesel trucks may add of the order of 5 – 10% to their overall GHG impacts. This has potentially significant implications for freight carbon reduction strategies and greenhouse gas reporting (beyond the scope of this study) but also has the potential to quite significantly increase the relative overall GHG savings available from gas-powered vehicles. Although constrained by available time and budget, a limited programme of further, chassis-dyno testing was commissioned to obtain additional data on the nitrous oxide issue, specifically from commercial vehicles operating to freight-relevant duty cycles.
GHG Results Summary For the dedicated natural gas vehicles, the GHG results are somewhat mixed. When comparing with a substantially higher-powered diesel vehicle (Dedi02), overall savings of 4-8% were measured, but in more like-for-like tests (Dedi01 and Dedi03), the savings were, at best, 5% and, at worst, the dedicated gas vehicle’s emissions were some 15% higher than the diesel comparator. These results suggest that there are quite high efficiency losses under some operating conditions in moving from a compression ignition, conventional diesel engine to a spark-ignition one of similar power output.
None of the dedicated gas vehicles tested were found to emit significant quantities of methane, i.e. there was, for these vehicles, little evidence of any methane slip. The highest levels of methane detected were from the two articulated vehicles when operating under the long haul test cycle, but even under these conditions the quantities involved were of the order of just 0.2 – 0.5 g/km, which on a CO2 equivalence basis only increased the overall GHG emissions by about 1% compared to considering only the CO2 emissions.
For the current-generation dual-fuel vehicles operating on diesel and natural gas, levels of methane slip were found to be substantial under all test cycles (9 – 18 g/km). When considering only tailpipe CO2 emissions, both these retrofit conversions (Dual01 to a Euro VI diesel and Dual02 to a Euro V) showed savings of between 4% and 11%, findings very much in line with those of the Low Carbon Truck Trial. When factoring in the measured methane slip, however, the overall GHG impacts of the dual-fuel vehicles rise by, on average, 26% for the Euro VI conversion and 37% for the older Euro V system, thus turning the CO2 “savings” into overall GHG increases over the diesel-only baselines of around 10 – 35%.
The dual-fuel diesel and LPG retrofit conversion (of a Euro VI diesel tractor unit) also showed quite high levels of hydrocarbon (THC) emissions (1 – 2 g/km). These emissions are presumed unburnt fuel, in this case LPG, not methane, and thus do not contribute to the overall GHG impacts. This system generally achieved modest, but measurable, average GHG savings of 2%.
4
The non-SCR-equipped vehicles tested exhibited low levels of nitrous oxide emissions. For the dedicated gas vehicle, there were no such emissions. For the non-SCR diesel vehicles, N2O emissions of around 1 - 10 mg/km were measured, sufficient to increase the overall GHG impacts of such vehicles by around 0.4 – 0.8%. The two SCR-equipped Euro VI vehicles tested showed higher levels of N2O emissions than the non-SCR versions, at levels high enough to add about 1 – 2% to the overall GHG impacts.
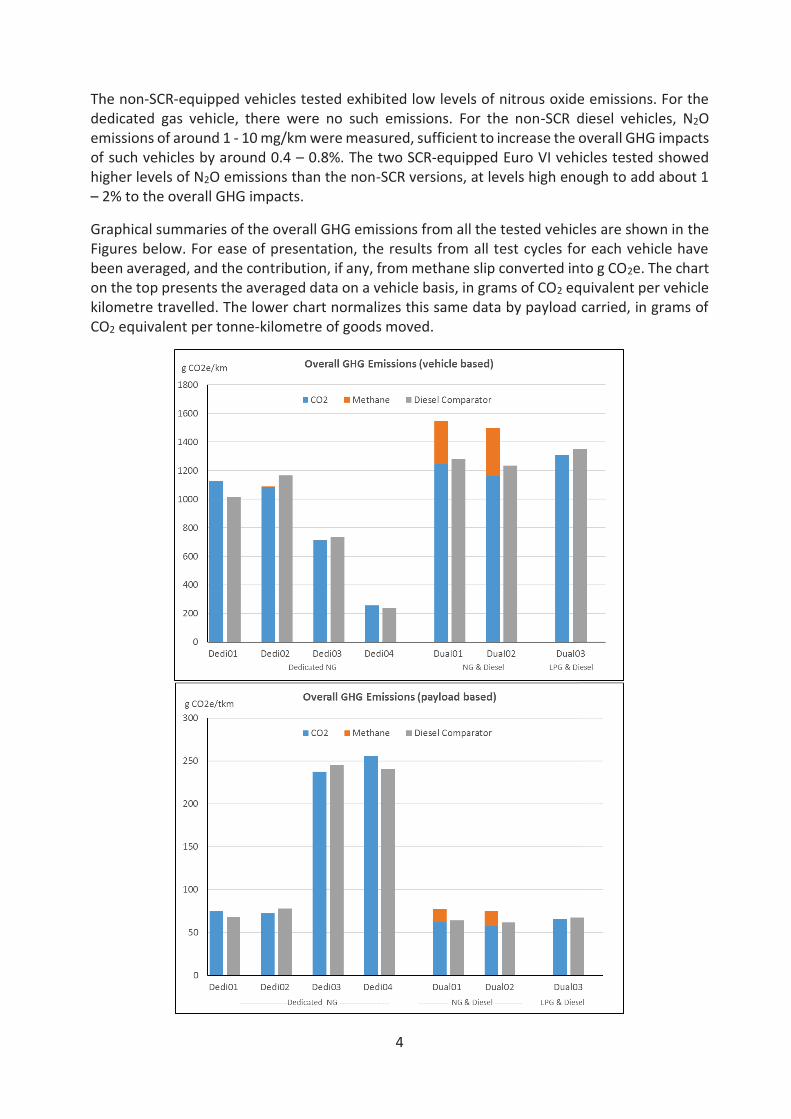
Graphical summaries of the overall GHG emissions from all the tested vehicles are shown in the Figures below. For ease of presentation, the results from all test cycles for each vehicle have been averaged, and the contribution, if any, from methane slip converted into g CO2e. The chart on the top presents the averaged data on a vehicle basis, in grams of CO2 equivalent per vehicle kilometre travelled. The lower chart normalizes this same data by payload carried, in grams of CO2 equivalent per tonne-kilometre of goods moved.

5
NOx and Other Pollutants Results Summary The Euro VI dedicated gas vehicles tested produced, on average, NOx emissions of about 135 mg/km, while the Euro VI diesel comparators produced, on average, about 230 mg/km. Testing for statistical significance, the results are sufficient to conclude that Euro VI dedicated gas vehicles emit lower levels of NOx than their diesel counterparts. The same is true for NO2
emissions with the gas vehicles producing about 20 mg/km on average, less than one-third of the 78 mg/km produced, on average, by the diesel comparators. Emissions of carbon monoxide, however, were typically higher for the dedicated gas vehicles than their diesel equivalents. Emissions of hydro-carbons (THC, unburnt fuel) were also higher.
For the dual fuel, diesel and natural gas conversion of a Euro VI vehicle (Dual01), the NOx emissions were, on average, higher in dual-fuel mode than with the same vehicle operating in diesel-only mode, but the CO levels were lower. For the diesel and LPG conversion of a Euro VI vehicle (Dual03), the NOx emissions were lower than when in diesel-only mode but the CO emissions were higher. These differences, as well as the THC (unburnt gas) emissions, suggest that current applications of retrofit dual-fuel technologies do involve some compromises with regard to the overall ability of the vehicles’ exhaust after-treatment systems to fully mitigate emissions of all the regulated pollutants.
The after-market conversion of a Euro V vehicle (Dual02) produced statistically significantly lower NOx emissions in dual-fuel mode than when operated in diesel-only mode, but emissions of CO were much higher. These data indicate first, that such compromises in overall pollutant emissions control seem to have been necessary at the more basic Euro V levels too and, second, that the move to Euro VI has, for these diesel vehicles, been effective in cutting overall NOx emissions by over 98% from Euro V levels. The test programme suggests that a further move from Euro VI diesel vehicles to Euro VI dedicated gas increases the magnitude of that reduction in NOx emissions to at least 99%.
Conclusions: (Note these are based on a limited programme of tests, on a limited number of vehicles, so care is needed if extrapolating the results to a UK-wide level. The data presented are based on actual tailpipe emissions and take no account of the GHG benefits of bio-fuel options):
Methane & CO2 emissions • The Euro VI dedicated gas vehicles tested through this programme exhibit very low levels of
methane slip, typically adding less than 0.5% to the overall GHG impacts of those vehicles compared with the CO2-only case.
• Current generation (Euro VI) dedicated gas vehicles, running on natural gas (rather than bio-methane), are likely to have broadly similar GHG impacts compared to Euro VI diesel equivalents, to within +/- 10%.
• The only after-market dual fuel system currently available, converting a Euro VI diesel truck to diesel and natural gas operation, exhibited high levels of methane slip (sufficient to increase GHG emissions by c. 20%).
• An after-market dual fuel diesel and LPG system (conversion of Euro VI diesel) exhibited similarly modest GHG benefits to some of the dedicated gas vehicles tested (c. 5% savings), and although some slippage of hydro-carbons was evident, this is unburnt LPG, not methane or any other GHG. The system tested has since undergone a software update that may well reduce the levels of hydro-carbon emissions.
6
• The after-market dual fuel (diesel/CNG) conversion of a Euro V vehicle exhibited high levels of methane slip (sufficient to increase GHG emissions by c. 20-30%).
• Effective catalysis of methane is possible, as is more effective in-cylinder methane combustion. Two current Innovate UK/OLEV-funded projects are developing new retrofit dual-fuel systems. At least one OEM is developing its own dual fuel (diesel-methane) system.
Nitrous Oxide • The research has not yet been able to disprove the hypothesis that Euro VI diesel trucks
typically emit quite high levels of N2O. Further evidence is needed to quantify this.
• The tests show that N2O emissions are very low for the dedicated gas vehicle and the two non-SCR equipped diesel vehicles tested, but higher for the two SCR equipped diesel vehicles tested (both ≤ 7.5t gvw), sufficient to add 1 – 2% to those vehicles’ overall GHG impacts.
• For light duty vehicles, other technologies are known to exist that can deal with NOx emissions without producing significant quantities of N2O, but SCR is the primary technology currently available for heavy-duty diesel vehicles to comply with Euro VI emissions standards.
Air pollutants • Euro VI dedicated gas vehicles emitted lower levels of NOx than their diesel counterparts.
The same is true if only NO2 emissions are considered. Emissions of carbon monoxide and hydro-carbons, however, were typically higher.
• The testing indicates that the transition to Euro VI has, for diesel heavy goods vehicles, been effective in cutting overall NOx emissions by over 98% when compared to Euro V vehicles. A further move from Euro VI diesel vehicles to Euro VI dedicated gas increases that reduction in NOx emissions to at least 99%.
• The dual-fuel diesel and natural gas system retrofitted to a Euro VI diesel vehicle exhibited increases in average NOx emissions in dual-fuel mode compared its diesel-only mode. THC emissions also increased, but CO emissions were lower. The dual fuel diesel and LPG system retrofitted to a Euro VI diesel vehicle produced lower NOx emissions in its dual fuel mode compared to its diesel-only mode, but emissions of other pollutants (CO and THC) increased.
• The duel fuel (diesel and natural gas) system retrofitted to a Euro V vehicle consistently reduced NOx emissions but levels remain at least one order of magnitude higher than all the Euro VI vehicles tested (diesel, gas or duel fuel). Emissions of CO and THC increased.
Recommendations: • This study has shown that dedicated gas commercial vehicles have potential to deliver
significant GHG savings when a non-fossil, bio- or synthetic methane blend is used. DfT should therefore continue to support the development of gas vehicle infrastructure and gas-powered vehicles, particularly dedicated gas, while increasing the supply of low carbon/renewable methane as a sustainable transport fuel.
• This study has highlighted the potential for GHG savings from dual fuel diesel/LPG conversions, and the role of bio-LPG. DfT should also, therefore, consider enhancing its support mechanisms for this sustainable transport fuel.
• DfT should fund further research into N2O emissions from Euro VI diesel vehicles > 7.5t gvw.
• DfT should continue to develop its evidence on GHG and AQ performance of emerging commercial vehicle technologies.

7
1 Introduction
1.1 Background
Freight transport is vital to economic growth, but also has significant environmental impacts.
Heavy goods vehicles (HGVs) are currently estimated to account for around 16% of UK
greenhouse gas (GHG) emissions from road transport and around 21% of road transport NOx
emissions, while making up just 5% of vehicle miles5. The 2008 Climate Change Act set an
ultimate 2050 target of an 80% reduction in GHG emissions from 1990 levels. Meeting this target
will be challenging and the transport sector is under increasing pressure to decarbonize.
In addition, the 2008 ambient air quality directive (2008/50/EC) sets legally binding limits for
concentrations of major pollutants that impact public health such as particulate matter (PM10
and PM2.5) and nitrogen dioxide (NO2). As one of a range of measures to ensure the UK meets
legal limit values for nitrogen dioxide in the UK, some older polluting vehicles, including lorries,
will be discouraged from entering a number of city-centres through the implementation of Clean
Air Zones6. The Government is considering additional measures to meet legal limits for nitrogen
dioxide and will set out further plans in 2017.
Displacing conventional fuels with alternative fuels such as methane has the potential to
significantly reduce GHG emissions from difficult-to-decarbonize sectors such as road freight.
There is considerable interest amongst fleet operators in the use of methane, either in its fossil
fuel form as natural gas or as a biofuel, bio-methane. It attracts lower fuel duties than diesel and
offers the potential for air quality benefits and lower GHG emissions. However, there is currently
a limited evidence base on the cost effectiveness, carbon abatement potential and wider
impacts (e.g. air quality) of displacing diesel with methane in commercial vehicles.
The £11.3 million Low Carbon Truck Trial7 (LCTT), which ran between 2012 and 2016, part-
funded industry consortia to purchase and trial around 370 alternatively-fuelled commercial
vehicles (most of which were dual fuel, diesel/natural gas aftermarket conversions), and to
commission refuelling infrastructure. Nearly all the vehicles trialled were Euro V but the Trial
came at a time when the commercial vehicle market was making the major shift (and
investment) to Euro VI. Euro VI gas-fuelled trucks were unavailable until towards the end of the
trial period and the project was therefore unable to gather comprehensive evidence on the
emissions performance of these vehicles. Evidence to date strongly supports the view that the
5 https://www.gov.uk/government/collections/transport-statistics-great-britain#data-tables - 2014 data, calculated from Tables TSGB0306 (ENV0202), TSGB0308 (ENV0301) and TSGB0701 (TRA0101). 6 https://www.gov.uk/government/uploads/system/uploads/attachment_data/file/486636/aq-plan-2015-overview-document.pdf 7 At the time of drafting, the final report into these Trials was also in draft. The latest published summary is available via https://www.gov.uk/government/uploads/system/uploads/attachment_data/file/448049/low-carbon-truck-trial-2.pdf

8
shift to Euro VI has led to very significant reductions in pollutant emissions, including NOx for
conventional diesel vehicles.
Furthermore, the Trial has indicated, via a limited, non-standardized set of tests by some of the
participating consortia, but not through systematic measurement, that there has been an issue
with emissions of unburnt methane (methane slip) from some of the participating vehicles,
particularly the retrofit dual-fuel diesel/natural gas conversions. Methane is a potent GHG and
if emissions are significant, they could outweigh any reductions in CO2 emissions from using gas
in place of diesel. Measurement of methane emissions was outside the scope of the LCTT and,
more generally, there is currently a lack of real-world data on both methane slip and air quality
pollutant emissions from gas and dual-fuel commercial vehicles.
In the first phase of research into this methane slip issue, a DfT research project in 2014/15
designed and trialled an HGV emissions testing protocol and made recommendations for further
tests8. That research, by Ricardo-AEA9, also explored the causes of methane slip and previous
research into the phenomenon. It showed how well designed and calibrated spark ignition
engines, running on dedicated gas, combined with exhaust after-treatment catalysis can
minimize methane slip. It also highlighted how dual fuel (diesel/gas) engines could be susceptible
to relatively high levels of methane slip.
The Ricardo-AEA report also noted how methane emissions are regulated via the type approval
process for dedicated gas engines, but not for aftermarket conversions to dual-fuel operation.
The report estimated that methane emissions higher than about 2.6 g/km would, for the
converted vehicles typically operating in the LCTT, be sufficient to cancel out the reported
reductions in CO2 emissions. It also highlighted how what little research had already been carried
out internationally into the methane slip issue, had followed a variety of different approaches
and thus there was a need to develop and use a representative, standardized test protocol.
As a second, follow-up phase, the DfT commissioned this HGV emissions testing project with the
Low Carbon Vehicle Partnership (LowCVP) to carry out vehicle testing across a representative
range of available gas-fuelled HGVs to quantify the scale of the methane slip issue and to identify
possible mitigation options. This programme of testing was designed to help DfT to develop its
evidence base, inform future policy on gas vehicles, and allow the results of the Low Carbon
Truck Trial to be set in their proper GHG impacts context.
To complement its LoCITY programme10, Transport for London (TfL) provided additional funds
to test other vehicle technologies (the results of which will be reported separately) and to
8 Provision of HGV Emissions Testing: Final Report. Ricardo-AEA, August 2015. Available via https://www.gov.uk/government/uploads/system/uploads/attachment_data/file/468172/hgv-emissions-testing.pdf 9 Ricardo-AEA have since changed their name to Ricardo – Energy & Environment. Ricardo-AEA is retained for the purposes of this report when referring to this earlier research 10 www.locity.org.uk

9
develop a new city centre delivery test cycle, which was also used for some of the DfT-funded
gas vehicle test programme, where appropriate.
It is important to emphasize that the testing was commissioned to measure tailpipe emissions
of greenhouse gases and air quality pollutants only. Such measurements do not take into
account any bio-content of the fuel, nor any well-to-tank emissions associated with different
fuels and supply chains. The testing programme also excluded consideration of other potential
benefits of gas-powered vehicles such as reduced noise; vehicle manufacturer tests have shown
that natural gas engines are considerable quieter than their diesel equivalents.
1.2 Programme management
The test programme was managed by LowCVP, who were responsible for the testing programme
and for the delivery of this report, as well as all the day-to-day decisions, in conjunction with its
funding partners, including DfT. The testing was carried out under contract to LowCVP by
specialists at Millbrook and Horiba-Mira Ltd, on vehicles and technologies supplied by a wide
range of industry partners, including OEMs, after-market converters and leading freight vehicle
operators. All such participants were also invited to join a programme Steering Group, which
was used to discuss and refine the detailed test plans and methodology as it progressed, as well
as to peer review the emerging findings. In addition, a workshop, hosted by TfL, was held at the
start of the project and provided an opportunity for various stakeholders to help shape and
contribute to the programme to ensure both maximum support and relevance.

10
2 Vehicles and technologies selected for testing The initial DfT-funded research to develop a test protocol, carried out and reported by what was
then Ricardo-AEA, made recommendations about the future use of that protocol:
Test currently available technologies
Focus on future fleet, with an emphasis on Euro VI vehicles
Focus on after-market conversions
Also include OEM offerings, to continue to build the evidence base with them
In addition, it was decided that as DfT also have need for results of the Low Carbon Truck Trial
to be set in their wider GHG context, some testing of vehicles deployed in the Trial would be
desirable. The LCTT involved mainly diesel/gas dual-fuel retrofit technologies applied to what
were originally conventional Euro V diesel vehicles.
The final report from the LCTT was being drafted at the same time as this one, but its provisional
focus was on CO2 emissions only, as calculated from the measured consumption of fuel and
assuming full combustion. Its results do not take account of any emissions of unburnt methane
(methane slip) experienced by the trial trucks, hence the need for this additional work.
Additionally, the LCTT utilized blends of bio-methane and reported overall GHG savings net of
these blends. For the purpose of this HGV emissions testing programme all data has adopted a
“raw tailpipe” assessment of the emissions and no account of bio-methane, bio-diesel or bio-
LPG has been included in the data presented.
With due consideration given to the priorities identified, and the availability of vehicles and
technologies at the time of testing, as well as the funding available, the gas vehicle tests covered
the following vehicles/technologies:
Four dedicated OEM Euro VI natural gas vehicles, including two 40t artics, one 18t rigid and one 7t van
One LCTT dual fuel (DF) natural gas-diesel retrofit conversion to a Euro V 44t artic vehicle
One DF (diesel/natural gas) retrofit conversion to a Euro VI 44t artic vehicle
One DF (diesel/LPG) retrofit conversion to a Euro VI 44t artic vehicle11
To provide proper baseline data, each dedicated gas vehicle was evaluated against an
equivalent, conventional Euro VI diesel truck. Specifications between dedicated gas and
“equivalent” diesel trucks inevitably vary, however, for example in terms of engine power,
torque and/or transmission systems. It was not possible to find exact matches, so the diesel
comparators were chosen to match as closely as possible the dedicated gas vehicles, within the
constraints of time and vehicle availability, which limits the validity of the diesel to dedicated
11 As LPG was considered outside of the original scope of the (methane) work funded by DfT, funding for testing of this technology was provided directly by the technology supplier.

11
gas comparisons. Any differences and their likely significance have been considered and are
discussed in the results section of this report.
The baseline case for the dual fuel vehicles was provided by comparing emissions performance
under dual fuel operating conditions with those when the same vehicle was operating in diesel-
only mode giving, in this case, exact equivalence.
At the time of testing there were no other OEM Euro VI gas-fuelled vehicles available, nor any
other dual fuel conversions to Euro VI base vehicles on the market. However, discussions with
stakeholders identified that there are several products under development, which are relevant
to the future of gas-based propulsion technologies. A discussion of the potential role for near-
to-market technologies and for other technological innovations follows in section 5.2 of this
report.
Figure 1. Example of test process (Control vehicle in foreground, Test vehicle in background)

12
3 Test procedures and cycles
3.1 Test method
The 2015 Ricardo-AEA work to develop a test protocol made the following main
recommendations regarding the test method to be followed:
Track testing was advocated over on-road tests, which were considered too difficult to
achieve repeatability, or chassis dynamometer tests, which are expensive, with limited
facility availability and load capacity and difficult to demonstrate to the satisfaction of the
road freight industry that tests are genuinely representative of real-world conditions.
Driving cycles should reflect real-world operations of the vehicles being tested, and the
cycles for the test vehicles and their diesel/diesel-only comparators should be similar (at
least in terms of average speeds and kinetic intensities).
A combination of urban, rural and motorway driving conditions was likely to be suitable.
PEMS equipment should be used for emissions analysis, with Total Hydrocarbons (THC)
acceptable as a proxy for methane when running on natural gas, if a dedicated methane
sensor was not available.
The programme management team agreed at the outset that the test procedures and three
drive cycles developed originally by LowCVP for its HGV retrofit (CO2 reducing) technology
accreditation scheme, meet all of the above requirements and are thus compliant with Ricardo-
AEA’s recommended protocol. They thus formed the basis for this test programme12. A brief
summary of the test protocol is included as Annex 1 of this report.
As well as using the scheme’s back-to-back vehicle comparison method (testing the diesel
baseline vehicle on one day and its gas-fuelled equivalent on another day), testing also followed
the scheme’s recommended practice of using a control vehicle on each test day to measure, and
allow correction for, if necessary, any changes in ambient conditions affecting fuel consumption.
In accordance with the Ricardo-AEA protocol, the payload for each vehicle tested was generally
set to be somewhere in the range 50 – 70% of the maximum permissible, and was accurately
matched between the gas and diesel comparators to ensure both vehicles were doing equivalent
work. For any given vehicle pair, the payload was identical for all test cycles.
3.2 Instrumentation
In accordance with the protocol recommendations and LowCVP accreditation scheme
procedures, Portable Emissions Monitoring Systems (PEMS) were used. The two test houses
12 The test procedures and data analysis techniques developed for the accreditation scheme are available via www.lowcvp.org.uk
13
used had slightly different PEMS equipment capabilities, but the core emissions monitoring,
common to both, included the following:
Carbon Monoxide, CO
Carbon Dioxide, CO2
Oxides of Nitrogen, NOx
Total Hydrocarbons, THC
3.2.1 Air pollutant emissions
Particulates (particle mass and particle number) were not measured, as current PEMS
technology is not considered sufficiently robust to accurately and reliably measure them,
particularly as in any event such emissions are likely to be very low due to the presence on all
vehicles tested of particulate filters. Such filters have been shown by other research (including
tests by TfL13) to be highly effective at reducing particulates.
Where possible, the NOx measurements were complemented with separate measures of Nitric
Oxide (NO) and Nitrogen Dioxide (NO2), as the fraction emitted as primary NO2 is known to be
of particular concern from an air quality perspective.
As well as the direct measurement of the above tailpipe, pollutant emissions, fuel flow meters
were used to accurately measure diesel fuel consumption. This allowed for the determination of
substitution rates and efficiency losses in the duel fuel vehicles where the PEMS equipment gives
only aggregated CO2 emission levels.
3.2.2 Greenhouse Gas emissions
Apart from CO2 and CH4 (measured using THC as a proxy for unburnt fuel), the other GHG of
significant potential relevance to road transport is Nitrous Oxide (N2O). This was excluded from
the track-based measurement because, and as reported by the 2015 Ricardo-AEA research, it is
not currently possible to measure it accurately using portable emissions measuring equipment.
It was also thought at the outset of the research that N2O was likely to be emitted in very low
(and similar) quantities from both diesel and gas-fuelled vehicles.
During the project, evidence began to emerge from stakeholders consulted and other sources
that emissions of nitrous oxide, which are currently unregulated in Europe and unmeasured in
vehicle certification, may not be as uniformly low (and inconsequential to an overall GHG
assessment) as previously thought. In particular, the suggestion was that diesel-powered
vehicles equipped with Selective Catalytic Reduction (SCR) technology may be prone to emitting
sufficient quantities of nitrous oxide to materially affect their overall GHG impacts.
SCR technology is now routinely fitted to most if not all heavy duty diesel-powered vehicles as
part of the tailpipe NOx reduction strategy and in order to comply with Euro VI requirements. It
13 http://content.tfl.gov.uk/in-service-emissions-performance-of-euro-6vi-vehicles.pdf

14
injects a liquid-reductant agent through a special catalyst into the exhaust stream of a diesel
engine. This agent, a type of urea solution with the trade name AdBlue, contains ammonia (NH3),
and it sets off a chemical reaction that converts nitrogen oxides into nitrogen, water and small
amounts of carbon dioxide (CO2). In sufficient quantities, the mixing of this ammonia with oxides
of nitrogen can also lead to nitrous oxide production. Nitrous Oxide has a 100-year GWP of 298
(current GHG reporting guidelines), an order of magnitude greater than methane14.
The only published source of test data available was from testing of a Euro VI diesel-powered
bus, as part of LowCVP’s Low Emission Bus (LEB) certification scheme15. Under this testing
process (chassis-dyno using a bus duty cycle consisting of rural, Outer London and Inner London
phases), a 19t gross weight, double-deck, Euro VI diesel-hybrid bus, with SCR, was found to emit
between 120 mg/km and 168 mg/km of nitrous oxide, depending on the phase. These figures
increased the overall tailpipe GHG impact by between 4% and 8% (over and above the CO2 only
emissions, there being no methane emissions). The same engine in a single-deck, 19t Euro VI
diesel-hybrid emitted between 89 mg/km and 152 mg/km of nitrous oxide, giving a GHG increase
of between 3% and 8%, again depending on the particular test phase. A similarly sized dedicated
gas bus, under the same test conditions, emitted no nitrous oxide (or methane).
Other (unpublished and confidential) evidence provided by a stakeholder indicated that their
testing (also of bus engines including retrofit systems), had shown nitrous oxide emissions
providing for up to a 10% increase in GHG emissions from SCR-equipped buses. Their testing also
indicates that non-SCR equipped vehicles (Euro V and earlier) emit very low levels of nitrous
oxide (< 10 mg/km).
The available evidence, albeit for bus engines operating to bus duty cycles, thus indicated that
nitrous oxide emissions from Euro VI diesel trucks may add of the order of 5 – 10% to their overall
GHG impacts. This has potentially significant implications for freight carbon reduction strategies
and greenhouse gas reporting, which are beyond the scope of this study, but also has the
potential to quite significantly increase the overall GHG savings available from gas-powered
vehicles.
Although constrained by available time and budget, a limited programme of further testing
(using Millbrook’s chassis dynamometer and the World Harmonized Vehicle Cycle (WHVC) for
the heavy vehicles or the World Light Duty Test Cycle (WLTC) for a small van) was commissioned
to obtain additional data on the nitrous oxide issue, specifically from commercial vehicles
operating to freight-relevant duty cycles.
14 The latest scientific evidence, described in the IPCC 5th Assessment Report (Synthesis Report, 2015) recommends a 100-year GWP of 265 for N2O and 28 for CH4, but these figures have not yet been officially adopted for reporting purposes. 15 http://www.lowcvp.org.uk/initiatives/leb/LEBCertificates.htm

15
3.3 Test cycles
For the larger HGVs in the test programme (18t gross vehicle weight and over), the three test
cycles already developed as part of the LowCVP retrofit technologies accreditation scheme were
used:
long haul (simulating predominantly motorway journeys),
regional delivery (rural journeys)
urban delivery (town centre/urban journeys).
For the smaller vehicles (up to 7.5t) and in order to provide a better match to TfL’s LoCITY work,
the consensus view from stakeholders was to develop a fourth, city-centre delivery cycle to
simulate heavily congested, city delivery operations. Between three and five repeat runs of each
cycle were made for each vehicle tested to ensure appropriate repeatability and statistical
validity of the (averaged) overall results.
A detailed discussion on the development of the original three cycles is beyond the scope of this
report, but in brief they have been designed to follow in principle the long haul, regional delivery
and urban delivery cycles being developed by the European Commission as part of the VECTO
tool16. They use the correlation characteristics of the Kinetic Intensity (KI) cycle parameter,
modified slightly to reflect UK traffic conditions (felt by stakeholders to be generally somewhat
more “intensive”, that is with lower average speeds and more transient conditions associated
with congested roads). The cycles developed, and used for this test programme, thus have
slightly higher KI’s than the current VECTO cycles (as of 2015), as shown in Table 1. The Table
also shows the average speed and kinetic intensity felt by the programme steering group to be
most appropriate for the fourth, city-centre delivery cycle. The fuel consumptions shown in the
Table for the original three cycles are derived from actual testing of such a vehicle on each cycle
during development of the accreditation scheme procedures.
Table 1. Main test cycle parameters
Long Haul Regional
Delivery
Urban
Delivery
City-Centre
Delivery
Average speed (km/h) > 70 50 - 60 30 - 45 15 - 25
Kinetic Intensity (per km)
(equivalent VECTO cycle figure in brackets)
0.14 – 0.20
(0.15)
0.24 – 0.36
(0.26)
0.70 – 1.00
(0.69)
2.60 – 3.00
(N/A)
Fuel consumption of 18t rigid 70% payload
(l/100km) 22 - 27 26 - 31 29 - 35
16 Likely to be used for future measurement, reporting and regulation of heavy duty vehicle CO2 emissions in the EU.

16
4 Test results In total, four dedicated gas vehicles and their four diesel equivalent vehicles, and three dual fuel
aftermarket conversion vehicles have been tested as part of the gas vehicle programme. The
basic split was that the dedicated gas vehicles and their diesel equivalents were tested at
Millbrook, while the dual fuel vehicles were tested by Horiba-Mira Ltd. Table 2 shows the overall
test matrix.
One of the objectives of the test programme was to allow DfT to set the results of the Low
Carbon Truck Trials (LCTT) in their wider GHG context. At the time of drafting, the full results
from the LCTT were unpublished, but a draft of the final report was made available for review
during the drafting of this report.
Table 2. The gas vehicle test matrix Vehicle
Code
Technology Euro
Level
Configuration Payload Tested
Weight
Dedi01 OEM Dedicated Natural Gas (340 hp vs 320 hp comparator) Euro VI 40t, 2+3 artic 15t 30t
Dedi02 OEM Dedicated Natural Gas (330 hp vs 460 hp comparator) Euro VI 40t, 2+3 artic 15t 30t
Dedi03 OEM Dedicated Natural Gas (280 hp vs 250 hp comparator) Euro VI 18t, 2 axle rigid 3t 15t
Dedi04 OEM Dedicated Natural Gas (140 hp vs 170 hp comparator) Euro VI 7t, 2 axle van 1t 3.5t
Dual01 Aftermarket Dual Fuel Conversion (Diesel & Natural Gas) Euro VI 44t, 3+3 artic 20t 36t
Dual02 Aftermarket Dual Fuel Conversion (Diesel & Natural Gas) Euro V 44t, 3+3 artic 20t 34t
Dual03 Aftermarket Dual Fuel Conversion (Diesel & LPG) Euro VI 44t, 3+3 artic 20t 36t
The following sections summarize the results from the testing programme. For brevity, the
results presented from all the runs for each vehicle, on each test cycle, have been averaged. A
more detailed set of results, from all the individual test runs and for all the vehicles tested, is
available from the LowCVP website.
4.1 Greenhouse gas emissions
Table 3 shows the average emissions results, in g/km, for each vehicle, against the appropriate
diesel/diesel-only mode equivalent, for each test cycle. For completeness, the 7t van (Dedi04)
was tested in all four cycles to allow full comparison with the other (heavier) gas vehicles. Its
diesel comparator, however, was not available for long enough to conduct a full programme of
track tests, only the chassis-dyno tests.
For simplicity, for the natural gas vehicles and their diesel comparators, all measured THC is
treated as methane in the calculations of CO2 equivalent emissions, using a 100-year Global
Warming Potential (GWP) for methane of 25, in accordance with current GHG reporting

17
practices17. In reality, the diesel comparator vehicle THC emissions will not be methane and for
absolute precision should be subtracted from the test vehicle measurements so that only the
increase in THC emissions is treated as methane. In practice, however, the THC emissions from
the diesel comparator vehicles were found to be so low that there would be no material
difference between these two approaches.
Table 3. Greenhouse gas results for gas-fuelled vehicles (CO2 & CH4) Vehicle
Code
Cycle Test vehicle emissions (g/km) Diesel comparator emissions (g/km) Overall
GHG
saving CO2 THC CO2e CO2 THC CO2e
Dedi01
UD
RD
LH
1,401
1,011
955
0.03
0.12
0.53
1,402
1,014
968
1,255
949
845
0.01
0.01
0.01
1,255
949
845
-12%
-7%
-15%
Dedi02
UD
RD
LH
1,212
1,048
1,000
0.09
0.06
0.24
1,215
1,049
1,006
1,317
1,134
1,051
0.01
0.00
0.02
1,317
1,134
1,051
8%
7%
4%
Dedi03
UD
RD
LH
806
678
649
0.02
0.02
0.02
807
679
650
845
707
654
0.00
0.00
0.00
845
707
654
5%
4%
1%
Dedi04
(Track)
CC
UD
RD
LH
343
225
236
225
0.03
0.02
0.02
0.01
344
226
237
226
Vehicle not available for track testing
Dedi04*
(Dyno)
CC#
UD
RD
LH
331
250
235
199
0.02
0.01
0.01
0.01
331
250
235
199
294
227
229
213
0.00
0.00
0.00
0.00
299
229
233
217
-11%
-9%
-1%
8%
Dual01
UD
RD
LH
1,678
1,256
806
13.89
12.58
9.62
2,025
1,570
1,047
1,709
1,292
844
0.02
0.01
0.01
1,710
1,292
845
-18%
-22%
-24%
Dual02
UD
RD
LH
1,548
1,168
774
9.36
17.52
13.41
1,782
1,606
1,110
1,616
1,273
820
0.03
0.03
0.02
1,617
1,273
821
-10%
-26%
-35%
Dual03!
UD
RD
LH
1,646
1,403
882
1.39
2.10
1.83
1,646
1,403
882
1,768
1,387
890
0.01
0.01
0.01
1,768
1,387
890
7%
-1%
1%
* CO2e figures for this vehicle and comparator include any measured contributions from N2O. ! THC emissions from Dual03 are assumed to be unburnt LPG, not methane, and thus CO2 and CO2e are identical for this vehicle. # The most kinetically intense phase of the dyno test cycle used had a KI of 1.5, so this figure is used for the CC cycle here
4.1.1 Greenhouse gas emissions, dedicated gas vehicles
For the dedicated natural gas vehicles, the GHG results are somewhat mixed. When comparing
with a substantially higher-powered diesel vehicle (Dedi02), overall savings of 4-8% were
measured, but in more like-for-like tests (Dedi01 and Dedi03), the savings were, at best, 5% and,
at worst, the dedicated gas vehicle’s emissions were some 15% higher than the diesel
comparator. These results suggest that there are quite high efficiency losses under some
17 At the time of writing, the latest scientific evidence, described in the IPCC 5th Assessment Report (Synthesis Report, 2015) recommends a 100-year GWP of 28 for methane, but this figure has not yet been officially adopted for GHG reporting.

18
operating conditions in moving from a compression ignition, conventional diesel engine to a
spark-ignition one of similar power output (a topic discussed in more detail in section 4.3 of this
report).
None of the dedicated gas vehicles tested were found to emit significant quantities of methane,
i.e. there was, for these vehicles, little evidence of any methane slip. The highest levels of
methane detected were from the two articulated vehicles when operating under the long haul
test cycle, but even under these conditions the quantities involved were of the order of just 0.2
– 0.5 g/km, which on a CO2 equivalence basis only increased the overall GHG emissions by about
1% compared to considering only the CO2 emissions. The other dedicated gas vehicles, and these
vehicles in all other test cycles, produced methane in quantities so low as to add less than 0.5%
to their overall GHG impacts.
4.1.2 Greenhouse gas emissions, dual fuel vehicles
For the current generation dual-fuel vehicles operating on diesel and natural gas, levels of
methane slip were found to be substantial under all test cycles (9 – 18 g/km). When considering
only tailpipe CO2 emissions, both these retrofit conversions (Dual01 to a Euro VI diesel and
Dual02 to a Euro V) showed savings of between 4% and 11%, findings very much in line with
those of the Low Carbon Truck Trial. When factoring in the measured methane slip, however,
the overall GHG impacts of the dual-fuel vehicles rise by, on average, 26% for the Euro VI
conversion and 37% for the older Euro V system, thus turning the CO2 “savings” into overall GHG
increases over the diesel-only baselines of around 10 – 35%.
The dual-fuel diesel and LPG retrofit conversion (of a Euro VI diesel tractor unit) also showed
quite high levels of hydrocarbon (THC) emissions (1 – 2 g/km). These emissions are presumed
unburnt fuel, in this case LPG, not methane, and thus do not contribute to the overall GHG
impacts. This system generally achieved modest, but measurable, GHG savings. Across all three
test cycles, the average measured savings were 2.3 %.
4.1.3 Nitrous oxide emissions
Results from the programme of work to measure nitrous oxide emissions are summarized in
Table 4. Where multiple test runs were completed, the results shown are averaged.
These figures confirm that the non SCR-equipped vehicles exhibit low levels of nitrous oxide
emissions. For the dedicated gas vehicle, there were no such emissions, though there were small
quantities of methane slip, in line with the test track measurements described above (0.01 –
0.02 g/km). For the non-SCR diesel vehicles, N2O emissions of around 1 - 10 mg/km were
measured, sufficient to increase the overall GHG impacts of such vehicles by around 0.4 – 0.8%.
The two SCR-equipped vehicles tested show higher levels of N2O emissions than the non-SCR
versions, at levels high enough to add about 1 – 2% to the overall GHG impacts. While this is
encouraging to some extent, in that such impacts are about one quarter of those suggested by

19
the bus evidence described above, it should be noted that this is just two vehicles and their
performance may not be representative of other SCR-equipped vehicles, particularly those with
larger engines or those with differing NOx reduction strategies.
Table 4. Measurements of Nitrous Oxide emissions
Vehicle
(Cycle)
Technology Phase N2O
(mg/km)
CH4
(mg/km)
CO2 (g/km) % increase
in GHG
from N2O
7t Large Van
(WHVC)
Euro VI Dedicated Gas
(CNG)
Urban
Suburban
Motorway
Combined
0
0
0
0
17
7
8
10
328
220
192
236
0%
0%
0%
0%
7t Large Van
(WHVC)
Euro V Diesel (not SCR-
equipped)
Urban
Suburban
Motorway
Combined
4
2
1
3
0
0
0
0
254
174
183
199
0.5%
0.3%
0.2%
0.4%
2t Small Van
(WLTC)
Euro 6 Diesel (not SCR-
equipped)
Low speed
Medium speed
High speed
Extra High speed
Combined
10
7
3
3
5
0
0
0
0
0
182
150
152
222
181
1.6%
1.4%
0.6%
0.4%
0.8%
7.5t Truck
(WHVC)
Euro VI Diesel (with SCR) Urban
Suburban
Motorway
Combined
20
12
35
24
0
0
0
0
605
451
458
495
1.0%
0.8%
2.3%
1.4%
7t Large Van
(WHVC)
Euro VI Diesel (with SCR) Urban
Suburban
Motorway
Combined
17
8
14
14
0
0
0
0
292
207
208
230
1.7%
1.2%
2.0%
1.8%
4.1.4 Overall GHG emissions summary
Graphical summaries of the overall GHG emissions from all the tested vehicles are shown in
Figure 2. For ease of presentation, the results from all test cycles for each vehicle (shown in Table
3) have been averaged, and the contribution, if any, from methane slip converted into g CO2e.
The small contribution from N2O emissions measured during the dyno testing of the diesel
comparator for Dedi04 is included in the results for that vehicle, but not separately identified.
The chart on the top presents the averaged data on a vehicle basis, in grams of CO2 equivalent
per vehicle kilometre travelled. The lower chart normalizes this same data by payload carried, in
grams of CO2 equivalent per tonne-kilometre of goods moved.

20
Figure 2. Overall GHG emissions from tested vehicles

21
4.2 Pollutant emissions
The measured average emissions of Carbon Monoxide (CO), Oxides of Nitrogen (NOx) and,
where available, primary Nitrogen Dioxide (NO2) are shown in Table 5. Aside from particulate
emissions, which for the reasons explained above were not measured during this (track-based)
test programme, the pollutants of greatest current concern are the oxides of Nitrogen (NOx),
and, of those, Nitrogen Dioxide (NO2) especially.
Table 5. Pollutant emission results for gas-fuelled vehicles Vehicle
Code
Cycle Test vehicle emissions (g/km) Diesel comparator emissions (g/km) NOx
saving CO NOx NO2 CO NOx NO2
Dedi01
UD
RD
LH
0.61
0.54
0.85
0.14
0.09
0.04
0.05
0.02
0.02
0.57
0.26
0.13
0.20
0.13
0.11
0.08
0.08
0.02
0.06
0.05
0.08
Dedi02
UD
RD
LH
4.32
2.37
2.35
0.12
0.11
0.07
0.03
0.03
0.03
1.38
1.69
1.15
0.33
0.22
0.22
0.14
0.08
0.15
0.21
0.11
0.15
Dedi03
UD
RD
LH
0.76
0.47
0.45
0.16
0.12
0.21
0.02
0.01
0.02
0.60
0.40
0.33
0.38
0.19
0.14
0.01
0.00
0.02
0.22
0.07
-0.07
Dedi04
(Track)
CC
UD
RD
LH
0.05
0.10
0.08
0.08
0.42
0.38
0.24
0.13
0.02
0.01
0.01
0.00
Vehicle not available for track testing
Dedi04
(Dyno)
CC/UD (Urban)
RD (Suburban)
LH (Motorway)
0.02
0.00
0.01
0.32
0.17
0.07
0.01
0.00
0.00
0.00
0.00
0.00
0.32
0.27
0.20
0.10
0.13
0.15
0.00
0.10
0.13
Dual01
UD
RD
LH
2.02
1.43
0.50
0.21
0.34
1.07
-
-
-
2.41
2.67
1.58
0.22
0.17
0.11
-
-
-
0.01
- 0.17
- 0.96
Dual02
UD
RD
LH
22.57
18.11
12.37
14.87
12.62
8.23
-
-
-
9.54
3.98
1.92
16.86
15.67
10.85
-
-
-
1.99
3.05
2.62
Dual03
UD
RD
LH
6.08
3.98
2.51
0.12
0.03
0.16
-
-
-
4.36
0.63
0.88
0.22
0.04
0.17
-
-
-
0.10
0.01
0.01
4.2.1 Pollutant emissions, dedicated gas vehicles
The Euro VI dedicated gas vehicles tested produced, on average, NOx emissions of about 135
mg/km over the three/four cycles, while the Euro VI diesel comparators produced, on average,
about 230 mg/km. When comparing the in-cycle average NOx emissions, the dedicated gas
vehicles produced lower levels of NOx emissions than the diesel comparators in all but one case
(Dedi03 in the long haul cycle). Testing for statistical significance using the one-tailed, paired t-
test, at the 95% confidence level, these data are sufficient to conclude that Euro VI dedicated
gas vehicles emit lower levels of NOx than their diesel counterparts. The same is true for NO2
emissions with, in this case, the gas vehicles producing about 20 mg/km on average, which is
less than one-third of the 78 mg/km produced, on average, by the diesel comparators.

22
Emissions of carbon monoxide, however, were typically higher for the dedicated gas vehicles
than their diesel equivalents, by approximately 0.5 g/km on average. Emissions of hydro-carbons
(THC, unburnt fuel) were also higher, as discussed in the GHG results section.
Although not measured directly during the track-based programme, the manufacturers of the
four tested dedicated gas vehicles did provide particulate emissions figures based on
homologation approvals for their vehicles, and the diesel equivalents used in the test
programme. These figures confirm the suggestion that particulate emissions are low from both
diesel and dedicated gas vehicles, with the gas vehicles producing around 1 - 3 mg/kWh and the
diesel variants 2 – 6 mg/kWh. The Euro VI limit value is 10 mg/kWh. The dyno testing used to
measure nitrous oxide emissions also recorded particulate mass emissions, with figures of
around 1 mg/km achieved by the dedicated gas vehicle and 1 – 4 mg/km by the Euro V or VI
diesel vehicles tested (combined results, WHVC cycle).
4.2.2 Pollutant emissions, dual fuel vehicles
For the dual fuel, diesel and natural gas conversion of a Euro VI vehicle (Dual01), the NOx
emissions were, on average, greater in dual-fuel mode (540 mg/km on average) than with the
same vehicle operating in diesel-only mode (170 mg/km), but the CO levels were lower. For the
diesel and LPG conversion of a Euro VI vehicle (Dual03), the NOx emissions were lower (100
mg/km on average) than when in diesel-only mode (140 mg/km) but the CO emissions were
higher. These differences, as well as the THC (unburnt gas) emissions described in the GHG
section, suggest that current applications of retrofit dual-fuel technologies do involve some
compromises with regard to the overall ability of the vehicles’ exhaust after-treatment systems
to fully mitigate emissions of all the regulated pollutants.
The after-market conversion of a Euro V vehicle (Dual02) produced statistically significantly
lower NOx emissions in dual-fuel mode (12 g/km on average) than when operated in diesel-only
mode (14.5 g/km), but emissions of CO were much higher. These data indicate first, that such
compromises in overall pollutant emissions control seem to have been necessary at the more
basic Euro V levels too and, second, that the move to Euro VI has, for these diesel vehicles, been
effective in cutting overall NOx emissions by over 98% from Euro V levels. The results described
above suggest that a further move from Euro VI diesel vehicles to Euro VI dedicated gas increases
the magnitude of that reduction in NOx emissions to at least 99%.
4.3 Substitution rates and efficiency losses
The draft report of the LCTT highlights clearly the links between tailpipe CO2 emissions, energy
substitution rates (ESR) and efficiency loss (∆µ). Minimizing efficiency losses and maximizing the
substitution rates provides the greatest savings in CO2 when displacing diesel for natural gas. To
facilitate further comparison between the test data described above and the rates/efficiency
losses discussed in the LCTT report, this section presents the calculated ESR and ∆µ values.
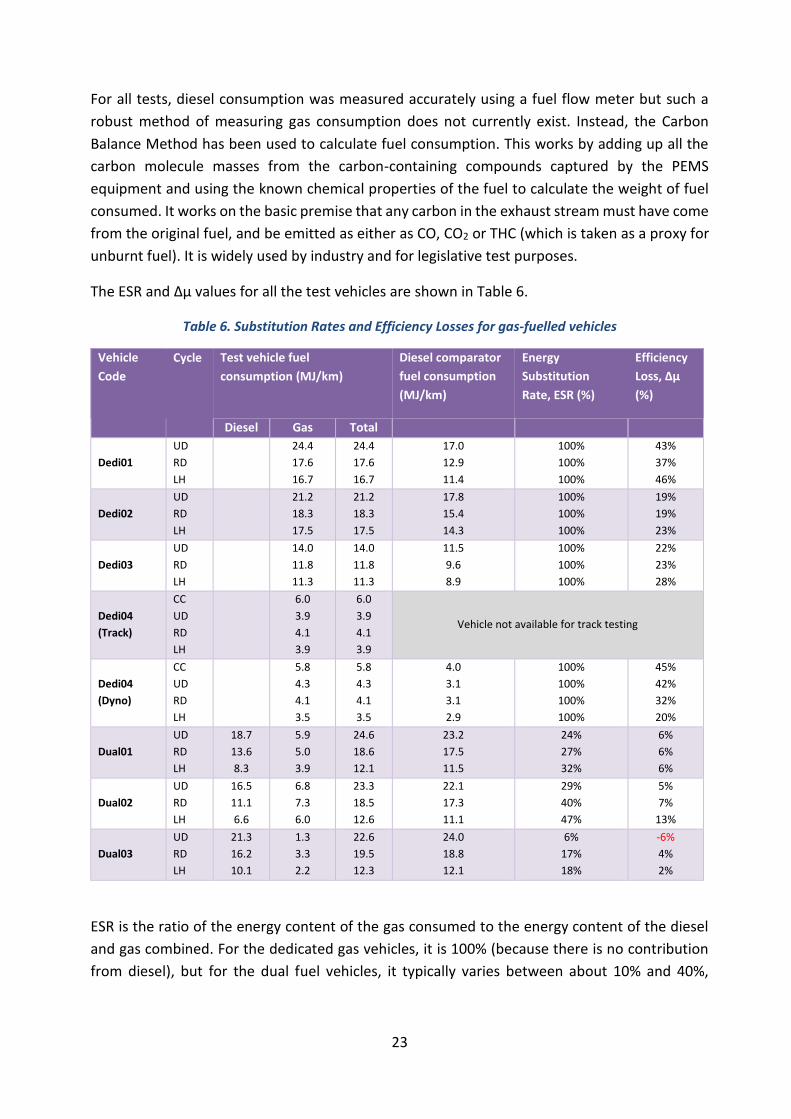
23
For all tests, diesel consumption was measured accurately using a fuel flow meter but such a
robust method of measuring gas consumption does not currently exist. Instead, the Carbon
Balance Method has been used to calculate fuel consumption. This works by adding up all the
carbon molecule masses from the carbon-containing compounds captured by the PEMS
equipment and using the known chemical properties of the fuel to calculate the weight of fuel
consumed. It works on the basic premise that any carbon in the exhaust stream must have come
from the original fuel, and be emitted as either as CO, CO2 or THC (which is taken as a proxy for
unburnt fuel). It is widely used by industry and for legislative test purposes.
The ESR and ∆µ values for all the test vehicles are shown in Table 6.
Table 6. Substitution Rates and Efficiency Losses for gas-fuelled vehicles
Vehicle
Code
Cycle Test vehicle fuel
consumption (MJ/km)
Diesel comparator
fuel consumption
(MJ/km)
Energy
Substitution
Rate, ESR (%)
Efficiency
Loss, ∆µ
(%)
Diesel Gas Total
Dedi01
UD
RD
LH
24.4
17.6
16.7
24.4
17.6
16.7
17.0
12.9
11.4
100%
100%
100%
43%
37%
46%
Dedi02
UD
RD
LH
21.2
18.3
17.5
21.2
18.3
17.5
17.8
15.4
14.3
100%
100%
100%
19%
19%
23%
Dedi03
UD
RD
LH
14.0
11.8
11.3
14.0
11.8
11.3
11.5
9.6
8.9
100%
100%
100%
22%
23%
28%
Dedi04
(Track)
CC
UD
RD
LH
6.0
3.9
4.1
3.9
6.0
3.9
4.1
3.9
Vehicle not available for track testing
Dedi04
(Dyno)
CC
UD
RD
LH
5.8
4.3
4.1
3.5
5.8
4.3
4.1
3.5
4.0
3.1
3.1
2.9
100%
100%
100%
100%
45%
42%
32%
20%
Dual01
UD
RD
LH
18.7
13.6
8.3
5.9
5.0
3.9
24.6
18.6
12.1
23.2
17.5
11.5
24%
27%
32%
6%
6%
6%
Dual02
UD
RD
LH
16.5
11.1
6.6
6.8
7.3
6.0
23.3
18.5
12.6
22.1
17.3
11.1
29%
40%
47%
5%
7%
13%
Dual03
UD
RD
LH
21.3
16.2
10.1
1.3
3.3
2.2
22.6
19.5
12.3
24.0
18.8
12.1
6%
17%
18%
-6%
4%
2%
ESR is the ratio of the energy content of the gas consumed to the energy content of the diesel
and gas combined. For the dedicated gas vehicles, it is 100% (because there is no contribution
from diesel), but for the dual fuel vehicles, it typically varies between about 10% and 40%,

24
depending on the technology and test cycle. The natural gas dual fuel vehicles had ESR values in
the range 24 – 47%, which compares very closely to the range of 25 – 52% found by LCTT.
∆µ is the increase in the energy content of the fuel(s) consumed by the dedicated gas or dual-
fuel vehicles over the diesel comparator case, as a proportion of the diesel comparator case. If
the efficiency loss is zero, the energy content of the gas consumed is exactly the same as the
energy content of the diesel consumed by the comparator vehicle doing the same cycle (and
carrying the same load). A ∆µ of x% implies that the test vehicle consumes fuel with an x% higher
energy content than the diesel vehicle, to do the same work.
The dedicated gas vehicles show efficiency losses of typically in the range of 20 – 45%, which is
very much in line with the LCTT findings for the (one make/model of) dedicated gas truck
involved in those trials (24% efficiency loss against a relatively inefficient, higher-powered diesel
comparator). The natural gas and diesel dual fuel vehicles, with their lower substitution rates
and diesel combustion process, typically show lower efficiency losses; in the range 5 – 15% (also
in agreement with the LCTT findings which estimated an average efficiency loss for such vehicles
of 7% and an overall range of 0 – 25%). The dual fuel LPG-diesel vehicle has still lower
substitution rates and correspondingly lower efficiency losses or, indeed, small efficiency gains,
in the range -6 to +4 %.

25
5 Discussion
5.1 Greenhouse gas emissions
5.1.1 Dedicated gas vehicles
The LCTT involved only six dedicated gas trucks (all Euro VI from the same manufacturer). The
trial recorded an average efficiency loss of 24%, with the dedicated gas vehicles producing about
4% higher Tank-to-Wheel CO2 emissions (calculated on a like-for-like 100% fossil diesel vs natural
gas basis, ignoring any influences from blending with bio-methane). The single diesel comparator
for these vehicles, however, was a Euro V vehicle with a larger, more powerful engine and
different transmission system. This larger engine can be expected to be itself less efficient than
a diesel engine with a lower power rating, so one could reasonably expect that if the comparison
had been between the dedicated gas vehicles and a diesel vehicle with a less powerful engine
(and closer match to the gas engine), the efficiency loss would be somewhat higher than the
24% recorded and the emissions increase would be higher than the 4% recorded.
In the HGV emissions testing programme reported on here, the two comparable dedicated gas
articulated vehicles (Dedi01 and Dedi02) produced broadly similar results, in that on a near like-
for-like comparison (Dedi01, similar engine size and transmission, and both Euro VI), the
efficiency losses (c. 40%) negated any CO2 savings, so overall GHG emissions from the dedicated
gas vehicle were around 10% higher. When comparing with a much larger engine Euro VI diesel
(Dedi02), the smaller (and thus inherently more efficient) dedicated gas engine, despite
efficiency losses of some 20%, was able to produce lower CO2 emissions than the diesel vehicle,
by about 6% overall.
Both the LCTT and this test programme therefore indicate that current generation (Euro VI)
dedicated gas vehicles, running on natural gas (rather than bio-methane), are likely to have
broadly similar GHG impacts compared to Euro VI diesel equivalents, to within +/- 10%.
This test programme has, however, also shown that there is no appreciable methane slip from
current generation dedicated gas vehicles. It has also started to build some evidence regarding
emissions of nitrous oxide, which do not apply to dedicated gas vehicles, but may serve to
increase the overall GHG impacts of Euro VI diesel vehicles by at least 2% and possibly by as
much as 8% in some cases.
The LCTT results also highlight the potential for bio-methane to radically alter the relative GHG
contributions. There, the dedicated gas vehicles were, on average, running with a 15% bio-
methane blend of gas, which was sufficient to turn what would otherwise have been a reported
4% increase in CO2 emissions (compared to the Euro V diesel comparator used) into a 10%
emissions saving. Without any substantial risk of methane slip identified, the test programme
has further confirmed the potential for substitution of natural gas with bio- (or other forms of
non-fossil, renewable) methane to reduce GHG emissions.
26
5.1.2 Dual-fuel vehicles
The draft LCTT report indicates that when running on natural gas (and fossil diesel), the retrofit
dual-fuel conversion systems (almost exclusively applied to Euro V vehicles) achieved tailpipe
CO2 emissions savings of, at best, 6% and, at worst, a CO2 increase of about 5%. The exact savings
or increases were found to depend on the particular technology, the gas substitution rate
achieved and the levels of combustion efficiency loss. As the draft LCTT report acknowledges,
however, these figures do not take into account any other GHG emissions, including those
associated with methane slip.
Our own test programme confirms that methane slip was, and remains, a significant issue for
trucks converted from diesel-only to dual-fuel operation. When considering only CO2 emissions,
both the retrofit conversions (Dual01 to a Euro VI diesel and Dual02 to a Euro V) showed savings
of between 4% and 11%, findings very much in line with those of LCTT and with a high degree of
agreement with the LCTT findings, too, in terms of substitution rates and efficiency losses. When
factoring in the measured methane slip, however, the overall GHG impacts of the dual-fuel
vehicles rise by, on average, 26% for the Euro VI conversion and 37% for the older Euro V system,
thus turning the CO2 “savings” into overall GHG increases over the diesel-only baselines of
around 10 – 35%. At these levels of methane slip, very high blends of bio-methane (>50%) would
be needed to achieve even GHG parity with equivalent diesel vehicles, let alone appreciable GHG
reductions.
Work to develop methane-diesel, dual-fuel technologies with greatly reduced methane slip
levels, both by retrofit companies and by OEMs, is ongoing and discussed in the following section
of this report.
The dual fuel, diesel/LPG vehicle showed consistently low efficiency losses; indeed it achieved
efficiency gains in some tests. Its substitution rates were a little lower than the diesel/natural
gas duel fuel vehicles at around 15 – 20%. With no methane slip issues (although there was
slippage of unburnt LPG), this vehicle returned overall GHG savings of up to 7%, and 2% on
average.
5.2 Future technology developments
The test programme described above was inevitably constrained by the availability of
technologies to test. The field of gas-powered heavy duty vehicle technologies is now a rapidly
evolving one, with many new developments emerging. This section describes the results of some
consultations with industry stakeholders to map out those developments and, in the absence of
hard test data, assess their possible implications for emissions. The technologies are categorized
into three groups: OEM dedicated gas technologies, OEM dual fuel technologies, and retrofit
conversion technologies.

27
5.2.1 OEM dedicated gas technologies
The main developments here are focused on increasing the power outputs of dedicated gas
engines, so that vehicles using those engines can more effectively compete in the market,
particularly for the most common heavy, long haul applications characterized by 3+3 axle
articulated vehicles operating at gross weights of up to 44t and with engines of around 450 hp
maximum power output.
At the outset of the test programme, there were three OEMs active in the dedicated gas market
in the UK, Iveco, Mercedes-Benz Trucks and Scania, but none had dedicated gas engines available
with power outputs greater than approximately 340 hp. In the latter stages of the project (June
2016), Iveco officially launched a new, 400 hp articulated vehicle (Figure 3). Scania offer both
280 hp and 340 hp dedicated gas two and three axle rigid (Figure 4) and 4x2 articulated vehicles.
Both companies are also developing > 400 hp dedicated gas engines, with expectations of market
availability in 2018. At the time of drafting this report, Mercedes-Benz has not publicly
announced any plans to expand its dedicated gas range beyond the 18t and 26t Econic vehicles
already available in the UK direct from its factory.
Figure 3. The latest OEM dedicated gas/methane vehicle, 400 hp (launched June 2016)
The evidence gathered for the test programme, on various, relatively low-power dedicated gas
engines, indicates that their overall GHG emissions performance, when operating on natural gas,
and compared to equivalent fossil-diesel vehicles, is variable - between about 5% lower than
diesel to around 10% greater. Factoring in possible (but as yet uncertain) emissions of nitrous
oxide from the diesel vehicles, these figures may well be reversed (i.e. to between 10% lower
and 5% higher). The main barrier restricting the GHG performance is the efficiency loss when
moving from compression-ignition diesel engines to spark-ignition dedicated gas. While some
marginal improvements in overall efficiency are likely as the new, higher-powered engines come

28
to market and other vehicle systems are optimized for dedicated gas engines, it seems unlikely
that there will be a radical change in that basic issue. Further testing as and when such
technologies become available would be needed to confirm the validity of this premise.
From a policy-making perspective, it seems reasonable to assume, in the absence of any further
evidence to the contrary, that a shift in the market towards dedicated gas vehicles would be
unlikely to dramatically reduce (or increase) overall road freight GHG emissions, if they operate
on pure natural gas or with very low bio-methane blends (c. 5%). If bio-methane availability for
road freight transport increases to allow for 10% blends or even higher (and bio-diesel
blending/availability does not increase proportionately), then such vehicles could start to make
a meaningful contribution to carbon budgets and overall carbon emissions reduction targets,
relative to diesel HGVs.
Figure 4. A currently available OEM dedicated gas rigid vehicle
5.2.2 OEM dual-fuel technologies
The LCTT involved one OEM dual-fuel technology, as developed by Volvo and applied to Euro V
vehicles. The draft LCTT report indicates that this system achieved both low/no efficiency losses
and high gas substitution rates (of almost 50%), and overall CO2 savings of around 10% compared
to an equivalent diesel vehicle (or the same vehicle running in diesel-only mode).
This system was not tested as part of the current programme as it is no longer available, so there
is no direct evidence on any methane slip. As an OEM system, however, one could reasonably
expect little or no methane slip, through a combination of optimized combustion efficiency and
effective methane catalysis. The LCTT data also indicates that there was no efficiency loss with
this system, a further indication of low methane slip – as high methane slip would inevitably

29
mean high efficiency losses, too, through not combusting the methane and thus not extracting
any usable energy out of it as it passes through the engine.
Volvo are now developing a new dual-fuel system, known as High Pressure Direct Injection
(HPDI). Their lead technology partner in this endeavour is Westport. The HPDI system promises
to be a radical departure from the previous technology, in that it will achieve very high gas
substitution rates (over 90%) because only a small amount of diesel fuel will be needed, simply
to provide the “spark” to ignite the gas. By using the inherently more efficient compression-
ignition cycle to combust the diesel, and thus provide the necessary flame to ignite the gas, the
system should also achieve low or zero efficiency losses. By combusting predominantly gas, the
system is also being designed to achieve very low levels of particulate and engine-out NOx
emissions, reducing the need for complex exhaust after-treatment systems, but implying that
the system will not be able to run in “diesel-only” mode. Volvo currently expect the HPDI system
to be available towards the end of 2017.
5.2.3 Retrofit dual-fuel conversions
This test programme has confirmed the indications based on earlier research that retrofit
conversions of Euro V diesel vehicles to dual-fuel, diesel and gas (methane) operation are prone
to high levels of methane slip. Across all the test cycles, these levels have been found to be
sufficiently high to turn what would otherwise be modest CO2 savings (if running on natural gas)
into overall GHG emissions increases of around 30-40%. The test programme has further
indicated that the only currently available conversion of a Euro VI vehicle also has a propensity
to slip methane, typically in slightly lower quantities than the previous versions, but still enough
to cause overall GHG increases of around 20%.
To appeal to environmentally conscientious fleet operators, the retrofit companies recognize
that more needs to be done to address this issue. There are two main strategies to do so;
improving the in-cylinder combustion of methane and raising the effectiveness of exhaust
methane catalyst systems.
As part of the Integrated Delivery Programme (IDP12) funding, Innovate UK and OLEV have
supported two projects to develop improved dual-fuel systems; Heavy Duty Dual Fuel
Demonstrator (HDDFD) and Plasma Removal of Methane from Natural Gas Dual-Fuel Engines
(PROMENADE)18.
The HDDFD project is a £3m, three year programme to “develop new Heavy Duty Dual-Fuel (DF)
combustion and after-treatment technologies to achieve future European emissions compliance
with reduced carbon footprint at acceptable cost. The main deliverable will be a demonstration
of 23% source-to-wheel carbon reduction relative to current diesel truck operation” (according
to the public description of the project). The partners include Clean Air Power Ltd (part of Vayon
18 Details at https://www.gov.uk/government/publications/innovate-uk-funded-projects

30
Group Ltd), Criterion Catalyst Company (part of Shell UK), MAHLE Powertrain Limited, Brunel
University London and Loughborough University, with completion due in 2019.
The PROMENADE project is also due to finish in 2019 and is a £1.8m project to “demonstrate the
use of non-thermal plasma, advanced combustion and control techniques and Additive
Manufacturing to allow dual-fuel (Diesel-Natural Gas) to meet Euro Stage VI emissions standard
while delivering considerable fuel economy benefits over conventional diesel engines”. Its
partners include Johnson Matthey Plc, G-volution Plc, HiETA Technologies and University of
Manchester.
One of the current retrofit technology companies (G-Volution) is planning to launch a new
system for Euro VI vehicles before the end of 2016. This system will use their patented
“Optimiser” technology, which intercepts the fuel injector control signals / fuel demand signals
sent by the original diesel engine Electronic Control Unit (ECU). The control signals are then
modified by the Optimiser to deliver a lower dose of diesel fuel to the engine and simultaneously
dose precisely the amount of secondary fuel (natural gas or LPG) required to retain the original
engine power output. Engine power output when the engine operates in dual-fuel mode is
therefore the same as in diesel-only mode. G-Volution claim that their system allows full engine
ECU functionality to be retained, including the emissions control system, and allowing for
seamless integration with the vehicle’s transmission system, so NOx emissions should be no
worse than the diesel-only condition and fuel economy and drivability are enhanced. By injecting
more precisely-controlled quantities of gas into the combustion chambers, there is also the
potential to reduce the propensity for methane slip, but this should be verified by independent
testing as and when the technology becomes available.
Another retrofitter (Mercury Fuel Systems Ltd), who specialize in diesel-LPG systems, are further
developing their system, particularly its software and engine mapping to reduce NOx emissions
and emissions of unburnt LPG. They are also planning to extend the range of Euro VI makes and
models of vehicles to which their system can be applied, including DAF, Scania and Mercedes-
Benz, and to increase (in early 2017) the availability of bio-LPG to further improve the overall
GHG impacts of their system. The system is relevant to other alternative fuels, including
methane, methanol and hydrogen, and these represent further areas of technology
development.

31
6 Conclusions & Recommendations
6.1 Conclusions
Methane & CO2
• The Euro VI dedicated gas vehicles tested through this programme exhibit very low levels of
methane slip, typically adding less than 0.5% to the overall GHG impacts of those vehicles
compared with the CO2-only case.
• Current generation (Euro VI) dedicated gas vehicles, running on natural gas (rather than bio-
methane), are likely to have broadly similar GHG impacts compared to Euro VI diesel
equivalents, to within +/- 10%.
• The only after-market Dual Fuel system currently available, converting a Euro VI diesel truck
to diesel and natural gas operation, exhibited high levels of methane slip (sufficient to
increase GHG emissions by c. 20%).
• An after-market Dual Fuel diesel and LPG system (conversion of Euro VI diesel) exhibited
similarly modest GHG benefits to some of the dedicated gas vehicles tested (c. 5% savings),
and although some slippage of hydro-carbons was evident, this is unburnt LPG, not methane
or any other GHG. It should be noted that the system tested has since undergone a software
update that may well reduce the levels of hydro-carbon emissions.
• The after-market dual fuel (Diesel/CNG) conversion of a Euro V vehicle exhibited high levels
of methane slip (sufficient to increase GHG emissions by c. 20-30%).
• Stakeholders have indicated that effective catalysis of methane is possible, as is more
effective in-cylinder methane combustion. Two current Innovate UK/OLEV-funded projects
are developing new retrofit dual-fuel systems, finishing in 2019. At least one OEM is
developing its own dual fuel (diesel-methane) system, with availability anticipated towards
the end of 2017.
Nitrous Oxide
• The research has not yet been able to disprove the hypothesis that Euro VI diesel trucks
typically emit quite high levels of N2O. Further evidence is needed to quantify this.
• The tests show that N2O emissions are very low for the dedicated gas vehicle and the two
non-SCR equipped diesel vehicles tested, but higher for the two SCR equipped diesel vehicles
tested (both ≤ 7.5t gvw), sufficient to add 1 – 2% to those vehicles’ overall GHG impacts.
• For light duty vehicles, other technologies are known to exist that can deal with NOx
emissions without producing significant quantities of N2O, but SCR is the primary technology
currently available for heavy-duty diesel vehicles to comply with Euro VI emissions standards.

32
Air pollutants
• Euro VI dedicated gas vehicles emit lower levels of NOx emissions than their diesel
counterparts. The same is true if only NO2 emissions are considered. Emissions of carbon
monoxide and hydro-carbons, however, were typically higher.
• The testing indicates that the transition to Euro VI has, for diesel heavy goods vehicles, been
effective in cutting overall NOx emissions by over 98% when compared to Euro V vehicles. A
further move from Euro VI diesel vehicles to Euro VI dedicated gas increases the magnitude
of that reduction in NOx emissions to at least 99%.
• The dual fuel diesel and natural gas system retrofitted to a Euro VI diesel vehicle exhibited
increases in average NOx emissions in dual-fuel mode compared to the same vehicle in
diesel-only mode, but to values still comparable to Euro VI diesels and very much lower than
Euro V values. THC emissions also increased, but CO emissions were lower. The dual fuel
diesel and LPG system retrofitted to a Euro VI diesel vehicle produced lower NOx emissions
in its dual fuel mode compared to its diesel-only mode, though emissions of other regulated
pollutants (CO and THC) increased.
• The after-market duel fuel system fitted to the Euro V vehicle consistently reduced NOx
emissions by between 2 and 3 g/km but levels remain at least one order of magnitude higher
than all Euro VI vehicles (diesel, gas or duel fuel). Emissions of other regulated pollutants (CO
and THC) increased.
6.2 Recommendations:
• This study has shown that dedicated gas commercial vehicles have potential to deliver
significant GHG savings when a non-fossil, bio- or synthetic methane blend is used. DfT
should therefore continue to support the development of gas vehicle infrastructure and gas-
powered vehicles, particularly dedicated gas, while increasing the supply of low
carbon/renewable methane as a sustainable transport fuel in order to realize these benefits.
• This study has highlighted the potential for GHG savings from dual fuel diesel/LPG
conversions, and the role of bio-LPG. DfT should also, therefore, consider enhancing its
support mechanisms for this sustainable transport fuel.
• DfT should fund further research into N2O emissions from Euro VI diesel vehicles > 7.5t gvw.
• DfT should continue to develop its evidence on GHG and AQ performance of emerging
commercial vehicle technologies.
33
Glossary Euro 1 (2, 3, 4, 5, 6) - certified Euro Emission level (Chassis dyno method for cars and vans)
Euro I (II, III, IV, V, VI) – certified Euro emission level (Engine test method for bus and truck)
AQ – Air Quality
GHG – Greenhouse Gas
NOx - oxides of nitrogen (NO and NO2) (pollutant)
NO – nitric oxide (pollutant)
NO2 - nitrogen dioxide (pollutant)
N2O – nitrous oxide (GHG)
PM - particulate mass (pollutant)
CO – carbon monoxide (pollutant)
CO2 - carbon dioxide (GHG)
CH4 – methane (GHG)
THC – Total Hydrocarbons (pollutant). Emissions measured at the tailpipe assumed to be unburnt fuel, i.e. methane in case of natural gas vehicles.
KI – Kinetic Intensity (the ratio of the characteristic acceleration to the square of the aerodynamic speed, most commonly expressed in units of per km or per mile). A drive cycle parameter found by previous research and LowCVP testing to have a strong linear correlation to vehicle fuel consumption, CO2 and other emissions.
LCTT – Low Carbon Truck Trials
SCR - Selective Catalytic Reduction, a technology applied particularly to Euro VI vehicles to reduce tailpipe emissions of NOx.
DF – Dual Fuel. A vehicle that operates on a mixture of two different fuels, diesel and gas.
NG – Natural Gas, assumed to be made up of 100% methane
CNG - Compressed Natural Gas
LNG – Liquefied Natural Gas
LPG - Liquid Petroleum Gas
PEMS - Portable Emissions Monitoring System
OEM – Original Equipment Manufacturer
WHVC- World Harmonized Heavy Vehicle Test Cycle
WLTC – World Harmonized Light Vehicle Test Cycle
Gvw – Gross vehicle weight
DfT – Department for Transport
OLEV – Office for Low Emission Vehicles
TfL – Transport for London

34
Annex 1: LowCVP Accreditation Scheme Test Procedure For the track-based testing of vehicles, the procedures use essentially standard industry
practices. These involve having two nominally identical vehicles, with one remaining unmodified
and used as a control, e.g. for changes in atmospheric conditions, and the other being the test
vehicle run first, in baseline configuration, unmodified and then again, with the technology
under evaluation being fitted/operational. This ‘back-to-back’ test method leads to four data
sets for each test cycle:
i. Control vehicle – baseline
ii. Control vehicle – testing
iii. Test vehicle – baseline
iv. Test vehicle – testing
One of the wider objectives of the LowCVP scheme is to ensure any testing is affordable to as
wide a part of the technology supplier community as possible. For this reason, testing is limited
to two days, with the “baseline” tests on Day 1, and the “testing” tests on Day 2. Days 1 and 2
would not necessarily follow concurrently, depending, for example, on weather suitability and
time needed to fit the technology.
Where the nature of the aftermarket technology being evaluated prohibits its easy removal, or
to do so would leave the vehicle in such a condition as to be unrepresentative of normal freight
operations, an appropriate comparator vehicle shall be selected and used in place of the Control
vehicle, with as far as reasonably practicable, otherwise identical specifications to the Test
vehicle (e.g. tyres, lubricants, engine power, transmission ratios etc.).
This test procedure does not make specific provisions for testing the effects of auxiliary loads
such as cab air conditioning systems or loading compartment refrigeration units. All such loads
will be turned off during the tests, unless they affect the normal operation of the vehicle.
The intention is to test the vehicle in its normal road-going condition and operating strategy as
far as reasonably practicable, within the constraints of the equipment and duty cycles. Any
aspect of vehicle operation which needs to be modified for the test shall be discussed with the
test centre and recorded in the test report.
The vehicles will be tested over a minimum of three duty cycles, simulating City Centre Delivery,
Urban Delivery, Regional Delivery and Long Haul operations. The required cycle characteristics
are defined.
For the test vehicle, carbon dioxide (CO2) and regulated emissions (Total Hydrocarbons, CO and
NOx) shall be sampled over the entire cycle and the results presented as g/km, using PEMS
equipment attached to the tailpipe.
The Control vehicle shall, as a minimum, be equipped with a fuel-flow meter to accurately determine any changes in fuel economy performance between the baseline and testing days.