email profits down - how to analyze and fix it (jeanne jennings)
TRANSCRIPT
1Plan to Engage Webinar | March 11, 2014
Email Profits Down?How to Analyze Why and
Fix The ProblemMarch 2014
Jeanne S. JenningsVice President, Global Strategic Services

2Plan to Engage Webinar | March 11, 2014
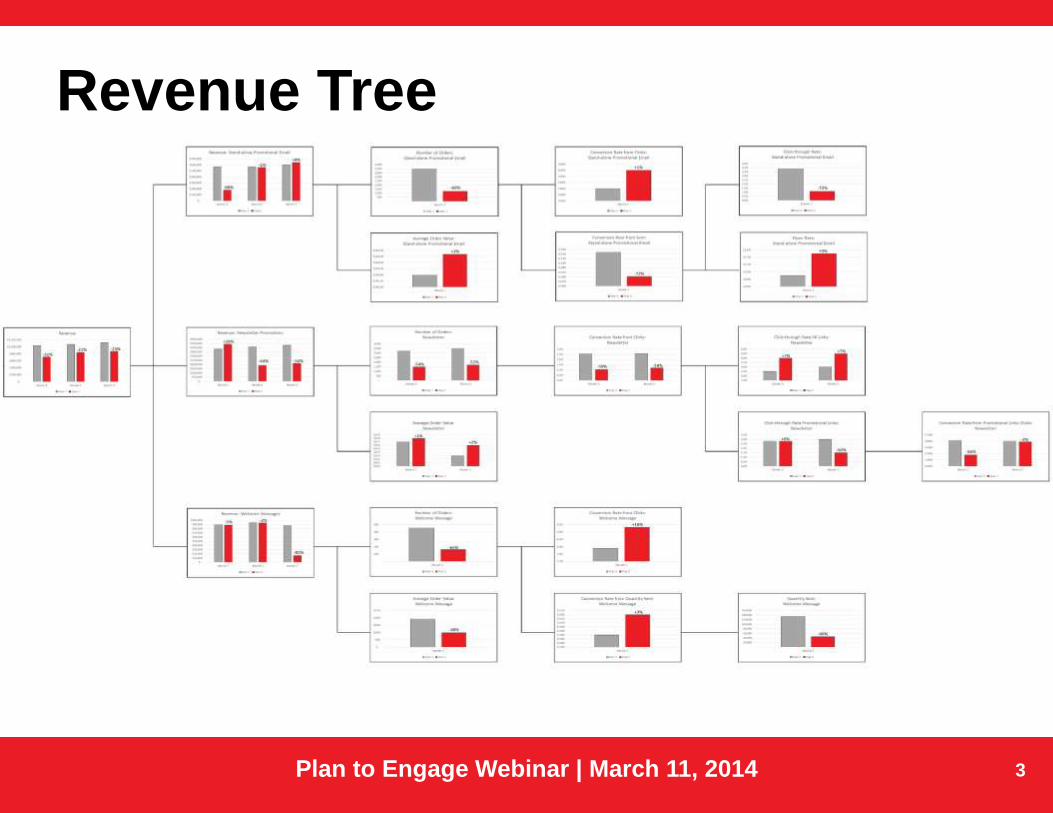
What is a Revenue Tree?
A. A visual way to delve into your email marketing program and see areas of year-over-year change
B. A good way to present data to those who aren’t spreadsheet geeks
C. The topic of today’s Webinar
D. All of the above
3Plan to Engage Webinar | March 11, 2014
Revenue Tree

4Plan to Engage Webinar | March 11, 2014
Where we Start…
5Plan to Engage Webinar | March 11, 2014
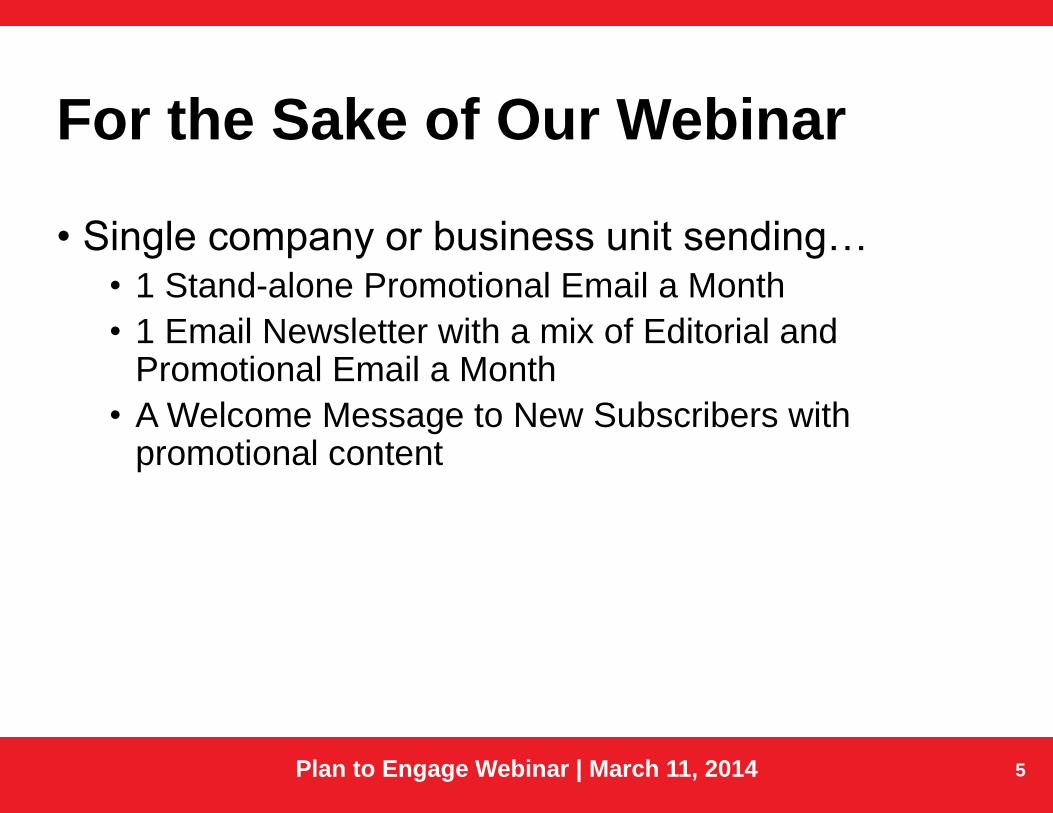
For the Sake of Our Webinar
• Single company or business unit sending…• 1 Stand-alone Promotional Email a Month
• 1 Email Newsletter with a mix of Editorial and Promotional Email a Month
• A Welcome Message to New Subscribers with promotional content

6Plan to Engage Webinar | March 11, 2014
First… Isolate Email Efforts

7Plan to Engage Webinar | March 11, 2014
First… Isolate Email Efforts
This will help you focus
your analysis – and not
spend time where there
aren’t issues.

8Plan to Engage Webinar | March 11, 2014
Stand-alone Promotional EmailEmail Profits Down?How to Analyze Why and Fix The Problem
9Plan to Engage Webinar | March 11, 2014
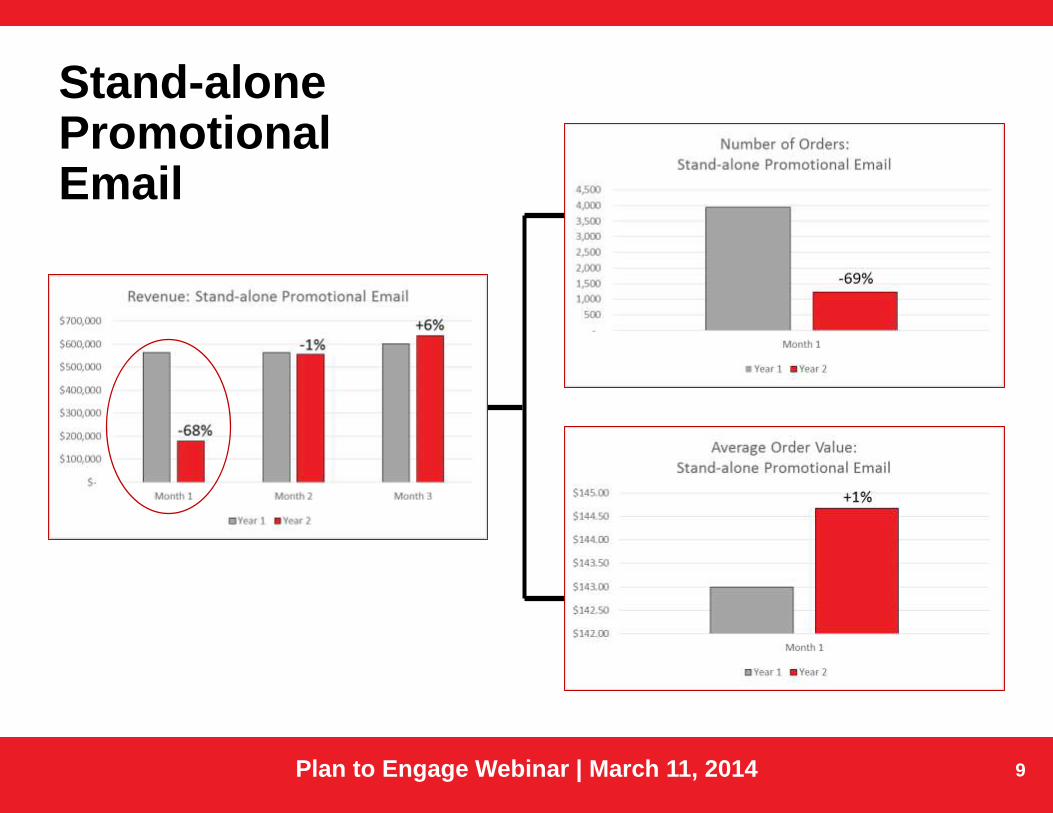
Stand-alone Promotional Email

10Plan to Engage Webinar | March 11, 2014
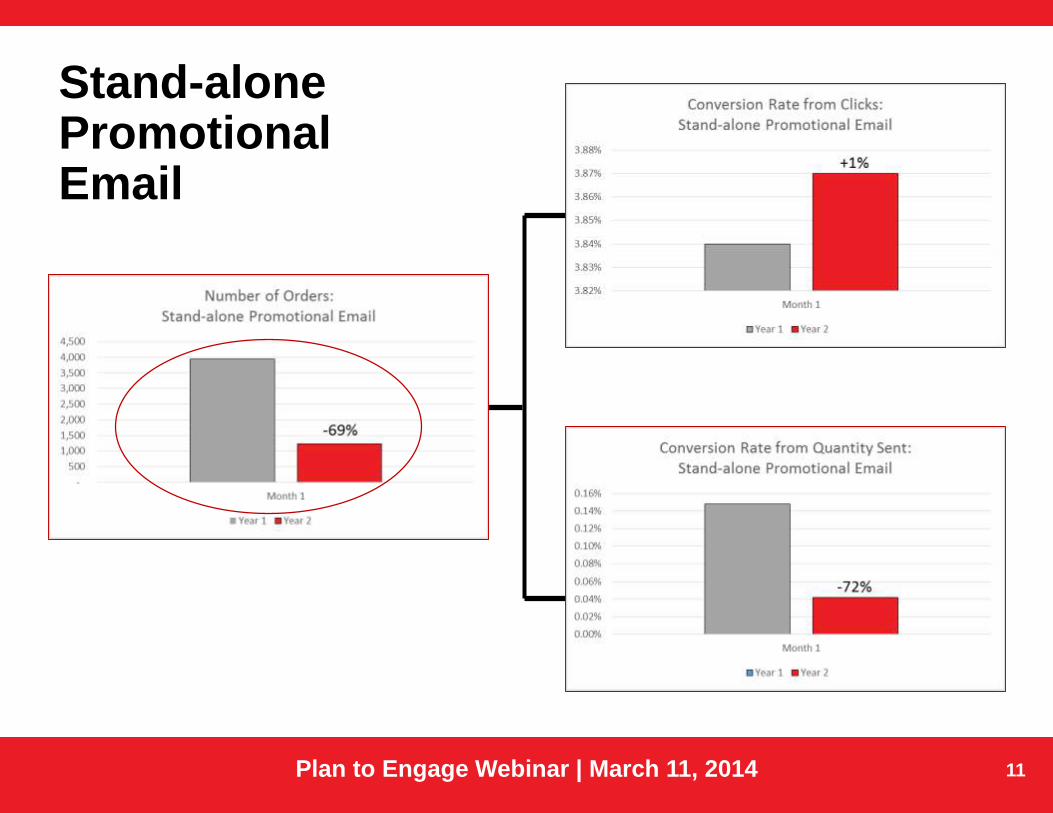
Stand-alone Promotional Email
It’s the number of orders,
not the average order
value, that is to blame for
the decrease
11Plan to Engage Webinar | March 11, 2014
Stand-alone Promotional Email

12Plan to Engage Webinar | March 11, 2014
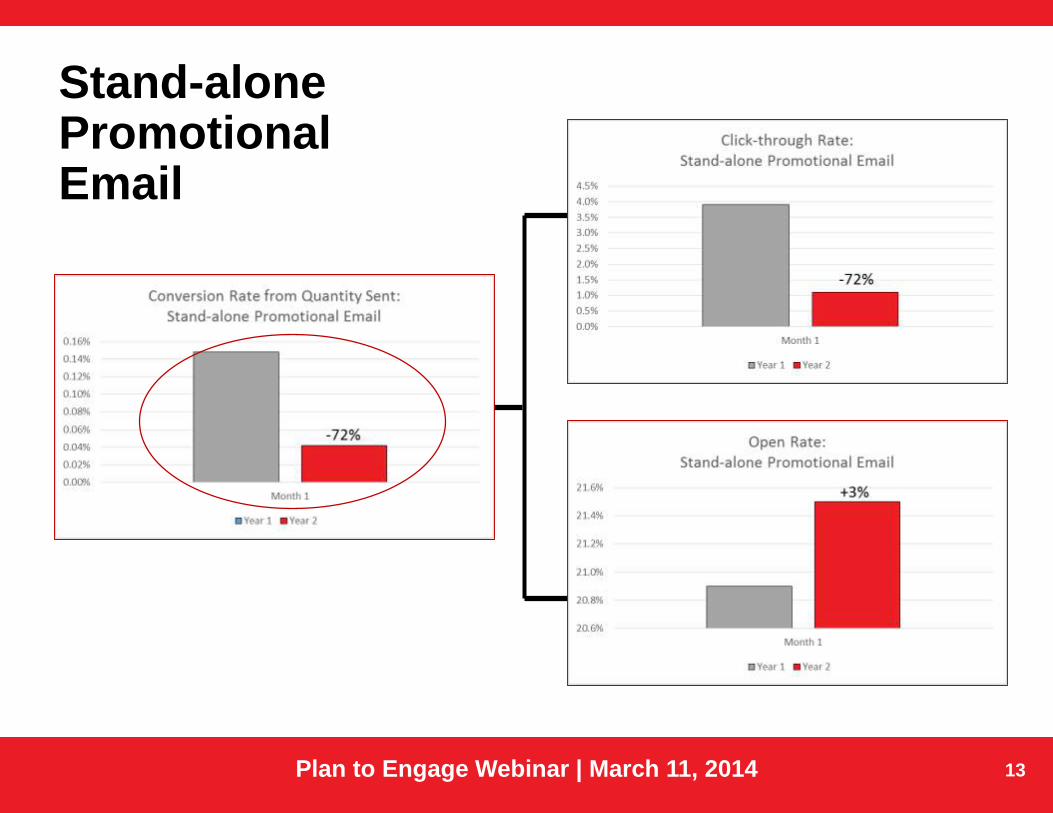
Stand-alone Promotional Email
The clicks are converting
at the same rate… but the
conversion rate from
quantity sent is way down
13Plan to Engage Webinar | March 11, 2014
Stand-alone Promotional Email

14Plan to Engage Webinar | March 11, 2014
Stand-alone Promotional Email
The click-through rate is
down – but the open rate
isn’t.

15Plan to Engage Webinar | March 11, 2014
Next Steps…
The problem lies with the body of the email –people are opening but they aren’t clicking like they did last year
• Continue the Revenue Tree analysis looking at the links in the email
• Look at individual links – compare YOY by placement and call-to-action language
• Also look at the copy around the call-to-action links; what was there last year that’s not here this year
• Test incorporating your learnings on the links into a test for your next send
16Plan to Engage Webinar | March 11, 2014
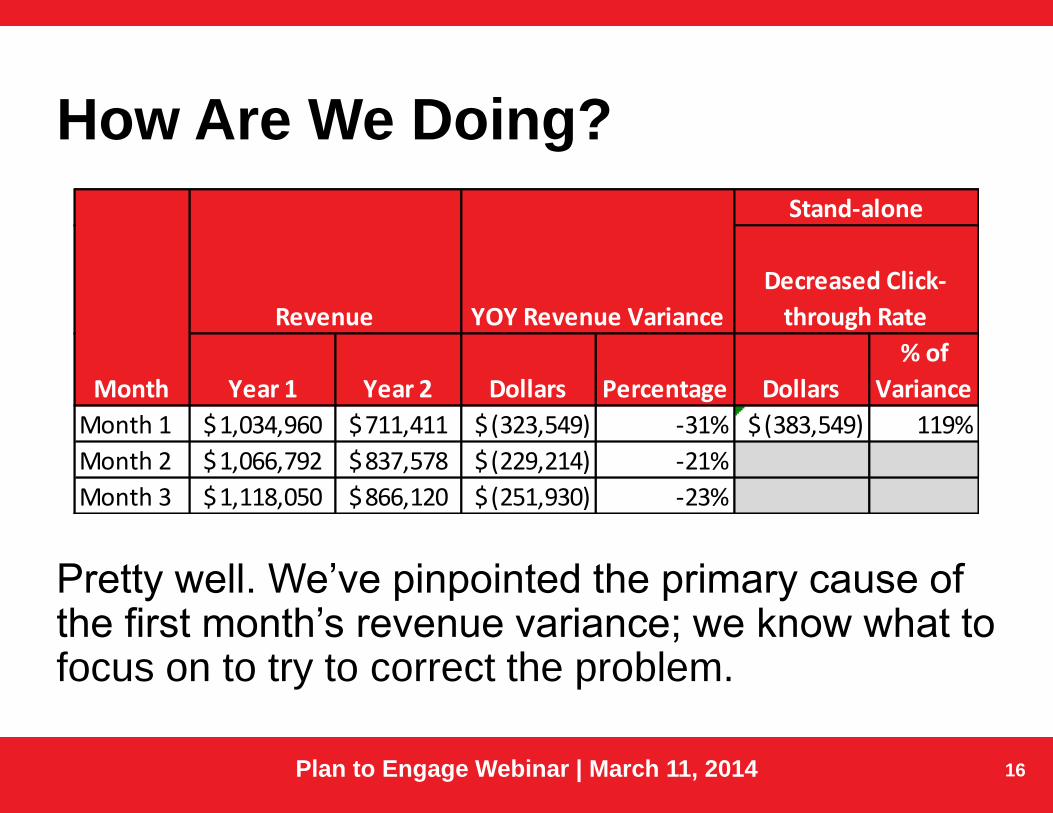
How Are We Doing?
Pretty well. We’ve pinpointed the primary cause of the first month’s revenue variance; we know what to focus on to try to correct the problem.
Year 1 Year 2 Dollars Percentage Dollars
% of
Variance
Month 1 1,034,960$ 711,411$ (323,549)$ -31% (383,549)$ 119%
Month 2 1,066,792$ 837,578$ (229,214)$ -21%
Month 3 1,118,050$ 866,120$ (251,930)$ -23%
YOY Revenue VarianceRevenue
Month
Stand-alone
Decreased Click-
through Rate

17Plan to Engage Webinar | March 11, 2014
Email NewsletterEmail Profits Down?How to Analyze Why and Fix The Problem
18Plan to Engage Webinar | March 11, 2014
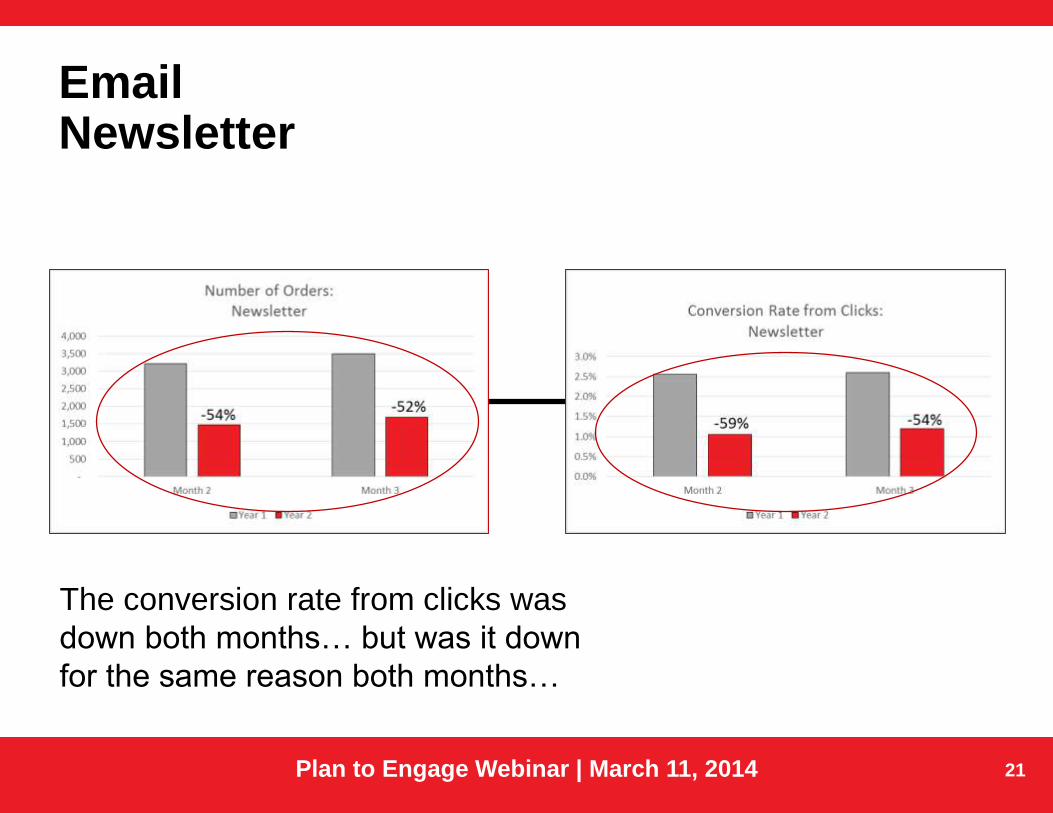
Email Newsletter

19Plan to Engage Webinar | March 11, 2014
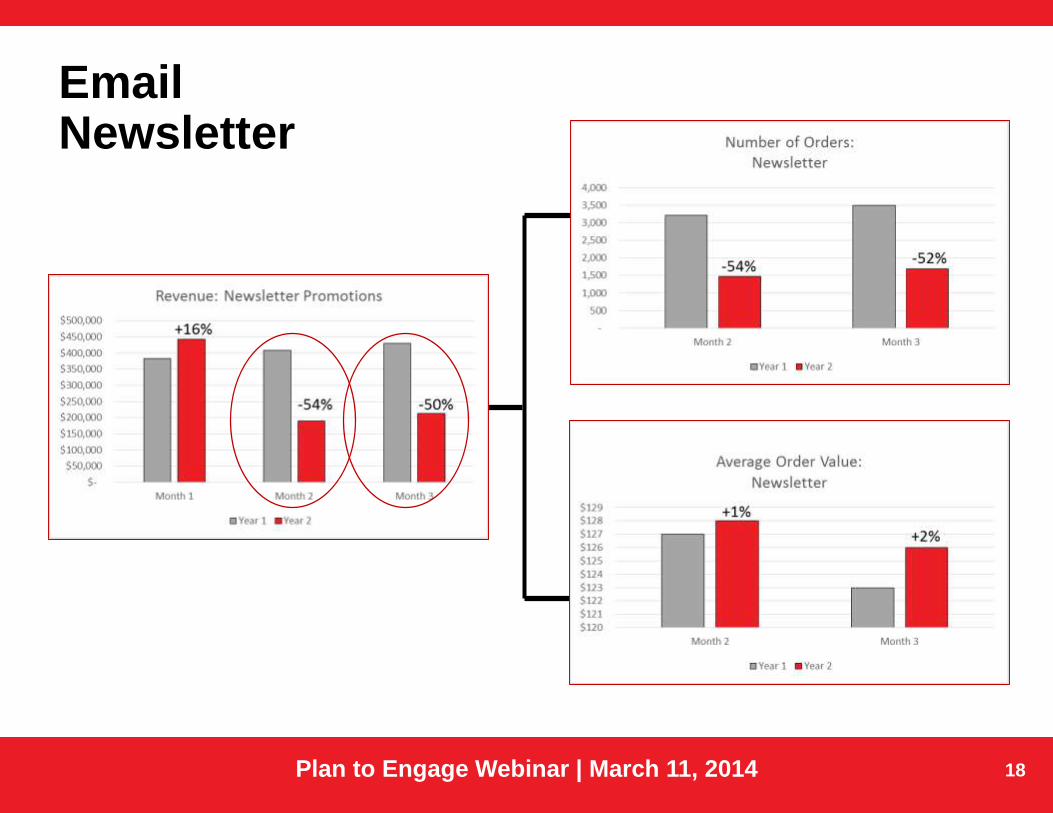
Email Newsletter
Once again, It’s the number
of orders, not the average
order value, that is to blame
for the decrease

20Plan to Engage Webinar | March 11, 2014
Email Newsletter
21Plan to Engage Webinar | March 11, 2014
Email Newsletter
The conversion rate from clicks was
down both months… but was it down
for the same reason both months…
22Plan to Engage Webinar | March 11, 2014
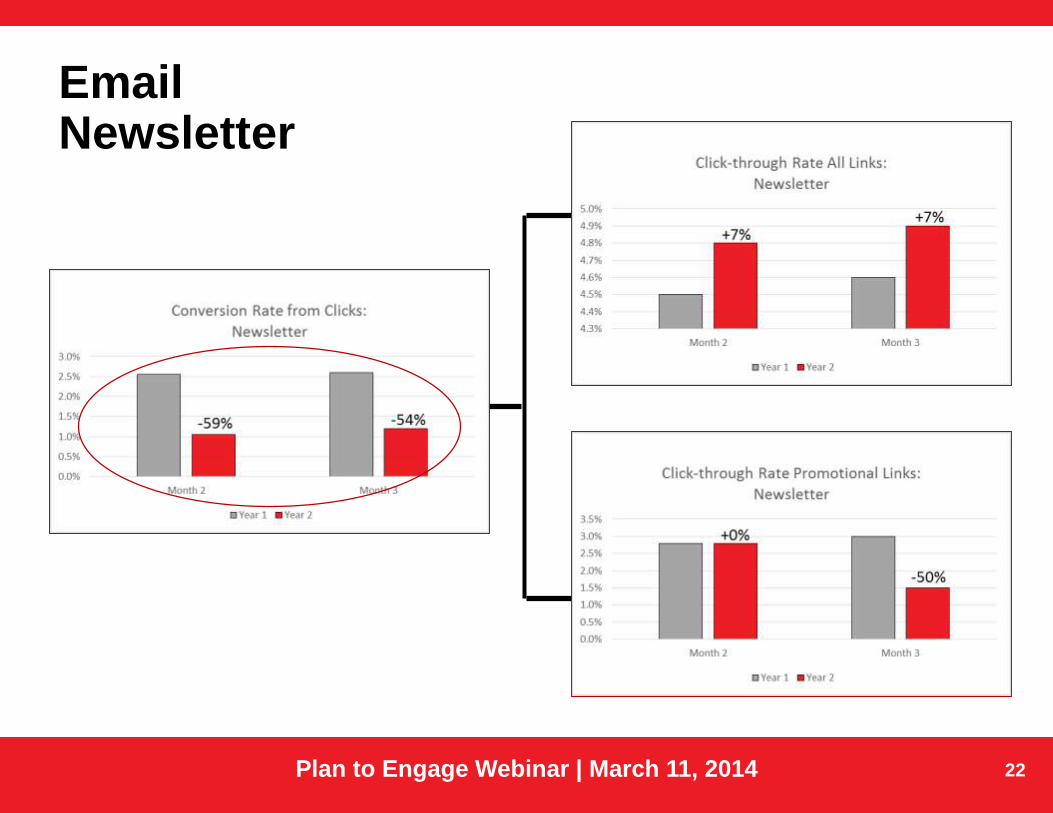
Email Newsletter

23Plan to Engage Webinar | March 11, 2014
Email Newsletter
The click-through rate on
promotional links was down
dramatically in Month 3… time to
dive into a deeper link analysis. But
what about Month 2?

24Plan to Engage Webinar | March 11, 2014
Email Newsletter
In Month 2 the problem didn’t lie with
the email – it was the landing page
that caused a drop in conversions
25Plan to Engage Webinar | March 11, 2014
Next Steps…1. One problem lies with the promotional links in the body of the email – people are opening and clicking on editorial links but they aren’t clicking on the promotional links like they did last year (Month 3)
• Continue the Revenue Tree analysis looking at the promotional links in the email
• Look at individual promotional links – compare YOY by placement and call-to-action language
• Also look at the copy around the promotional call-to-action links; what’s different from last year
• Test incorporating your learnings on the promotional links into a test for your next send

26Plan to Engage Webinar | March 11, 2014
Next Steps…
2. There’s also an issue with the landing page –people are clicking through but they aren’t converting like last year (Month 2)
• Continue the Revenue Tree analysis looking at how visitors are engaging with your landing page
• Where are they going instead of converting? Can you close these exits?
• Are there elements of that landing page that make visitors more likely to convert? If so, make these more prominent
• Test incorporating your learnings in the landing page for your next send
27Plan to Engage Webinar | March 11, 2014
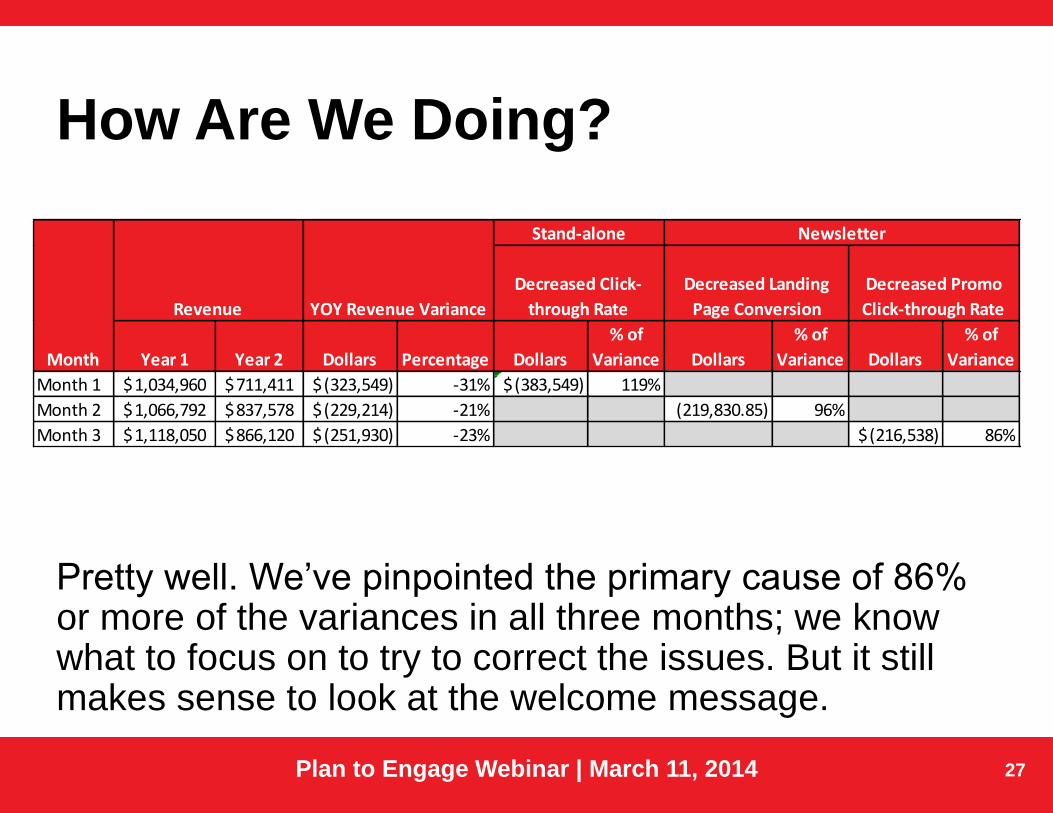
How Are We Doing?
Pretty well. We’ve pinpointed the primary cause of 86% or more of the variances in all three months; we know what to focus on to try to correct the issues. But it still makes sense to look at the welcome message.
Year 1 Year 2 Dollars Percentage Dollars
% of
Variance Dollars
% of
Variance Dollars
% of
Variance
Month 1 1,034,960$ 711,411$ (323,549)$ -31% (383,549)$ 119%
Month 2 1,066,792$ 837,578$ (229,214)$ -21% (219,830.85) 96%
Month 3 1,118,050$ 866,120$ (251,930)$ -23% (216,538)$ 86%
YOY Revenue VarianceRevenue
Month
Stand-alone
Decreased Click-
through Rate
Newsletter
Decreased Landing
Page Conversion
Decreased Promo
Click-through Rate

28Plan to Engage Webinar | March 11, 2014
Welcome MessageEmail Profits Down?How to Analyze Why and Fix The Problem
29Plan to Engage Webinar | March 11, 2014
Welcome Message

30Plan to Engage Webinar | March 11, 2014
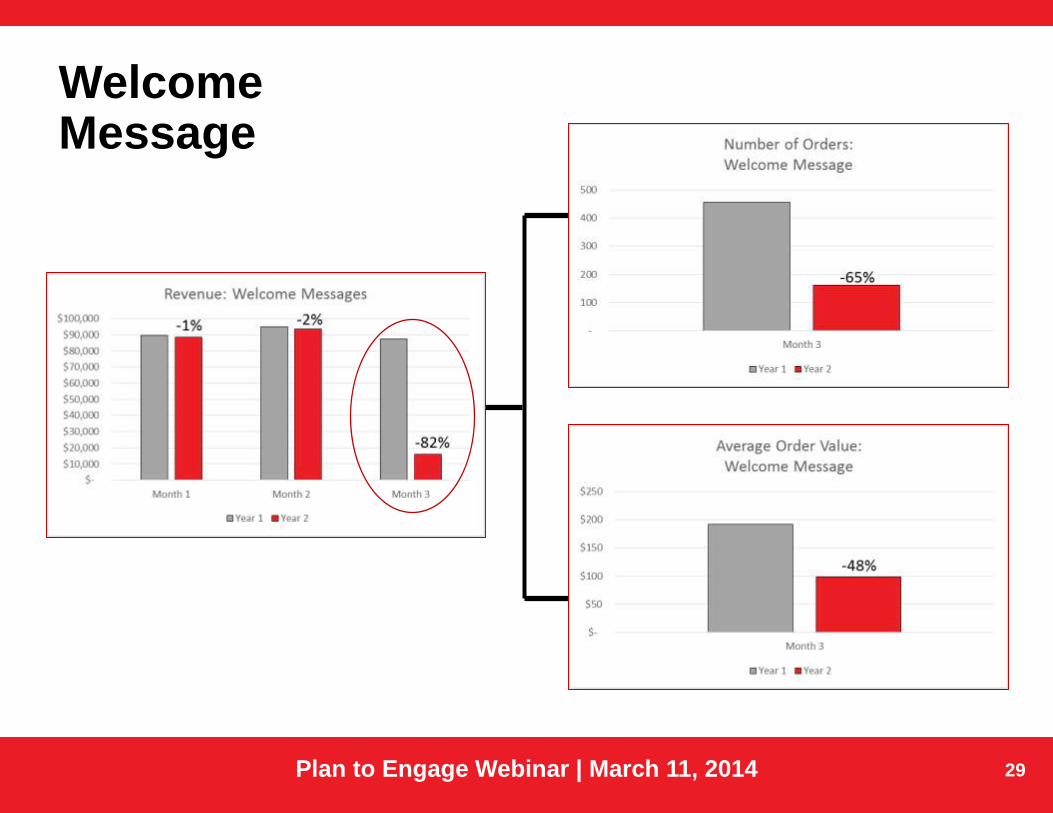
Welcome Message
Both the number of orders and
the average order value
decreased in Month 3; so we
know we have to look into AOV…
but what else?
31Plan to Engage Webinar | March 11, 2014
Welcome Message

32Plan to Engage Webinar | March 11, 2014
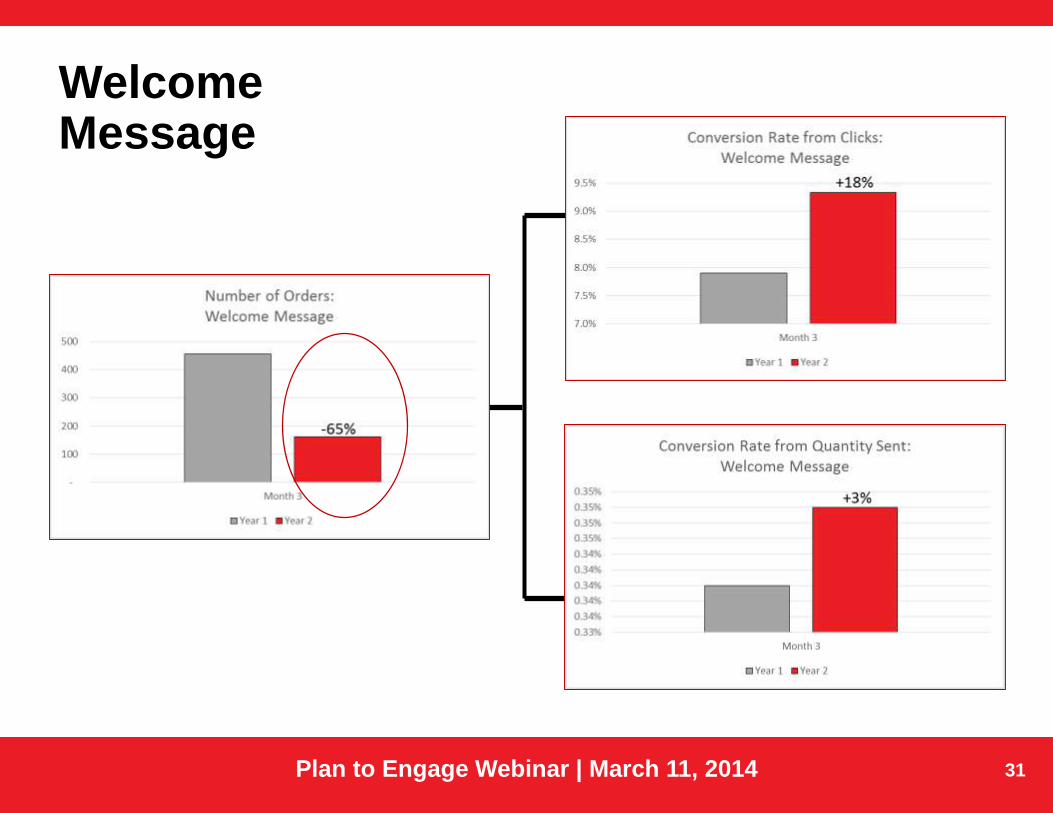
Welcome Message
Neither of the conversion rates
are down, in fact they’re up from
last year…what else should we
look at?
33Plan to Engage Webinar | March 11, 2014
Welcome Message
34Plan to Engage Webinar | March 11, 2014
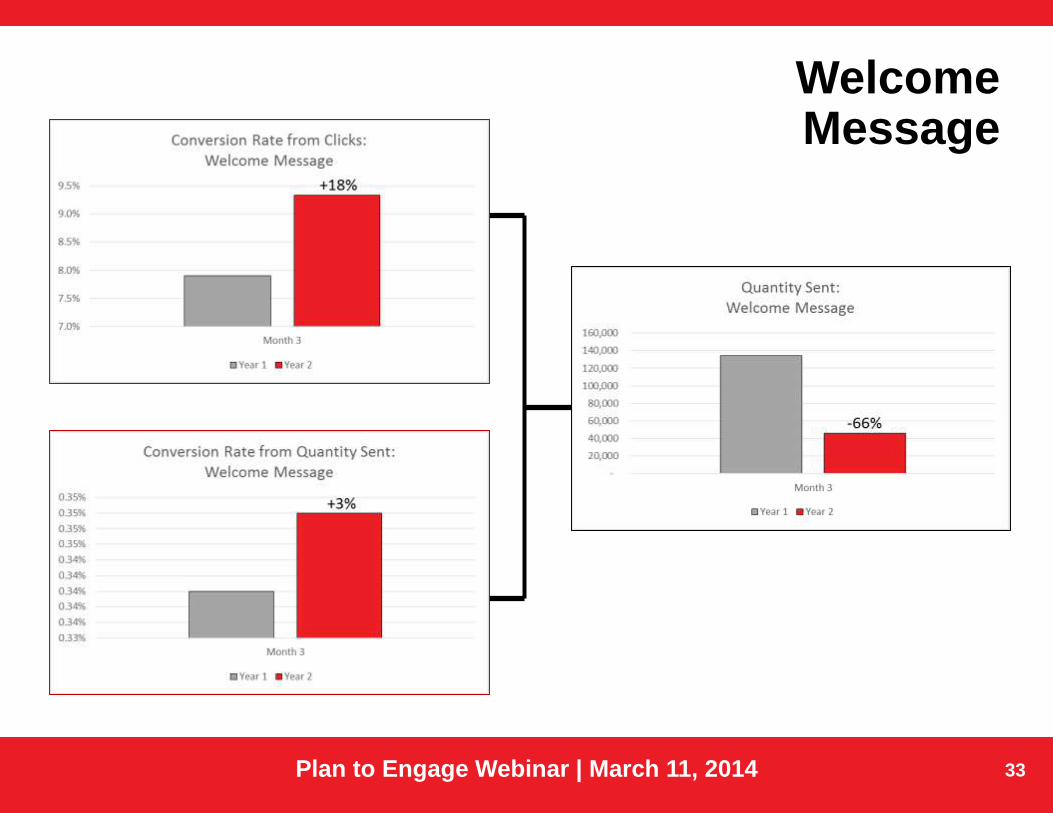
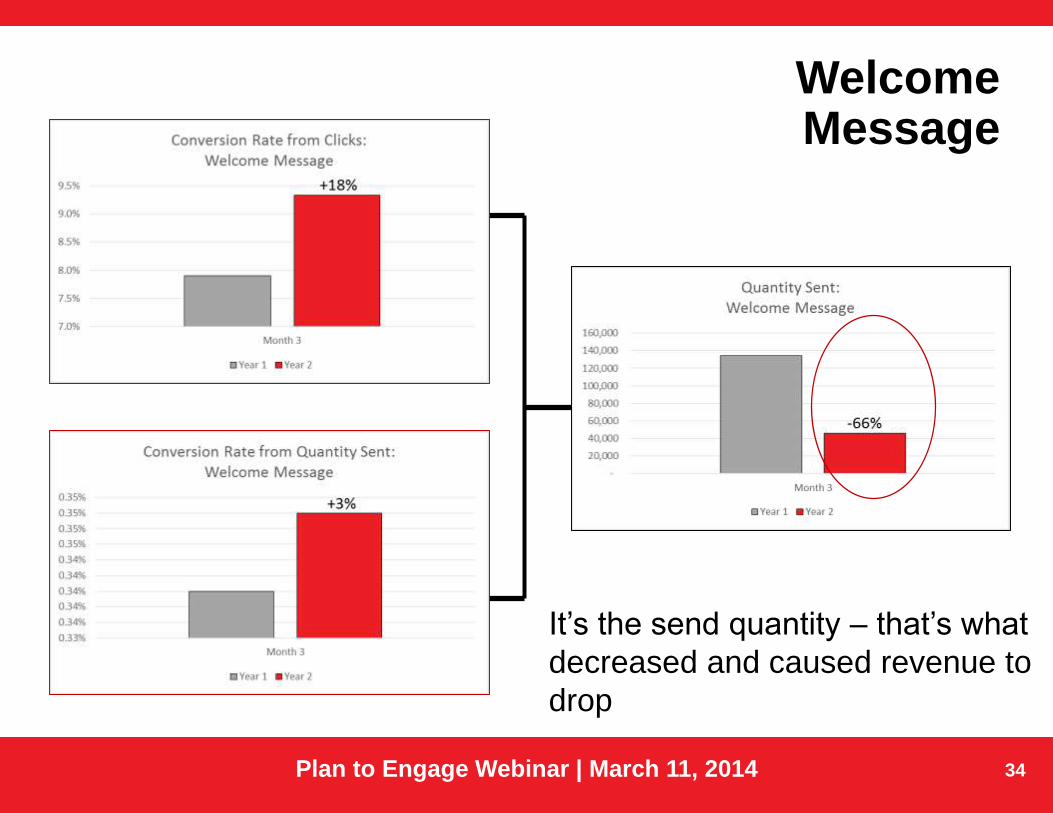
It’s the send quantity – that’s what
decreased and caused revenue to
drop
Welcome Message
35Plan to Engage Webinar | March 11, 2014
Next Steps…
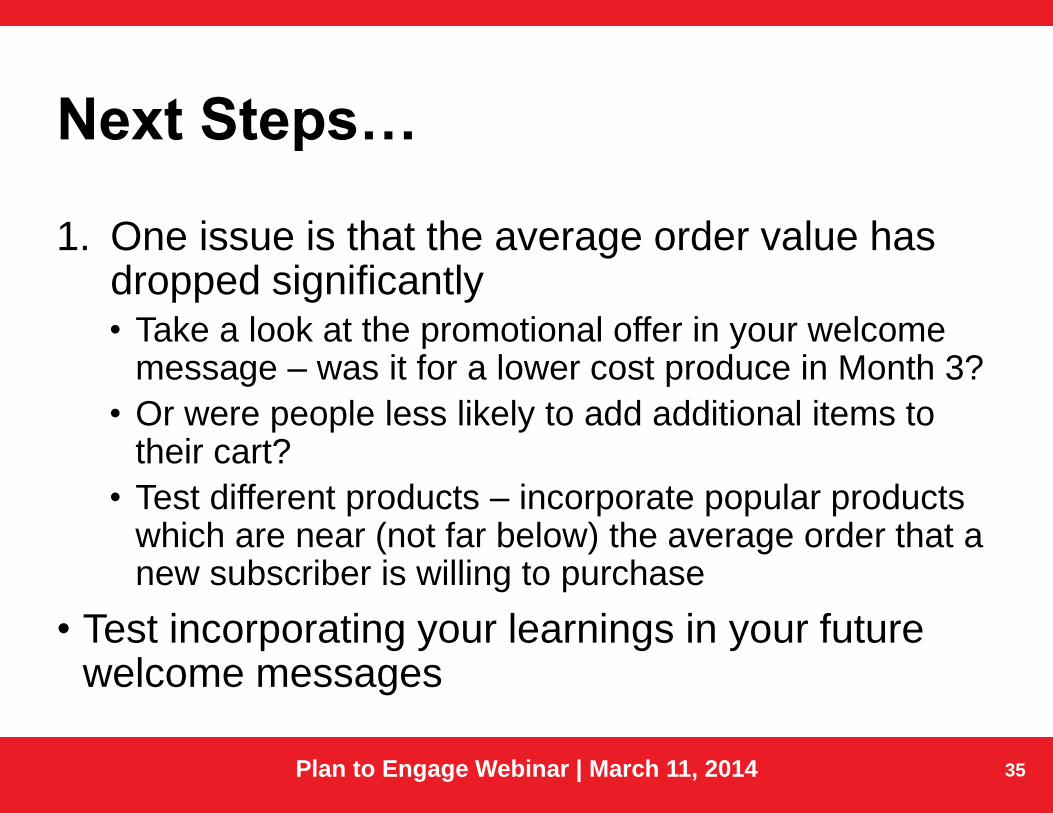
1. One issue is that the average order value has dropped significantly• Take a look at the promotional offer in your welcome
message – was it for a lower cost produce in Month 3?
• Or were people less likely to add additional items to their cart?
• Test different products – incorporate popular products which are near (not far below) the average order that a new subscriber is willing to purchase
• Test incorporating your learnings in your future welcome messages
36Plan to Engage Webinar | March 11, 2014
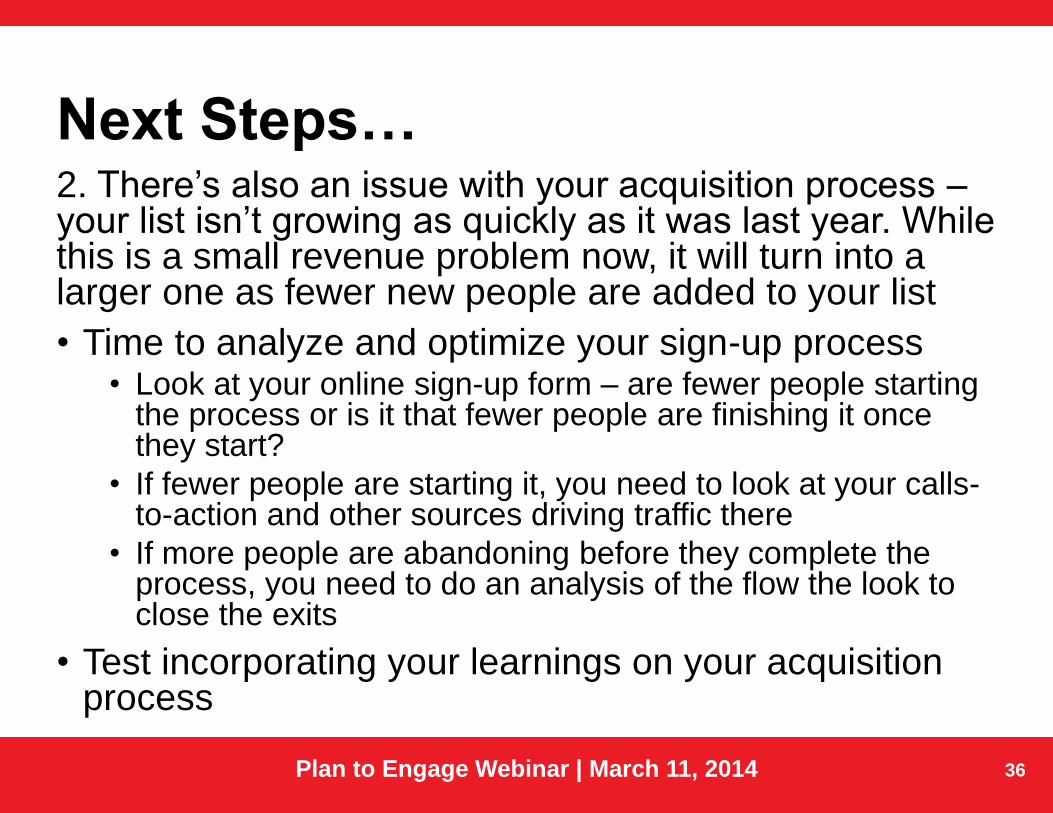
Next Steps…2. There’s also an issue with your acquisition process –your list isn’t growing as quickly as it was last year. While this is a small revenue problem now, it will turn into a larger one as fewer new people are added to your list
• Time to analyze and optimize your sign-up process• Look at your online sign-up form – are fewer people starting
the process or is it that fewer people are finishing it once they start?
• If fewer people are starting it, you need to look at your calls-to-action and other sources driving traffic there
• If more people are abandoning before they complete the process, you need to do an analysis of the flow the look to close the exits
• Test incorporating your learnings on your acquisition process
37Plan to Engage Webinar | March 11, 2014
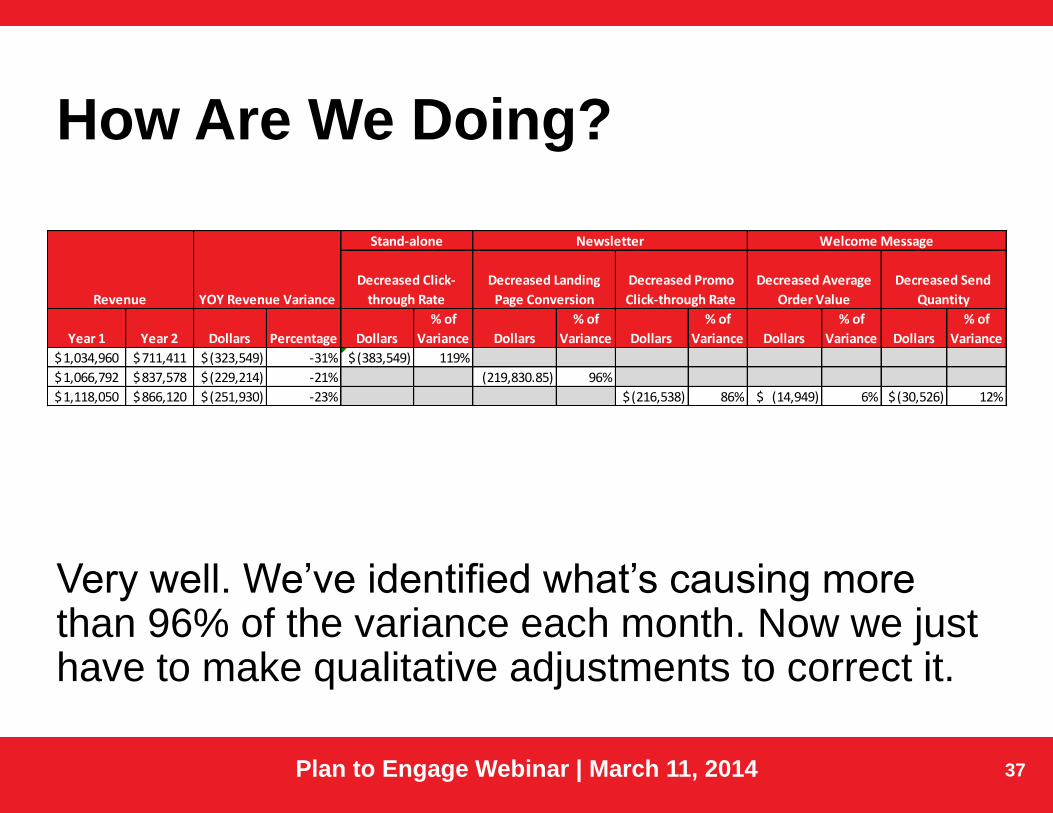
How Are We Doing?
Very well. We’ve identified what’s causing more than 96% of the variance each month. Now we just have to make qualitative adjustments to correct it.
Year 1 Year 2 Dollars Percentage Dollars
% of
Variance Dollars
% of
Variance Dollars
% of
Variance Dollars
% of
Variance Dollars
% of
Variance
1,034,960$ 711,411$ (323,549)$ -31% (383,549)$ 119%
1,066,792$ 837,578$ (229,214)$ -21% (219,830.85) 96%
1,118,050$ 866,120$ (251,930)$ -23% (216,538)$ 86% (14,949)$ 6% (30,526)$ 12%
YOY Revenue VarianceRevenue
Stand-alone
Decreased Click-
through Rate
Newsletter
Decreased Landing
Page Conversion
Decreased Promo
Click-through Rate
Decreased Average
Order Value
Welcome Message
Decreased Send
Quantity
38Plan to Engage Webinar | March 11, 2014
Now the DataEmail Profits Down?How to Analyze Why and Fix The Problem

39Plan to Engage Webinar | March 11, 2014
Where You Usually Start
Total
Quantity
Sent Orders Revenue
Average
Order
Revenue
Variance ($)
Revenue
Variance (%)
Month 1 5,550,185 7,451 1,034,960$ 139$
Month 2 5,744,580 7,713 1,066,792$ 138$
Month 3 5,925,637 8,272 1,118,050$ 135$
Month 1 6,062,292 5,238 711,411$ 136$ (323,549.00) -31%
Month 2 6,180,595 5,811 837,578$ 144$ (229,214.12) -21%
Month 3 6,138,871 6,246 866,120$ 139$ (251,929.69) -23%
Q1, Year
1
Q1, Year
2
List Size
Beginning List Size End
Average List
Size
List Growth
% List Growth
List Attrition
% List Attrition
Month 1 2,654,321 2,757,840 2,706,080 5.2% 138,024.69 -1.3% (34,506.17)
Month 2 2,757,840 2,851,606 2,804,723 4.9% 135,134.14 -1.5% (41,367.59)
Month 3 2,851,606 2,940,006 2,895,806 4.7% 134,025.48 -1.6% (45,625.70)
Month 1 2,940,006 3,001,746 2,970,876 4.1% 120,540.24 -2.0% (58,800.12)
Month 2 3,001,746 3,061,781 3,031,763 3.9% 117,068.09 -1.9% (57,033.17)
Month 3 3,061,781 3,031,163 3,046,472 1.5% 45,926.71 -2.5% (76,544.52)
Q1, Year
1
Q1, Year
2

40Plan to Engage Webinar | March 11, 2014
Granular DataStand-alone Promotion
Quantity
Sent
Assumed
Delivered
Rate Open Rate
Click-through
Rate
Click-to-
Open Rate
Click-through
Rate on
Promotions
Click-to-
Open Rate on
Promotions
Conversion
Rate from
Clicks
Conversion
Rate from
Sent
Conversion
Rate from
Promotional
Clicks Orders Revenue Avg Order
Month 1 2,657,531 98.9% 20.9% 3.9% 18.7% 3.9% 18.7% 3.84% 0.15% 3.84% 3,936 562,829$ 143$
Month 2 2,761,050 98.6% 21.5% 3.7% 17.2% 3.7% 17.2% 3.99% 0.15% 3.99% 4,019 562,670$ 140$
Month 3 2,854,816 99.1% 21.1% 3.9% 18.5% 3.9% 18.5% 3.92% 0.15% 3.92% 4,325 601,198$ 139$
Month 1 2,943,216 98.9% 21.5% 1.1% 5.1% 1.1% 5.1% 3.87% 0.04% 3.87% 1,239 179,279$ 145$
Month 2 3,004,956 98.5% 20.9% 3.4% 16.3% 3.4% 16.3% 3.91% 0.13% 3.91% 3,935 554,816$ 141$
Month 3 3,064,991 98.8% 20.2% 3.8% 18.8% 3.8% 18.8% 3.82% 0.14% 3.82% 4,396 637,384$ 145$
Newsletter
Q sent
Assumed
Delivered
Rate Open Rate
Click-through
Rate
Click-to-
Open Rate
Click-through
Rate on
Promotions
Click-to-
Open Rate on
Promotions
Overall
Conversion
Rate from
Clicks
Overall
Conversion
Rate from
Sent
Conversion
Rate from
Promotional
Clicks Orders Revenue Avg Order
Month 1 2,754,630 98.7% 24.9% 4.4% 17.7% 2.9% 11.6% 2.6% 0.11% 3.88% 3,059 382,402$ 125$
Month 2 2,848,396 98.5% 27.5% 4.5% 16.4% 2.8% 10.2% 2.6% 0.11% 4.10% 3,221 409,055$ 127$
Month 3 2,936,796 99.3% 26.6% 4.6% 17.3% 3.0% 11.3% 2.6% 0.12% 3.99% 3,491 429,361$ 123$
Month 1 2,998,536 96.2% 27.9% 4.8% 17.2% 3.1% 11.1% 2.6% 0.12% 4.00% 3,577 443,535$ 124$
Month 2 3,058,571 95.9% 26.6% 4.8% 18.0% 2.8% 10.5% 1.1% 0.05% 1.80% 1,478 189,225$ 128$
Month 3 3,027,953 95.6% 25.6% 4.9% 19.1% 1.5% 5.9% 1.2% 0.06% 3.89% 1,689 212,823$ 126$
Welcome Message
Q sent
Assumed
Delivered
Rate Open Rate
Click-through
Rate
Click-to-
Open Rate
Click-through
Rate on
Promotions
Click-to-
Open Rate on
Promotions
Overall
Conversion
Rate from
Clicks
Conversion
Rate from
Sent
Conversion
Rate from
Promotional
Clicks Orders Revenue Avg Order
Month 1 138,025 93.3% 40.1% 4.3% 10.7% 3.1% 7.7% 8.2% 0.33% 11.41% 455 89,730$ 197$
Month 2 135,134 93.6% 42.0% 4.5% 10.7% 3.3% 7.9% 8.3% 0.35% 11.33% 473 95,067$ 201$
Month 3 134,025 93.5% 41.5% 4.6% 11.1% 3.2% 7.7% 7.9% 0.34% 11.36% 456 87,492$ 192$
Month 1 120,540 93.3% 42.3% 4.2% 9.9% 3.4% 8.0% 8.9% 0.35% 11.03% 422 88,597$ 210$
Month 2 117,068 93.6% 41.2% 4.1% 10.0% 3.2% 7.8% 8.9% 0.34% 11.35% 398 93,537$ 235$
Month 3 45,927 93.8% 41.9% 4.0% 9.5% 3.5% 8.4% 9.3% 0.35% 10.66% 161 15,914$ 99$
Parsing the Revenue Lost in Month 3 by the (a) decrease in send quantity and (b) decrease in average order value
A Month 3 134,025 93.8% 41.9% 4.0% 9.5% 3.5% 8.4% 9.3% 0.35% 10.66% 469 46,440$ 99$
B Month 3 45,927 93.8% 41.9% 4.0% 9.5% 3.5% 8.4% 9.3% 0.35% 10.66% 161 30,863$ 192$
Q1, Year
1
Q1, Year
2
Q1, Year
2
Q1, Year
1
Q1, Year
2
Q1, Year
1
41Plan to Engage Webinar | March 11, 2014
Additional ResourcesEmail Profits Down?How to Analyze Why and Fix The Problem

42Plan to Engage Webinar | March 11, 2014
Additional Email Marketing Resources
Look for Jeanne’s column on email marketing every other Monday
www.ClickZ.com
@JeaJen to follow Jeanne
43Plan to Engage Webinar | March 11, 2014
Additional Email Marketing Resources
The Premier Email Marketing Association, Part of the DMA; Dela and Jeanne usually both speak at their annual conference
www.EmailExperience.org
A Private Community for Email Marketers offering Discussion Lists and Meetups; Look for Jeanne’s monthly posts on the blog
www.OnlyInfluencers.com

44Plan to Engage Webinar | March 11, 2014
Email Profits Down?How to Analyze Why and Fix The
Problem
March 2014
Thanks for attending! Questions?
Jeanne S. JenningsVice President, Global Strategic Services202.365.0423 | [email protected]