em11 - woods hole oceanographic institution
TRANSCRIPT

A MAGNETOTELLURIC INVESTIGATION OF THE SERRADA CANGALHA IMPACT CRATER STRUCTURE, BRAZIL
Adekunle Adepelumi1, Jean. M. Flexor2, Sergio. L. Fontes3, and Pierre A. Schnegg4
Departamento de Geofisica, Observatorio Nacional, Brazil (1,2,3)Institut de Geologie, CH-2007 Neuchatel, Switzerland (4)
AbstractThe Serra da Cangalha impact crater (8o5’S/46o52’W) is the second largest crater in
Brazil with a diameter 13 km estimated from satellite image and ≈ 300 m.y old. It is locatedwithin the intracratonic Parnaiba basin consisting of Paleozoic and Mesozoic (UpperSilurian to Creatceous) sedimentary covers. The primary objectives of the work is to usethe Magnetotelluric method to obtain the structural dispositions and features in, around andbeneath the Serra da Cangalha impact crater; to determine the depth to the basement;delineate the morphology and diameter of the crater. Twenty-five MT data were acquiredusing the Neuchatel University, Switzerland equipment for period ranging between 0.001 to1000 s. The MT sounding stations were distributed radially across the impact structure. Thedata were processed using standard least square technique; tensor decomposition wascarried out using the methodology proposed by McNeiece and Jones (2001); Jones (1988)method was used to correct for static shift observed in some of the data. The geoelectriccharacteristics beneath the impact crater have been studied using the 2D MT modelinginversion algorithm in (WinGlink) along the three radial profiles.
All the twenty-five resistivity curves exhibit a distinct resistivity minimum forperiods ranging 0.1 and 1.0 s and a perfect isotropy of both polarizations indicating one-dimensional characteristics of the subsurface conductivity distribution. However, aroundthe crater center, a strong anisotropic MT response for periods ranging from 0.01 to 0.1swas observed. It probably represent the brecciated, fractured, alterated and shocked zone infilled with non-magnetic materials and fluids. The zones correspond to the distinct centrallow magnetic anomaly of 12—13 km diameter observed at the centre of the crater. Theimpact structure has almost a distinct central low magnetic anomaly of 12—13 km diameterat its center. Such magnetic pattern is typical of a number of other impact structures in theworld and have been related to impact-induced changes in magnetization properties oftarget rocks and the occurrence of impact melts and suevite. A central uplift ofapproximately 600 m is derived for the crater. The depth to basement obtained varies from1.2 – 0.1 Km at the center of the crater to 1.8 – 0.1 Km at the rim. Our study suggests thatthe Serra da Cangalha impact structure corresponds to a complex crater with a centralstructural low (magnetic and resistivity) surrounded by a ring.
Session EM11: Geodynamic Models
EM11-1

ELECTRICAL STRUCTURE OF THE SAN ANDREAS FAULT AT HOLLISTER, CALIFORNIA
Paul A. Bedrosian (Dept. of Earth and Space Sciences, University of Washington, Seattle WA 98195 USA, [email protected])Martyn J. Unsworth (Institute for Geophysical Research, University of Alberta, Edmonton, Alberta)Gary D. Egbert (College of Ocean and Atmospheric Sciences, Corvallis, Oregon)
Individual segments of the San Andreas Fault (SAF) exhibit markedly different patterns of seismicityranging from locked to creeping. The factors controlling such variation are not well understood, butcould include fault geometry, geology, and the presence or absence of fault-zone fluids. Magnetotelluricdata have imaged the electrical structure of the San Andreas Fault zone and surrounding areas in anattempt to understand the distribution and role of fault-zone fluids. Previous surveys have studied thelocked Carrizo segment and the transitional Parkfield segment. This study has been extended to considercreeping segments of the fault south of the San Francisco Bay area. Magnetotelluric data along twoprofiles south of Hollister are presented, near the intersection of the San Andreas and Calaveras faults,with continuous coverage within 1-2km of the faults. Robust time-series processing and a non-linearconjugate gradient algorithm were employed to produce models of the electrical structure of the fault-zone.
The first-order structure imaged include a highly resistive body southwest of the SAF, adjacent to theSAF with a near-vertical contact. This unit is coincident with the Gabilan granites, part of the moreextensive Salinian Block. A broad zone of enhanced conductivity, distributed in discrete shallow pockets,is imaged between the San Andreas and Calaveras Faults. A prominent fault-zone conductor (FZC) ispresent down to at least 8km depth. This zone has a (horizontally-integrated) conductance of 500-800Siemens, similar in magnitude to that observed at Parkfield.
The depth of these conductive zones, combined with the presence of brines in nearby wells, suggest thatsaline fluids are the cause of the enhanced conductivity. Combining the conductivity within the faultzone and nearby salinity measurements, a porosity of 10-35% is required by the MT data, neglecting theeffect of any clay present within the fault zone.
Seismic tomographic studies image a zone of decreased Vp and enhanced Poisson’s ratio coincident withthe imaged zone of high conductivity between the San Andreas and Calaveras fault. Correlation of thesedata sets allow for the accurate delineation of structural features, including the SAF at depth and thecontact between the stratigraphic column and basement rock to the northeast of the fault. The SAF and itsassociated seismicity fall at the edge of the imaged FZC, suggesting that the SAF acts as an impermeableseal to fluid transport across the fault.
Dimensionality analysis of magnetotelluric and vertical-field transfer functions indicate structural changesat frequencies lower than 0.01Hz. This corresponds to depths of 10-15km, where the brittle-ductiletransition is believed to occur. Possible explanations of the data are evaluated in light of the transpressiveplate margin.
In summary, the creeping segment of the San Andreas Fault near Hollister exhibits a more extensivefault-zone conductor than either the Parkfield or Carrizo Plain segments. The correlation betweenseismicity and high-conductivity, interpreted to be due to enhanced fluid content, may indicate that fluidsfacilitate creep. Alternatively, if creep is the result of another agent, the presence of fluids may simplyresult from the network of interconnected fractures maintained by continued creep.
EM11-2

Correlation and anti-correlation of seismological and electromagnetic results in the central Andes: Implications for the physical state of the deeper crust
Heinrich Brasse, Wolfgang Soyer (FU Berlin, [email protected]) Pamela Lezaeta (Woods Hole Oceanographic Institution) Katrin Schwalenberg (University of Toronto)
The results of electromagnetic investigations in the central Andes of Chile and Bolivia are related to various seismological data sets, e.g., receiver functions, attenuation tomography, reflection and refraction seismology. The forearc is resistive with the exception of a number of confined upper-crustal fault zones; in particular no dehydration zones above the subducting Nazca plate – which are clearly imaged as highly reflective bands – are mapped as good conductors, as should be expected. Possible causes are discussed, e.g., the deep Pacific Ocean and near-costal highly conductive faults blurr deeper structures of the South American con-tinental margin.
On the other hand, a striking high conductivity zone in the deeper crust below the Bolivian Altiplano High Plateau (where Moho depths of 70 km were determined) is correlated with low seismic velocities, reflective patterns at its upper boundary, high Vp/Vs-ratios and, most remarkably, with a zone of signicant attenuation of seismic waves, i.e., with Qp-values as low as 100 or even lower. At first glance the apparent depth extent of the Altiplano conductor and the derived conductances seem unrealistic but are consistent with the dimensions of the low Qp-body. Considering other geophysical observations, especially low crustal rigidity derived from gravity data and the enhanced heat flow on the plateau, an almost inevitable consequence lies in the assumption of a large partially molten granitic body in the deeper Altiplano crust. This was also inferred from recent temperature modelling, employing large convection cells in and below the Altiplano crust. The only observations that do not fit into this scheme are the – although high but merely sufficient – Vp/Vs-ratios and corresponding Poisson numbers. The various results are appraised considering especially the very different resolution capabilities of the respective methods.
EM11-3

THE MANTLE BENEATH THE FRENCH ALPS FROM EM ANDSEISMOLOGY
Sophie Hautot (IUEM-UBO, Plouzane, France, [email protected])Pascal Tarits (IUEM-UBO, Plouzane, France)Frederic Perrier (DASE/CEA, Bruyeres-le-Chatel, France)
We used the electromagnetic data recorded during two years in the French Alps(Sur-Fr tes) to calculate a long-period MT transfer function of the site. The electricdata are strongly distorted by the rugged topography and by complex geology. Thedistortion was analyzed with the variation in orientation of 19 electric dipoles andwas found almost purely static in the period range (3000-144000 s) and stronglycorrelated to the geology. We used the Z/H method to correct the MT response forstatic shift and to obtain an equivalent MT transfer function at the longest periods.The resulting MT transfer function, in the period range 3000-432000 s, isremarkably 1-D.
The resulting conductivity profile is compared to the mean European Mantleconductivity (Olsen, 1998). Velocity anomaly profiles for the area under study andthe mean velocity structure of the European Mantle are obtained from twotomographic models (Ritsema et al., 1999; Megnin and Romanowicz, 2000). Thelocal conductivity and velocity anomalies residuals with respect to the meanEuropean mantle values are well correlated. The relationships between the twoparameters are discussed in terms of compositional and temperature anomalies.
EM11-4

LITHOSPHERIC MANTLE STRUCTURE OF THE SLAVE CRATON
Alan G. Jones (Geological Survey of Canada, 615 Booth St., Ottawa, Ontario, K1A 0E9, Canada, email: [email protected])
Pamela Lezaeta, Alan Chave, Rob Evans, Xavier Garcia (WHOI, Woods Hole, MA 02543, U.S.A) Ian Ferguson (Department of Geological Sciences, University of Manitoba, Winnipeg, Manitoba,
R3T 2N2, Canada) The relatively small (600 km x 400 km) Slave craton in northwestern Canada is an ideal natural laboratory for investigating processes of Mesoarchean and Neoarchean lithospheric man-tle formation and evolution. Excellent outcrop and the discovery of economic diamondiferous kimberlite pipes in the centre of the craton dur-ing the early 1990s have led to an unparalleled amount of geoscientific information being avail-able. Over the last five years four types of deep-probing magnetotelluric (MT) surveys were conducted as part of a variety of programs to determine regional-scale electrical structures of the Slave craton. Two types of surveys involved novel acquisition; one through frozen lake ice along ice roads during winter, and the second deploying ocean-bottom instrumentation from a float planes during summer. In total, MT meas-urements were made at over 150 locations across the craton, with highest density along the winter roads and around Yellowknife. One principle goal for the MT surveys was to determine the topology of the lithosphere-asthenosphere boundary (LAB) across the Slave craton. However, the MT responses revealed serendipitously a remarkable anomaly in the lithosphere of the central Slave craton, named the Central Slave Mantle Conductor (CSMC). This CSMC anomaly is modeled as a spatially-confined region of extremely low resistivity (<30 Ω.m) beginning at depths of ~80-120 km and striking NE-SW. Where precisely located, it is spatially collocated with the Eocene-aged kimberlite field in the central part of the craton and also with a geochemically-defined ultra-depleted harzburgitic layer interpreted as oce-anic or arc-related lithosphere emplaced during early tectonism. Three-dimensional (3-D) mod-elling of the CSMC shows that its top surface lies within the NE-SW striking G10 geochemi-cal boundaries defined by Grütter et al. (1999),
and that it dips to the NW. This geometry is suggestive of lithospheric formation by imbrica-tion of slabs from the SE (present-day coordi-nates), and is consistent with the G10-3 garnet trends described by Grütter and Anckar (2002). The tectonic processes that emplaced this geo-physical-geochemical body within the center of the craton are likely related to the subduction of lithosphere of unknown provenance to the south during a craton-wide heating event at ~2630-2620 Ma.
Figure 1: Depth slice at 140 km of 3-D model. Observed (black) and modelled (white) real in-duction arrows shown for a period of 620 s.
EM11-5

FLUIDS RELEASE FROM THE SUBDUCTED COCOS PLATE AND PARTIAL MELTINGOF THE CRUST DEDUCED FROM MAGNETOTELLURIC STUDIES IN CENTRAL-EASTERN MEXICO
Alexander Jording, Hartmut Joedicke (Univ. Muenster, Germany; [email protected]),Luca Ferrari, Jorge A. Arzate (UNICIT Quer taro, Mexico)
In central-eastern Mexico magnetotelluric measurements have been carried out along two coast-to-coast profiles. Profile A- A' follows the GEOLIMEX transect where refraction seismic andgravimetric data are available. Profile B-B' , more to the north, crosses the Trans-MexicanVolcanic Belt (TMVB) in its central part. 2D models display several zones of markedly enhancedconductivity on both profiles. In the southern part of profile A-A', two of such zones areassociated with the trend of the subducting plate. In the southern part of profile B-B' similar butless distinct features may be identified . Here, the northern one of these zones seems toprolongate into a broad and very striking zone of high conductivity at a depth range of 15 — 40 kmbelow the TMVB and its foreland.
Good conductors at convergent plate boundaries are normally interpreted by fluids and partialmelts. Regarding possible sources of fluids, trapped seawater contained in subducted sediments oroceanic basalts has been a candidate since long. However, due to increasing pressure andtemperature, this water will be squeezed out and consumed by hydration reactions at rathershallow depths. A powerful source at larger depths seems to be water release from thehydrothermally highly altered oceanic basalts. Various mainly temperature controlled waterproducing reactions are known, with the breakdown of zeolites at 15 — 30 km and of chlorites at40 — 50 km representing the most effective ones. These temperature/depth ranges fit very wellwith the bases of the two zones of enhanced conductivity as imaged in the southern parts of bothMT models. We may explain these zones, therefore, as being caused by ascending water releasedfrom the subducted oceanic crust.
More water will be released from the oceanic crust by the breakdown of amphibolites when adepth of ~100 km is reached. We propose that these fluids start to produce melts in the overlyingmantle wedge, which migrate upward and collect in the lower crust. Furthermore, these melts willinitiate migmatisation of the lower continental crust resulting in granitic melts which ascend to amid-crustal level. This complex zone of different melts matches with the zone of highly increasedconductivity as well as with the zone of Late Pleistocene to Holocene volcanism at surface.
EM11-6

IS LITHOSPHERE ANISOTROPIC IN THE CENTRAL FENNOSCANDIAN SHIELD?
Toivo Korja (Geological Survey of Finland, POB 96, FI-02151, Espoo,Finland, E-mail: [email protected])
Martin Engels (University of Uppsala)Ilkka Lahti (University of Oulu)Valentyna Kobzova & Borys Ladanivskyy (Carpathian Branch of Subbotin Institute of
Geophysics, National Academy of Sciences of Ukraine)BEAR Working Group
Magnetotelluric data from the central part of the Fennoscandian Shield show strong andstable anisotropic behaviour (e.g. phase split). In this paper we aim to explain these features and,in particular, attempt to distinguish between the two alternatives, viz. a model that contains 3Disotropic lithosphere or a model that requires the lithosphere (or a part of it) be genuinelyanisotropic.
Magnetotelluric data from pre-BEAR surveys (0.1-500 s; Korja & Koivukoski, 1994) andfrom the BEAR array (10 -10000 s) exhibit strong and stable anisotropic features in the centralpart of the Fennoscandian Shield including, in particular, the Central Finland Granitoid Complex(CFGC; size c. 200 km x 200 km) in the Palaeoproterozoic Svecofennian Orogen and theArchaean Karelian Province (KP). The two regional phases from decomposition analysis(McNeice-Jones extension of Groom-Bailey decomposition and Bahr’s decomposition) begin todepart at the periods of 1-5 s and a maximum split of c. 40-50 degrees is reached at the periodinterval of 200-600 s. At longer periods, the split slightly decreases but remains as high as c. 20degrees at the periods of 8000-10000 s. Decomposition analysis yields also very stable regionalstrikes of c. N55E (+- 90 degrees) in CFGC and even in the highly resistive KP more to thenortheast. N55E is the direction of the maximum phase (minimum impedance) and wouldtherefore indicate the azimuth of anisotropy in the case of anisotropic deep lithosphere. At thesame time, real induction arrows are rather short (< 0.2) though not negligible at periods shorterthan 1000 s. At longer periods, the length of arrows increase reaching an average length of 0.4 inCFGC and 0.5-0.7 in KP at the periods of 6000-8000 s.
To distinguish between the two alternative models, we have carried out numerical 3Dmodellings (IE technique from Avdeev, Kuvshinov, Pankratov) and analogue scale modellingexperiment (Lviv, Ukraine) using a recently compiled 3D crustal model (SMAP) and an average1D upper mantle reference model for Fennoscandia (Korja et al., 2002). The model data wereanalysed in a same manner as the observed data; e.g. regional strikes and phase split weredetermined. Initial results suggest that
(i) the stable regional strike of N55E (+-90 degrees) is primarily due to the effects of crustalconductors surrounding the Central Finland Granitoid Complex and bordering the ArchaeanKarelian Province and
(ii) a major part of the large phase split is also due to known conductors although a minorpart cannot be explained solely by the known crustal conductors leaving a possibility toanisotropic lithosphere. The BEAR data, however, indicates the presence of conductivityheterogeneities in upper mantle that may also contribute to observed anisotropic signature ofmagnetotelluric data.
EM11-7

UPPER MANTLE CONDUCTIVITY IN FENNOSCANDIAAS IMAGED BY THE BEAR ARRAY
BEAR Working Group, reported by Toivo Korja (Geological Survey of Finland, POB 96,FI-02151, Espoo, Finland, [email protected])
The Fennoscandian Shield is an attractive but challenging environment to investigate theevolution and formation of the continental upper mantle beneath a stable craton and to examineits response to current plate movements. The lithosphere of the Shield evolved in a number ofprocesses from Mesoarchaean to Palaeozoic (3.1 — 0.34 Ga) producing a complex crustal andpresumably a complex lithospheric structure. Multiple collisions and rifting events of thelithospheric plates may have left observable traces into the continental lithosphere including e.g.subduction zones, imbrication of lithospheric plates and possible mantle plumes.
Geologically and geophysically the crust of the Shield is fairly well studied thus giving solidbasis for upper mantle studies. The recently compiled crustal 3D conductivity model over theentire Fennoscandia (Korja et al., 2002) has a major role by enabling various modelling andresolution studies (see other contributions in this Workshop). The EUROPROBE / SVEKALAPKO
project (Hjelt, Daly, the SVEKALAPKO Colleagues, 1996) is providing information of the structureand current state of the continental upper mantle in Fennoscandia through seismic tomography,electromagnetic research (BEAR — Baltic Electromagnetic Array Research), geothermal studiesand xenolith analysis.
We present a summary of the ongoing BEAR research. Results of specific research related toe.g. data processing (incl. efforts to determine long period responses and eliminate sourceeffects), studies on the nature and effects of the non-uniform source, studies on crustal distortions(decompositions), and 3D modelling and multi-dimensional inversions (incl. resolution studies)studies are reported in other contributions. Therefore we concentrate below on possibleanisotropy of continental lithosphere and on the upper mantle conductivity structure beneathFennoscandia as imaged by the BEAR array. The major findings, to be discussed together withother geophysical and geological models, are:- 3D modellings indicate that upper mantle contains an excess of up to 5000 S of conductive
material with respect to an average 1D reference model of Fennoscandia;- modellings indicate also that the upper mantle should be less conductive in the northern part of
the Shield whereas more conductive in central and southern parts;- upper mantle EM effects are well above the BEAR observation and 3D modelling errors;- the presence of mantle lithospheric conductors at the depth interval of 80-120 km in certain
parts of the Shield;- a significant increase of conductivity takes place at the depths ranging from 170 km to 250 km;
a clear asthenospheric layer, however, cannot be resolved — its topography is variable but thetop deeper in the central part of the Shield and shallower in western and eastern parts of thearray;
- strong anisotropic signatures in data (e.g. impedance phase split) can be explained primarily byisotropic crustal 3D structures (a small remaining part may be due to anisotropic lithosphereand/or 3D isotropic lithosphere;
- conductivity at depths below c. 400 km is compatible with global averages (Olsen, 1998;Semenov, 1999).
EM11-8

GEODYNAMICS AND MAGNETOTELLURICS: COMMONMODELING OF THE ICELAND PLUME
Anja Kreutzmann (Inst. of Meteorology and Geophysics, University of Frankfurt,Germany), [email protected]
Thomas Ruedas (Inst. of Meteorology and Geophysics, University of Frankfurt,Germany)
In the Iceland Plume Dynamics Project (IPDP) of the Universities of Frankfurt andMainz different geophysical methods are applied to model the Iceland plume, e.g.geodynamics (GD) and magnetotellurics (MT).
Geodynamics:
Several convection and melting models were calculated with a plume beneath a MidOcean Ridge (MOR) rising from the 660 km phase boundary. Seafloor spreading wasintroduced as a kinematic boundary condition at the top of the convection model with ahalf-spreading rate of 1 cm/year. Different plume excess temperatures at the bottom ofthe model were considered (150K to 350K). The melt retention threshold varies between0.1% and 3%. Melt fractions exceeding this value are extracted to build the model crust.
The 3-D GD models provide the distribution of temperature and melt in the mantle. Howcan we use them to calculate electrical conductivities, which are the input for the 3-D MTmodels? The required parameters are the conductivities of the solid and the fluid phase,and the geometry of the melt inclusions. The conductivity of the solid depends on thetemperature and varies between 1000 Ohm-m on the top and 50 Ohm-m at the bottom ofthe model. The ratio between the conductivity of the fluid and the solid is set to 390. Thefluid phase is assumed to be distributed in the form of spheroidal inclusions and theirconnectivity depends on the melt fraction. Thus, if we have a completely connected meltsystem the conductivity is given by the upper Hashin-Shtrikman bound. For isolatedinclusions and intermediate stages the formulas were given by Schmeling (1986).
The MT transfer functions of different models were calculated in a period range up to50000 seconds using Mackie’s algorithm. The sensitivity of the MT transfer functionswith respect to the temperature and melt content is investigated. The influence of theocean and the Icelandic crustal conductor does not interact with the effect caused by theplume, which is seen at periods between 5000 and 20000 seconds. Therefore the modelstudy together with field observations will give constraints for GD modeling.
EM11-9

LITHOSPHERIC STRUCTURE OF NORTHERN BRITISH COLUMBIAAND SOUTHERN YUKON
Juanjo Ledo (Geological Survey of Canada, 615 Booth St.K1A OE9, Ottawa, Canada)[email protected] G. Jones (Geological Survey of Canada, 615 Booth St.K1A OE9, Ottawa, Canada)Ian J. Ferguson (Geological Sciences, University of Manitoba, Winnipeg, R3T 2N2, Canada)Lisa Wolynec (Geological Sciences, University of Manitoba, Winnipeg, R3T 2N2, Canada)
The Cordillera of North America is a Phanerozoic accretionary tectonic zone that
comprises numerous terranes accreted to the stable margin of western North America from the
Jurassic to the Early Tertiary. Although detailed bedrock mapping has defined the relationships
between the various terranes in two-dimensions, their subsurface geometries and physical
conditions of the crust remain unknown. To address this deficiency Lithoprobe undertook two
magnetotelluric profiles from ancestral North American rocks to the coast. In this paper we report
on an electrical resistivity cross section of the northern Canadian Cordillera in the Yukon that has
been derived from the inversion of forty-two magnetotelluric sites along a 470 km long profile,
with emphasis placed on the regional scale features. Analyses of the magnetotelluric data indicate
that the resistivity structures can be interpreted as 2-D with strike of —45o, which is parallel to the
main exposed tectonic structures. A lithospheric-scale resistivity model was derived from the
distortion-corrected regional MT impedances. At the western end of the profile, under the Coast
Belt, a low resistivity lower layer dips inland; we interpret this anomaly as reflecting the presence
of partial melt and/or fluids from the Kula plate subduction during the Paleocene. We find a
strong lateral transition in upper mantle resistivity occurring below the Intermontane Belt that
coincides with an important change in the chemical and isotopic characteristics of Tertiary to
recent alkaline lavas, and is taken to indicate that the enriched lithosphere related to the Coast
Belt basalts extends partly beneath the Intermontane Belt. The strike-slip Tintina Fault, is imaged
as a near-vertical high resistivity crustal feature; the spatial coincidence of the high resistivity,
lack of seismic reflections and low seismic activity leads us to consider this suture as practically
healed. The electrical resistivity values of the lower crust of the Intermontane and Omineca belts
can be explained by dry candidate lower crustal rocks, similarly to the values found in the
northern part of the Southern Canadian Cordillera.
EM11-10
DEEP RESISTIVITY STRUCTURE OF A MAJOR ACTIVE FAULT, CENTRAL JAPAN
Yasuo Ogawa(Volcanic Fluid Research Center, Tokyo Institute of Technology, [email protected]),Shinichi Takakura(GSJ/AIST), and Yoshimori Honkura (Department of Earth and PlanetarySciences, Tokyo Institute of Technology)
We investigated the deep crustal resistivity structure of an active fault at Itoigawa-Shizuoka TectonicLine (ISTL), Central Japan, which is one of the most disastrous active intraplate faults in Japan, by useof wide-band magnetotelluric (MT) method. The major objective is to electrically image the deep crustalconductor with reference to the possible enhanced porosity at the root of the active fault, which triggersthe generation of major earthquakes. The 28 MT stations were aligned perpendicular to the ISTL. Themeasured electric and magnetic signals were contaminated by the DC railways. We used simultaneousmeasurements at the remote site in Kagoshima (900km away) by use of GPS in order to alleviate thecultural noise. Two-dimensional modeling was carried out in transverse magnetic (TM) mode whereelectric currents flow in N60W-N120E directions, as this mode is believed to be rather robust in a three-dimensional environment if the anomaly is more conductive than the surroundings. The model showedgood correlation with the surface geology. In particular, we found a thick (~6km) conductor to the east ofISTL which corresponds to the heavily folded sedimentary layer. The Japan Alps to the west of the ISTLis characterized by the resistive crust, which is underlain by a conductor below 20km depth, consistentwith the low seismic velocity anomaly. Most important feature is the conductor in the mid-crust directlyunder the active folding area to the east of the ISTL. This may imply a localized zone of fluids becauseof the enhanced porosity in a shear zone. The recent seismicity clusters in the resistive crust underlain bythe conductor, and this suggests the fluid involvement in earthquake generation processes. We also set uptwo more profiles across the tectonic line (30 stations in total) and found the variation of the mid-crustalconductor along the ISTL. The distribution of the mid-crustal conductor is consistent with thedistribution of the shear zone identified by GPS.
EM11-11

CRUST-MANTLE STRUCTURES AND ANISOTROPY REVEALED FROM LONG PERIOD MAGNETOTELLURIC MEASUREMENTS
IN THE SOUTH INDIAN DHARWAR CRATON
A.K. Singh, B.H. Dawalappa and B.R. Arora Indian Institute of Geomagnetism
Dr. Nanabhai Moos Marg Colaba, Mumbai- 400005 [email protected]
Mapping the deep crust mantle structures including lithosphere asthenosphere boundary
of the south Indian Precambrian shield regions is vital to understand the evolution
history and the active geodynamic processes (epeirogenic uplifts) in the region. Long
period magnetotelluric (LMT) measurements have been recently undertaken along
approximately 300 km long profile extending from granitic/gneissic terrain of the
eastern Dharwar to western Dharwar cutting across the Closepet granite. Measurements
with RAP (Gottingen) LMT unit with a 2 sec sampling rate and 10 to 12 days site
occupancy provide information in the period range of 10s-16, 000s. Data processing
and analysis reveals existence of distinct subsurface behaviour in the eastern Dharwar
and the western Dharwar, signifying possibly a different evolution history. Phase
splitting at around 100sec period in western Dharwar indicates the presence of
crustal/lithospheric anisotropy, whereas the eastern Dharwar is devoid of such
signatures but show the distortion of the LMT data by shallow subsurface scatterer.
Lithosphere- Asthenosphere boundary is estimated to be around 220 km, confirming
well with the heat flow and seismic studies.
EM11-12

VERY LONG PERIOD MAGNETOTELLURIC DATA ACROSS THE INDIA-ASIA COLLISION ZONE
Jessica Spratt (Department of Earth Sciences, Syracuse University, Syracuse, New York, 13244,
U.S.A., email: [email protected]) Alan G. Jones (Geological Survey of Canada, 615 Booth St., Ottawa, Ontario, K1A 0E9, Canada,
email: [email protected]) K. Doug Nelson (Department of Earth Sciences, Syracuse University, Syracuse, New York, 13244,
U.S.A., email: [email protected]) Martyn J. Unsworth (Department of Physics, University of Alberta, Edmonton, Alberta, T6G 2J1,
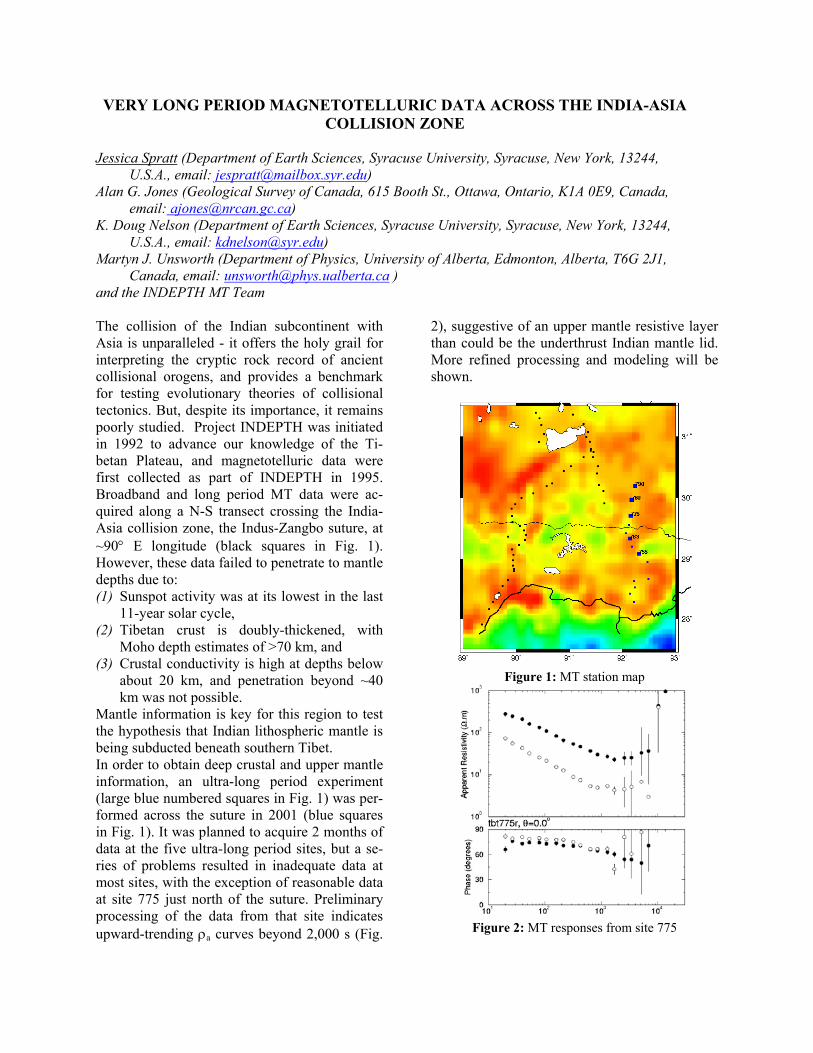
Canada, email: [email protected] ) and the INDEPTH MT Team The collision of the Indian subcontinent with Asia is unparalleled - it offers the holy grail for interpreting the cryptic rock record of ancient collisional orogens, and provides a benchmark for testing evolutionary theories of collisional tectonics. But, despite its importance, it remains poorly studied. Project INDEPTH was initiated in 1992 to advance our knowledge of the Ti-betan Plateau, and magnetotelluric data were first collected as part of INDEPTH in 1995. Broadband and long period MT data were ac-quired along a N-S transect crossing the India-Asia collision zone, the Indus-Zangbo suture, at ~90° E longitude (black squares in Fig. 1). However, these data failed to penetrate to mantle depths due to: (1) Sunspot activity was at its lowest in the last
11-year solar cycle, (2) Tibetan crust is doubly-thickened, with
Moho depth estimates of >70 km, and (3) Crustal conductivity is high at depths below
about 20 km, and penetration beyond ~40 km was not possible.
Mantle information is key for this region to test the hypothesis that Indian lithospheric mantle is being subducted beneath southern Tibet. In order to obtain deep crustal and upper mantle information, an ultra-long period experiment (large blue numbered squares in Fig. 1) was per-formed across the suture in 2001 (blue squares in Fig. 1). It was planned to acquire 2 months of data at the five ultra-long period sites, but a se-ries of problems resulted in inadequate data at most sites, with the exception of reasonable data at site 775 just north of the suture. Preliminary processing of the data from that site indicates upward-trending ρa curves beyond 2,000 s (Fig.
2), suggestive of an upper mantle resistive layer than could be the underthrust Indian mantle lid. More refined processing and modeling will be shown.
Figure 1: MT station map
Figure 2: MT responses from site 775
EM11-13

GEODYNAMIC TWIST PROCESS OF THE SEISMOGENIC SLAB - A NEWATTEMPT TO EXPLAIN THE EARTHQUAKES’ MECHANISM OF VRANCEAZONE
Dumitru STANICA , Maria STANICA , Dorel ZUGRAVESCU
(Romanian Academy, Institute of Geodynamics, 19-21 J.L.Calderon St., Bucharest-37,R-70201, Romania, e-mail: [email protected])
We examine the effects of geodynamic twist process of a relic slab as a possible
explanation of the intermediate depth seismic activity in the Vrancea region. In the
context created by the existence of more models for this zone, no one able to explain
satisfactory the mechanism regarding the occurrence of intermediate depth earthquakes,
focussed within very narrow seismogenic volume (about 40x80x220km), a new
methodology of investigation of the crust and upper mantle is to be discussed. In this
respect, the paper highlights recent magnetotelluric achievements performed along four
profiles, placed mainly on seismic active area, having as major target to develop realistic
geoelectric models and tomographic images, at various depth levels, able to offer more
information in view of tectonic processes responsible for this strong seismicity. Both the
strike direction of the slab and tomographic images accomplished by using tensor
impedance decomposition technique and 2D forward modeling, respectively, reveal: (1)
the presence of the descending relic slab, having a continental status as a sequence of its
connections with the European Platform, (2) the progressive changes of the strike
direction, depending on the depth, beginning with an alignment about NE-SW at its upper
part (at about 60 km in depth), getting to an orientation N-S, at a depth greater than 150
km, what suggests that it underwent and continues to undergo a twist phenomenon, (3)
this geodynamic process is associated with the appearance of cracks inside of relic slab
and may represents one of the realistic mechanisms for triggering the intermediate depth
seismic events.
EM11-14

A STUDY ON THE ELECTRIC RESISTIVITY STRUCTURE BENEATH THE TIANCHI VOLCANICAREA OF CHANGBAISHAN MOUNTAIN, NE CHINA, AND ITS SUBSURFACE DYNAMIC PROCESS
Ji Tang (Earthquake Research Institute, The University of Tokyo [email protected])Guoze Z2, Guodong L2. Utada H.1, Uyeshima M.1, Xiaobin C.2, Qianhui D. 2, Yan Z. 2 and Ichiki M. 1
1.Earthquake Research Institute, The University of Tokyo 2.Institute of Geology, China Seismological Bureau
The Tianchi volcano, one of the most active Quaternary volcanoes in China, locates in tensile stress zoneof the Pacific back-arc in the east part of Jilin province, NE China. In recent years, the observations indicatethat Tianchi volcano may have risk of eruption after the strongest eruption in 16th century. In order toinvestigate the volcano’s potential for future eruption and to understand the dynamic process of the volcano, 61MT measurements and 4 Network-MT measurements have been carried out around the Tianchi Volcano andJilin province, NE China, respectively.
The MT responses and induction arrows have been obtained. Bahr s impedance tensor decomposition wasthen applied to decompose MT responses for eliminating distortion. The electrical conductivity structure of thecrust and upper mantle beneath the Tianchi volcanic region has been investigated by using two-dimensional (2-D) inversion and three-dimensional (3-D) forward modeling. The results show that there exists a low resistivitybody at depth of 10-15 km beneath the Tianchi and its northern and eastern flank with thickness 20-30 km. Thelow resistivity body may be reflecting the presence of a magma chamber. The other investigation, such asgeological, seismic and geo-chemical (Liu,1997; Zhang,2001; Shangguan,1998), considered also that thereexists a magma chamber at Tianchi volcanic area.
Very long period (up to the periods of 105~106 S) MT and the GDS responses were analyzed to explorethe structure deep in the mantle. 1-D inversion with minimum and smooth structure constrains was applied.The result suggests that there are possible electric resistivity interfaces at the depth range of 100-150 km and550-630 km with low resistivity corresponding to the bottom of lithosphere and mantle transition zone,respectively. These features are comparable to those by seismic tomography (Fukao, 1992; 2001).
The Changbaishan volcanoes locate above the corner where the downgoing slab turns to be stagnant. Thedehydration (Thompson, 1992) may occur by the phase transition because of the special location and lowtemperature. The water may be stored in minerals or in melts, which migrate up to the depth of about 100km. Then, it is resisted by the lithosphere and accumulates here so that a large magma chamber may be formedin the mantle. The magma overflows through a weak zone such as rift belts or large active faults. Thus, basalticvolcanoes in this region can be accompanied by a large magma chamber in the mantle as well as the Tianchicrustal chamber.
In conclusion, MT and Network-MT studies in NE China revealed low resistivity bodies in the crust andthe upper mantle beneath the Tianchi volcanic area of the Changbaishan Mountain, which indicate the possiblepresence of two different magma chambers. These magma chambers are situated above the corner between thedowngoing and stagnant slab. This continental magmatism may be caused by dehydration of hydrous mineralsand upwelling of fluid from deep mantle.
EM11-15

MAGNETOTELLURIC EXPLORATION OF THE HIMALAYAN-TIBETAN OROGEN DURING PROJECT INDEPTH
Martyn J. Unsworth (Department of Physics, University of Alberta, Edmonton, Alberta, T6G 2J1,
Canada, email: [email protected] ) Alan G. Jones (Geological Survey of Canada, 615 Booth St., Ottawa, Ontario, K1A 0E9, Canada,
email: [email protected]) K. Doug Nelson (Department of Earth Sciences, Syracuse University, Syracuse, New York, 13244,
U.S.A., email: [email protected]) Wei Wenbo (Department of Applied Geophysics, China University of Geosciences, Beijing, Peoples
Republic of China, email: [email protected]) John Booker (Department of Earth and Space Sciences, University of Washington, Seattle, Washing-
ton, 98195, U.S.A., email: [email protected]) and the INDEPTH MT Team The Tibetan plateau is the spectacular result of the collision of India with Asia. In the last two decades, systematic geological mapping and geophysical exploration has begun to reveal de-tails of the lithospheric structure. Magnetotellu-ric data were initially collected in Tibet during the Sino-French collaboration in the 1980s and gave initial evidence for high electrical conduc-tivities in the mid-crust of Southern Tibet. Since 1995, the INDEPTH project has system-atically collected MT data across the entire north-south extent of the Tibetan plateau (Figure 1). On each profile both long-period and broad-band MT data were collected. Inversion of the MT and vertical magnetic field data has revealed that a conductive mid-crustal layer extends from just south of the Tsangpo Suture to the Kunlun Fault. This layer has a conductance of at least 6,000 S, and locally may exceed 10,000 S. The highest conductance is observed in the southern Lhasa Block and northern Qiangtang Terrane. The conductor is located in the mid-crust in southern Tibet and may extend into the lower crust and upper mantle beneath northern Tibet. Using the other geophysical and petrological data collected in Tibet, it appears that this con-ductive layer is due to a zone or partial melting, possibly overlain by a thin layer of hydrothermal fluids. This fluid layer represents a zone of me-chanical weakness in the Tibetan lithosphere that permits the ongoing convergence and east-ward extrusion to be accommodated. The two profiles collected in Southern Tibet show very similar geoelectric structure (100 and
700 lines). This implies that the degree of melt-ing is not strongly influenced by the rifts pres-ently active in Southern Tibet.
Figure 1: Location of the INDEPTH magnetotelluric profiles collected in Tibet. Data were collected in 1995 (100,200 and 400 lines), 1998 (500-line), 1999 (600-line) and 2001 (700-line).
EM11-16

