electricity distribution network allowed revenue 2018 ... · electricity distribution network...
TRANSCRIPT

1
Electricity Distribution Network
Allowed Revenue 2018,
Distribution Tariffs 2017/2018 &
Distribution Loss Adjustment
Factors
Information Paper
Reference: CER/17/273 Date Published: 31/08/2017 Queries to: David Lindsay
Electricity Distribution Network Allowed Revenue 2018, Distribution Tariffs 2017/2018 & Distribution Loss Adjustment Factors
i
Public / Customer Impact Statement
ESB Networks owns and operates the electricity distribution system which
supplies electricity to around 2.4 million customers in Ireland, out of this
around 2 million of these are residential customers.
The CER allows ESB Networks charge money towards the cost of safely
operating and maintaining the electricity distribution network. These charges
are reflected in customers’ electricity bills.
The CER’s role is to protect electricity customers by ensuring that ESB
Networks spends customers’ money appropriately and efficiently to deliver
necessary services. The CER does this through what is called a Price Review
which is carried out every 5-years, the current Price Review (PR4) started in
2016 and will end in 2020.
For each year of PR4 ESB Networks is allowed collect an efficient amount of
money to operate and maintain the network for that year. The CER reviews and
updates these revenues each year.
The CER’s current expectation is that the combined transmission1 and
distribution adjustments will result in the average annual residential
customer’s bill rising by €2.77 in October 2017, which is an increase of a
0.95%.2 However, the actual outcome for customer prices depends, among
other factors, on international fuel and related generation costs, which are
currently circa 50% of the overall cost of electricity to customers.
1 See CER/17/276 2 This based on transmission tariff group DTS-D2 (customers indirectly connected to the transmission system via the distribution system, with a maximum import capacity of less than 0.5MWs) and distribution tariff group DG1: Urban Domestic
Electricity Distribution Network Allowed Revenue 2018, Distribution Tariffs 2017/2018 & Distribution Loss Adjustment Factors
ii
Executive Summary
Introduction
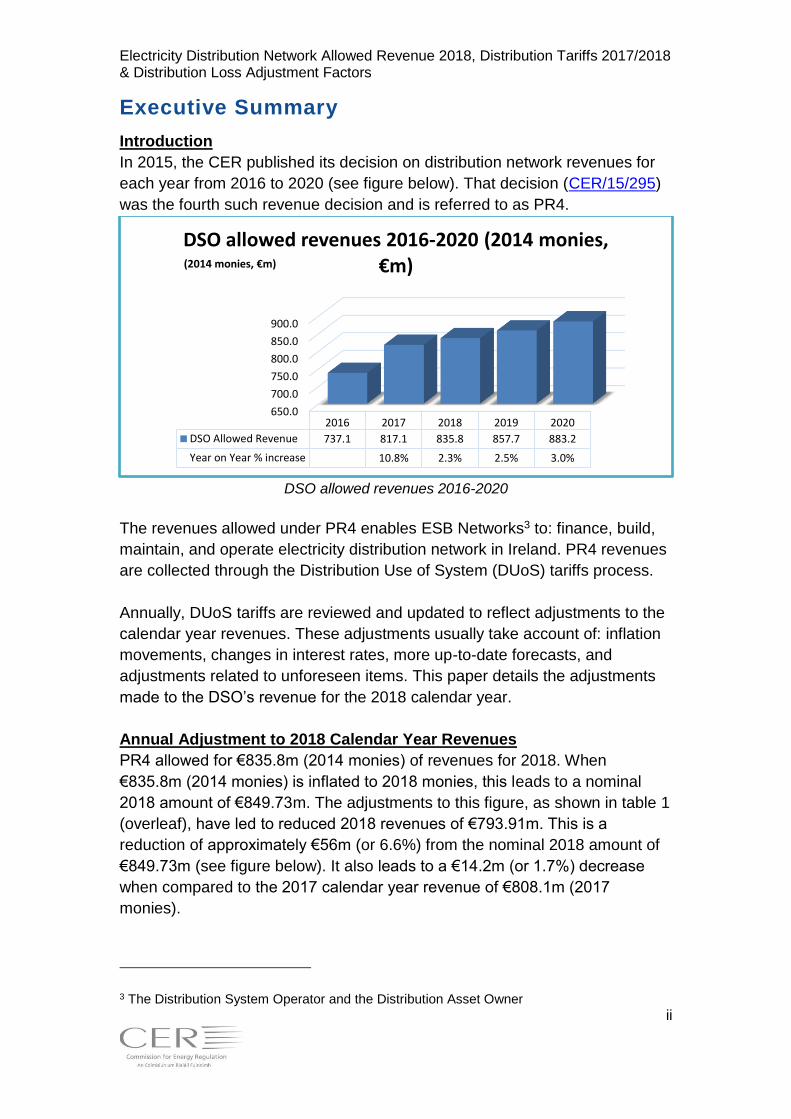
In 2015, the CER published its decision on distribution network revenues for
each year from 2016 to 2020 (see figure below). That decision (CER/15/295)
was the fourth such revenue decision and is referred to as PR4.
DSO allowed revenues 2016-2020
The revenues allowed under PR4 enables ESB Networks3 to: finance, build,
maintain, and operate electricity distribution network in Ireland. PR4 revenues
are collected through the Distribution Use of System (DUoS) tariffs process.
Annually, DUoS tariffs are reviewed and updated to reflect adjustments to the
calendar year revenues. These adjustments usually take account of: inflation
movements, changes in interest rates, more up-to-date forecasts, and
adjustments related to unforeseen items. This paper details the adjustments
made to the DSO’s revenue for the 2018 calendar year.
Annual Adjustment to 2018 Calendar Year Revenues
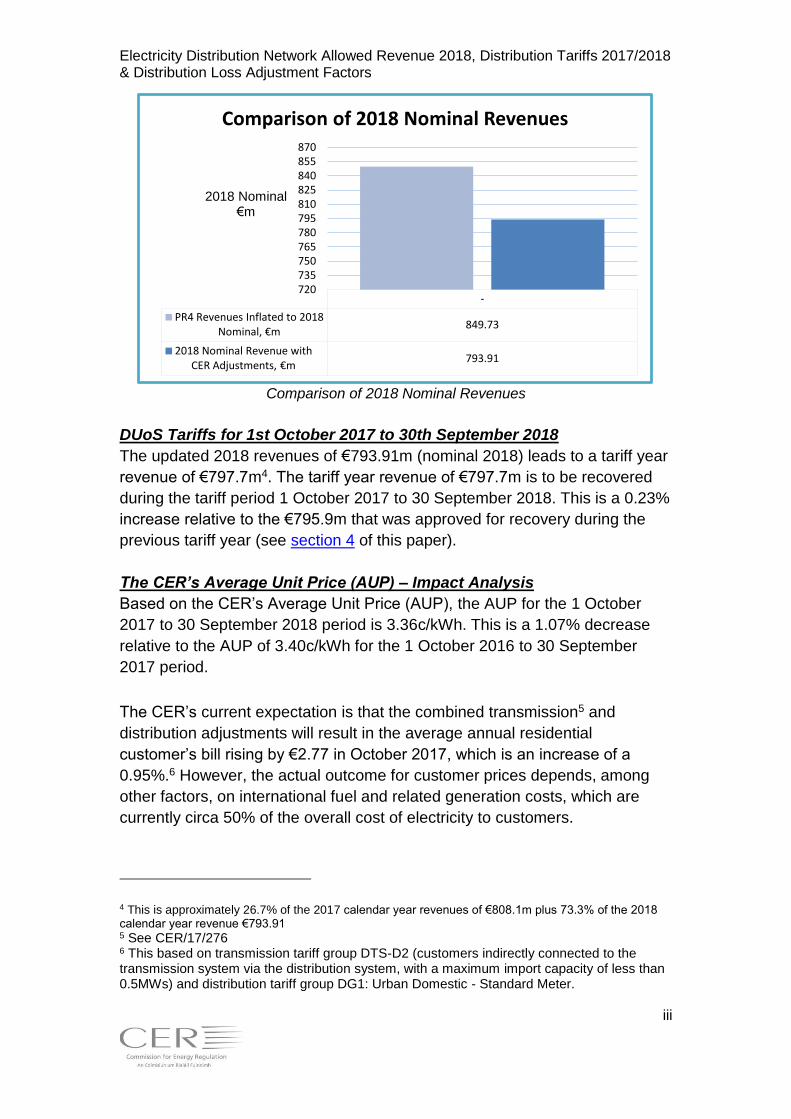
PR4 allowed for €835.8m (2014 monies) of revenues for 2018. When
€835.8m (2014 monies) is inflated to 2018 monies, this leads to a nominal
2018 amount of €849.73m. The adjustments to this figure, as shown in table 1
(overleaf), have led to reduced 2018 revenues of €793.91m. This is a
reduction of approximately €56m (or 6.6%) from the nominal 2018 amount of
€849.73m (see figure below). It also leads to a €14.2m (or 1.7%) decrease
when compared to the 2017 calendar year revenue of €808.1m (2017
monies).
3 The Distribution System Operator and the Distribution Asset Owner
650.0
700.0
750.0
800.0
850.0
900.0
2016 2017 2018 2019 2020
DSO Allowed Revenue 737.1 817.1 835.8 857.7 883.2
Year on Year % increase 10.8% 2.3% 2.5% 3.0%
(2014 monies, €m)
DSO allowed revenues 2016-2020 (2014 monies, €m)
Electricity Distribution Network Allowed Revenue 2018, Distribution Tariffs 2017/2018 & Distribution Loss Adjustment Factors
iii
Comparison of 2018 Nominal Revenues
DUoS Tariffs for 1st October 2017 to 30th September 2018
The updated 2018 revenues of €793.91m (nominal 2018) leads to a tariff year
revenue of €797.7m4. The tariff year revenue of €797.7m is to be recovered
during the tariff period 1 October 2017 to 30 September 2018. This is a 0.23%
increase relative to the €795.9m that was approved for recovery during the
previous tariff year (see section 4 of this paper).
The CER’s Average Unit Price (AUP) – Impact Analysis
Based on the CER’s Average Unit Price (AUP), the AUP for the 1 October
2017 to 30 September 2018 period is 3.36c/kWh. This is a 1.07% decrease
relative to the AUP of 3.40c/kWh for the 1 October 2016 to 30 September
2017 period.
The CER’s current expectation is that the combined transmission5 and
distribution adjustments will result in the average annual residential
customer’s bill rising by €2.77 in October 2017, which is an increase of a
0.95%.6 However, the actual outcome for customer prices depends, among
other factors, on international fuel and related generation costs, which are
currently circa 50% of the overall cost of electricity to customers.
4 This is approximately 26.7% of the 2017 calendar year revenues of €808.1m plus 73.3% of the 2018 calendar year revenue €793.91 5 See CER/17/276 6 This based on transmission tariff group DTS-D2 (customers indirectly connected to the transmission system via the distribution system, with a maximum import capacity of less than 0.5MWs) and distribution tariff group DG1: Urban Domestic - Standard Meter.
-
PR4 Revenues Inflated to 2018 Nominal, €m
849.73
2018 Nominal Revenue with CER Adjustments, €m
793.91
720735750765780795810825840855870
2018 Nominal €m
Comparison of 2018 Nominal Revenues
Electricity Distribution Network Allowed Revenue 2018, Distribution Tariffs 2017/2018 & Distribution Loss Adjustment Factors
iv
The CER’s AUP is calculated by dividing the total allowed revenue by the
GWh forecast sales. This is different to the DSO’s customer impact analysis
(outlined below), which takes account of other factors such as customer
numbers, Max Import Capacity (MIC) and GWh forecasts (see section 4.2 for
more information).
The DSO’s Calculation of DUoS Tariffs - Impact Analysis
Based on the DSO’s customer impact analysis the percentage decrease in
DUoS tariffs for 2017/18 is on average 0.99% for all distribution consumer
groups. For the reasons outlined earlier the DSO’s customer impact analysis
will always vary from the CER’s AUP. The DSO’s customer impact analysis
showing the amount of DUoS paid by an average customer is provided in
Appendix 1 of this paper.
DLAFs
This information paper also details the Distribution Loss Adjustment Factors
(DLAFs) for the 12 month tariff period (see section 5 of this paper).

Electricity Distribution Network Allowed Revenue 2018, Distribution Tariffs 2017/2018 & Distribution Loss Adjustment Factors
v
k factors and adjustments to 2018 base revenue.
k factors & adjustments to revenue for 2018, nominal €m
Adjustments relating to customer numbers,
indexation & GWhs
2016
(k-2)
2017
(k-1)
2018
(Ut) Total
Higher (lower) customer numbers relative to
those included in PR3 decision, nominal, €m -0.01 -0.01 0.17 0.15
Indexation & over-collection
Effect on total revenue of indexation being
different to forecast, nominal, €m -5.96 -14.38 0 -20.33
Revenue forecast for collection based on latest
demand assumptions (or outturn collected
where available), nominal, €m
-7.06 7.59 0 0.53
Incentives
Incentives, nominal, €m -8.00 0 0 -8.00
Pass-through costs, nominal, €m
Regulatory levy -0.24 0 0 -0.24
Rates -4.99 0 0 -4.99
Non-capitalised costs, nominal, €m
CER Safe Electric Campaign -0.08 0.45 0 0.37
Ampy Meters 0 2.01 0 2.01
LTCA Auditor 0 0.13 0 0.13
Aran Island Fault 3.20 0 0 3.20
Miscellaneous Incomes -4.01 0 0 -4.01
Smart Metering NBV Retirement 0 0 -11.50 -11.50
Capitalised costs, nominal, €m
Underspend capex: network (PR3) 0 0 -0.22 -0.22
Underspend capex: non network (PR3) -0.01 -0.02 0.98 0.95
Smart Metering 0.06 0.34 -14.45 -14.05
Total adjustment (excluding interest
adjustment), nominal, €m - 27.09 -3.89 -25.01 -55.99
Total adjustment (including interest
adjustment), nominal, €m -26.93 -3.87 -25.01 -55.81
Table 1: k factors and adjustments to 2018 base revenue.

Electricity Distribution Network Allowed Revenue 2018, Distribution Tariffs 2017/2018 & Distribution Loss Adjustment Factors
vi
Purpose of this paper
This paper provides information on:
The approved Distribution System Operator (DSO) revenue for the
2018 calendar year;
The approved Distribution Use of System (DUoS) tariffs to apply from 1
October 2017 to 30 September 2018, and;
The approved Distribution Loss Adjustment Factors (DLAFs) to apply
from 1 October 2017 to 30 September 2018.
Related Documents:
CER/15/295 Decision on DSO revenue for 2016 to 2020
CER/16/249 Information note on 2017 Distribution System Operator
allowed revenue, DUoS 2016/2017 tariffs & Distribution
Loss Adjustment Factors

Electricity Distribution Network Allowed Revenue 2018, Distribution Tariffs 2017/2018 & Distribution Loss Adjustment Factors
vii
Structure of this paper This paper is structured in the following manner:
Section 1 provides an introduction to and outlines the purpose of this
information note.
Section 2 provides background information. It outlines how the decisions
made when setting the DSO revenue for the 2016 to 2020 period are being
implemented to set the DSO revenue for the 2018 calendar year. It also
outlines how DUoS tariffs are set to recover that revenue. Section 2 also
provides information on Distribution Loss Adjustment Factors
Section 3 provides detail on the DSO revenue that has been approved for the
2018 calendar year.
Section 4 provides detail on the DUoS tariffs that are approved for
implementation from 1 October 2017 to 30 September 2018.
Section 5 provides detail on the DLAFs that are approved for implementation
from 1 October 2017 to 30 September 2018.
Section 6 provides a summary of CER decisions regarding DSO’s revenues.
Four documents are published alongside this paper. They are:
The approved DSO schedule of DUoS tariffs which will apply during the
1 October 2017 to 30 September 2018 period;
The excel model that was used to update the 2018 DSO revenue;
An explanatory note from the DSO explaining the updates to the model;
and, the approved DLAFs which will apply during the 1 October 2017 to
30 September 2018 period.

Electricity Distribution Network Allowed Revenue 2018, Distribution Tariffs 2017/2018 & Distribution Loss Adjustment Factors
viii
Table of Contents
1 INTRODUCTION ........................................................................................................... 1
2 BACKGROUND INFORMATION ................................................................................ 2
2.1 DSO revenue control for the period 2016 to 2020 .........................................2
2.2 Yearly updates of calendar year revenue ......................................................2
2.3 Determination of DUoS tariffs for each tariff period .....................................3
2.4 Determination of DLAFs ...............................................................................3
3 DSO REVENUE FOR THE 2018 CALENDAR YEAR .............................................. 4
3.1 Introduction ................................................................................................4
3.2 Revenue control formula .............................................................................4
3.3 Explanation of k factors and adjustments to the 2018 revenue .....................5
3.4 Adjustments relating to customer numbers (+€0.15) ....................................7
3.5 Adjustments relating to Indexation (-€20.33m) ............................................8
3.6 Adjustments relating to under-collection (+€0.53m) .....................................8
3.7 Adjustments relating to incentives (-€8m) ....................................................8
3.8 Adjustments relating to Non Capitalised Costs (+€9.8m) ...............................9
3.8.1 Safe Electric Campaign (+€0.37m) .......................................................................................... 9
3.8.2 Ampy Meters (+€2m Opex) ..................................................................................................... 9
3.8.3 LTCA Auditor (+€0.125) ........................................................................................................... 9
3.8.4 Aran Island Fault (+€3.2m) .................................................................................................... 10
3.8.5 Miscellaneous Incomes (-€4m) ............................................................................................. 10
3.8.6 Smart Metering NBV Retirement (-€11.5m) ......................................................................... 10
3.9 Adjustments relating to Capitalised Costs (-€13.32) .................................... 11
3.9.1 PR3 Capex: outturn (€0.73 m) – as result of last year’s decision .......................................... 11
3.9.2 Smart Metering (-€14.05m) – as result of last year’s decision ............................................. 11
3.9.3 Ampy Meters (€0m Capex) ................................................................................................... 11
3.9.4 ISEM IT (€0m) ........................................................................................................................ 11
3.10 Comparing 2018 with 2017 calendar year revenues .................................... 12
4 DUOS TARIFFS FOR 1 OCT 2017 TO 30 SEPT 2018 ...................................... 13
4.1 Revenue for recovery during Oct 2017 to Sept 2018 ................................... 13
4.2 DUoS tariffs for Oct 2017 to Sept 2018 ....................................................... 13
5 DISTRIBUTION LOSS ADJUSTMENT FACTORS ............................................... 15
6 SUMMARY ................................................................................................................... 16
APPENDIX 1: DUOS PAYMENTS MADE BY AVERAGE CUSTOMER .................... 17
APPENDIX 2: ABBREVIATIONS & TERMS ................................................................. 18
Electricity Distribution Network Allowed Revenue 2018, Distribution Tariffs 2017/2018 & Distribution Loss Adjustment Factors
1
1 Introduction
In 2015, the CER published its PR4 decision (CER/15/295) on the revenue that the DSO
could collect from its customers through DUoS tariffs over the 2016 to 2020 period. The
distribution revenues allowed under PR4 enables ESB Networks7 to; finance, build,
maintain, and operate electricity distribution network in Ireland.
In line with the PR4 decision, revenues are reviewed each year when setting DUoS
tariffs. This is to account for, among other things, more up to date forecasts; for example
updated customer numbers, and demand figures. It also sees adjustments pertaining to
the outcome of the previous two years – through so called K factors.
This year the review pertains to revenues for the calendar year 2018. This paper sets out
the results of that review and the resultant DUoS tariffs that will come into effect on 1st
October 2017. Distribution revenues are collected through the DUoS tariffs and are
charged to energy suppliers, who may choose to pass them on to their customers. At
present DUoS tariffs make up approximately 25% of a customer’s bill.
This paper also outlines the Distribution Loss Adjustment Factors (DLAFs) for the 12
month tariff period.
For information on the 2016-2017 tariff process please see CER’s Information note on
2017 Distribution System Operator allowed revenue, DUoS 2016/2017 tariffs &
Distribution Loss Adjustment Factors (CER/16/249)
7 The Distribution System Operator and the Distribution Asset Owner

Electricity Distribution Network Allowed Revenue 2018, Distribution Tariffs 2017/2018 & Distribution Loss Adjustment Factors
2
2 Background Information
2.1 DSO revenue control for the period 2016 to 2020
In December 2015, the CER published a decision paper detailing the level of DSO revenue
for the period 2016 to 2020 (CER/15/295). The allowed revenue set for each calendar year
of the period is shown in the figure 1 below in 2014 monies.
Figure 1: DSO allowed revenues 2016-2020
2.2 Yearly updates of calendar year revenue
The decision paper on DSO revenues for the 2016 to 2020 period, provided for yearly
updates of revenues. These updates are to be done when setting tariffs and consider
among others: more up to date forecasts and outturn figures for the previous two years.
The decision stated that the CER would publish an information note each year outlining
the effect of implementing these updates.
In addition to the publication of these information notes, an excel model (CER’s Revenue
Model) detailing the calculation of these updates is published. This model has been
developed by the CER. The model is completed each year in advance by the DSO (for
example, the 2018 calendar year revenue is updated in 2017), and submitted to CER for
review and approval. This process has been completed for the 2018 calendar year. An
updated model has been provided by the DSO and reviewed by the CER. The CER has
reviewed this model and is satisfied that the model correctly implements the decision
paper. Details on the updated approved revenue for 2018 are provided within section 3 of
this paper.
650.0
700.0
750.0
800.0
850.0
900.0
2016 2017 2018 2019 2020
DSO Allowed Revenue 737.1 817.1 835.8 857.7 883.2
Year on Year % increase 10.8% 2.3% 2.5% 3.0%
(2014 monies, €m)
DSO allowed revenues 2016-2020 (2014 monies, €m)
Electricity Distribution Network Allowed Revenue 2018, Distribution Tariffs 2017/2018 & Distribution Loss Adjustment Factors
3
2.3 Determination of DUoS tariffs for each tariff period
In recent years, the CER has approved DUoS tariffs on an annual basis to cover the
period from 1 October to 30 September. Essentially, DUoS tariffs are set to recover
26.7%8 of the revenues associated with the first calendar year included in the tariff period
and 73.3%8 for the second calendar year. For the DUoS tariffs set out in this information
note, and covering the tariff period 1 October 2017 to 30 September 2018, 26.7% of 2017
revenues and 73.3% of 2018 revenues are included.
2.4 Determination of DLAFs
Details on the DLAFs for the 1 October 2017 to 30 September 2018 period are provided
within section 5 of this paper. Information on the methodology which the DSO uses to
determine these values is available on ESBN’s website9.
8 This is based on the percentage of demand that relates to the relevant period of the year. 9 The methodology used by the DSO to determine DLAFs is available here.
Electricity Distribution Network Allowed Revenue 2018, Distribution Tariffs 2017/2018 & Distribution Loss Adjustment Factors
4
3 DSO revenue for the 2018 calendar year
3.1 Introduction
As outlined in section 2.1, in December 2015 the CER published the PR4 decision paper
(CER/15/295) detailing the level of DSO allowed revenue for the period 2016 to 2020.
That decision paper also detailed how the allowed revenue would be updated each year.
The PR4 decision provided for 2018 revenues, of €835.8m in 2014 monies. When
updated / inflated to 2018 monies, this leads to a nominal 2018 amount of €849.73m. The
adjustments to this figure, as detailed in this paper, have led to a reduced 2018 revenue
of €793.91m. This section provides details on the revenue submission provided by the
DSO and the calculations that led to this reduced revenue amount.
Further details can also be found in the following documents published alongside this
information note:
The DSO explanatory document detailing the adjustments made to the DSO
revenue based on inputs (i.e. GWh, inflation, and DSO outturn values for opex &
capex) provided by the DSO and agreed with CER.
“CER’s Revenue Model” (developed by the CER and completed by the DSO)
detailing the calculation of DSO revenues based on the revenue control formula
(in section 3.2) and the adjustments outlined in DSO’s explanatory note.
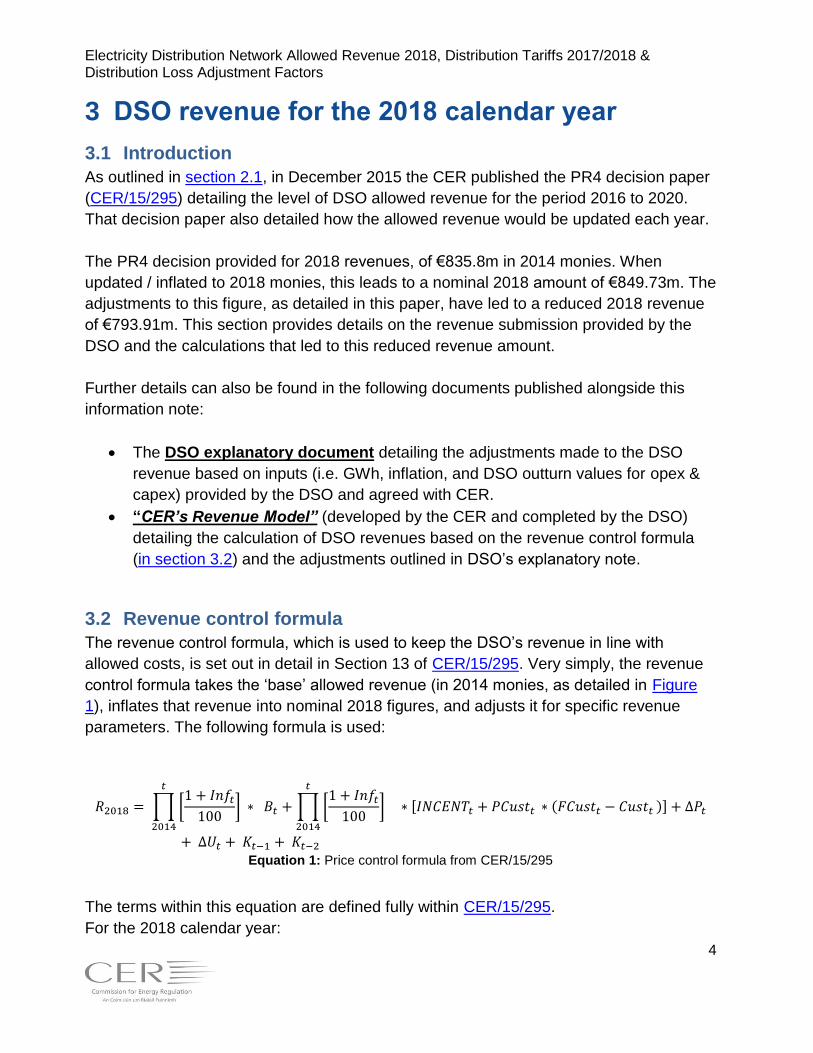
3.2 Revenue control formula
The revenue control formula, which is used to keep the DSO’s revenue in line with
allowed costs, is set out in detail in Section 13 of CER/15/295. Very simply, the revenue
control formula takes the ‘base’ allowed revenue (in 2014 monies, as detailed in Figure
1), inflates that revenue into nominal 2018 figures, and adjusts it for specific revenue
parameters. The following formula is used:
𝑅2018 = ∏ [1 + 𝐼𝑛𝑓𝑡
100]
𝑡
2014
∗ 𝐵𝑡 + ∏ [1 + 𝐼𝑛𝑓𝑡
100]
𝑡
2014
∗ [𝐼𝑁𝐶𝐸𝑁𝑇𝑡 + 𝑃𝐶𝑢𝑠𝑡𝑡 ∗ (𝐹𝐶𝑢𝑠𝑡𝑡 − 𝐶𝑢𝑠𝑡𝑡 )] + ∆𝑃𝑡
+ ∆𝑈𝑡 + 𝐾𝑡−1 + 𝐾𝑡−2
Equation 1: Price control formula from CER/15/295
The terms within this equation are defined fully within CER/15/295.
For the 2018 calendar year:

Electricity Distribution Network Allowed Revenue 2018, Distribution Tariffs 2017/2018 & Distribution Loss Adjustment Factors
5
R2018, the maximum level of revenue allowed in 2018, is €793.91 m;
When adjusting from 2014 to 2018 values, the relevant figures are multiplied by
1.01710;
B2018, the level of allowed revenue for the 2018 calendar year in real 2014 prices
as detailed in CER/15/295, is €835.8m;
INCENT2018, the difference in value of incentives/penalties earned in 2016 from
an assumed payment of €8m (in real 2014 prices) in 2016, is €011 (see section 3.7
for more information)
PCust2018, the revenue earned or foregone by the DSO for each additional
connection above or below forecasted levels, is €150,000;
FCust2018, the current forecast for new connections for the period 2017 to 2018, is
68,110;
Cust2018, the number of new connections assumed for the period 2017 to 2018 in
the determination of B2017, is 57,000;
P2018, the change in 2018 pass-through costs from those assumed in the
determination of B2018, is -€5.23m;
U2018, the change in 2018 uncertain costs from those assumed in the
determination of B2018, is -€25.01m;
Kt-1, the correction factor for 2017, is -€3.87m;
Kt-2, the correction factor for 2016, is -€26.93m;
These figures are explained in more detail in the following section and are broken down
further within table 2 (overleaf).
3.3 Explanation of k factors and adjustments to the 2018 revenue
B2018, the level of allowed revenue for the 2018 calendar year in 2014 monies as detailed
in CER/15/295, is €835.83. When adjusted for inflation the figure increases to €849.73 (in
2018 monies, i.e. nominal).
As a result of the revenue adjustments the DSO’s 2018 calendar year revenue amounts
to €793.91m. This represents a reduction of €56m (or 6.6 %) from the €849.73m that was
anticipated in PR4 (see figure 3 below). It leads to a reduction of €14.2m (1.7%)
decrease compared to the 2017 calendar year revenue of €808.1m (2017 monies).
10 HICP of -0.033%, -0.2083%, 0.7% and 1.2% for each of the years from 2015 to 2018. 11 No incentive targets have been set for the PR4 period, the CER and ESBN have agreed to remove the €8m incentive placeholder from the 2018 calendar year revenue

Electricity Distribution Network Allowed Revenue 2018, Distribution Tariffs 2017/2018 & Distribution Loss Adjustment Factors
6
Figure 3: Comparison of 2018 Nominal Revenues
Details of the adjustments that bring the 2018 revenues from €849.73m to €793.91 are
shown in table 2 (overleaf), which is followed by further written explanations.
The costs included in table 2 show the change in costs from those assumed in the five-
year revenue determination. Some costs items, known as uncertain costs, were not
explicitly dealt within the five-year control as they were not foreseen at that time. Such
cost items are captured in placeholders within the CER excel model that are specifically
designated for uncertain costs. Depending on how and when these cost are incurred
(e.g. depreciated over time) will dictate how and when the costs are accounted for within
the model. The values for 2018 correspond to the Ut in Equation 1. The values for 2017
and 2016 are fed into Equation 1 through the kt-1 and kt-2 factors, respectively. These
figures and the detail behind them have been reviewed by the CER and the CER is
satisfied that they should be included within the DSO revenue for the 2018 calendar year.
-
PR4 Revenues Inflated to 2018 Nominal, €m
849.73
2018 Nominal Revenue with CER Adjustments, €m
793.91
720735750765780795810825840855870
2018 Nominal €m
Comparison of 2018 Nominal Revenues

Electricity Distribution Network Allowed Revenue 2018, Distribution Tariffs 2017/2018 & Distribution Loss Adjustment Factors
7
k factors & adjustments to revenue for 2018, nominal €m
Adjustments relating to customer numbers,
indexation & GWhs
2016
(k-2)
2017
(k-1)
2018
(Ut) Total
Higher (lower) customer numbers relative to
those included in PR3 decision, nominal, €m -0.01 -0.01 0.17 0.15
Indexation & over-collection
Effect on total revenue of indexation being
different to forecast, nominal, €m -5.96 -14.38 0 -20.33
Revenue forecast for collection based on latest
demand assumptions (or outturn collected
where available), nominal, €m
-7.06 7.59 0 0.53
Incentives
Incentives, nominal, €m -8.00 0 0 -8.00
Pass-through costs, nominal, €m
Regulatory levy -0.24 0 0 -0.24
Rates -4.99 0 0 -4.99
Non-capitalised costs, nominal, €m
CER Safe Electric Campaign -0.08 0.45 0 0.37
Ampy Meters 0 2.01 0 2.01
LTCA Auditor 0 0.13 0 0.13
Aran Island Fault 3.20 0 0 3.20
Miscellaneous Incomes -4.01 0 0 -4.01
Smart Metering NBV Retirement 0 0 -11.50 -11.50
Capitalised costs, nominal, €m
Underspend capex: network (PR3) 0 0 -0.22 -0.22
Underspend capex: non network (PR3) -0.01 -0.02 0.98 0.95
Smart Metering 0.06 0.34 -14.45 -14.05
Total adjustment (excluding interest
adjustment), nominal, €m - 27.09 -3.89 -25.01 -55.99
Total adjustment (including interest
adjustment), nominal, €m -26.93 -3.87 -25.01 -55.81
Table 2: k factors and adjustments to revenue for 2018
3.4 Adjustments relating to customer numbers (+€0.15)
An increase of €0.15m has been applied to the 2018 revenue. This is driven by a higher
number of customer connections than forecasted in the PR4 determination. This is
Electricity Distribution Network Allowed Revenue 2018, Distribution Tariffs 2017/2018 & Distribution Loss Adjustment Factors
8
essentially the difference between forecasts, updated within year forecasts and actual
customer connections, for the years 2016, 2017 and 2018.
3.5 Adjustments relating to Indexation (-€20.33m)
A reduction of €20.33m has been applied to the 2018 revenue to allow for indexation
being different to forecast. This is essentially the difference between actual inflation and
the inflation forecasts that were used when setting the 2016 and 2017 calendar year
revenues. For example, the 2016 calendar year revenue is set in 2015 using 2016
inflation forecasts, and therefore must be updated in 2017 to reflect actual inflation.
3.6 Adjustments relating to under-collection (+€0.53m)
An increase of €0.53m has been applied to account for less revenues than forecasted
being collected through DUoS tariffs over 2016 and 2017. This is essentially the
difference between actual revenue collected and the revenue for collection forecasts that
were used when setting the 2016 and 2017 calendar year revenues. For example, the
2016 calendar year revenue is set in 2015 using 2016 revenue collection forecasts, and
therefore must be updated in 2017 to reflect actual revenue collected.
3.7 Adjustments relating to incentives (-€8m)
As part of the PR4 decision, the CER had planned to consult on the PR4 incentives
regime in a follow on consultation that will take place later this year. Therefore no
incentive targets have been set for the PR4 period. Notwithstanding, as agreed in the
PR4 decision, there are DSO incentive revenue placeholders of €8m for each of the PR4
years.
In advance of incentive targets being in place the CER considers it appropriate to remove
the €8m incentive placeholder for 2016. To do so, €8m must be removed from the 2018
revenue requirement. Therefore, payments related to incentives will have no impact on
the 2018 calendar year revenue.
As part of the follow on consultation the CER will decide on how to treat the PR4
incentive revenues.
Electricity Distribution Network Allowed Revenue 2018, Distribution Tariffs 2017/2018 & Distribution Loss Adjustment Factors
9
3.8 Adjustments relating to Non Capitalised Costs (+€9.8m)
3.8.1 Safe Electric Campaign (+€0.37m)
In 2016 ESBN collected €0.35m from DUoS customers to cover the estimated cost
of the Safe Electric advertising campaign. The actual cost of this campaign was
€0.27m resulting in a €0.08m adjustment to the 2018 calendar year revenues. In
addition, a figure of €0.45m has been included to cover the costs associated with
the Safe Electric advertising campaign in 2017. The estimated campaign cost for
2017 and the €0.08m underspend that pertains to 2016, results in a €0.37m
adjustment to the 2018 calendar year revenues.
3.8.2 Ampy Meters (+€2m Opex)
In 2017, to cover the cost of the recent Ampy Meter Replacement Programme,
ESBN requested the recovery of €7.5m (€5.5m capitalised and €2m non-
capitalised) to be collected from DUoS customers. This section will address the
€2m non-capitalised portion of this cost. For details on the capitalised portion of this
cost, please refer to the section 3.9.3 of this paper.
In 2016, ESBN identified 27,000 Ampy meters in service and at risk of failing. The
meter manufacturer advised ESBN of a failure rate of 4 -10% (i.e. out of the 27,000
meters identified, 1,080 to 2,700 of those meters were at risk). ESBN considered it
appropriate to replace all (27,000) identified meters.
Operational expenditure €2m: Due to the unforeseen nature of this incident and
there being no obvious operational allowance for such incidents, the CER considers
it reasonable to remunerate ESBN for their operational response to this particular
incident. The CER will allow ESBN to recover the €2m Opex, and this is included in
ESBN’s 2018 calendar year revenue.
3.8.3 LTCA Auditor (+€0.125)
An industry working group was set up within the Industry Governance Group (IGG),
to discuss Long Term Consumption Adjustments (LTCA). The group is made up of
suppliers and ESBN. To assist the group in their work, the CER allowed the
appointment of an Independent Auditor. The Auditor would carry out analysis on the
impact of residual errors on market participants. The CER has agreed that the
group can recover a maximum of €0.125m through the tariff k-factor process, this
cost must be efficiently incurred through competitive tender, and this will be
included in ESBN’s 2018 calendar year revenue.
.
Electricity Distribution Network Allowed Revenue 2018, Distribution Tariffs 2017/2018 & Distribution Loss Adjustment Factors
10
3.8.4 Aran Island Fault (+€3.2m)
The power to the Aran Islands is supplied via a subsea AC cable connected to the
grid on the mainland. The islands are then connected together via a subsea cable.
Inishmore is linked to the mainland, Inishmaan is linked to Inishmore, and Inisheer
is linked to Inishmaan.
In August 2016 a fault occurred on the cable between Inishmore and Inishmaan.
As a result, Inishmaan and Inisheer suffered a loss of power supply. To maintain
power to the islands, ESBN mobilised a medium voltage generator. Subsequently,
ESBN located and repaired the faulty section of cable in situ on the seabed. The
islands were reconnected to the grid 50 days after the initial fault.
In total the restoration of power to the islands resulted in non-capitalised cost of
€3.2m (€2.385m for cable repairs and €865,000 for maintaining power to the
islands). The CER reviewed the PR4 allowances, in particular the response capex
allowance and fault maintenance allowances.
Considering the uniqueness and complexity of the repair the CER considers that it
is appropriate to allow ESBN to recover the full amount of €3.2m.
3.8.5 Miscellaneous Incomes (-€4m)
ESBN proposed a credit of €4m against operating expenditure to reflect
miscellaneous incomes earned by ESBN. Miscellaneous incomes typically include
revenue from categories such as sale of scrap and profit on sale of assets. The
miscellaneous incomes of €4m will be removed from ESBN’s 2018 calendar year
revenue.
3.8.6 Smart Metering NBV Retirement (-€11.5m)
As part of the PR4 decision an allowance of €54.5m was allocated for the
accelerated depreciation of existing mechanical meters that were to be replaced
under the Smart Metering programme. ESBN do not expect to replace these meters
during 2018 as had been anticipated in PR4. The 2018 allowance of €11.5m will be
removed from ESBN’s 2018 calendar year revenue.
Electricity Distribution Network Allowed Revenue 2018, Distribution Tariffs 2017/2018 & Distribution Loss Adjustment Factors
11
3.9 Adjustments relating to Capitalised Costs (-€13.32)
3.9.1 PR3 Capex: outturn (€0.73 m) – as result of last year’s decision
This is based on a CER decision set out in CER/16/24912, in that paper the CER
allowed ESBN recover capital expenditure for various items. This has an impact of
€0.73m on ESBN’s 2018 calendar year revenues.
3.9.2 Smart Metering (-€14.05m) – as result of last year’s decision
This is based on a CER decision made last year in CER/16/24913. In that paper the
CER deferred a €100m placeholder, pertaining to the 2016 capital expenditure
allowance for the Smart Metering programme. Last year’s decision to defer the
€100m reduces ESBN’s 2018 calendar year revenues by €14.05m.
3.9.3 Ampy Meters (€0m Capex)
In 2017, to cover the cost of the recent Ampy Meter Replacement Programme,
ESBN requested the recovery of €7.5m (€5.5m capitalised and €2m non-
capitalised) to be collected from DUoS customers. This section addresses the
€5.5m capitalised portion of this cost. For details on the non-capitalised portion of
this cost, please refer to the section 2.8.2 of this paper.
Capitalised €5.5m: The CER considers the PR4 response capex allowance
(€54.7m) an appropriate allowance for capital funding of the Ampy Meter
Replacement Programme. The PR4 response capex allowance was provided for a
reactive work programme, that is generally driven by third parties or unplanned
events, and included a metering replacement allowance of €2.6m. The CER will not
allow ESBN recover the €5.5m14 capital cost associated with the Ampy Meter
Replacement Programme.
3.9.4 ISEM IT (€0m)
ESBN has requested additional IT capex to cover the ISEM IT costs. ESBN state
the full extent of the ISEM costs could not be known at the time of PR4. Therefore,
could not request an appropriate allowance to cover all of these costs.
12 Information note on 2017 Distribution System Operator allowed revenue, DUoS 2016/2017 tariffs & Distribution Loss Adjustment Factors 13 Information note on 2017 Distribution System Operator allowed revenue, DUoS 2016/2017 tariffs & Distribution Loss Adjustment Factors 14 If the CER allowed this cost it would be recovered over 45 years
Electricity Distribution Network Allowed Revenue 2018, Distribution Tariffs 2017/2018 & Distribution Loss Adjustment Factors
12
The CER does not consider it appropriate to include additional capex to PR4 IT
allowance, as the I-SEM High Level Design and significant elements on the detailed
design were known at the time of PR415.
3.10 Comparing 2018 with 2017 calendar year revenues
This year’s review of the 2018 revenue amounts has led to a reduction of € 56m or 6.6%
from the €849.73m (2018 nominal) as anticipated in PR4, to €793.91m (2018 nominal).
This represents a reduction of €14.2m or 1.7% compared to the 2017 calendar year
revenue of €808.1m (2017 nominal).
It is important to note that tariffs are not set on a calendar year basis. Consequently,
interested parties may find it more useful to compare the AUP between tariff periods as
discussed within section 4 of this paper.
15 The I-SEM HLD was published in September 2014.

Electricity Distribution Network Allowed Revenue 2018, Distribution Tariffs 2017/2018 & Distribution Loss Adjustment Factors
13
4 DUoS tariffs for 1 Oct 2017 to 30 Sept 2018
4.1 Revenue for recovery during Oct 2017 to Sept 2018
Section 2.3 provides detail on how portions of calendar year revenue are allocated for
recovery within the DUoS tariffs that are implemented from 1 October to 30 September of
the next calendar year.
The approved methodology sees 26.7% of 2017 calendar revenue (26.7% of €808.1m =
€215.76m) and 73.3% of 2018 calendar year revenue (73.3% of €793.9m = €581.9m)
being allocated to the tariff period 1 October 2017 to 30 September 2018. A total of
€797.7m is therefore to be recovered during the 1 October 2017 to 30 September 2018
tariff period. This represents a 0.23% increase relative to the €795.9m that was approved
for recovery during the equivalent period for the previous year (1 October 2016 to 30
September 2017).
4.2 DUoS tariffs for Oct 2017 to Sept 2018
The DUoS tariffs for the 1 October 2017 to September 2018 period have been calculated
by the DSO to allow recovery of the revenue16 detailed in section 4.1 of this paper (i.e.
€797.7m).
While the DSO does not collect its revenue on a per kWh basis, it is sometimes useful to
compare the Average Unit Price (AUP), that is, the total revenue divided by total kWhs,
when moving from one tariff period to another. The AUP for the 1 October 2017 to 30
September 2018 tariff period is 3.36c/kWh, a 1.07% decrease relative to the 3.40c/kWh
for the previous tariff period.
The CER’s current expectation is that the combined transmission and distribution
adjustments will result in the average annual residential customer’s bill rising by €2.77 in
October 2017, which is an increase of a 0.95%. However, the actual outcome for
customer prices depends, among other factors, on international fuel and related
generation costs, which are currently circa 50% of the overall cost of electricity to
customers.
DUoS tariffs for previous years are published on the CER website17. For convenience
there is a customer impact analysis showing the amount of DUoS paid by an average
16 Given certain customer number and GWh assumptions 17 The tariffs that are currently in place (covering the period 1 October 2016 to 30 September 2017) are available here

Electricity Distribution Network Allowed Revenue 2018, Distribution Tariffs 2017/2018 & Distribution Loss Adjustment Factors
14
customer (broken down by category) under the current and new tariffs is provided in
Appendix 1 of this paper. The percentage decrease in the tariffs always varies from the
AUP decrease calculated in the revenue model. The percentage decrease in DUoS tariffs
for 2017/18 will be on average 0.99%. The revenue model is based on the Total Revenue
Amount/GWh sales, whereas the DUoS tariff calculation takes account of customer
numbers and MIC’s as well as the GWh sales. It is also influenced by Large Energy User
(LEU) rebalancing, as per CER/10/198.

Electricity Distribution Network Allowed Revenue 2018, Distribution Tariffs 2017/2018 & Distribution Loss Adjustment Factors
15
5 Distribution Loss Adjustment Factors
The CER has approved Distribution Loss Adjustment Factors (DLAFs) for implementation
from 1 October 2017 to 30 September 2018. DLAFs are applied to the metered
consumption of relevant customers to apportion distribution losses to energy
consumption or production metered at end user sites. The DLAFs for 1 October 2017 to
30 September 2018 are published alongside this paper and are also provided below in
table 3.
The values from the previous period (October 2016 to September 2017) are available on
the CER website18 and for ease of reference have been provided in table 4 below.
Voltage Level Time Period
Composite Day Night
38kV Sales 1.020 1.021 1.017
MV Sales 1.036 1.038 1.031
LV Sales 1.087 1.092 1.074
Table 3: DLAFs for 1 October 2017 to 30 September 2018
Voltage Level Time Period
Composite Day Night
38kV Sales 1.020 1.021 1.017
MV Sales 1.035 1.037 1.030
LV Sales 1.084 1.090 1.072
Table 4: DLAFs for 1 October 2016 to 30 September 2017
18 The DLAFs for the October 2016 to September 2017 period are available here.
Electricity Distribution Network Allowed Revenue 2018, Distribution Tariffs 2017/2018 & Distribution Loss Adjustment Factors
16
6 Summary
This paper outlines:
The DSO allowed revenue approved for the 2018 calendar year;
The DUoS tariffs approved for implementation during the tariff period from 1
October 2017 to 30 September 2018; and,
The DLAFs approved for implementation during the period from 1 October 2017 to
30 September 2018.
The allowed revenue for the 2018 calendar year is €793.9m. The DUoS tariffs and
DLAFs that have been approved for implementation during the period from 1 October
2017 to 30 September 2018 are published alongside this paper.

Electricity Distribution Network Allowed Revenue 2018, Distribution Tariffs 2017/2018 & Distribution Loss Adjustment Factors
17
Appendix 1: DUoS payments made by average customer
The below table gives a customer impact analysis showing the amount of DUoS paid by
an average customer’s (broken down by category) under the current and new tariffs.
DUoS payments made by average customer
kWh MIC* Oct 16 - Sept 17 tariffs, €
Oct 17 - Sept 18 tariffs, €
Change €
Change %
DG1: Urban Domestic - Standard Meter
3,543 n/a 208.8 206.7 - 2.1 -0.99%
DG1: Urban Domestic - Dual Meter
6,045 n/a 230.6 228.3 - 2.3 -0.99%
DG2: Rural domestic - standard meter
3,852 n/a 251.8 249.3 - 2.5 -0.99%
DG2: Rural domestic - dual meter
11,765 n/a 462.3 457.8 - 4.6 -0.99%
DG3: Unmetered 22,246 n/a 750.4 742.9 - 7.4 -0.99%
DG5 with a standard meter
12,182 n/a 637.8 631.5 - 6.3 -0.99%
DG5 with a dual meter
35,169 n/a 1,347.0 1,333.7 - 13.3 -0.99%
DG6 290,843 118 10,635.7 10,530.7 - 105.0 -0.99%
DG7 3,255,680 1,044 24,430.0 24,188.8 - 241.2 -0.99%
DG8 19,398,202 4,437 64,868.3 64,228.0 - 640.3 -0.99%
DG9 1,142,062 2,848 24,586.4 24,343.7 - 242.7 -0.99%
* The average MIC of customers in DG6 - DG9 excludes DG (a) customers as they do
not pay capacity charges

Electricity Distribution Network Allowed Revenue 2018, Distribution Tariffs 2017/2018 & Distribution Loss Adjustment Factors
18
Appendix 2: Abbreviations & Terms
Abbreviations
& Terms Definition or Meaning
AUP
The Average Unit Price (AUP), that is, the
total revenue divided by total kWhs, when
moving from one tariff period to another.
DLAFs Distribution Loss Adjustment Factors
DSO Distribution System Operator
DUoS Distribution Use of System
ESBN ESB Networks
K factors
K factors are the correction factors, which
ensure that prices in 2017 are adjusted by
an amount equal to the difference
between what was actually charged in
year 2015 (k-2) or 2016 (k-1) and the
forecast of what should have been
charged.
PR 4 Price Review 4