electricity distribution - india
TRANSCRIPT

CASE STUDIES
PUBLIC PRIVATE PARTNERSHIP (PPP) IN Electricity Distribution
CASE STUDIES OF DELHI AND ODISHA
CASE STUDIES
PUBLIC PRIVATE PARTNERSHIP (PPP) IN Electricity Distribution
CASE STUDIES OF DELHI AND ODISHA

© The Energy and Resources Institute 2015
Suggested format for citationT E R I. 2015PPP Case StudiesNew Delhi: The Energy and Resources Institute. 64pp.[Project Report No. 2014ER03]
For more informationT E R I Tel. 2468 2100 or 2468 2111Darbari Seth Block E-mail [email protected] Complex, Lodhi Road Fax 2468 2144 or 2468 2145New Delhi – 110 003 Web www.teriin.orgIndia India +91 • Delhi (0)11
We would like to acknowledge and extend heartfelt gratitude to Tata Power Delhi Distribution Limited (TPDDL) and Feedback Energy Distribution Company Limited (FEDCO) for taking out time to provide data and arranging field visits to understand the ground level realities. We thank them for providing the required data and suggestions for successful completion of this study.
We would also like to thank Global Sustainable Electricity Partnership (GSEP) for providing support in carrying out this study. We would also like to thank the reviewers of this study, Mr K Ramanathan and Mr Gurudeo Sinha, for providing their guidance.
We would also like to acknowledge the support provided by TERI Press for copy editing and formatting.
Acknowledgments

PUBLIC PRIVATE PARTNERSHIP (PPP) IN ELECTRICITY DISTRIBUTION vi PUBLIC PRIVATE PARTNERSHIP (PPP) IN ELECTRICITY DISTRIBUTION vii
CASE STUDIESCASE STUDIES
AB Arial BunchAMR Automatic Meter Reading AMRDA Automatic Meter Reading Data AnalysisARR Annual Revenue Requirement ASAI Average System Availability IndexAT&C Aggregate Technical and Commercial BA Business AssociatesBBS Bulk Billing SoftwareBSES Bombay Suburban Electricity SupplyBSC Balanced Score CardBST Bulk Supply TariffCAPA Corrective and Prevention ActivitiesCAPEX Capital Expenditure CEA Central Electricity AuthorityCEG Corporate Enforcement GroupCEO Chief Executive OfficerCEO&A Chief Executive Officer & AdministratorCENNET Centre for Network ManagementCERC Central Electricity Regulatory CommissionCESCO Central Electricity Supply Company of Orissa CESU Central Electricity Supply UtilityCMRI Common Meter Reading InstrumentCRM Customer Relationship ManagementCSPPMG Corporate Strategy Planning and Performance Management GroupCSR Corporate Social ResponsibilityDA Distribution AutomationDEBS Decentralized Energy Billing SystemDERC Delhi Electricity Regulatory CommissionDESU Delhi Electricity Supply UndertakingDISCOM Distribution CompaniesDMS Distribution Management SystemDOA Distribution Operation AgreementDPCL Delhi Power Company LimitedDSM Demand Side ManagementDTL Delhi Transco LimitedDTRs Distribution TransformersDVB Delhi Vidyut BoardDVC Damodar Valley CorporationEAC Enforcement Assessment CellERDA Electrical Research and Development Association
EEI Edison Electric InstituteERP Enterprise Resource Planning FEDCO Feedback Energy Distribution Company LimitedFI&CO Finance and ControllingFIR First Information ReportFRSR Fundamental Rule Supplementary RuleFY Financial YearGENCO Generation CompanyGHS Grievance Handling SystemGIS Geographical Information SystemGNCTD Government of National Capital Territory of DelhiGRIDCO Grid Corporation of OrissaGSAS Grid Substation Automation SystemHT High TensionHR Human Resource ICWAI Institute of Cost and Works Accountants of IndiaIEX Indian Energy ExchangeIPGCL Indraprastha Power Generation Company LimitedISU Industry Solution for UtilitiesIT Information TechnologyIVR Interactive Voice ResponseJIF Joint Intervention ForumkW Kilo WattsLT Low TensionMES Military Engineering ServicesMIS Management Information SystemMM Material ManagementMMG Meter Management GroupMU Million Units MW MegawattMTD Meter Testing DepartmentNABARD National Bank for Agriculture and Rural Development NESCO Northern Electricity Supply Company of Orissa NDMC New Delhi Municipal CorporationNDPL New Delhi Power LimitedNHPC National Hydroelectric Power CorporationNPV Net Present ValueNSC New Service ConnectionNTPC National Thermal Power CorporationOERC Orissa Electricity Regulatory Commission
Glossary

PUBLIC PRIVATE PARTNERSHIP (PPP) IN ELECTRICITY DISTRIBUTION viii PUBLIC PRIVATE PARTNERSHIP (PPP) IN ELECTRICITY DISTRIBUTION ix
CASE STUDIESCASE STUDIES
OHPC Orissa Hydro Power CorporationOMS Outage Management SystemO&M Operation and Maintenance OPGCL Orissa Power Generation Corporation LimitedOPTCL Orissa Power Transmission Corporation LimitedOSEB Orissa State Electricity BoardPDC Primary Data CentrePLF Plant Load FactorPPCL Pragati Power Company LimitedPXIL Power Exchange of India LimitedRMS Repair and Maintenance Service RoE Return on EquityRPO Renewable Purchase ObligationsRPU Revenue Realization per UnitRST Retail Supply TariffRWA Residential Welfare Association SEBI Securities and Exchange Board of India SBM Secure Billing MachinesSAP System, Application and Product SCADA Supervisory Control and Data Acquisition SDC Secondary Data CentreSHG Self Help GroupSLDC State Load Dispatch CentreSLT Strategic Leadership Team SOUTHCO Southern Electricity Supply Company of Orissa SoQ Statement of QualificationSWOT Strength Weakness Opportunity and Threat TPDDL Tata Power Delhi Distribution LimitedT&D Transmission and DistributionTRANSCO Transmission CompanyUCC Unified Call CentreUSD US Dollar VOE Voice of EmployeeWESCO Western Electricity Supply Company of OdishaWSHG Women Self Help Group
PPP in Electricity Distribution — Case Studies of Delhi and OdishaIntroduction 1
Case Study - FEDCO1. Introduction 3
2. Historical background of electricity supply in Odisha 3
2.1 Restructuring and privatization 4
2.2 Financial health of CESU 6
3. Model for Public Private Partnership in CESU Area 7
3.1 Salient features of PPP 8
3.2 Selection of franchisee for the study 9
3.3 Condition of distribution in Circle - II at the time of takeover 9
4. Results achieved 10
5. Initiatives undertaken 10
5.1 Process re-engineering 11
5.2 Strong Customer Relationship Management 11
5.3 Fuse off call centers 11
5.4 Verifying complaint resolution 11
5.5 Cross verification of records 12
5.6 Cross verification of complaint resolution 12
5.7 Issue of new connections 12
5.8 Informing consumers about power cuts 13
5.9 Monitoring customer care centers 13
5.10 Capacity building of customer care executives 13
5.11 Metering and billing 13
5.12 MECOMS billing software 13
5.13 Energy audit software 14
5.14 Strengthening the network along with AMR metering of DTRs 14
5.15 Meter installation/replacement programme 14
Contents

PUBLIC PRIVATE PARTNERSHIP (PPP) IN ELECTRICITY DISTRIBUTION x PUBLIC PRIVATE PARTNERSHIP (PPP) IN ELECTRICITY DISTRIBUTION xi
CASE STUDIESCASE STUDIES
5.16 Theft control 15
5.17 Involving local community 15
6. Key takeaways 16
Case Study - TPDDL
1. Introduction 17
2. Historical background of electricity supply in Delhi 17 2.1 Restructuring of DVB 18
3. Model for Public Private Partnership for Electricity Supply in Delhi 19 3.1 Salient features of PPP model of electricity distribution in Delhi 19 3.2 Selection of PPP partner (distribution licensee) for the study 22 3.3 Condition of distribution business at the time of takeover 22
4. Results achieved 23
5. Initiatives undertaken 24 5.1 Managerial initiative 24 5.2 Technical initiative 26 5.3 Financial commitment 30 5.4 Consumer centric initiative 30 5.5 Enriching the employee’s experience 31 5.6 Measures for theft control 32
6. Other initiatives 33
7. Accolades received/ awards won for excellence 34
8. Key takeaways 35
ConclusionsOverall Conclusions 36
Tables
Table 1 T&D and AT&C losses level of OSEB over the years (in %) 3
Table 2 Face value and the highest bid value under the bidding process (in million USD) 5
Table 3 The Actual energy purchase, sales, and losses of CESU for FY 2009–10, FY 2012–11, FY 2011–12, FY 2012–13 5
Table 4 Year on year financial losses of CESU between FY 2007–08 to FY 2011–12 7
Table 5 Billing and Collection efficiency and the AT&C loss in Circle-II during FY 2011–12 9
Table 6 Issue of new connection and meter replacement for single phase and three phase consumers 17
Table 7 Year on year AT&C loss reduction trajectory proposed by GNCTD and that proposed by successful bidder in the three circles of DVB 20
Table 8 Year on year subsidy support extended by GNCTD to the three distribution licensees through Transco (in million USD) 21
Table 9 T&C loss computed by DERC for the three distribution license for the FY 2002 22
Table 10 Improvement in operational performance parameter of TPDDL between July 2002 and FY 2013 24
Table 11 Improvement in the customer service of TPDDL between July 2002 and FY 2013 24
Table 12 Modules of SAMBANDH 28
Table 13 CAPEX incurred between FY 2002–11 (in million USD) 30
Table 14 Cases filed, billed amount, and amount recovered over the years 33
Table 15 Accolades received by TPDDL over the years 34

PUBLIC PRIVATE PARTNERSHIP (PPP) IN ELECTRICITY DISTRIBUTION xii PUBLIC PRIVATE PARTNERSHIP (PPP) IN ELECTRICITY DISTRIBUTION 1
CASE STUDIESCASE STUDIES
Figure 1 Area of operation of CESU and FEDCO 9
Figure 2 The AT&C loss of the franchized area between the FY 2012 and FY 2014 10
Figure 3 The billing and collection efficiency of the franchized area in FY 2012 and FY 2014 10
Figure 4 Online Software for NSC Ticket Generation (FEDCO) 12
Figure 5 Geographical spread of Delhi 17
Figure 6 T&D loss and financial loss of DESU/ DVB between the FY 1996 to FY 2002 18
Figure 7 Specified bid AT&C loss, accepted AT&C loss and actual AT&C loss reduction achieved between FY 2003 and FY 2007 23
Figure 8 Year wise AT&C loss level approved by the DERC and AT&C loss level achieved by TPDDL 23
Figure 9 Various aspects of system upgradation undertaken by TPDDL 27
Figures PPP in Electricity Distribution: Case Studies of Delhi and Odisha
IntroductionThe Electricity Act, 2003 aimed to bring in a paradigm shift in the functioning of the power sector, distancing the sector from direct government control, corporatizing the sector and bringing it under the control of independent regulators. While generation was completely delicensed, transmission and distribution became licensed business. The Regulatory Reforms aimed at making the sector sustainable through introduction of competition, encouraging efficiency and economy, tariff rationalization and balancing the needs of consumers as well as industry. Various steps with respect to public private partnership have been initiated and met with success. Two different models of Public Private Partnership (PPP) which have been successful are discussed in this study. The first is through equity sharing model with majority stake and management control by the private owner and the private owner being handed over the distribution license through a transparent bidding process ( as in Delhi where Tata Power Delhi Distribution Limited (TPDDL) and BSES Rajdhani Power Limited (BRPL), and BSES Yamuna Power Ltd (BSEY) have been granted distribution licensee in their respective areas). The second is through a franchisee model where a franchisee has been defined in The Electricity Act, 2003 as “a person authorized by a distribution licensee to distribute electricity on its behalf in a particular area within his area of supply”. Thus, while the franchisee distributes electricity on behalf of the distribution utility, the overall responsibility of distribution still remains with the utility.
PPP brings in two very important elements for sustainability of the sector — finance and new set of management practices. It is important to study some of the successful PPP in the distribution sector to understand the factors affecting the success of the PPP in the sector. To capture these aspects the two cases of — the implementation of PPP in Delhi (Tata Power Delhi Distribution Ltd) and in Odisha (Feedback Energy Distribution Company Ltd) have been studied.
The study brings out the factors contributing to the success as well as the challenges faced during the implementation of PPP in electricity distribution and importance of encouraging PPP in the distribution segment. Through these two case studies of Tata Power Delhi Distribution Ltd (TPDDL) and that of Feedback Energy Distribution Company Ltd (FEDCO), ïnvolve performance on key performance parameters related to technical and financial aspects including distribution losses, O&M expenses, collection efficiency, consumer metering, distribution transformer failure rate, protection of consumer interest, etc. have been carried out. This study will serve as a guideline for future implementation of PPP model in the Power Sector.

PUBLIC PRIVATE PARTNERSHIP (PPP) IN ELECTRICITY DISTRIBUTION 3
CASE STUDIESCASE STUDIES
Case Study: FEDCO
1. IntroductionThe state of Odisha (formerly known as Orissa) was established on April 1, 1936, as a province in British India. Bhubaneswar is the capital of Odisha. The total population of the state is approximately 4.19 million, making it the 11th most populous state of the country. With a geographical area of 155,707 km², the state is the ninth largest state of the country. Approximately 65 per cent of the work force of the state is involved in agriculture1. Odisha has abundant natural resources and a large coastline. This large coastline increases the risk of floods and cyclones which impede the development of the state. The electricity sector of the state also bears negative impact of these floods and cyclones.
2. Historical background of electricity supply in OdishaThe Odisha State Electricity Board (OSEB) was established in the year 1961, under the Electricity Supply Act 1948, with the responsibility of making electricity available to the consumers in Odisha. It worked as an integrated utility under the Electricity (Supply) Act 1948. Over the years financial health of OSEB deteriorated due to various factors. However, it survived with the help of financial support provided by the State government. By Financial Year (FY) 1993–94, the gap between peak demand and supply had reached almost 45 per cent2. In FY 1994-95, the Plant Load Factor (PLF) for state-owned generation plants stood at 34.9 per cent3. On the distribution front the end consumer tariff was only at 82.8 per cent of the cost of supply. In FY 1995–96, the state subsidy payable for power was approximately USD 61.5 million. The Aggregate Technical and Commercial (AT&C) loss of OSEB was also very high. Between FY 1990–91 to FY 1995–96, the AT&C loss of OSEB ranged between 49.02 per cent and 52.1 per cent, while the Transmission and Distribution (T&D) losses during the same period were reported to be between 41.57 per cent to 46.9 per cent as has been indicated in Table 1 below.
Table 1: T&D and AT&C loss levels of OSEB over the years (in %)
Years T&D losses AT&C loss
1990–91 45.30 52.10
1991–92 44.80 49.02
1992–93 45.01 49.05
1993–94 41.57 49.7
1994–95 46.59 49.7
1995–96 46.94 51.1Source: http://orissa.gov.in/e-magazine/Orissareview/2012/April/engpdf/53-62.pdf
1 Orissa Agriculture at a Glance, Agriculture Department, Government of Odisha, Available at http://agriodisha.nic.in/pdf/Agriculture%20At%20a%20Glance.pdf (last accessed on September 16, 2014).
2 Power Sector Reforms in Orissa: A Case Study in Restructuring, Available at http://planningcommission.nic.in/plans/stateplan/sdr_orissa/sdr_orich13.doc (last accessed on October 28, 2014.
3 Power Sector Reforms in Orissa: A Case Study in Restructuring, Available at http://planningcommission.nic.in/plans/stateplan/sdr_orissa/sdr_orich13.doc (last accessed on October 28, 2014.

PUBLIC PRIVATE PARTNERSHIP (PPP) IN ELECTRICITY DISTRIBUTION 4 PUBLIC PRIVATE PARTNERSHIP (PPP) IN ELECTRICITY DISTRIBUTION 5
CASE STUDIESCASE STUDIES
As per an estimate prior to the FY 1996, the Government of Odisha was providing an annual subsidy of USD4 41.67 million5 to the OSEB. In the year 1995, the state realized that it is very important to attract private funds for the development of the electricity sector of the state which was reeling under power shortfall and high losses. The situation was untenable and required immediate steps to improve the electricity sector. In view of the existing four factors — the socio-economic conditions of the state, the Government’s lack of funds for the development of power sector programmes, the deteriorating performance of the power sector, and The World Bank funding conditions — it was decided by the Government of Odisha to implement comprehensive reforms in the power sector.
2.16 Restructuring and privatization The reform process in Odisha started with the enactment of Odisha Electricity Reforms (OER) Act, 1995 on November 28, 1996. The OER Act was enacted for the purpose of restructuring the electricity industry, for taking measures conducive to rationalization of generation, transmission, and supply system and for opening avenues for participation from private sector entrepreneurs and for the establishment of a Regulatory Commission independent of the State government and power utilities6. The Act allowed transfer of assets, liabilities, staff, and statutory obligations of the OSEB to the successor companies.
On August 1, 1996, the Odisha Electricity Regulatory Commission (OERC)7, constituted as the apex body responsible for overseeing the development of electricity sector of the state, started its operation. OERC was the first independent Electricity Regulatory Commission in India. OERC was constituted to ensure achievement of objectives given in the OER Act, 1995, which came into force on April 1, 1996.
In 1996, OSEB was unbundled into the business of generation, transmission, and distribution. The thermal power stations were transferred to the existing Odisha Power Generation Corporation (OPGC). The business of hydel generation was transferred to the newly created Odisha Hydro Power Corporation (OHPC) while the transmission and distribution business was given to Grid Corporation (GRIDCO) of Odisha. At this time the total installed generation capacity of the state was 2120MW of which thermal generation was 1700MW and the rest was hydel generation8. Both OHPC and GRIDCO commenced their operation on April 1, 1996 and remained a government-owned entity. Further, for smooth running of operations the distribution business was divided into four zones, namely west zone, north zone, south zone, and central zone. Even after corporatization, the high losses of the distribution segment continued.
In October 1996, as a pilot project, GRIDCO handed over the management of central zone to Bombay Suburban Electricity Supply (BSES) under the Distribution Operation Agreement (DOA). As per the agreement, BSES was to provide the management of central zone in consideration for a fee along with incentive based on measurable improvement in collection and metering. However, the arrangement failed to provide positive results. The increase in collection between April and September of FY 1996 was 22 per cent against the increase in collection of 51 per cent reported during the same period during prior period of FY 19959. BSES reportedly faced challenges in running the operations without being given full control on the business10 and in controlling the staffs of GRIDCO who were provided to BSES for carrying the contract arrangement as they continued to be direct employees of GRIDCO11. In view of this failed experiment and the increasing losses, the Government of Odisha decided to scrap the DOA and
4 The USD to INR conversion has been taken as USD 1=INR 60
5 Power Sector Reforms in Odisha: Major Issues and Challenges, Padmalochan Rout, April 2012
6 Power Scenario in Orissa: An Overview, Dr G B Rout, Available at http://orissa.gov.in/e-magazine/Orissareview/nov2004/englishPdf/powerscenarioinorissa.pdf (last accessed on October 10, 2014)
7 Available at http://www.foir-india.org/aboutus.html (last accessed on September 18, 2014)
8 The Unravelling of the Reform Experiment in Orissa: A Case of Facile Assumptions, Glaring Fallacies ,and Unrealistic Targets, by Sudha Mahalingam
9 Privatization of Electricity Distribution: The Orissa Experience, K Ramanathan et.al , TERI, 2004
10 Power Sector Reforms in Orissa: A Case Study in Restructuring, Planning Commission, Government of India
11 Privatization of Electricity Distribution: The Orissa Experience, K Ramanathan et.al, TERI, 2004
decided to divest its stake in the entire distribution operation instead of just placing the management in the hands of private players. As a first step towards privatization, in November 1998, the Government of Odisha corporatized the four distribution zones as 100 per cent subsidiaries of GRIDCO thereby forming the four distribution utilities, namely WESCO, NESCO, SOUTHCO, and CESCO. The four utilities were provided with a clean balance sheet i.e., the accrued losses of the distribution were not passed to the distribution utilities but were retained by GRIDCO. With an aim to disinvest the 51 per cent share of GRIDCO, amongst the distribution companies, a bidding process was initiated in November 1998. After scrutiny, 11 companies/ consortiums were qualified to participate in the privatization process out of thirteen companies/consortiums who submitted their Statement of Qualification (SoQ).
Three of the pre-qualified bidders dropped out after undertaking due diligence of the system and another four dropped out for various reasons including Asian economic crisis, Pokhran — II nuclear blast conducted by India, regulatory risk associated with the project, etc.12 Only three companies/ consortiums submitted their technical and financial bid, namely BSES Ltd, TEC-Viridian consortium, and Singapore Power — Grasim Industries consortium for three distribution companies namely, WESCO, NESCO, and SOUTHCO. By April 1999, the management of these three distribution companies were handed over to BSES. No bid was received, for CESCO. A second round of bidding was invited for privatization of CESCO. Based on the bids received TEC-Viridian consortium was declared the winner subject to clarification from the consortium that they would not require financial support from GRIDCO to reduce any shortfall in revenue of CESCO. The face value and the competitive offer received by the successful bidder for the four distribution corporations have been indicated in Table 2 below.
Table 2: Face value and the highest bid value under the bidding process (in million USD)
DISTCO 51% face value Highest bid offer value Winner of bid
WESCO 41.35 9.09 BSES
NESCO 5.61 5.60 BSES
SOUTHCO 3.2 4.8 BSES
CESCO 6.18 6.8 TEC
Source: Privatization of Electricity Distribution: The Orissa Experience, K Ramanathan et.al, TERI, 2004
However, the TEC-Viridian consortium did not agree to this condition and decided to walk out of the deal. Subsequently, negotiations were carried with pre-qualified bidders. CESCO was offered to the pre-bid qualifying companies. After much deliberation, the consortium of AES and Jyothi Structures Ltd offered to takeover CESCO and provided some of their new terms and conditions which were accepted by GRIDCO. The new terms proposed by AES were as follows:
� GRIDCO to open an escrow account in favour of AES Ib Valley Project (a subsidiary of AES)
� Acceptance of the offer of another AES subsidiary to purchase 2 per cent share in OPGC
As the terms proposed by AES were accepted by the State government in September 1999, CESCO was taken over by AES on a consideration of USD 7 million13. During the process of takeover of CESCO by AES, it was noted that CESCO was incurring a loss of about USD 1.5 million14 daily.
At the end of the privatization process, private companies held 51 per cent share in the distribution companies while GRIDCO had a share holding of 39 per cent. The rest 10 per cent of shareholding was with the employees trust.15
12 Privatization of Electricity Distribution: The Orissa Experience, K Ramanathan et.al , TERI, 2004
13 Available at http://energy.odisha.gov.in/Power_Sector_Reforms.asp?lnk=22
14 Privatization of Electricity Distribution: The Orissa Experience, K Ramanathan et.al, TERI, 2004
15 Power Sector Reforms in Odisha: Major Issues and Challenges, Padmalochan Rout

6 PUBLIC PRIVATE PARTNERSHIP (PPP) IN ELECTRICITY DISTRIBUTION 7
CASE STUDIESCASE STUDIES
Before the FY 1996 the annual subsidy being doled by the State government was approximately USD 41.7 million on the average.16 It is expected that within the first five years of operation i.e., between FY 1996 and FY 2001, the Government of Odisha saved USD 461.67 million which it would have provided to the distribution companies as subsidies17.
With the introduction of reform process it was expected that WESCO & NESCO would achieve turnaround by FY 2000, SOUTHCO by FY 2001, and CESCO by FY 2002.18 However all the utilities continue to be in loss. Though BSES continues the business in all the three distribution utilities it took over, CESCO has witnessed changes in its operations. Due to the various issues associated with the operations, in August 2001 the OERC stepped in by appointing a Chief Executive Officer (CEO) under its direct supervision to carry the management of CESCO. OERC revoked the license of CESCO with effect from April 1, 2005 and appointed a CEO and Administrator (CEO&A) to discharge the licensed activity. In September 2006, the Commission formulated a scheme, “Central Electricity Supply Utility (CESU) of Odisha (O&M) Scheme” for carrying out O&M of the utility, in public interest.19 As per the provisions of the Scheme all assets, liabilities, rights, proceedings, and manpower of CESCO were transferred to CESU. Further, CESU was authorized to carry out the business of distribution of electricity in accordance with license conditions in respect of area assigned to erstwhile CESCO. The Commission constituted a Management Board and a Utility Advisory Committee to look after electricity supply functions and customers’ services.
With the introduction of Central Electricity Supply Utility (CESU) of Odisha (O&M) Scheme and appointment of CEO&A, CESU has been converted to a public utility.
Further by the end of March 2004, Odisha Power Transmission Corporation Ltd (OPTCL), a public-owned company was incorporated by GRIDCO to carry on the business of intra-state transmission, and State Load Dispatch Center (SLDC) functions. Thus, GRIDCO was left to carry bulk supply of electricity and trading functions.
2.2 Financial health of CESUAs has been indicated above, the experience of privatization of CESCO has not been encouraging. The losses of CESU continued to be high in the first five years of operation of CESU. An average loss reduction of 1.08 per cent in five years the overall AT&C loss remained above 38 per cent as indicated in Table 3 below.
Table 3: The Actual energy purchase, sales, and losses of CESU for FY 2009–10, FY 2010–11, FY 2011–12, and FY 2012–13
Energy purchase (MU)
Energy sales (MU) Distribution losses (in %)
Collection efficiency (in %)
AT&C losses (in %)
2009–10 6232.68 3775.03 39.43 93.10 43.56
2010–11 7069.34 4372.65 38.15 96.00 41.00
2011–12 7791.00 4787.43 37.96 97.00 39.99
2012–13 7738.84 4836.77 37.50 99.00 38.13
Source: Tariff orders of OERC issued for various years
Due to the high AT&C loss, CESU incurred a cumulative loss of around USD 256.24 million during FY 2011–12. The losses incurred by the utility between FY 2007–08 and FY 2011–12 has been indicated in Table 4.
16 Power Sector Reforms in Odisha: Major Issues and Challenges, by Padmalochan Rout. Available at http://orissa.gov.in/e-magazine/Orissareview/2012/April/engpdf/53-62.
17 Privatization of Electricity Distribution: The Orissa Experience, K Ramanathan et.al, TERI, 2004
18 Privatization of Electricity Distribution: The Orissa Experience, K Ramanathan et.al, TERI, 2004
19 Available at http://www.cescoorissa.com/organisation.html (last accessed on September 18, 2014)
Table 4: Year on year financial losses of CESU between FY 2007–08 to FY 2011–12
FY 2007–08 2008–09 2009–10 2010–11 2011–12
Losses 14.23 2.08 2.44 1.45 4.2
Source: Base Paper on engagement of input based franchisee with IBF-IRS model in 15 Divisions of CESU, OERC, November, 2012
Because of the negative net worth, it was becoming difficult for CESU to avail loan from the financial institutions to take up developmental and consumer care activities. This made it necessary for the utility to undertake out of the box thinking and come up with novel solutions to handle the situation.
3. Model for Public Private Partnership in CESU areaOver the years CESU had been experimenting with various techniques and technologies to reduce its overall AT&C loss. A franchisee institution is one such mechanism through which the utility has been involving the local community to ensure better service delivery to the consumers and to decrease its losses. By FY 2012 around 0.448 million consumers of CESU were covered under franchisee (see Box 1) which included Women Self Help Group (WSHG), Retired Employee Association, and Consumer Forum, etc. These franchisees have different roles and responsibilities. Though the utility was looking forward to the involvement of franchisee, the institutions operating at local level were small in nature and as such were not in a position to infuse funds to augment distribution system and system improvement.
Several other pilot projects were also undertaken to assess their impact and possibility to replicate in other areas also. Under one such pilot project, CESU successfully demonstrated that concerted effort at distribution system beyond distribution transformer level (11 kV/412 V) may lead to a decrease in losses from 75 to 19 per cent in a year through proper meter reading and billing of all the consumers and curtailing theft of electricity.20 However, the utility was not able to replicate this effort due to paucity of funds which was an impediment to undertake various activities like metering, Arial Bunch (AB) cabling, Automatic Meter Reading (AMR) system for high value consumers, etc. Thus, it was envisaged to implement a Public Private Partnership (PPP) model to achieve the task i.e., by involving private player as a partner of the utility in curtailing theft in high loss making areas and share the benefits of loss reduction with the private players. With this in view, utility identified 15 divisions, which were part of five electrical circles, namely Dhenkanal Circle, Circle – I, Circle – II, Cuttack Circle, and Paradeep Circle, where loss levels were very
20 Base paper on “Engagement of input based franchisee with incremental revenue sharing (IBF-IRS) model in fifteen divisions of CESU” published by CESU, November 2012
Box 1: Concept of franchiseeThe Electricity Act 2003 defines Franchisee as “A person authorized by
a distribution licensee to distribute electricity on its behalf in a particular
area within his area of supply”. A “person” has been defined to include
“any company or body corporate or association or body of individuals,
whether incorporated or not, or artificial juridical person”. As such,
a “person” may be an individual, a company, Non-Governmental
Organization (NGO), a Self Help Group (SHG), or a local government
like village panchayat, etc.
Within this framework, various models of franchisees ranging from
simple Revenue Based Collection model to the complex Input Based
Franchisee (IBF) model have been implemented.
Under simple revenue based collection franchisee model, the franchisee
may be involved in meter reading, bill distribution, and collection of
revenue from consumers, besides providing minor repair activities. The
franchisee is compensated according to predefined terms. Under IBF,
the franchisee may purchase electricity at a predetermined rate from
the licensee and sell it to the consumer at regulated tariff. Depending
upon the contract with the utility, the franchisee may undertake minor or
major maintenance activities or system augmentation also.

PUBLIC PRIVATE PARTNERSHIP (PPP) IN ELECTRICITY DISTRIBUTION 8 PUBLIC PRIVATE PARTNERSHIP (PPP) IN ELECTRICITY DISTRIBUTION 9
CASE STUDIESCASE STUDIES
high and the revenue realization per unit (RPU) against electricity being supplied by the utility was much less than the bulk supply tariff (BST) (i.e., rate at which utility purchased power from GRIDCO). As per the utility during first half of the FY 2011–12, average RPU achieved for these 15 divisions was Rs 1.57 against average power purchase cost of Rs 2.44. In other words, CESU was recovering only Rs 1.57 per unit of electricity it was supplying while it paid Rs 2.44 to GRIDCO from where it purchased power. In addition to the above loss, the employee, A&G, and R&M cost, etc., incurred by CESU for making services available to the consumers also remained unrecovered.
Under the guidance of Honorable OERC, discussions were held with private players to develop a model which could be implemented in these loss making areas. It was necessary to have a PPP model which would be easy to adopt with no social or political resistance and that which provides the advantage of private funds and private management for the franchized area. Discussions led to the development of Input Based Franchisee (IBF) with Incremental Revenue Sharing (IBF–IRS) model. In FY 2012, bids for the appointment of IBF–IRS model in five identified circles were invited. The bidding was carried out on the basis of fixed loss reduction trajectory proposed by the bidder and year on year percentage sharing of incremental revenue between CESU and IBF–IRS for achievement above base line. Based on the bidding, Shyam Indus was selected for the implementation of IBF–IRS in division of Dhenkanal, Circle – I and Cuttack circles; Feedback Energy Distribution Company Ltd (FEDCO) in Circle – II, and Enzen Global Solution Pvt. Ltd in Paradeep circle. The terms and conditions of the agreement were same for all the four franchisees.
3.1 Salient features of PPP It was decided to institute the IBF–IRS for a fixed tenure of five years in the identified areas. The aim of IBF–IRS was to decrease the losses in the franchized area from the existing level to 15 per cent within the contract duration i.e., five years. The salient features of managerial and financial model of IBF–IRS has been given below.
Managerial Model
� Franchisee is given the right to use distribution asset of CES without any charges
� Franchisee is envisaged to undertake all activities related to service delivery beyond Distribution Transformers (DTRs) at its own cost and resources
� Franchisee is tasked with consumer services including legalization of connections, augmentation of LT distribution system, meter installation/ replacement, meter reading, bill generation and distribution, complaint handling, and providing call center services
� Franchisee is required to undertake energy audit/ accounting and load forecast on regular basis
� Franchisee also accepts responsibility to generate awareness amongst public on various aspects of electricity delivery including, demand side management (DSM), theft of electricity, complaint filing, etc.
� The utility agrees to make available adequate amount of power to meet the demand of the consumers in franchized area
� The utility is also required to carry out necessary maintenance / augmentation of distribution network from consumer supply point up to DTR and to carry out capital work execution in the franchized areas as per the Government’s commitment, if any, obtained from time to time
� Protection of the service condition of utility employees made available to franchisee on deputation
Financial Model
� Maximum net present value (NPV) obtained due to incremental loss reduction proposed by the franchisee over the life of the project was considered as the basis for the selection of franchisee
� Sharing of incremental revenue, beyond base line RPU, between franchisee and utility in the ratio proposed by the franchisee on annual basis for the duration of the contract
� The baseline figures are to be revised, based on the revision of retail supply Tariff (RST) during the contract period
� The compensation of franchisee is to be calculated based on the formulae developed for the purpose. The calculation of compensation of franchisee, has been detailed in Box 2.
3.2 Selection of franchisee for the study
Based on the discussion with various stakeholders including, CESU, OERC, and FEDCO, the franchisee operating in Circle – II, was identified for conducting the study. Figure 1 depicts the districts of Odisha in which CESU is the licensee and districts marked in blue indicate the area of operation of FEDCO.
3.3 Condition of distribution in Circle - II at the time of takeoverThe Circle - II covers the four divisions, namely Puri, Khordha, Balugaon, and Nayagarh. These four divisions together have a geographical spread of over 9,000 sq. km which is approximately one third of the total geographical spread of CESU. At the time of takeover the AT&C loss of Circle – II was 57.14 per cent. With 67.06 per cent, Puri division had the highest AT&C loss while the Khordha division had lowest AT&C loss amongst the four divisions as indicated in Table 5.
Table 5: Billing and collection efficiency and the AT&C loss in Circle-II during FY 2011–12
Division Input energy (MU)
Billing efficiency (%)
Collection efficiency (%)
AT&C loss (%)
RPU (Rs/Unit)
Puri (PED) 187.92 46% 71% 67.06% 1.53
Nayagarh (NED) 104.76 60% 73% 56.12% 1.75
Khordha (KED) 229.69 57% 91% 47.72% 2.71
Balugaon (BED) 93.97 46% 79% 63.98% 1.52
Total 616.34 53% 81% 57.14% 2.01
Source: Base paper on “Engagement of IBF–IR Model in 15 divisions of CESU”, November 2012, ESU
Box 2: Computation of compensation of franchiseeThe revenue collected from consumers consists of energy charges, miscellaneous income (including meter reading, connection, and disconnection charges, etc.) from consumers connected by utility, miscellaneous income from consumers connected by franchisee and the government taxes, duties cess, etc. First, the government dues are removed from the overall collection. Then all the miscellaneous income attributed to the consumers connected by the utility and by the franchisee are segregated and provided to the utility and the franchisee, respectively. The remaining is the energy charges collected from the consumers. The energy charged is normalized for the changes in the tariff over the base line year. Then incremental revenue over and above the base line RPU is computed. The incremental revenue is then divided between the utility and the franchisee as per the ratio proposed by the franchisee in its bid. The portion of the incremental revenue computed for the franchisee is added to the miscellaneous charges attributed to the consumers connected by the franchisee to obtain the overall compensation of the franchisee.
Figure 1: Area of operation of CESU and FEDCO
Kendrapara
Jagatsinghpur
Puri
Khordha
Cuttack
DhenkanalAngul
Nayagarh
N

PUBLIC PRIVATE PARTNERSHIP (PPP) IN ELECTRICITY DISTRIBUTION 10 PUBLIC PRIVATE PARTNERSHIP (PPP) IN ELECTRICITY DISTRIBUTION 11
CASE STUDIESCASE STUDIES
4. Results AchievedThe franchisee reported a loss reduction of 5 per cent, 5 per cent, 4 per cent, and 7 per cent in the Khordha, Puri, Balugaon, and Nayagarh division respectively21 against the baseline parameters of FY 2012. The billing efficiency, collection efficiency, and AT&C loss level achieved by the franchisee in respective four divisions of operation have been provided in Figure 2 and 3 below.
Figure 2: The AT&C loss of the franchized area between the FY 2012 and FY 2014
Figure 3: The billing and collection efficiency of the franchized area in FY 2012 and FY 2014
As is evident from Figure 3, by FY 2014, the billing efficiency in Nayagarh division witnessed an improvement of 7 per cent over the base year figure of FY 2012. Due to increased billing efficiency, even though the collection efficiency has remained at the base year level, the overall AT&C loss reduction has witnessed a 7 per cent decrease during the same period.
The franchisee has taken several measures to decrease the losses in its area of operation and also to make available better consumer services.
5. Initiatives undertaken The following sections highlight the steps being taken by the franchisee to provide better services to the consumers and to decrease the losses.
21 Data provided by FEDCO
5.1 Process re-engineeringWith a view to turn around the billing process, a study was carried by M/S Feedback Infrastructure Pvt. Ltd to understand the cause of unwillingness on part of the consumers to pay for the electricity being consumed by them. Based on the interaction and perception of the consumers, it was assessed that better consumer service will help to motivate the consumer for timely payment of the energy being consumed by them. Further, the entire process of meter reading, billing, and issue of new connection was redesigned and various technological interventions introduced. This process reengineering has helped the franchisee in reducing its billing cycle from 14 days to 9 days and has increased the accuracy of the bills being generated. New connection is now issued within a week.
5.2 Strong Customer Relationship Management (CRM) The franchisee has installed a strong CRM software to handle the complaint. The software provides the consumer an opportunity to track their complaint. The life-cycle of the complaint received in the software have been deliberated below:
� Complaint entry
� Ticket generation
� Registering the type of complaint
� Complaint relating to field executive for specific action
Every complaint must be filed through the customer care centre either directly by the consumer or through the 70 offices of the franchisee present across its area of operation.22 The complaint received by the customer care executive is entered to the web-based CRM software located on the central server. For every complaint entered, a unique ticket number is automatically generated by the system which is used to track the status of the complaint. Once the complaint has been registered, an SMS is automatically sent to the concerned field executive through the section in-charge and the supervisor based near the location of the consumer. An SMS is also sent to the consumer detailing the ticket number on his registered mobile number.
Besides helping in centrally monitoring the complaints, this arrangement is also economical as the franchisee can still work efficiently with just one customer care centre located at Bhubaneswar. Further, the system of automatic relay of SMS to the O&M staff and the field in-charge ensures that at least 40 per cent of the time of the customer care executive is saved.23
5.3 Fuse off call centersThe franchisee has established approximately 241 fuse off call centres24 across the state, with round the clock availability of operation and maintenance staff including a line man, to address issues in a fast and efficient manner. A supervisor has been appointed to keep a tab on the performance of the line man and the helper for two to three fuse call centres. On rectification of fault signature of consumers is obtained for record and monitoring purposes. Any fault which cannot be rectified by the line man at their own is forwarded to the supervisor and concerned field in charge for necessary action.
5.4 Verifying complaint resolutionThe line men are tasked to report to their supervisor about the status of the complaint being handled by them i.e., the complaints received, complaints closed, and complaints still open. An escalation mechanism has been established for handling complaints which has remained unresolved for long. This process helps to keep a tab on a
22 Data provided by FEEDCO
23 Data provided by FEDCO
24 Presentation of FEDCO

PUBLIC PRIVATE PARTNERSHIP (PPP) IN ELECTRICITY DISTRIBUTION 12 PUBLIC PRIVATE PARTNERSHIP (PPP) IN ELECTRICITY DISTRIBUTION 13
CASE STUDIESCASE STUDIES
number of complaints received and resolved on daily basis and also helps the franchisee in making an assessment of the performance of O&M staff and in understanding the nature of complaints being received from any service area.
5.5 Cross verification of recordsQuality team of the franchisee visits the offices of line men and checks records related to date and time of opening of the complaint, closing time, consumer stamp on resolution sheet, etc. This ensures compliance of the set procedure by the representatives of the franchisee. The quality team also interacts with some of the consumers to understand their experience related to the resolution of complaint and services rendered by the representatives’ franchisee.
5.6 Cross verification of complaint resolutionFEDCO cross verifies 10 per cent of the complaints resolved on daily basis by obtaining consumer feedback on the resolution through phone. The feedback is taken mainly on four aspects:
� Overall service rendered and resolution of the complaint
� Behaviour of the employee
� Overall experience of being with FEDCO
� Any undue demand made by any employee for the resolution of the complaint.
The consumers have appreciated the feedback calls being received from the franchisee. Necessary action is also taken if adverse feedback is provided by the consumer on any of the above indicated aspects.
5.7 Issue of new connectionsRequest for the issue of new connections is also accepted through the customer care centre. The franchisee has introduced New Service Connection (NSC) real time tracker software to register requests and to monitor the release of NSCs. A part of the dashboard of NSC software has been provided in Figure 4.
Figure 4: Online Software for NSC Ticket generation (FEDCO)
Once the request has been received a unique ticket number is generated indicating the division details, the connection type, and unique six digit number, which helps to monitor the status of the request. The concerned staff member of the franchisee calls the applicant and visits his premises at an agreed date and time. Besides helping the applicant in completing the document, the staff member also informs the applicant about the date and time to carry out the assessment of the feasibility for issuing a new connection. The applicant is informed about the details of the changes to be borne by the applicant for the release of a new connection. Once the security deposit is submitted,
a new connection is issued to the client. The franchisee tries to complete the process of issuing new connections within a week of the receipt of request.
5.8 Informing consumers about power cutsThere are two modes of broadcasting being used to inform the consumers: � Displaying the information on foot scroll of local television (TV) channels: The franchisee expects that 20 to
30 per cent of the consumers are generally reached through this arrangement � Loudspeaker announcement: This method is especially effective in rural areas
In case of any unscheduled power cuts, information can be obtained about the nature of fault and the expected time required for restoring the fault, etc., through the customer care centre.
5.9 Monitoring customer care centresThe customer care centre has turned out to be the lifeline between the franchisee and the consumers. Thus the franchisee ensures active monitoring of calls received. Any call which is on line for more than three minutes is considered to be critical call. The critical call engages a line for excess time thereby causing problems to other consumers who may be a waiting for their turn on the phone line. It also reflects that there is a lack of understanding between the customer care executive and the consumer on the issue involved. All critical calls are closely monitored by the franchisee. The customer care supervisors ensure that they listen to every critical call to understand the cause of the call turning to be critical.
5.10 Capacity building of customer care executivesCustomer care executives are the voice of the franchisee, thus, it is very important to build capacity of the executives on the various aspects related to faults and complaints. The franchisee provides two types of training to the texecutive: � Formal training: This training is related to various aspects of the faults and complaints � One-to-one training: This is mainly based on the previous individual recorded calls handled by the executive.
The recorded calls of the executives are by the customer care supervisors who identify the possible areas of improvement and then discuss the calls with the executive to improve their skills
5.11 Metering and billingThe franchisee is increasing the use of Spot Billing Machines (SBM) on a continual basis. These machines have inbuilt General Packet Radio Service (GPRS) modem software which ensures that the billing data is continuously updated on the billing database server. The introduction of IR/RF port meters has minimized error in issue of bills because by connecting billing machine with IR/ RF port, meter data is directly transferred to billing machine. Further, data collected in the machine can be transferred to ENSERV billing software through suitable arrangement thereby reducing the chances of error due to human interface during data transfer from meter to billing software. The franchisee is also promoting use of CMRI and camera-based meter reading of high value consumers.
The use of SBM with GPRS-enabled systems has led to a decrease in the complaints of the consumers regarding issue of bills by the field officers without actually visiting the premises of the consumers and undertaking meter reading. Further, the time stamping obtained in these bills helps the franchisee in making an assessment of the productivity of the consumers.
5.12 ENSERV billing softwareThe franchisee is also using ENSERV web-based billing software. This is a billing software that was developed in-house which helps to process consumer details every month. The software has the provision of integrating the

PUBLIC PRIVATE PARTNERSHIP (PPP) IN ELECTRICITY DISTRIBUTION 14 PUBLIC PRIVATE PARTNERSHIP (PPP) IN ELECTRICITY DISTRIBUTION 15
CASE STUDIESCASE STUDIES
consumer profile details with real time data obtained from the SBMs. The use of CRM and metering management system has enhanced efficiency of billing and customer management process.
5.13 Energy audit softwareThe franchisee is using web-based energy audit Management Information System (MIS) to carry subdivision wise energy accounting in its area of operation. The software helps to track the performance of each subdivision on continual basis. The parameters captured include, input energy, energy billed, and collection, made during the day. The data captured helps to determine the real time billing, collection and to compute the AT&C loss on subdivision level. The proper energy accounting helps the franchisee in identifying the problematic areas and to take necessary corrective measures. Further, the achievement against the target billing and collection efficiency and AT&C losses helps the franchisee to make adjustment to its effort towards meeting the target.
5.14 Strengthening the network along with AMR metering of DTRsIn its effort to put in place better energy audit and decrease losses, the franchisee has planned to install an AMR meter on all the DTRs in its area of operation. However, in the first phase DTRs, of 100 kVA and above capacity, DTRs with more than 100 consumers connected to it and those present in high loss making areas are being identified for AMR metering. Once the DTR is identified, survey of network connected to the DTR and consumers served from the DTR is undertaken to understand the need of:
� Enhancing the capacity of the DTR
� Realigning or bifurcating of the network for better load management
� Establishing meters of adequate capacity
Once the realignment of the network is completed, the AMR meter is installed on the DTRs for energy audit. The franchisee has identified 200 DTRs of various capacities across four divisions for the implementation of the scheme.
5.15 Meter installation/replacement programmeThe franchisee is also focusing on bringing illegal consumers under the billing ambit. Thus, emphasis is being laid on network mapping, identification of loss making areas, and increasing the density of legal connection. The steps taken on this aspect include organising of camps at the village level. During these camps awareness is created, through discussions on the importance of having a legal connection. The person expressing his desire to have legal connection, is assisted by the franchisee in completing the formalities for the release of connection during the camps being organized. The programme has received substantial response from the consumers. The faulty meters present at consumer premises are also being replaced.
The details of the issue of new connections/ replacement of meters at consumers’ end achieved till date have been summarized in Table 6.
Table 6: Issue of new connection and meter replacement for single phase and three phase consumers
Sl. No. Phase Division First year (FY 2013–14) April 2014 to July 2014
New connect Replace-ment New connect Replace-ment
1
Sing
le p
hase
Khordha 1,343 2,535 1,261 7,484
2 Balugaon 866 3,210 1,400 6,321
3 Puri 1,348 3,991 2,231 6,319
4 Nayagarh 804 4,218 1,374 8,263
Total 4,361 13,954 6,266 28,387
Sl. No. Phase Division First year (FY 2013–14) April 2014 to July 2014
New connect Replace-ment New connect Replace-ment
1
Thre
e ph
ase
Khordha 62 138 73 113
2 Balugaon 18 133 39 38
3 Puri 43 233 51 85
4 Nayagarh 26 168 47 51
Total 149 672 210 287
Source: Data provided by FEDCO
5.16 Theft controlIn order to discourage theft of electricity, the franchisee is carrying out inspection of consumer meter and lodging of complaint/ First Information Report (FIR), if necessary. Utility has provided necessary power to the franchisee staff for carrying out checks for the consumer meter and to register a case. The cases are booked under section (u/s) 126 and 135 of Electricity Act, 2003 (Section 126 of EA 2003 pertains to assessment of unauthorized use of electricity at the premises of the consumer and Section 135 is related to theft of electricity). For example, during the month of July 2014, a total of 1,795 kW of load is booked with an assessment of electricity usage of 1.011 MU. During this period, due to these actions total realization of USD 58,518 has been done u/s 126 and of USD 4883 u/s 135.
5.17 Involving local communityWith an aim to involve local community for reducing its losses, FEDCO started working with the Self Help Group (SHG), especially in the Nayagarh electrical division. As per FEDCO, approximately 141 franchisees were appointed by June 2014 for metering, billing, and collection of energy charges from 0.15 million single phase consumers of Nayagarh division. The SHGs are paid for the billing and collection done by them on monthly basis. The remuneration to be paid to SHG has been indicated below.
Billing
At the beginning of the month, every SHG is provided with an individual Base Line Billing Target (BLBT) which is equal to the maximum number of consumers billed during a particular month in the previous year. The BLBT is further every quarter taking the highest billing figure achieved in the previous quarter of the current year. For issue of each OK bills (actuals) up to BLBT, the SHG receives Rs 3/ bill issued. The SHG also receives an additional Rs 5/ consumer, for achieving more than BLBT every month.
Collection
The SHG is paid 6 per cent of the total amount collected during the month for the collection achieved up to the Base Line Collection Target (BLCT). If the SHG has collected an amount over and above the BLCT the SHG receives 1 per cent extra on the amount collected.
Box 3: Self Help Group (SHG)A per the National Bank for Agriculture and Rural Development (NABARD), SHG is a group of about 20 people from a homogeneous class, who come together for addressing their common problems. The SHGs are encouraged to make a voluntary thrift on a regular basis which is used to make small interest bearing loans to their members. This gradually builds financial discipline and credit history for themselves. This is ‘warm money’. They also learn to handle resources of a size that is much beyond their individual capacities. Once the groups show financially mature behaviour, banks are encouraged to give loans to the SHG in certain multiples of the accumulated savings of the SHG without any collateral and at market interest rates. The members experience the benefits of credit discipline by being able to save and borrow regularly without many hassles at a term decided by their own members. The peer pressure ensures timely repayments and replaces the “collateral” for the bank loans.

PUBLIC PRIVATE PARTNERSHIP (PPP) IN ELECTRICITY DISTRIBUTION 16 PUBLIC PRIVATE PARTNERSHIP (PPP) IN ELECTRICITY DISTRIBUTION 17
CASE STUDIESCASE STUDIES
FEDCO has established a SHG managing team to provide support to the SHG group on a daily basis. Through review meeting and interactions with the SHG the team tries to monitor, guide, motivate, and support the SHGs with an aim to increase their productivity.
6. Key takeawaysThe achievements of FEDCO and the steps taken by it to achieve the results during the short term of its operation are commendable. There are some key takeaways identified from the study which are important for the success of PPP in power distribution. The key takeaways have been summarized below:
� High loss making areas makes better business sense: The potential of reducing the losses in high loss making areas is possible through a PPP mode of operation. It is expected that even with lesser efforts the overall losses in high loss making areas can be curtailed substantially. Thus it may make better sense to open higher loss making areas for the implementation of PPP in electricity distribution.
� Upfront investment in system upgradation: FEDCO made an upfront investment on improving LT distribution infrastructure, consumer metering, billing, and on development of monitoring mechanism. This helped the utility to excercise better control on the business and to overcome errors in decision making. This highlights the need of upfront investment in system upgradation.
� Involving the local community could help in curtailing losses: As has been the experience of Nayagarh division, where the involvement of SHGs as partner of FEDCO is local community is expected to help in curtailment of losses.
� Social and political acceptance of the franchisee model: The franchisee is considered to be a partner of utility and carries activities on behalf of the utility. There has been no resistance from the staff of the utility or the consumer at large during the award of franchisee in 15 divisions of operation. This indicates that the IBF–IRS model is accepted socially as well as politically.
� Consumer-centric approach is essential for better results: The efforts of franchisee to help in better service delivery to consumers for example, time bound resolution of complaints, an efficient consumer centre, etc., is appreciated by the consumers. Developing business plan with a focus on consumer a centric approach is expected to help in the development of satisfaction and loyalty amongst the consumers.
Case Study — TPDDL
1. IntroductionDelhi, the capital of India, is located in the northern part of the country. As per the Census 2001, the city state has a population of more than 13.8 million spread over 1,483 sq. km. This shows that the population density is more than 9,294 persons per sq. km.25 Delhi is a highly urbanized city state. Figure 5 depicts the geographical distribution of the state along with the area of operation of various electricity utilities.
2. Historical background of electricity supply in Delhi
Since 1957, the Delhi Electricity Supply Undertaking (DESU) was responsible for providing electricity to the consumers in Delhi. It was working as a wing of the Municipal Corporation of Delhi under the Electricity (Supply) Act, 194826. However, the performance of DESU, especially the commercial performance, was far from satisfactory which made it drain on the public exchequer and incapable of raising the resources necessary to improve its services.27 In order to decrease the financial losses being incurred by DESU and to improve the quality of the services being provided to consumers, in the year 1997, DESU was replaced by a government-owned entity called Delhi Vidyut Board (DVB). The DVB functioned as an integrated utility looking after the generation, transmission, and distribution aspects. It operated throughout the state except a small area being served by New Delhi Municipal Corporation (NDMC) and military establishment areas/cantonment area which continued to be under the jurisdiction of Military Engineering Services (MES). Apart from serving its own needs, DVB also made electricity available to the NDMC and the MES on payment of Bulk Supply Tariff (BST) for the power being consumed by them.
However, it was soon realized that the creation of DVB had almost no impact on the work culture of the organization and proved to be merely a change in the legal status of the organization without any meaningful changes in efficiency and customer service.28 The performance of DVB remained much below the expectation. Further, the loss of DVB, being a government-owned utility, continued to be a loss to the public exchequer. Between the FY 1995–96 and FY 1999–2000, financial losses of DESU/DVB rose from USD 96.33 million to USD 183.33 million29.
25 Available at http://delhiplanning.nic.in/Economic%20Survey/Ecosur2001-02/PDF/chapter3.pdf
26 Available at http://delhigovt.nic.in/newdelhi/power.asp (last accessed on November 15, 2014)
27 Available at http://delhigovt.nic.in/newdelhi/power.asp (last accessed on November 15, 2014)
28 Available at http://delhigovt.nic.in/newdelhi/power.asp (last accessed on November 15, 2014)
29 The Annual Report (2001–02) on The Working of State Electricity Boards & Electricity Departments: Planning Commission (Power & Energy Division), Government of India, May 2002
Figure 5: Geographical spread of Delhi

PUBLIC PRIVATE PARTNERSHIP (PPP) IN ELECTRICITY DISTRIBUTION 18 PUBLIC PRIVATE PARTNERSHIP (PPP) IN ELECTRICITY DISTRIBUTION 19
CASE STUDIESCASE STUDIES
The T&D and financial losses incurred by DESU/ DVB during the corresponding period have been indicated in the Figure 6.
Figure 6: T&D loss and financial loss of DESU/ DVB between the FY 1996 to FY 2002
Source: The Annual Report (2001–02) on The Working of State Electricity Boards & Electricity Departments: Planning Commission (Power & Energy Division), Government of India, May 2002
It is evident from Figure 6 that T&D losses of the state continued to be above 42 per cent between FY 1995–96 and FY 2001–02. At the same time the DVB was incurring heavy financial losses. This was because the electricity distribution system was in an extremely dilapidated condition which was resulting in the high losses and unreliable power supply. Further, the entire distribution infrastructure was prone to theft. Meters were old and could be easily tampered with; bare overhead network allowed people to hook in and steal electricity, etc. Due to inadequate network strengthening, the network was heavily overloaded which was a major reason for frequent transformer failures. Further, power plants of DVB were operating at a Plant Load Factor (PLF) of approximately 50 per cent due to which DVB had to depend on power purchased from external sources.30 This led to an increase in the overall power purchase cost of DVB. The compulsion to purchase expensive power from external sources, clubbed with high losses, further impacted the bottom line of DVB adversely.
Due to the high power purchase cost and very low realization per unit of electricity, DVB was making year on year losses. The stressed balance sheet of DVB made it difficult for the DVB to arrange finances required for carrying out normal operations.31 This also made it difficult to carry out timely maintenance of the distribution system.
By the end of calendar year 1998, it was being realized that some bold reforms were necessary for improving the present state of affairs of electricity sector in the State. This was also the time when power sector reforms were being implemented in different states and the Central government was empowered through suitable legislation. Delhi also preferred to go by the well-accepted approach of unbundling generation, transmission, and distribution segments. Further, based on the experience gained with the formation of DVB from DESU, it was contemplated that just unbundling would not serve the purpose in the long run. This led to a fresh thinking regarding the power supply business of Delhi.
2.1 Restructuring of DVBGNCTD brought out a strategy paper on power sector reforms in February 1999 for reforming the power sector in the state. The strategy paper was aimed at stakeholder’s discussions/consultations on unbundling and privatization of DVB. After, extensive stakeholders’ discussions, it was decided to unbundle DVB and subsequently take steps
30 Power sector reforms in Delhi, April 2010, IDFC
31 Available at http://delhigovt.nic.in/newdelhi/power.asp (last accessed on October 28, 2014)
for the privatization of DVB. Consequently “Six” Shell companies were registered to become successor entities of DVB on operationalization of the Transfer Scheme32 as indicated below:
� Delhi Power Company Limited (DPCL): As the sole holding company
� Generation Companies (GENCO): Two in numbers i.e., Indraprastha Power Generation Company Limited (IPGCL) and Pragati Power Company Limited (PPCL)
� Transmission Company (TRANSCO): One in number, namely Delhi Transco Limited (DTL)
� Distribution Companies (DISCOMS): Three Discoms, one for each of the three electrical circles i.e., North and North West circle, Central and East circle, and South and West circle. NDMC and MES continued to cater to the need of the consumers in their respective jurisdiction
As part of the reform process on March 3, 1999 the GNCTD established Delhi Electricity Regulatory Commission (DERC) under the Electricity Regulatory Commission Act (ERCA), 1998 to act as an independent regulator of the sector. However, in the initial stages the Commission function was limited to Tariff Setting.
3. Model for Public Private Partnership for electricity supply in Delhi
After the completion of the unbundling process and in line with Strategy Paper on Power Sector Reforms, in February 1999 the GNCTD decided to invite private players for distribution of electricity in three distribution zones of Delhi being looked after by the three “Shell” companies. However, the model adopted was not outright privation with 100 per cent stake of the private participant. Rather, it was envisaged that the private participant will have 51 per cent stake and the GNCTD will retain 49 per cent stake in the new company. Thus, management control would be in private hands. It was followed by a competitive bidding process and extensive discussions with the bidders. Year on year AT&C loss to be achieved between FY 2002 to FY 2007 was decided to be the selection criteria of the bids.33 After seven prospective bidders submitted their statement of qualifications (SoQs) the Evaluation Committee, formed by the Government, prequalified six bidder(s) namely AES, BSES, China Light & Power, CESCON, Reliance, and Tata Power.34 As a result of the bidding process Tata Power was declared the winner in one circle i.e., North and Northwest circle and BSES in two circles i.e., Central and East and South and West35.
3.1 Salient features of PPP model of electricity distribution in DelhiThe government extended support to the successor private utilities in accordance with The Delhi Electricity Reform Act, 2000 and The Delhi Electricity Reforms (Transfer Scheme) Rules, 2001. The managerial and financial models of the implementation of PPP have been detailed below.
Managerial Model
� Successful bidders were to be selected on the basis of AT&C loss reduction trajectory for next five years proposed by the bidding parties against trajectory proposed by the GNCTD
� The private participant would have 51 per cent stake and the GNCTD would have 49 per cent stake in the newly formed entity/distribution licenses
� AT&C losses for the purpose of tariff computation shall be based on the values of reduction in AT&C loss each year for the FY 2002–03, 2003–04, 2004–05, 2005–06, and 2006–07 indicated in the bid submitted by the
32 Available at http://delhigovt.nic.in/newdelhi/power.asp (last accessed on October 28, 2014)
33 Available at http://powermin.nic.in/reports/pdf/distribution_policy.pdf (last accessed on October 20, 2014)
34 Available at http://delhigovt.nic.in/newdelhi/power.asp (last accessed on October 28, 2014)
35 Presently BSES is catering to its consumers through its two shell companies namely BSES Yamuna which operates in the East and Central circle of Delhi and BSES Rajdhani which caters to the need of consumers in the South and West circles

PUBLIC PRIVATE PARTNERSHIP (PPP) IN ELECTRICITY DISTRIBUTION 20 PUBLIC PRIVATE PARTNERSHIP (PPP) IN ELECTRICITY DISTRIBUTION 21
CASE STUDIESCASE STUDIES
purchaser and as finally accepted by the GNCTD (hereinafter referred to as “Accepted Bid”) over the opening level of AT&C loss to be approved by the DERC for each distribution companies
� The interest of existing manpower of DVB was protected as there was a provision for transfer of existing manpower of DVB to the distribution licenses with protection of their service conditions
� The successful bidder would become the distribution licensee for his area of supply
Financial Model
� Distribution licensees were assured a 16 per cent post tax return on equity (RoE) invested in business
� GNCTD also directed DERC to come up with the normative tariff order on the Bulk Supply Tariff (BST). This was aimed to facilitate the bidders to have an understanding of the various cost elements that should be factored in while making their business plan. Further, BST of the utilities was to be based on their capacities to pay which was estimated based on the projected revenue realization at existing tariffs
� During the first five years of operation, the three newly formed distribution licenses were to source power from DTL under the single buyer model. Subsequently, the overall power allocation of DVB was to be handed to the distribution licenses in proportion to their requirement. Also, the distribution licenses were mandated to source extra power on their own to meet their demand
� A transitional support of approximately USD 575 million was provided to TRANSCO, the organization mandated to source power till FY 2006–07 on behalf of all the three utilities, to cushion the consumers against any tariff shock arising due to the adoption of full cost recovery tariff model by DERC. The transmission company was to use the money to bridge the gap between its revenue requirement and BST which it would receive from the distribution licences
� The benefit/ losses accrued from the over/under achievement of the loss reduction trajectory would be distributed between the utility and the consumers in the following manner.
i. Over achievement: The distribution licensee shall be allowed to retain 50 per cent of the additional revenue resulting from such better performance. The balance 50 per cent of additional revenue from such better performance would be passed on to the consumer through subsequent year tariff.
ii. Under achievement: The entire shortfall in revenue on account of under achievement would be borne by the utility
iii. If achievement for loss reduction is between loss reduction levels stipulated by the Government for that year and the level indicated in the accepted bid for that year, the entire additional revenue from such better performance would be counted for the purpose of tariff determination
Provided further that for paras (i), (ii), and (iii) above, for every year, while determining such additional revenue or shortfall in revenue the cumulative net effect of revenue till the end of the relevant year shall be taken, and appropriate adjustments shall be made for the net effect.
The loss reduction trajectory proposed by the GNCTD and that proposed by the successful bidders and accepted by GNCTD for the three circles have been indicated in Table 7 below.
Table 7: Year on year AT&C loss reduction trajectory proposed by GNCTD and that proposed by successful bidder in the three circles of DVB (in %)
2002–03 2003–04 2004–05 2005–06 2006–07 Total
BSES Rajdhani Government specified minimum bid
1.5 5.0 5.0 5.0 4.25 20.75
Accepted bid 0.55 1.55 3.70 6.0 5.6 17.4
BSES Yamuna Government specified minimum bid
1.25 5.0 4.5 4.5 4.0 19.25
Accepted bid 0.75 1.75 4.0 5.65 5.1 17.25
TPDDL Government specified minimum bid
1.5 5.0 4.5 4.25 4.0 19.25
Accepted bid 1.5 2.25 4.5 5.5 4.25 18.0
Source: GNCT
All the assets and liabilities of DVB, accrued prior to the effective date, were transferred to GNCTD. All the liabilities and equities of the five unbundled entities were transferred to the holding company which was formed especially for this purpose. On the effective date i.e., July 1, 2002, the holding company divested at par, 51 per cent of its equity stake in the discoms to successful bidders.
The liabilities arising due to litigations, suits, claims, etc., filed during the operation of DVB, was to be taken over by distribution licenses. However, limited to the liability that needed to be absorbed by distribution licenses during a year was fixed at USD 167,000 in a year. Any incremental liability was to be passed on to the consumers through ARR, if possible. Distribution licenses were provided with clean balance sheets with fixed assets valued as per Business Valuation methodology. Only certain pre-defined serviceable liabilities were transferred to distribution licenses
The successor companies viz., GENCO, TRANSCO, and the three distribution companies were required to repay the loan payable to the Holding Company mentioned in relevant schedules of the “Transfer Scheme”, within thirteen years from the date of transfer with a waiver on interest and moratorium on principal repayment for the first few years. In case of underachievement, the loan was to be further rescheduled.
The utility was allowed the right to use the land of DVB for duration of the license period at a nominal rate of INR 1/ year.
Impact on subsidyPrior to the introduction PPP model in Delhi, DVB was reporting a continuous increase in the overall financial loss. As DVB was a state owned utility, losses of the utility was ultimately on the public exchequer. As per the Transfer Scheme the GNCTD extended support of approximately USD 575 million to the distribution licensee through the TRANSCO to meet the gap between actual power purchase costs incurred in meeting the power requirement of Delhi and the realization through BST from the newly formed three distribution licensee during the first five years of operation. The disbursement of approximately USD 575.66 million during first five years of operation has been indicated in Table 8.
Table 8: Year on year subsidy support extended by GNCTD to the three distribution licensees through Transco (in million USD)
FY 2003 2004 2005 2006 2007
Amount released 227.33 210 115 21.33 0Source: Power sector reforms in Delhi, April 2010, IDFC
Thus it is clear that under the business as usual condition the state government would have spent much higher amount of subsidy than the amount provided by the Government through the Transfer Scheme.

PUBLIC PRIVATE PARTNERSHIP (PPP) IN ELECTRICITY DISTRIBUTION 22 PUBLIC PRIVATE PARTNERSHIP (PPP) IN ELECTRICITY DISTRIBUTION 23
CASE STUDIESCASE STUDIES
AT&C loss is the sum total of technical loss, commercial losses, and shortage due to non-realization of total billed amount. The GNCTD requested the DERC to compute opening level of AT&C loss for the FY 2002–03 for all the distribution circles of Delhi. The loss level arrived at by DERC has been indicated in Table 9.
Table 9: T&C loss computed by DERC for the three distribution license for the FY 2002
Circle AT&C loss by FY 2002
Central/East 57.2%
North/Northwest 48.1%
South/West 48.1%
All 50.7%
Source: Tariff Order of DERC issued on 22.02.2012
3.2 Selection of PPP partner (distribution licensee) for the studyAs has been indicated in the previous sections three companies were selected for carrying the function of distribution licensee in the state of Delhi. Discussions were held with the experts to identify the distribution licensee for developing the case study. Based on the discussion, Tata Power Delhi Distribution Limited (TPDDL), which was formerly known as New Delhi Power Limited (NDPL), has been identified for documentation.
3.3 Condition of distribution business at the time of takeoverThe distribution business was in very bad shape at the time when TPDDL took over as distribution license of North and Northwest circle of erstwhile DVB. Though the opening level of AT&C was fixed at 48.1 per cent for the circle under operation of TPDDL, TPDDL has reported loss level to be at 53 per cent. In any case the high AT&C loss level of 48 per cent and above speaks itself about the condition of operation. The high losses can be attributed to large revenue leakage, low consumer satisfaction, technological obsolescence, absence of proper monitoring and control over the operations, low level of motivation of employees, and bureaucratic nature of the management, beside other reasons. As per TPDDL, some of the challenges faced include:
� Very high AT&C losses
� Approximately 20,000 new connection applications were pending for processing and subsequent release of connection
� One lakh metering and billing related pending complaints. Of the total bills issued, over 30 per cent were provisional bills. Complaints, related to wrong billing were very high
� Only 20 payment avenues were available for approximately 700,000 consumers
� The database obtained from DVB were erroneous
� The employees transferred from DVB lacked a consumer-centric approach due to the monopolistic nature of the industry in which they worked till date. They lacked the culture of performance orientation. Most of the workforce were either unskilled or semi-skilled workers
� There was total lack of effective and transparent communication system. Poor working conditions, inadequate infrastructure including Information Technology (IT) infrastructure were some of the reasons of poor performance
� There was absence of Customer Relationship Management (CRM) and Management Information system (MIS) in erstwhile DVB along with effective real network infrastructure to support email system. The organization was driven on person-based approach rather than process-based approach
� Power outages were common
4. Results achievedSince takeover, the TPDDL has been successful in reducing the AT&C losses. Introduction of innovative initiatives have helped the utility in reducing its losses over the years. During its first five years of operation against the contractual obligation of AT&C loss reduction of 19.25 per cent TPDDL was able to decrease AT&C losses by 25.72 per cent as has been indicated in Figure 7.
Figure 7: Specified bid AT&C loss, accepted AT&C loss and actual AT&C loss reduction achieved between FY 2003 and FY 2007
Source: GoNCTD notification/various tariff orders of DERC
Even after FY 2007, TPDDL has been able to surpass the loss reduction targets set by the DERC and has been able to achieve the AT&C loss level of 10.73 per cent by FY 2013 as has been indicated in Figure 8.
Figure 8: Year wise AT&C loss level approved by the DERC and AT&C loss level achieved by TPDDL
25
20
15
10
5
02007–08 2008–09 2009–10 2010–11 2011–12 2012–13
Approved in ARR Order Actual Achieved
22.03
18.56
20.35
16.7418.68
15.1617
13.1 1311.49
12.510.73
Source: Various tariff orders of DERC

PUBLIC PRIVATE PARTNERSHIP (PPP) IN ELECTRICITY DISTRIBUTION 24 PUBLIC PRIVATE PARTNERSHIP (PPP) IN ELECTRICITY DISTRIBUTION 25
CASE STUDIESCASE STUDIES
With the concerted effort and strategy adopted by TPDDL, there has been a marked improvement in the overall service delivery. The improvements in operational performance and customer service aspect have been detailed in Tables 10 and 11 below.
Table 10: Improvement in operational performance parameter of TPDDL between July 2002 and FY 2013
Sl. No. Parameter Unit July 2002 March 2013 % change
1 Peak load MW 930 1573 69%
2 Energy input MU 3928* 7861 100%
3 AT&C losses % 53.1 10.78 80%
4 Average System Availability Index (ASAI)
% 70 99.94 43%
5 Transformer failure rate % 11 0.79 93%
6 Length of network Ckt km 6750 10364 54%
7 Street light functionality % 40 99.57 149%
Source: TPDDL
Table 11: Improvement in the customer service of TPDDL between July 2002 and FY 2013
Sl. No. Parameter Unit July 2002 March 2013 % change
1 New connection energization time Day 51.8 6 88%
2 Meter replacement time Day 25 6 76%
3 Provisional billing % 15 3 80%
4 Defective bills % 6 0.2 97%
5 Bill complaint resolution Day 45 6 87%
6 Mean time to repair faults Hour 11 1.2 89%
7 Payment collection avenues No. 20 5377 26785%
8 Consumer satisfaction Index % - 88 -
Source: TPDDL
5. Initiatives undertakenTPDDL undertook several initiatives to revive the ailing distribution business in its area of operation which can be classified as:
� Managerial initiative
� Technical initiative
� Consumer centric initiative
� Financial commitment
The details of various initiatives undertaken, as has been provided by TPDDL, are detailed below:
5.1 Managerial initiativeAs detailed in above sections, the situation of distribution business was very bad on the ground when TPDDL overtook the business. It was of paramount importance to introduce a strong and focused leadership to change
the state of the affairs. Without the presence of a strong management team having a risk taking attitude, a highly motivated workforce, and ample resources at its disposal, supported with necessary regulatory backing, the situation could not be expected to improve.
TPDDL undertook the managerial initiatives outlined in the following sections.
5.1.1 Establishment of a dedicated Corporate Strategy Planning and Performance Management Group
A dedicated Corporate Strategy Planning and Performance Management Group (CSPPMG) was established by TPDDL to formulate a long-term strategic plan. The long-term strategies and short-term action plan were presented by CSPPMG to the Board for approval and subsequent communication throughout the organization. The approach adopted for the development of strategies and action plan is indicated below:
� Organize workshops internally with key functions and process owners for carrying out organizational SWOT analysis for charting out long- and short-term working objectives of the organization
� Undertake stakeholder expectations’ assessment
� Make an assessment of external environmental changes, including anticipated regulatory changes, that may impact the business of the organization
� Organize annual strategy workshop to carry out course corrections in long- and short-term objectives and action plan of the organization
� To develop detailed actions plans, based on bottom–up approach to ensure buy-in across all levels of the organization
TPDDL maintained focus on action plans and planned deliverables through Corrective and Prevention Actions (CAPA) against deviations identified during periodic reviews which, if identified, were addressed through revision/updating of initiatives across the organization.
5.1.2 Creation of strong management team
A team of 30 professionals was brought in to function as departmental heads/specialists and to infuse the change in line with the concept of “Distributed Leadership”. The entire operational area of the utility was divided into five circles, 12 districts, and 46 zones. Senior officers were appointed to run the set up as individual business units with adequate manpower. The review and monitoring of the performance score cards and reward and recognition of the performance of individual units helped to increase the benchmark of the performance amongst these units.
5.1.3 Adoption of three-tier balanced scorecard approach to achieve organizational objectives
It was important that activities of the entire workforce be aligned to meet the organization’s objectives. A three-tier balanced scorecard approach (as indicated in Box 4) was used as a tool for executing strategy, inculcating performance-driven culture, and achieving sustained improvements.
5.1.4 Assimilation of employees of DVB in the work force of TPDDL
As part of transfer of assets/liabilities and personnel of existing DVB in accordance with The Delhi Electricity Reform Act, 2000 and The Delhi Electricity Reforms (Transfer Scheme) Rules, 2001 a 5,300 strong workforce of DVB were absorbed by TPDDL. They had been affiliated to five different trade unions of DVB. These employees were used to an entirely different work culture and were apprehensive about their individual future. TPDDL took concerted steps for capacity and confidence building of these employees so that they could transform into the work culture of TPDDL seamlessly.
5.1.5 Establishment of safe and conducive work environment
TPDDL established a policy of voluntary disclosures (in line with the guidelines issued by Securities and Exchange Board of India (SEBI) for listed companies), adoption of Company’s Code of Conduct, Whistle Blower Policy and Sexual Harassment Policy, etc., aimed to foster an ethical and transparent work environment.

PUBLIC PRIVATE PARTNERSHIP (PPP) IN ELECTRICITY DISTRIBUTION 26 PUBLIC PRIVATE PARTNERSHIP (PPP) IN ELECTRICITY DISTRIBUTION 27
CASE STUDIESCASE STUDIES
5.1.6 Safety awareness and practices
A three-tier safety structure comprising Apex Safety Council, Safety Management Cell, and Local Safety Committees have been established to oversee and review safety issues. Suraksha portal and Safety Call Centre have been deployed, enabling consumers and Business Associates (BA) to register their safety concerns. Circulation of safety instructions through mass media “Sandesh” (or information) mails and sharing findings of investigations are being used as tool to disseminate safety information. Participation of senior management in safety visits and in safety weeks across all locations and organizing Mega Seekh (Knowledge Sharing) sessions have helped to reinforce safety culture amongst the workforce and build confidence of consumers.
5.1.7 Communicating with workforce
As has been discussed in the above sections, since taking over, the top management of TPDDL focused on the development of dedicated and motivated workforce as the backbone of transformation process. Apart from the steps indicated above, Human Resource (HR) Nodal officers were appointed at all locations and workforce satisfaction surveys were undertaken to identify the areas that required focus and improvement. Subsequently, “Surkhiyan” — bilingual monthly newsletter and “Navodyaya” — quarterly magazine were launched to highlight key initiatives and achievements.
5.1.8 Communication with BA
TPDDL has opened communication channel with BA which includes bulk power supplier, service providers, and equipment supplier to elucidate about the importance of continual innovation in products and services so as to ensure better consumer experience and to improve overall efficiency in service delivery system. The engagement with media focuses on ensuing use of all possible channels like print, radio, TV, cinema, internet, etc., to convey its message across to the target audience.
5.2 Technical initiativeTPDDL carried out multiple interventions to improve electricity distribution system so as to ensure round the clock supply of quality power. The interventions carried out by TPDDL are enumerated below.
5.2.1 System upgradation
Due to the existing poor conditions of the distribution system inherited from DVB heavy investment towards
upgradation of system and its upkeep was necessary to achieve four basic aims of TPDDL as indicated in Figure 9 below.
Figure 9: Various aspects of system upgradation undertaken by TPDDL
Sources: TPDDL
The following steps were taken to achieve the above stated aims:
Decreasing AT&C loss
� In the first 10 years of its operations, the utility replaced approximately 800,000 electromechanical meters with tamper proof static meters having no accuracy change over time
� Improving the Low Tension (LT)/ High Tension (HT) ratio, especially in theft prone areas, with installation of smaller capacity transformers placed nearer to load centre
� Replacement of LT bare conductor with LT AB cable
System reliability improvement
� Decentralization of O&M into zone/districts/circles with dedicated 24×7 mobile maintenance and breakdown crew, with vehicles, has ensured fast response for fault restoration under its run-repair-replace policy
� Introduced distribution automation in its entire operations and automation of all 66/11 kV and 33/11 kV grid sub-stations with latest technology for remote establishment of SCADA Master Control Centre to control all connected grids
� Replacement of all old 11 kV switchgear with state-of-the-art SCADA compatible SF6 panels and replacement of old 11kV underground sick cables
� Establishment of communication network with a strong optical fibre backbone providing 99.99 per cent reliable communication system for SCADA, SAP, GIS, and for other data transportation including internet, email, video conferencing, etc.
� GIS mapping of all the assets (transformers, buildings, poles, cables, etc.) and linking it with various processes such as Capital Expenditure Management (CEM), Asset Management (AM), and Revenue Management (RM)
� Establishment of AMR system, capable to read meters of any make without manual intervention, for its high end consumers
� Introduction of state-of-the-art package sub-stations involving minimal manual intervention, resulting in spare part savings, and having better aesthetics and public safety
� Use of thermo-vision cameras (to identify hotspots) and wedge connectors have helped in reducing hotspots thereby reducing damage to transformers and other equipment
� Development of specification for the material to be procured, development of vendors, and an enhanced focus on quality of material and quality of workmanship have improved the overall performance of the system.
Meeting load growth
TPDDL has followed different approaches under different conditions and at different stages to meet its load growth. During first five years of operation, efforts were made to meet the peak demand of TPDDL with the establishment of new grid substations and augmentation of capacity of overloaded grid sub-stations. Between FY 2007 to FY 2011 focus was more on meeting load growth requirements through implementation of:
Aim of TPDDL
Box 4: Three Tier Performance Management System A three-tier performance management system was conceived to promote competition amongst the work force and align them to the organizational objectives. The vision parameters were dovetailed into the Corporate Balanced Scorecard (BSC) strategic objectives.
� Tier 1 – Organization Performance Management System: These strategic objectives were then cascaded into Functional Scorecards dwelling into target areas, priorities, and initiatives for different functions such as operations, commercial, planning and technology, etc.
� Tier 2 – Departmental Performance Management System: Here the functional objectives of various departments/groups/districts/zones were aligned with their annual functional quality improvement plans.
� Tier 3 – Individual Performance Management System: Here the functional quality improvement plans were further dwelled into individual goals.
Strategic Leadership Team (SLT) maintained focus on action plans and planned deliverables through Corrective and Prevention Actions (CAPA) against deviations identified during periodic reviews which, if identified, were addressed through revision/updating of initiatives across the organization.

PUBLIC PRIVATE PARTNERSHIP (PPP) IN ELECTRICITY DISTRIBUTION 28 PUBLIC PRIVATE PARTNERSHIP (PPP) IN ELECTRICITY DISTRIBUTION 29
CASE STUDIESCASE STUDIES
� Distribution Management System (DMS) � Distribution Automation (DA)
5.2.2 IT related intervention
TPDDL has used IT extensively for ensuring O&M in its area of operation. The various IT interventions, introduced in chronological order, have been detailed below: � FY 2002–03: Implementation of homegrown online Decentralized Energy Billing System (DEBS) connected
from its central server to all consumer care centres and cash collection centres with central server. The companies own website (www.tatapower-ddl.com) was introduced and billing and consumption data of all its consumers was made available on its website.
� FY 2003–06: SCADA compatible Grid Substation Automation System (GSAS) for 66/33/11 kV grid stations was implemented. Implementation of GIS was initiated for sub-transmission network along with mapping of the entire asset base. DEBS was modified for development of Bulk Billing Software (BBS) and AMR for consumers having load greater than 100 kW on HT network. In-house software Automatic Meter Reading Data Analysis (AMRDA) was developed to analyse the data downloaded through AMR. Primary Data Centre (PDC) was established. For smooth functioning at the back office and strengthening the revenue management system, software applications SAKSHAT and RMS were rolled out along with offline collection modules at cash collection centres. Also, SAP ERP system was implemented for other business functions including Finance and Controlling (FICO), Material Management (MM), Project System, etc.
� FY 2006–09: In the year 2007, SCADA was implemented across all grid stations with control facility at Centre for Network Management (CENNET). The control of entire grids system was centralized and remote monitored. Subsequently, GIS was implemented with an aim to make arrangement for the implementation of Distribution Management System (DMS). GIS was also integrated with SAP to have effective maintenance management. The same year a home-grown work flow based CRM application SAMBANDH (Building Relationship) was implemented. The software was, based on business process reengineering and integrated all modules/ commercial processes, with the provision of auto escalation of parameters and performance assurance. The software was integrated with all major applications such as DEBS, GIS, SAP-R/3 and SAP BW. The software had modules enumerated in Table 12 below.
Table 12: Modules of SAMBANDH
Abbreviation Usage
Customer Care Module
CCM Complaint/ request registering/ tracking and closing mechanism with provision of informing the customer about the status of the complaint through SMS/ call centre/ Interactive Voice Response System (IVRS)/ website
Connection Management Module
CMM Maintaining record related to new connection, attribute change, reconnection/ disconnection requests
Meter Management Module
MM For meter installation/ removal/ replacement/shifting/ testing and meter and material reconciliation
Revenue Collection Module
RCM Payment-related complaints handling, payment collection, and enforcement bill
Revenue Recovery Module
RRM Meter disconnection advices for payment defaulters
Revenue Discipline Module
RDM Enforcement cases (electricity theft bill processing), misuse (of electricity) cases, legal cases, and compliance to court orders
Record Management Stores documents and images during processing of request
Source: TPDDL
� FY 2009 onwards: Automation of the last mile of the distribution network has been the major focus area during this period. The implementation of the first phase of DMS (in 9 out of 12 districts wherein all 700 points have been automated), Distribution Automation (DA), and that for Outage Management System (OMS) has been completed. These have also been integrated with GIS for better and effective network management.
� FY 2009 till date: Automation of the last mile of distribution network has been major focus area of TPDDL during this period. DMS (in 9 out of 12 districts wherein all 700 points have been automated) was introduced for optimal handling of any network contingency and ensure faster restoration of network. Implementation of DA system aimed to identify and isolate the faulty section and restore network from SCADA centre in minimum possible time. OMS has been interfaced with various systems in utility so that the availability of accurate historical data on outages faced by the customers in the past shall help to ensure prompt restoration of outages.
In April 2011, SAP Industry Solution for Utilities (ISU) was implemented. This has facilitated online accounting of sales and collection without any manual intervention. The application has been seamlessly integrated with other applications like OMS, GIS, AMR, HHD, Spot Billing, IVRS, Payment Gateway, Lab testing M/c, etc., and with other ERP modules. TPDDL has also been able to establish a Unified Call Centre (UCC) for attending to ‘No Supply” and “Commercial Complaints”.
Further, with the increased dependence on IT, it became necessary to ensure 100 per cent system availability. Thus, a Secondary Data Centre (SDC) has been established to ensure smooth operation of business critical applications in case of any hardware failure.
The introduction of all these measures has helped to decrease the overall AT&C losses of TPDDL from around 53 per cent in FY 2002 down to around 11 per cent in FY 2012 of which technical losses may be considered to be approximately 8 per cent.
5.2.3 Power procurement strategy to ensure uninterrupted power availability
As per the GNCTD directive, upto March 31, 2007 the government-owned DTL was made responsible for making available electricity to all the Discoms of the state as per their demand. On April 1, 2007, the long-term power procurement of DTL was reassigned to the distribution licensees in proportion of their respective demands as per the advice of DERC. TPDDL was thus allocated 29.18 per cent of the power available from long-term contracts with existing stations of NTPC, NHPC, DVC, Delhi GENCOs, etc. This arrangement helped TPDDL to meet 80 per cent of its power demand leaving TPDDL to make necessary arrangement to meet the rest 20 per cent of their power demand. As power purchase cost is the single most expensive item of the overall expense of the utility, power procurement must be meticulously planned.
In order to bridge the demand–supply gap TPDDL:
� Started to procure power for immediate to short term from bilateral market (through power traders/ state utilities) under the negotiated route
� As TPDDL has a license for 25 years, it was important for TPDDL to start arranging medium term (i.e., greater than 1 year but less than 5 years) and long term (more than 5 years) power procurement based on load and supply studies carried out through independent agencies with inputs from Central Electricity Authority’s (CEA) Electric Power Survey, etc.
� To take advantage of transparent price discovery mechanism and cheaper power TPDDL commenced trading (buying/selling) in both power exchanges in India i.e., Indian Energy Exchange (IEX) and Power Exchange India (PXIL)
� 150 MW power was secured for the medium term under Government of India’s Case - I competitive bidding mechanism
� By the end of May 2007, TPDDL also entered into long term agreements of 1,000 MW form various sources

PUBLIC PRIVATE PARTNERSHIP (PPP) IN ELECTRICITY DISTRIBUTION 30 PUBLIC PRIVATE PARTNERSHIP (PPP) IN ELECTRICITY DISTRIBUTION 31
CASE STUDIESCASE STUDIES
� TPDDL has secured adequate power to meet its peak requirement based on annual growth estimates of 7 to 8 per cent till the FY 2017–18. Further, to partially meet its peak demand and to provide uninterrupted power in islanding mode to certain critical installations, if required, such as hospitals, waterworks, metro services, fire stations, etc. TPDDL established a 108 MW combined cycle plant at Rithala in September 2010. With an aim to develop its renewable portfolio, TPDDL started taking action in the FY 2008 itself, much before issue of Renewable Purchase Obligations (RPOs), by the DERC. TPDDL has commissioned various solar photovoltaic projects ranging from 4 kWp to 1MWp in its area of operations cumulating to 1.65 MWp.
5.3 Financial commitmentThe implementation of measures required for system improvement/upgradation entailed huge capital investment. The CAPEX incurred by the utility over the years on various aspects of system improvement have been provided in Table 13 below.
Table 13: CAPEX incurred between FY 2002–11 (in million USD)
FY 03 FY 04 FY 05 FY 06 FY 07 FY 08 FY 09 FY 10 FY 11 Total
AT&C loss reduction 0.1 1.2 1.7 2.4 1.6 1.9 2.5 2.1 1.7 15.1
Reliability improvement 0.2 2.4 1.7 1.7 0.5 0.7 0.4 1.6 2.0 11.1
Load growth 0.4 0.9 1.9 2.6 2.1 1.3 1.7 2.0 3.7 16.7
Infrastructure development 0.1 0.2 0.4 0.5 0.3 0.3 0.3 0.5 0.4 2.8
Total 0.8 4.7 5.6 7.2 4.5 4.1 4.8 6.2 7.8 45.7
Source: TPDDL
5.4 Consumer centric initiativesVarious consumer centric initiatives were undertaken to win over the loyalty of both economically weaker and affluent sections of consumers. Some of the consumer centric initiatives undertaken to curtail theft and increase awareness amongst the consumer about conservation of electricity and safety have been discussed below:
5.4.1 Involving economically weaker consumers to curtail theft
At the time of takeover there were approximately 220 slums with approximately 150,000 consumers in the area of TPDDL. These areas had very high AT&C losses. TPDDL engaged with the consumers in these areas through its CSR group and devised a unique socio-economic business case. It was decided first to “Create capacity to pay” among the consumers living in the slums before asking them to pay for their consumption. Thus, vocational training centres imparting skills in trades such as electrician, mobile repairing, and plumbing were started to engage school dropouts and unemployed youth of the slums. For women, beauty, cutting, and tailoring and computer training courses were started. Efforts were made to enrich the life of consumers residing in slum areas. Regular health camps and subsequently medical mobile dispensary “Sanjeevani” was initiated to address their essential medical needs. The de-addiction initiatives were persuaded aggressively through counselling sessions and de-addiction medicine distribution. Constant follow up camps were held to ensure effective results and to create better lives.
It was also understood that upfront payment of USD 60 for obtaining a new connection was a challenge for these consumers. Thus, TPDDL advocated with the DERC to reduce the cost of issue of new connection to USD 25 with upfront payment of approximately USD 5.83 only. This was accepted by DERC. The availing of new connection was also incentivized with an insurance policy of approximate USD 1666 with every new metered connection provided, the consumer regularly paid for the electricity being consumed. Instant connection camps were organized. Further, the billing pattern of the consumer has been matched with the wage earning pattern. All these efforts had a positive impact leading to substantial reduction in AT&C losses.
5.4.2 Initiatives to decrease theft of electricity
Towards an effort to enhance amicable settlement of theft cases, TPDDL encouraged the consumers caught in theft cases to admit the offense and avail waiving a smaller part of the outstanding dues. This effort brought a large number of defaulters into the paying consumer’s category. The certainty of punishment rather than the severity was established to send a clear message for compliance. Further, to incentivize mutual settlements and avoid lengthy process of courts, a waiver of 25 per cent of the billed amount was introduced for consumers opting for settlements, thereby ensuring cost effective and prompt resolution of cases. By the end of FY 2013, approximately 83,000 cases were settled without recourse to court cases.
The concept of providing bills on red colour paper, to the consumers caught in theft of cases, was introduced to bring moral pressure on the consumers.
5.4.3 Communicating with consumers
With the start of its operation, TPDDL started making efforts to change the image of a distribution licensee from a monopolistic utility to a consumer friendly organization by providing a better experience to the consumer interacting with the utility. With this in mind, TPDDL decided to reach out to the consumers, through consumer satisfaction survey and/ or through direct interaction during meeting by Resident Welfare Associations (RWA), so as to understand their concerns and aspirations. This was followed with the development of necessary mechanisms/ tools to meet the aspirations of the consumers and to inform them about steps being taken to meet their expectations. The initiative institutionalized by TPDDL to reach out to the consumers includes: � Conducting meetings with individual RWAs on the first Friday of the month. Subsequently, an initiative
“Udhaym — Humara Prayas Apka Vishwas” (a “town hall” meeting concept between RWA consumer and management representatives held as per the availability of consumers) was introduced
� Undertaking consumer satisfaction surveys to understand consumer expectations and level to which these expectations were being met
� Introduction of “E Sampark” newsletter to communicate all key initiatives, new services offered to the consumers. The newsletters were sent to the RWAs so that they may sensitize their community members on the initiatives
� Engaging eminent citizens of the society as “Brand Ambassadors” to act as a bridge between the consumers and TPDDL and to help in spreading TPDDL initiative
� Adopting segmented relationship approaches, TPDDL divided its consumers in various categories i.e., key consumers (hospitals, institutions, etc.), HRB consumer (tower, streetlights, etc.), G&I consumers (Government and Institutional consumers), HCB consumers (household, commercial, and agriculture), SCG (JJ colony consumers), and Xpress consumers (open access consumers). TPDDL appointed client and account managers to handle Xpresss, KCG, G&I, and, HRB consumers and consumer representative officer for HCB consumers
� Ensuring availability of entire top management of TPDDL during periodic meeting being held with consumer segments including annual meets with High-end Consumers, Yuva meet (Youth segment), Yugantar meet (Senior citizen segment), and Ujjwala meet (women segment)
� Introduction of SMS based services, video conferencing, etc. � Reaching out to consumers through print and electronic media in order to inform them regarding new initiatives,
planned outages, high profile power thefts, energy conservation, safety, etc.
TPDDL was the first amongst utilities in India to announce performance assurance to its consumers in terms of service delivery within stipulated timelines without any regulatory obligation.
5.5 Enriching the employee’s experience TPDDL inherited 5,300 employees of erstwhile DVB who were mainly having different work culture. Aligning the
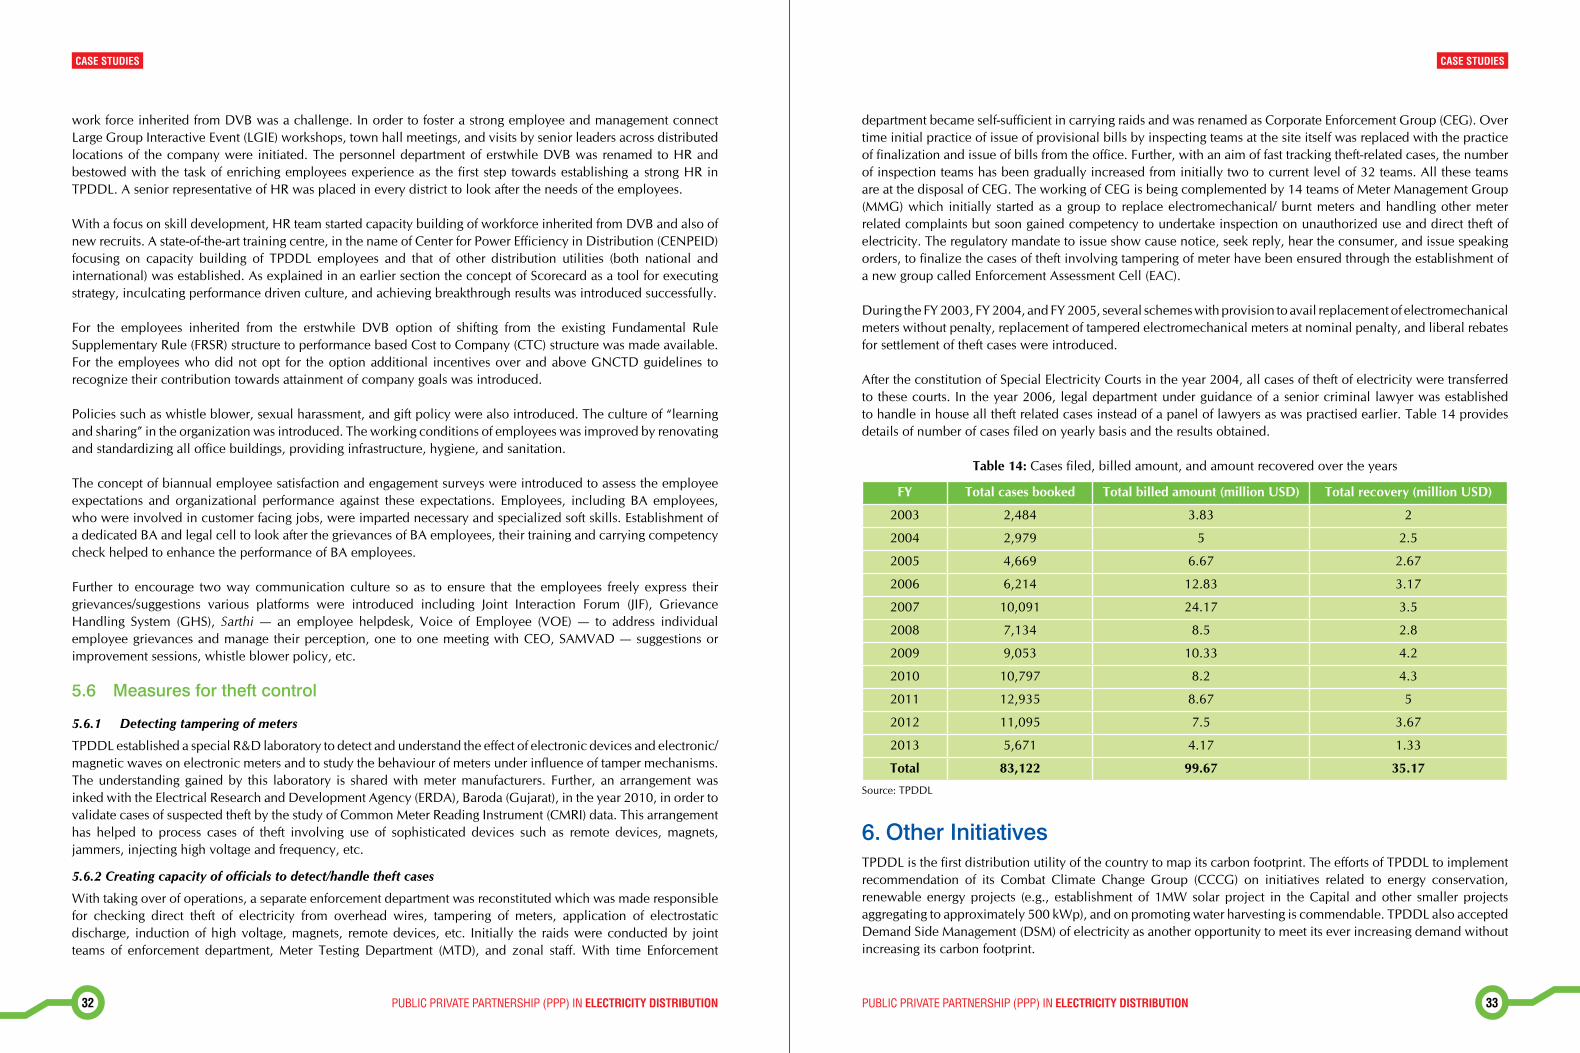
PUBLIC PRIVATE PARTNERSHIP (PPP) IN ELECTRICITY DISTRIBUTION 32 PUBLIC PRIVATE PARTNERSHIP (PPP) IN ELECTRICITY DISTRIBUTION 33
CASE STUDIESCASE STUDIES
work force inherited from DVB was a challenge. In order to foster a strong employee and management connect Large Group Interactive Event (LGIE) workshops, town hall meetings, and visits by senior leaders across distributed locations of the company were initiated. The personnel department of erstwhile DVB was renamed to HR and bestowed with the task of enriching employees experience as the first step towards establishing a strong HR in TPDDL. A senior representative of HR was placed in every district to look after the needs of the employees.
With a focus on skill development, HR team started capacity building of workforce inherited from DVB and also of new recruits. A state-of-the-art training centre, in the name of Center for Power Efficiency in Distribution (CENPEID) focusing on capacity building of TPDDL employees and that of other distribution utilities (both national and international) was established. As explained in an earlier section the concept of Scorecard as a tool for executing strategy, inculcating performance driven culture, and achieving breakthrough results was introduced successfully.
For the employees inherited from the erstwhile DVB option of shifting from the existing Fundamental Rule Supplementary Rule (FRSR) structure to performance based Cost to Company (CTC) structure was made available. For the employees who did not opt for the option additional incentives over and above GNCTD guidelines to recognize their contribution towards attainment of company goals was introduced.
Policies such as whistle blower, sexual harassment, and gift policy were also introduced. The culture of “learning and sharing” in the organization was introduced. The working conditions of employees was improved by renovating and standardizing all office buildings, providing infrastructure, hygiene, and sanitation.
The concept of biannual employee satisfaction and engagement surveys were introduced to assess the employee expectations and organizational performance against these expectations. Employees, including BA employees, who were involved in customer facing jobs, were imparted necessary and specialized soft skills. Establishment of a dedicated BA and legal cell to look after the grievances of BA employees, their training and carrying competency check helped to enhance the performance of BA employees.
Further to encourage two way communication culture so as to ensure that the employees freely express their grievances/suggestions various platforms were introduced including Joint Interaction Forum (JIF), Grievance Handling System (GHS), Sarthi — an employee helpdesk, Voice of Employee (VOE) — to address individual employee grievances and manage their perception, one to one meeting with CEO, SAMVAD — suggestions or improvement sessions, whistle blower policy, etc.
5.6 Measures for theft control
5.6.1 Detecting tampering of meters
TPDDL established a special R&D laboratory to detect and understand the effect of electronic devices and electronic/ magnetic waves on electronic meters and to study the behaviour of meters under influence of tamper mechanisms. The understanding gained by this laboratory is shared with meter manufacturers. Further, an arrangement was inked with the Electrical Research and Development Agency (ERDA), Baroda (Gujarat), in the year 2010, in order to validate cases of suspected theft by the study of Common Meter Reading Instrument (CMRI) data. This arrangement has helped to process cases of theft involving use of sophisticated devices such as remote devices, magnets, jammers, injecting high voltage and frequency, etc.
5.6.2 Creating capacity of officials to detect/handle theft cases
With taking over of operations, a separate enforcement department was reconstituted which was made responsible for checking direct theft of electricity from overhead wires, tampering of meters, application of electrostatic discharge, induction of high voltage, magnets, remote devices, etc. Initially the raids were conducted by joint teams of enforcement department, Meter Testing Department (MTD), and zonal staff. With time Enforcement
department became self-sufficient in carrying raids and was renamed as Corporate Enforcement Group (CEG). Over time initial practice of issue of provisional bills by inspecting teams at the site itself was replaced with the practice of finalization and issue of bills from the office. Further, with an aim of fast tracking theft-related cases, the number of inspection teams has been gradually increased from initially two to current level of 32 teams. All these teams are at the disposal of CEG. The working of CEG is being complemented by 14 teams of Meter Management Group (MMG) which initially started as a group to replace electromechanical/ burnt meters and handling other meter related complaints but soon gained competency to undertake inspection on unauthorized use and direct theft of electricity. The regulatory mandate to issue show cause notice, seek reply, hear the consumer, and issue speaking orders, to finalize the cases of theft involving tampering of meter have been ensured through the establishment of a new group called Enforcement Assessment Cell (EAC).
During the FY 2003, FY 2004, and FY 2005, several schemes with provision to avail replacement of electromechanical meters without penalty, replacement of tampered electromechanical meters at nominal penalty, and liberal rebates for settlement of theft cases were introduced.
After the constitution of Special Electricity Courts in the year 2004, all cases of theft of electricity were transferred to these courts. In the year 2006, legal department under guidance of a senior criminal lawyer was established to handle in house all theft related cases instead of a panel of lawyers as was practised earlier. Table 14 provides details of number of cases filed on yearly basis and the results obtained.
Table 14: Cases filed, billed amount, and amount recovered over the years
FY Total cases booked Total billed amount (million USD) Total recovery (million USD)
2003 2,484 3.83 2
2004 2,979 5 2.5
2005 4,669 6.67 2.67
2006 6,214 12.83 3.17
2007 10,091 24.17 3.5
2008 7,134 8.5 2.8
2009 9,053 10.33 4.2
2010 10,797 8.2 4.3
2011 12,935 8.67 5
2012 11,095 7.5 3.67
2013 5,671 4.17 1.33
Total 83,122 99.67 35.17
Source: TPDDL
6. Other InitiativesTPDDL is the first distribution utility of the country to map its carbon footprint. The efforts of TPDDL to implement recommendation of its Combat Climate Change Group (CCCG) on initiatives related to energy conservation, renewable energy projects (e.g., establishment of 1MW solar project in the Capital and other smaller projects aggregating to approximately 500 kWp), and on promoting water harvesting is commendable. TPDDL also accepted Demand Side Management (DSM) of electricity as another opportunity to meet its ever increasing demand without increasing its carbon footprint.

PUBLIC PRIVATE PARTNERSHIP (PPP) IN ELECTRICITY DISTRIBUTION 34 PUBLIC PRIVATE PARTNERSHIP (PPP) IN ELECTRICITY DISTRIBUTION 35
CASE STUDIESCASE STUDIES
TPDDL has engaged itself with the Regulatory Commission and various government departments and Ministries to help them in shaping regulations and policies for the overall development of the sector. Its effort on this front has been recognized by the Edison Electric Institute, USA which accorded the utility the “Policy Advocacy Award 2009”.
7. Accolades received/awards won for excellenceSince the takeover the efforts and achievements of TPDDL on various aspects have been appreciated and recognized by various organizations/institutions/government departments Ministries. Over the years, TPDDL has been awarded more than 37 accolades for its achievements. Some of the awards received by TPDDL have been indicated in Table 15.
Table 15: Accolades received by TPDDL over the years
Sl. No. Award Cause Conferred by
1 National Award for Meritorious Performance in Power Distribution for FY 2004–05 and FY 2005–06
For outstanding performance in power distribution
Ministry of Power, Government of India
2 Outstanding work in promoting Bhagidari initiative for FY 2006
For outstanding work in promoting Bhagidari initiative
GNCTD
3 NABL Accreditation for Tata Power-DDL’s meter testing lab
For establishment of state-of-the art meter testing lab
Department of Science and Technology, Government of India
4 Achievers Award for settling 10,000 Cases in Record Time between October 2003–July 2006
For successfully settled 10,000 cases in PLAs, Special Lok Adalats during October 2003– July 2006
The Hon’ble Chief Justice Delhi High Court
5 Excellence in Cost Management 2007 Award
Cost management initiatives Institute of Cost Accountancy of India (ICWAI)
6 The Edison Award For innovatively utilizing and integrating its Geographical Information System (GIS) with other applications for network planning, operations, commercial, and asset management
Edison Electric Institute (EEI)
7 National Award to Tata Power-DDL for Meritorious Performance in Power Distribution
For outstanding performance in power distribution
Ministry of Power, Government of India
8 Best Revenue Assurance Initiative (Metering Award) for FY 2008
For undertaking metering and revenue sustainability initiatives
Utility Planning Network Global AMI Utility Peer Group
9 National Award for Meritorious Performance (FY 2008–09)
For outstanding performance in power distribution
Ministry of Power, Government of India
Source: Available at http://www.ndpl.com/awards.aspx (last accessed on October 15, 2014)
8. Key takeawaysThe achievement of TPDDL and the steps taken by it to achieve the results are commendable. There are some key takeaways identified from the study which be useful for the success of PPP in power distribution as has been summarized below:
� High loss making areas makes better business sense for privatization: The potential of reducing the losses is much more through a PPP mode operation in high loss making areas. It is expected that even with lesser effort the overall losses in high loss making areas can be curtailed substantially. Thus, it may make better sense to open higher loss making areas for the implementation of PPP in electricity distribution.
� Upfront investment in system upgradation: TPDDL made huge upfront investment in system strengthening and upgradation and for the development and implementation of the process. This helped the utility to have a better control on the business and precision in decision making. This highlights the need of upfront investment in system upgradation. It also highlights the need to involve only such private partners who have deep pockets and the willingness to invest first and reap the reward later.
� Handholding by the public partner: The GNCTD made available the transition support to the utility. This helped the PPP institution to sail through the difficult initial phase of the business when the focus of TPDDL was on the development of system and process. The transition support extended by the public partner has been appreciated by various other studies as the major cause of success of PPP model in Delhi distribution sector.
� Innovative interventions for customer outreach: TPDDL undertook various innovative interventions, such as use of CSR funds to enrich the life of consumers in low income areas, concept of red bills, development of technologies to reduce theft, innovative use of technology, etc., paid-reach dividend to the utility in curtailing its theft. The PPP institutions may also rely on the environment-based innovative approach to reach out to the consumers which would increase the loyalty of the consumers towards the organization.
� Incentivizing consumers: The approach of the utility to incentivize the loyal consumers also paid handsomely. Interventions such as decreasing the upfront cost of metering of low income group consumers, provision of life insurance to the regular paying consumers, approach to encourage settlement of theft cases even with a bit lesser amount than that they may actually owe, so as to encourage consumers not to opt for the lengthy legal process, etc., helped the utility to achieve/ surpass its loss reduction trajectory.
� Motivating employees: No organization can flourish without the presence of motivated employees. Since takeover TPDDL focused on integration of the employees of erstwhile DVB in a different work culture. With its effort to enrich life of employees, the utility has been able to develop a strong team of dedicated employees.

PUBLIC PRIVATE PARTNERSHIP (PPP) IN ELECTRICITY DISTRIBUTION 36
CASE STUDIESCASE STUDIES
Conclusion
Overall conclusionsThe achievement of the two PPP case studies provides some key takeaways which may serve as a guideline for future implementation of PPP in power distribution. The major key takeaways learned from the study has been summarized below:
� High loss making areas makes better business sense: Areas which have high losses ( both AT’C and financial losses) make better sense as the private partner can use his managerial and technical skill to reduce AT’C and gain from the reduction in financial losses. Areas which do not have high losses do not provide this opportunity as there is very limited possibility of loss reduction and improvement in financials.
� Handholding by the public partner: The transition support to the PPP model is a must for the success of the model. As has been the case of Delhi, the support extended by the public partner to the PPP institution to sail through difficult initial phase of the business when focus of TPDDL was on the development of system and process. The transition support extended by public partner has been appreciated by various other studies as a major cause of success of PPP model.
� Upfront investment in system upgradation: Private investors with deep pockets who have the willingness to spend first on improving distribution system so as to provide secure and reliable supply are needed. It has been observed that customers are willing to pay once secure, reliable, and good quality power is assured.
� Consumer centric approach is essential for better results: The efforts of private partner towards better service delivery to consumer, for example, time bound resolution of complaints; an efficient consumer centre etc. is appreciated by the consumers. Developing business plan with focus on the consumer centric approach is expected to help in development of satisfaction and loyalty amongst the consumers.
� Involving the local community could help in curtailing losses: As has been the experience of Odisha the involvement of local community such as SHGs is expected to help in curtailment of losses.
� Social and political acceptance of franchisee model: Franchisee is considered to be partner of utility and carries activities on behalf of the utility. There has been no resistance from the staff of the utility or the consumer at large. This indicates that the franchisee model may be more socially and politically accepted.
� Innovative interventions for customer outreach: TPDDL undertook various innovative interventions, such as use of CSR funds to enrich the life of consumers in low income areas, concept of red bills, development of technologies to reduce theft, innovative use of technology, etc., paid reach dividend to the utility in curtailing its theft. The PPP institutions may also rely on the environment-based innovative approach to reach out to the consumers which would increase the loyalty of the consumers towards the organization.
� Incentivizing consumers: The approach of the PPP model to incentivize consumers so as to increase their loyalty also pays handsomely. Interventions such as decreasing the upfront cost of metering of low income group consumers, provision of life insurance to the regular paying consumers, approach to encourage settlement of theft cases even with a lesser amount than that they may actually owe so as to encourage consumers not to opt for the lengthy legal process, etc. may be important for the PPP utility to achieve it target.
� Motivating employees: No organization can flourish without the presence of motivated employees. Since takeover TPDDL focused on integration of the employees of erstwhile DVB in a different work culture. With its effort to enrich life of employees, the utility has been able to develop a strong team of dedicated employees.
NOTES
_________________________________________________________________________________________________
_________________________________________________________________________________________________
_________________________________________________________________________________________________
_________________________________________________________________________________________________
_________________________________________________________________________________________________
_________________________________________________________________________________________________
_________________________________________________________________________________________________
_________________________________________________________________________________________________
_________________________________________________________________________________________________
_________________________________________________________________________________________________
_________________________________________________________________________________________________
_________________________________________________________________________________________________
_________________________________________________________________________________________________
_________________________________________________________________________________________________
_________________________________________________________________________________________________
_________________________________________________________________________________________________
_________________________________________________________________________________________________
_________________________________________________________________________________________________
_________________________________________________________________________________________________
_________________________________________________________________________________________________
_________________________________________________________________________________________________
_________________________________________________________________________________________________
_________________________________________________________________________________________________
_________________________________________________________________________________________________

CASE STUDIES
NOTES
_________________________________________________________________________________________________
_________________________________________________________________________________________________
_________________________________________________________________________________________________
_________________________________________________________________________________________________
_________________________________________________________________________________________________
_________________________________________________________________________________________________
_________________________________________________________________________________________________
_________________________________________________________________________________________________
_________________________________________________________________________________________________
_________________________________________________________________________________________________
_________________________________________________________________________________________________
_________________________________________________________________________________________________
_________________________________________________________________________________________________
_________________________________________________________________________________________________
_________________________________________________________________________________________________
_________________________________________________________________________________________________
_________________________________________________________________________________________________
_________________________________________________________________________________________________
_________________________________________________________________________________________________
_________________________________________________________________________________________________
_________________________________________________________________________________________________
_________________________________________________________________________________________________
_________________________________________________________________________________________________
_________________________________________________________________________________________________

PUBLIC PRIVATE PARTNERSHIP (PPP) IN ELECTRICITY DISTRIBUTION IN INDIAThe Electricity Act 2003 has brought about a sea change in the functioning of the power sector in India. There has been substantial investment by private sector in power generation because of delicensing of generation. However, distribution being the last leg of the power sector has been its proverbial Achilles heel. Although, distribution sector has been corporatized with tariff being determined by independent Regulatory Commissions, the increase in operational efficiency has been rather slow as the distribution companies are still government owned. Different experiments of roping in private sector in power distribution have been tried , the first being that of majority equity stake by private sector with management control and the second being that of handing over certain functions to a private partner (a franchisee) with the government owned utility still being the owner and as such responsible for performance. One example of both the aforementioned model has been dealt with in this case study. This study will act as a guideline for future implementation of PPP model in electricity distribution.
ABOUT THE CASE STUDIES