electrical resistivity imaging for long-term autonomous
TRANSCRIPT
Missouri University of Science and Technology Missouri University of Science and Technology
Scholars' Mine Scholars' Mine
Geosciences and Geological and Petroleum Engineering Faculty Research & Creative Works
Geosciences and Geological and Petroleum Engineering
01 Jan 2015
Electrical Resistivity Imaging for Long-Term Autonomous Electrical Resistivity Imaging for Long-Term Autonomous
Monitoring of Hydrocarbon Degradation: Lessons from the Monitoring of Hydrocarbon Degradation: Lessons from the
Deepwater Horizon Oil Spill Deepwater Horizon Oil Spill
Jeffrey W. Heenan
Lee D. Slater
Dimitrios Ntarlagiannis
Estella A. Atekwana Missouri University of Science and Technology, [email protected]
et. al. For a complete list of authors, see https://scholarsmine.mst.edu/geosci_geo_peteng_facwork/1292
Follow this and additional works at: https://scholarsmine.mst.edu/geosci_geo_peteng_facwork
Part of the Geology Commons
Recommended Citation Recommended Citation J. W. Heenan et al., "Electrical Resistivity Imaging for Long-Term Autonomous Monitoring of Hydrocarbon Degradation: Lessons from the Deepwater Horizon Oil Spill," Geophysics, vol. 80, no. 1, pp. B1-B11, Society of Exploration Geophysicists, Jan 2015. The definitive version is available at https://doi.org/10.1190/geo2013-0468.1
This Article - Journal is brought to you for free and open access by Scholars' Mine. It has been accepted for inclusion in Geosciences and Geological and Petroleum Engineering Faculty Research & Creative Works by an authorized administrator of Scholars' Mine. This work is protected by U. S. Copyright Law. Unauthorized use including reproduction for redistribution requires the permission of the copyright holder. For more information, please contact [email protected].
Electrical resistivity imaging for long-term autonomousmonitoring of hydrocarbon degradation: Lessonsfrom the Deepwater Horizon oil spill
Jeffrey Heenan1, Lee D. Slater1, Dimitrios Ntarlagiannis1, Estella A. Atekwana2,Babu Z. Fathepure3, Sonal Dalvi3, Cameron Ross2,Dale D. Werkema4, and Eliot A. Atekwana2
ABSTRACT
Conceptual models for the geophysical responses associatedwith hydrocarbon degradation suggest that the long-term evo-lution of an oil plume will result in a more conductive anomalythan the initial contamination. In response to the DeepwaterHorizon (DH) oil spill into the Gulf of Mexico in 2010, anautonomous resistivity monitoring system was deployed onGrand Terre, Louisiana, in an attempt to monitor natural degra-dation processes in hydrocarbon-impacted beach sediments ofthis island. A 48-electrode surface array with a 0.5-m spacingwas installed to obtain twice-daily images of the resistivitystructure of the shallow subsurface impacted by oil. Over the
course of approximately 18 months, we observed a progressivedecrease in the resistivity of the DH spill-impacted region. De-tailed analysis of pixel/point resistivity variation within the im-aged area showed that long-term decreases in resistivity werelargely associated with the DH-impacted sediments. A microbialdiversity survey revealed the presence of hydrocarbon-degradingorganisms throughout the test site. However, hydrocarbon degra-dation activity was much higher in the DH-impacted locationscompared to nonimpacted locations, suggesting the presenceof active hydrocarbon degraders, supporting biodegradation proc-esses. The results of this long-term monitoring experiment sug-gested that resistivity might be used to noninvasively monitor thelong-term degradation of crude oil spills.
INTRODUCTION
The present trend toward more sustainable remediation (Ellis,2009), and, in turn, the need for more robust tools for long-termmonitoring, demands innovative applications of established andnew techniques, including geophysical methods. Advances in tech-nology and improved understanding of geophysical signals haveallowed for geophysical methods such as electric resistivity to beused for mapping, monitoring, and characterization of contami-nants. Advantages such as cost efficiency, non- or minimally inva-sive application, high temporal and spatial resolution, and the
recently shown potential for autonomous operation (LaBrecqueet al., 2004; Versteeg et al., 2006; Johnson et al., 2012; Robinsonet al., 2012) make electrical geophysical methods a viable option forlong term monitoring projects.Geophysical methods are increasingly being used for detection/
monitoring of microbial processes within earth media (Atekwanaet al., 2006; Atekwana and Slater, 2009). The presence and activityof microorganisms have been documented to impact geophysicalsignals, such as electric resistivity (Atekwana et al., 2000). Alter-ations in pore-fluid chemistry, the formation/removal of solidphases, and the addition of biodegradation by-products have been
Manuscript received by the Editor 16 December 2013; revised manuscript received 16 September 2014; published online 22 December 2014.1Rutgers University, Department of Earth and Environmental Sciences, Newark, New Jersey, USA. E-mail: [email protected]; dimntar@
rutgers.edu; [email protected] State University, Boone Pickens School of Geology, Stillwater, Oklahoma, USA. E-mail: [email protected]; camersr@ostatemail:
.okstate.edu; [email protected] State University, Microbiology and Molecular Genetics, Stillwater, Oklahoma, USA. E-mail: [email protected]; sonal.dalvi@
okstate.edu.4United States Environmental Protection Agency, Las Vegas, Nevada, USA. E-mail: [email protected].© 2014 Society of Exploration Geophysicists. All rights reserved.
B1
GEOPHYSICS, VOL. 80, NO. 1 (JANUARY-FEBRUARY 2015); P. B1–B11, 11 FIGS.10.1190/GEO2013-0468.1
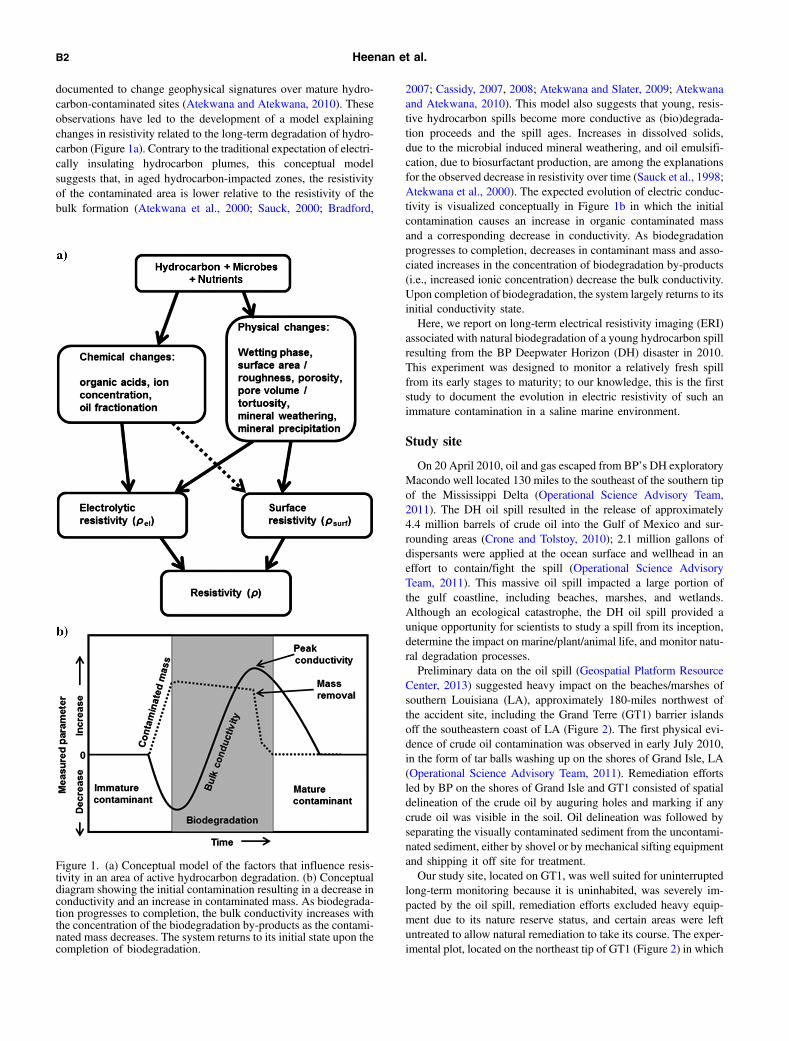
documented to change geophysical signatures over mature hydro-carbon-contaminated sites (Atekwana and Atekwana, 2010). Theseobservations have led to the development of a model explainingchanges in resistivity related to the long-term degradation of hydro-carbon (Figure 1a). Contrary to the traditional expectation of electri-cally insulating hydrocarbon plumes, this conceptual modelsuggests that, in aged hydrocarbon-impacted zones, the resistivityof the contaminated area is lower relative to the resistivity of thebulk formation (Atekwana et al., 2000; Sauck, 2000; Bradford,
2007; Cassidy, 2007, 2008; Atekwana and Slater, 2009; Atekwanaand Atekwana, 2010). This model also suggests that young, resis-tive hydrocarbon spills become more conductive as (bio)degrada-tion proceeds and the spill ages. Increases in dissolved solids,due to the microbial induced mineral weathering, and oil emulsifi-cation, due to biosurfactant production, are among the explanationsfor the observed decrease in resistivity over time (Sauck et al., 1998;Atekwana et al., 2000). The expected evolution of electric conduc-tivity is visualized conceptually in Figure 1b in which the initialcontamination causes an increase in organic contaminated massand a corresponding decrease in conductivity. As biodegradationprogresses to completion, decreases in contaminant mass and asso-ciated increases in the concentration of biodegradation by-products(i.e., increased ionic concentration) decrease the bulk conductivity.Upon completion of biodegradation, the system largely returns to itsinitial conductivity state.Here, we report on long-term electrical resistivity imaging (ERI)
associated with natural biodegradation of a young hydrocarbon spillresulting from the BP Deepwater Horizon (DH) disaster in 2010.This experiment was designed to monitor a relatively fresh spillfrom its early stages to maturity; to our knowledge, this is the firststudy to document the evolution in electric resistivity of such animmature contamination in a saline marine environment.
Study site
On 20 April 2010, oil and gas escaped from BP’s DH exploratoryMacondo well located 130 miles to the southeast of the southern tipof the Mississippi Delta (Operational Science Advisory Team,2011). The DH oil spill resulted in the release of approximately4.4 million barrels of crude oil into the Gulf of Mexico and sur-rounding areas (Crone and Tolstoy, 2010); 2.1 million gallons ofdispersants were applied at the ocean surface and wellhead in aneffort to contain/fight the spill (Operational Science AdvisoryTeam, 2011). This massive oil spill impacted a large portion ofthe gulf coastline, including beaches, marshes, and wetlands.Although an ecological catastrophe, the DH oil spill provided aunique opportunity for scientists to study a spill from its inception,determine the impact on marine/plant/animal life, and monitor natu-ral degradation processes.Preliminary data on the oil spill (Geospatial Platform Resource
Center, 2013) suggested heavy impact on the beaches/marshes ofsouthern Louisiana (LA), approximately 180-miles northwest ofthe accident site, including the Grand Terre (GT1) barrier islandsoff the southeastern coast of LA (Figure 2). The first physical evi-dence of crude oil contamination was observed in early July 2010,in the form of tar balls washing up on the shores of Grand Isle, LA(Operational Science Advisory Team, 2011). Remediation effortsled by BP on the shores of Grand Isle and GT1 consisted of spatialdelineation of the crude oil by auguring holes and marking if anycrude oil was visible in the soil. Oil delineation was followed byseparating the visually contaminated sediment from the uncontami-nated sediment, either by shovel or by mechanical sifting equipmentand shipping it off site for treatment.Our study site, located on GT1, was well suited for uninterrupted
long-term monitoring because it is uninhabited, was severely im-pacted by the oil spill, remediation efforts excluded heavy equip-ment due to its nature reserve status, and certain areas were leftuntreated to allow natural remediation to take its course. The exper-imental plot, located on the northeast tip of GT1 (Figure 2) in which
Figure 1. (a) Conceptual model of the factors that influence resis-tivity in an area of active hydrocarbon degradation. (b) Conceptualdiagram showing the initial contamination resulting in a decrease inconductivity and an increase in contaminated mass. As biodegrada-tion progresses to completion, the bulk conductivity increases withthe concentration of the biodegradation by-products as the contami-nated mass decreases. The system returns to its initial state upon thecompletion of biodegradation.
B2 Heenan et al.
no remediation efforts took place, was centered on an area with anidentified subsurface oil layer approximately 15-cm thick and atapproximately 60-cm below the surface, based on observationsfrom test pits, at the time of the monitoring system deployment.
MATERIALS AND METHODS
Electrical resistivity imaging
ERI is used to calculate the resistivity ðρÞ dis-tribution within the subsurface by injecting cur-rent and measuring the resulting potentialdifferences on a dense array of electrodes (Binleyand Kemna, 2005). This method has been exten-sively applied for monitoring saline intrusions(Slater et al., 2000), moisture transport in the va-dose zone (Daily et al., 1992; Binley et al., 2002),and leaks from storage tanks (Daily et al., 2004;Rucker et al., 2011). The conventional regulari-zation approach in ERI is to solve for the modelwith minimal structure that fits the data to someprescribed level of tolerance that is determinedby the measurement errors (deGroot-Hedlinand Constable, 1990). In this experiment, the fol-lowing objective function was minimized:
ϕðmÞ ¼ kWd½d − fðmÞ�2kþ αkWm½m −mref �2k; (1)
where f is a forward operator, d is the measure-ment data vector, α is a regularization parameter,and Wm is a model weighting matrix related to areference model mref (Binley and Kemna, 2005).Reliable quantification of measurement errors
is needed to appropriately condition the inversion(LaBrecque et al., 1996), and the inverse problemneeds to be weighted by the measurement errorto generate a model with a structure justified bythe collected data and calculated noise levels(Binley and Kemna, 2005). A widely usedmethod for quantification of measurement erroris the reciprocal measurement, whereby the po-tential and current electrodes are switched. Asper the principle of reciprocity, differences be-tween normal and reciprocal errors quantify theerror in a measurement (Slater et al., 2000; Koes-tel et al., 2008).Resolution of ERI is a complex function of
survey design (number of electrodes, electrodespacing, number of measurements, arrangementof electrodes, etc.) and the unknown subsurfaceresistivity distribution. As the depth of investiga-tion (DOI) increases, the resolution will begin todecrease, due to the decrease in current density inthe subsurface. Resolution decreases towardthe end of a 2D ERI line because fewer electro-des are available at either side of a surveypoint. A useful metric for assessing resolutionis the DOI index, which quantifies the depthin which the surface electric resistivity survey
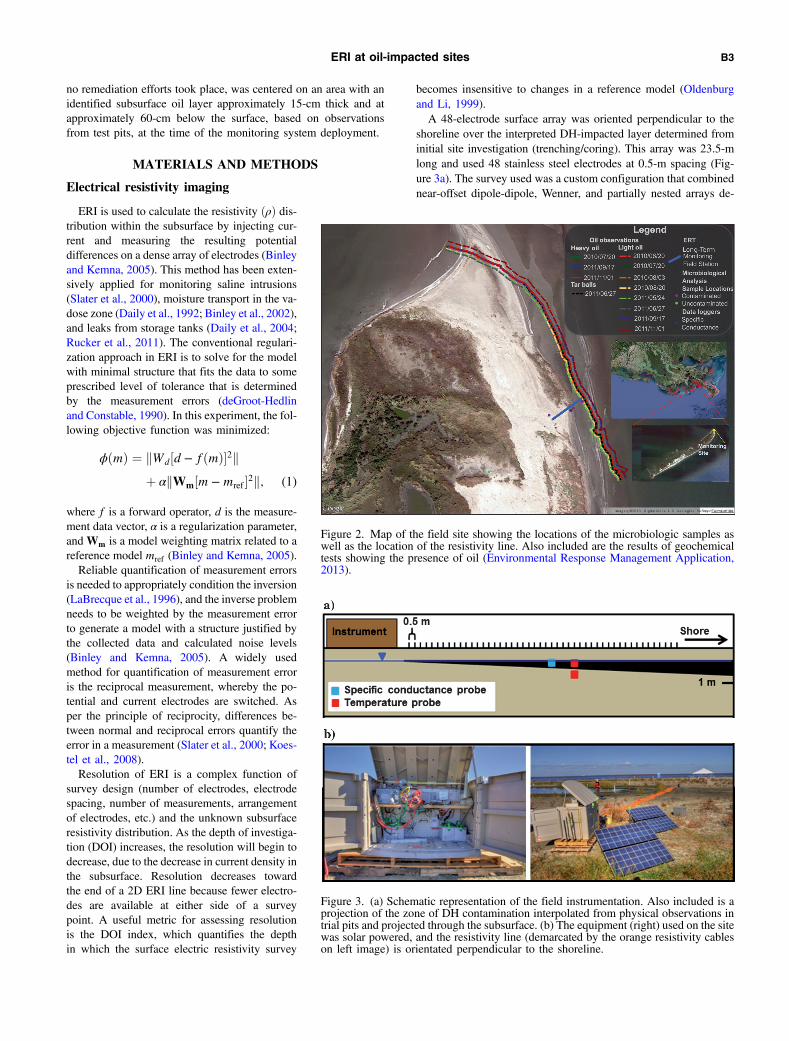
becomes insensitive to changes in a reference model (Oldenburgand Li, 1999).A 48-electrode surface array was oriented perpendicular to the
shoreline over the interpreted DH-impacted layer determined frominitial site investigation (trenching/coring). This array was 23.5-mlong and used 48 stainless steel electrodes at 0.5-m spacing (Fig-ure 3a). The survey used was a custom configuration that combinednear-offset dipole-dipole, Wenner, and partially nested arrays de-
Figure 3. (a) Schematic representation of the field instrumentation. Also included is aprojection of the zone of DH contamination interpolated from physical observations intrial pits and projected through the subsurface. (b) The equipment (right) used on the sitewas solar powered, and the resistivity line (demarcated by the orange resistivity cableson left image) is orientated perpendicular to the shoreline.
Figure 2. Map of the field site showing the locations of the microbiologic samples aswell as the location of the resistivity line. Also included are the results of geochemicaltests showing the presence of oil (Environmental Response Management Application,2013).
ERI at oil-impacted sites B3
signed to provide a large signal-to-noise ratio and minimize dataerrors. Based on synthetic modeling tests done prior to the survey,this configuration provided comparable resolution to other arrays.The instrumentation was solar powered, the solar panels being usedto charge four deep-cycle marine batteries connected to the surveyequipment. These batteries, a computer, and a 96-channel IRIS Sy-scal Pro Resistivity/IP system were encased in a rugged plastichousing to protect them from the elements during normal conditions(Figure 3b).Measurements were collected twice per day, at 8:00 am/pm. In
total, 473 data sets, in addition to reciprocal data sets for error as-sessment, were collected over approximately 18 months of opera-tion in essentially three measurement periods. The first was fromJanuary 2011 to May 2011, the second was from August 2011to October 2011, and the third was from March 2012 to May2012. The first data set, collected on 13 January 2011, representeda background data set that was used as a baseline for all of the com-parative analyses conducted.In parallel with the geophysical monitoring, we continuously re-
corded subsurface temperature and, in the second and third time peri-ods, the specific conductance of the pore fluid, both of which exert astrong influence on resistivity. Temperature loggers were installedwith one probe placed in the DH-impacted layer (0.6-m below sur-face) and the second probe below, in the non-DH-impacted sediment(1-m below surface). A salinity logger directly recorded fluid-specificconductance; this probe was again installed 0.6-m below surface in
the DH-impacted layer. All loggers were installed in slotted PVCpipes providing contact with the fluid in the subsurface.
Error analysis
Assessing measurement error is important to accurately process-ing and interpreting the data. Reciprocal error analysis is an effec-tive method of calculating these errors (Binley and Kemna, 2005;Koestel et al., 2008). The reciprocal error for each measurement wascalculated using
εR ¼�����ðN − RÞ
N
����� × 100; (2)
where N is the normal measurement and R is the reciprocal meas-urement. Any data point with reciprocal error greater than 5% wasdiscarded. If a data set did not meet this criteria for >90% of thedata points in that data set, the data set was discarded. In total, 428of 478 data sets were retained (245/251 for period 1, 109/111 forperiod 2, and 74/111 for period 3).It is necessary to assign weights to represent the uncertainties of
each measurement in the inversion. Common practice is to use thereciprocal errors of the measured data to develop error models forthe input measurements. We followed the approach of Koestel et al.(2008) to describe the absolute reciprocal error as a function of re-sistance. As a result of the data being collected in three discrete time
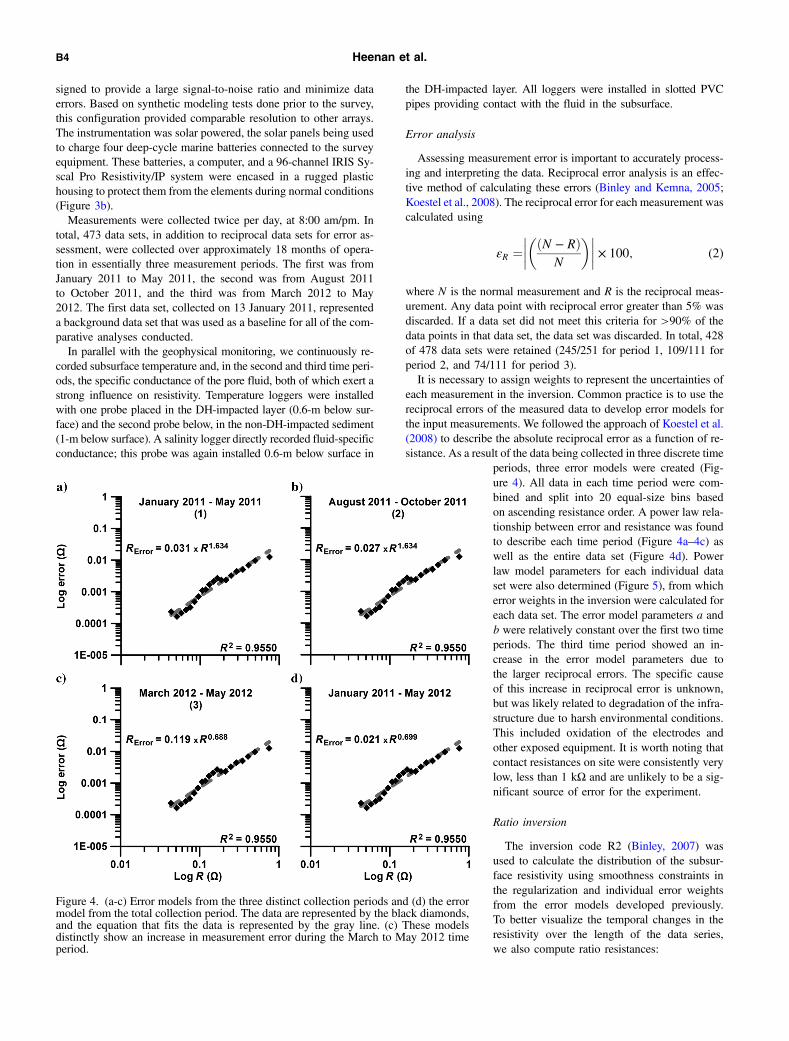
periods, three error models were created (Fig-ure 4). All data in each time period were com-bined and split into 20 equal-size bins basedon ascending resistance order. A power law rela-tionship between error and resistance was foundto describe each time period (Figure 4a–4c) aswell as the entire data set (Figure 4d). Powerlaw model parameters for each individual dataset were also determined (Figure 5), from whicherror weights in the inversion were calculated foreach data set. The error model parameters a andb were relatively constant over the first two timeperiods. The third time period showed an in-crease in the error model parameters due tothe larger reciprocal errors. The specific causeof this increase in reciprocal error is unknown,but was likely related to degradation of the infra-structure due to harsh environmental conditions.This included oxidation of the electrodes andother exposed equipment. It is worth noting thatcontact resistances on site were consistently verylow, less than 1 kΩ and are unlikely to be a sig-nificant source of error for the experiment.
Ratio inversion
The inversion code R2 (Binley, 2007) wasused to calculate the distribution of the subsur-face resistivity using smoothness constraints inthe regularization and individual error weightsfrom the error models developed previously.To better visualize the temporal changes in theresistivity over the length of the data series,we also compute ratio resistances:
Figure 4. (a-c) Error models from the three distinct collection periods and (d) the errormodel from the total collection period. The data are represented by the black diamonds,and the equation that fits the data is represented by the gray line. (c) These modelsdistinctly show an increase in measurement error during the March to May 2012 timeperiod.
B4 Heenan et al.

Rratio ¼Rt
R0
× Rf; (3)
where Rt is the resistance from the data set of interest, R0 is thecorresponding resistance of the first data set, and Rf is the corre-sponding resistance of a forward model determined for asubsurface with a homogeneous resistivity distribution (Slater et al.,2000).When a ratio inversion is used, errors from the two measurements
at different times (the measurement at time t, the background meas-urement at time t0) and the error associated with the forward modelaccuracy must be propagated; i.e.,
ε ¼ affiffiffiffiffiffiffiffiffiffiffiffiffiffiffiffiffiffiffiffiffiffiffiffiffiffiffiffiffiffiffiffiffiffiffiffiffiffiffiffiffiðεtÞ2 þ ðε0Þ2 þ ðεFÞ2
q; (4)
where a is a factor increasing the magnitude of the error, εt is theerror associated with the measurement from the tth data set, ε0 is theerror associated with the measurement from the background dataset, and εF is the error associated with the forward model. Dueto the very low errors in the data, convergence could not be achievedusing the weights from the reciprocal error model alone. As a result,the errors were doubled (equation 4) because it allowed for conver-gence in 2–4 iterations for all of the 428 data sets used, while notoverly smoothing the results.
Temperature correction
Temperature variations in the subsurface affect resistivity mea-surements, as ion mobility and temperature are directly related(Sen and Goode, 1992). The resistivity will decrease or increaseby 2.5% for every 1°C (Keller and Frischknecht, 1966) as the tem-perature increases and decreases, respectively. These data required atemperature correction because they compared data that spanned thecourse of more than a year with surveys in each season. Subsurfacetemperatures measured at the GT1 site varied up to 15°C. The tem-perature variations in this system were likely driven by solar heat-ing, via conductive and convective heat transfer. On all the invertedimages, we normalize the data to 20°C (293°K) using
ρ ¼ ρT ½1þ βðT − T0Þ�; (5)
where ρT and T are the in situ resistivity and temperature, respec-tively, T0 is 20°C (293°K), and β is a temperature coefficient equalto 0.0177 (Shevnin et al., 2007). This was then modified for theratio resistivity inversion to take the background data set into ac-count using
ρR ¼ ρ0½1þ βðTt − T0Þ� − ρ0ρ0
þ ρtρ0
; (6)
where ρR is the ratio resistivity, ρ0 is the corrected resistivity fromthe background data set, and Tt and T0 are the temperatures of thedata set of interest and background data, respectively. The first termon the right side of the equation represents the correction for thetemperature variation alone. This known value, as well as the cal-culated ρR, allows the equation to be solved for the second term onthe right. This term is the influence of all the other factors not re-lated to temperature, including variations related to changing sub-surface and was the focus of the data interpretation. For this
simplified subsurface temperature distribution, the data from theupper temperature logger were used to correct the resistivity inthe upper 0.8 m of the image. Deeper than 0.8 m, the data fromthe lower temperature logger were used. The temperature correctionwas applied following the inversion process.
Model resolution
The model resolution, described here by the DOI (Oldenburg andLi, 1999), provides an appraisal of the imaged region in terms ofinformation content and sensitivity to the data acquired. Oldenburgand Li (1999) propose two methods for calculating the DOI forappraisal of model resolution. The method used here compared asingle data set regularized to two different homogeneous referencebackgrounds. In this method, the DOI index can be calculated by
DOIðx; zÞ ¼ m1ðx; zÞ −m2ðx; zÞm1r −m2r
; (7)
wherem1r andm2r are the values used to define the resistivity of thehomogeneous background medium of each inversion, and m1 andm2 are the results from the inversions. As the DOI index approaches
Figure 5. (a) The power law (ε ¼ bxRa) error model parameters, aand b, show a relatively constant error model for the first two timeperiods. The third time period shows a large change in the modelparameters due to the larger reciprocal errors. (b) The calculatedreciprocal error as a function of time by applying the power lawerror model to the data. In this case, the error model is calculatedindividually for each data set. There is a decrease in the measure-ment error beginning in April 2011 and ending in October 2011.This is related to the deployment of a new, ruggedized cable array.There are two isolated spikes of high measurement error in this timeperiod, although the cause of these is unknown. A significant in-crease in the error occurred after October 2012.
ERI at oil-impacted sites B5
0, the inversions will produce an identical result for any referencemodel. As the DOI approaches 1, these values are highly dependenton the reference model and have low credibility (Oldenburg and Li,1999). The model space is mostly characterized by a DOI below0.2. The DOI value of 0.2 has been previously determined to bean acceptable degree of resolution (Oldenburg and Li, 1999).
Microbiology
The biodegradation potential of indigenous microbial popula-tions was assessed using microcosms that were set up with sedimentsamples from DH-impacted as well as nonimpacted areas at thestudy site (Figure 2). The microbial diversity and microbial com-munity structure of native populations in soil/sediment samples col-lected from the study site were determined by amplifying 16S rRNAgenes using the universal primer sets, 515F and 1391R and the pol-ymerase chain reaction (PCR) method described elsewhere (Sei andFathepure, 2009). In addition, in situ biodegradation potentials ofhydrocarbons at DH-impacted and nonimpacted areas of the studysite were determined by screening for the presence of a variety ofhydrocarbon-degrading genes that code for monooxygenase and di-oxygenase enzymes. Please see the section “Determining microbialdiversity and biodegradation potential” in Appendix A for detailedinformation on determining the diversity and biodegradation poten-tial of the microbes at the site.
RESULTS
Electrical resistivity imaging
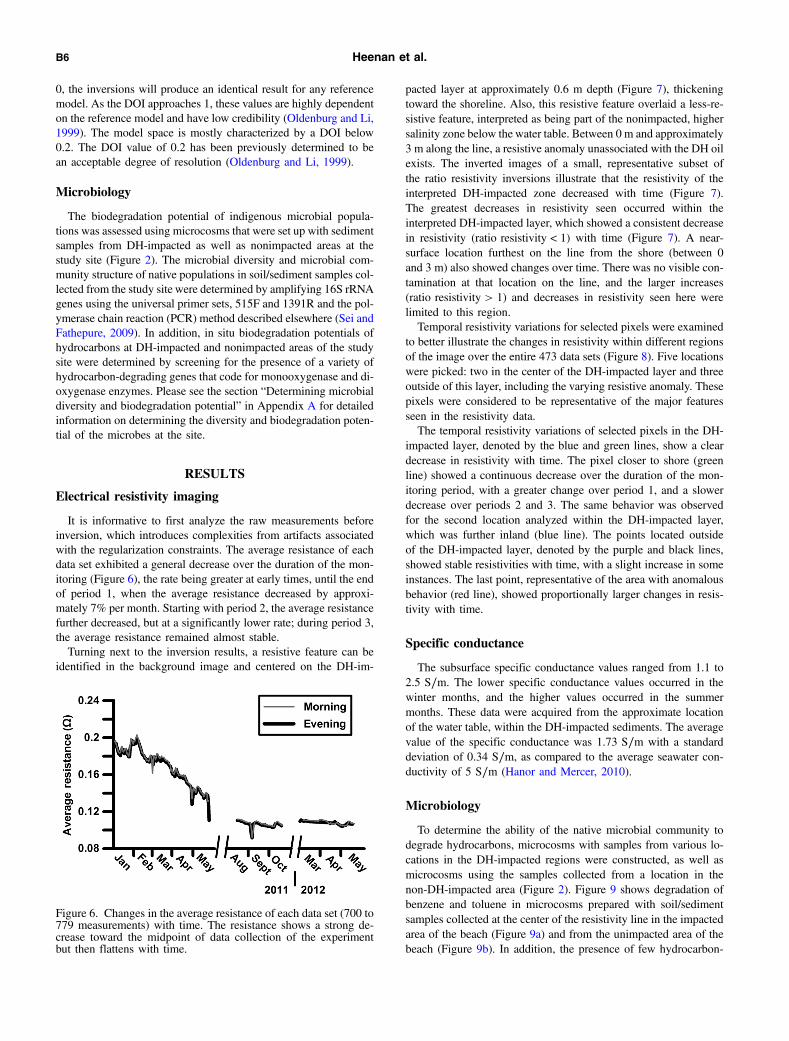
It is informative to first analyze the raw measurements beforeinversion, which introduces complexities from artifacts associatedwith the regularization constraints. The average resistance of eachdata set exhibited a general decrease over the duration of the mon-itoring (Figure 6), the rate being greater at early times, until the endof period 1, when the average resistance decreased by approxi-mately 7% per month. Starting with period 2, the average resistancefurther decreased, but at a significantly lower rate; during period 3,the average resistance remained almost stable.Turning next to the inversion results, a resistive feature can be
identified in the background image and centered on the DH-im-
pacted layer at approximately 0.6 m depth (Figure 7), thickeningtoward the shoreline. Also, this resistive feature overlaid a less-re-sistive feature, interpreted as being part of the nonimpacted, highersalinity zone below the water table. Between 0 m and approximately3 m along the line, a resistive anomaly unassociated with the DH oilexists. The inverted images of a small, representative subset ofthe ratio resistivity inversions illustrate that the resistivity of theinterpreted DH-impacted zone decreased with time (Figure 7).The greatest decreases in resistivity seen occurred within theinterpreted DH-impacted layer, which showed a consistent decreasein resistivity (ratio resistivity < 1) with time (Figure 7). A near-surface location furthest on the line from the shore (between 0and 3 m) also showed changes over time. There was no visible con-tamination at that location on the line, and the larger increases(ratio resistivity > 1) and decreases in resistivity seen here werelimited to this region.Temporal resistivity variations for selected pixels were examined
to better illustrate the changes in resistivity within different regionsof the image over the entire 473 data sets (Figure 8). Five locationswere picked: two in the center of the DH-impacted layer and threeoutside of this layer, including the varying resistive anomaly. Thesepixels were considered to be representative of the major featuresseen in the resistivity data.The temporal resistivity variations of selected pixels in the DH-
impacted layer, denoted by the blue and green lines, show a cleardecrease in resistivity with time. The pixel closer to shore (greenline) showed a continuous decrease over the duration of the mon-itoring period, with a greater change over period 1, and a slowerdecrease over periods 2 and 3. The same behavior was observedfor the second location analyzed within the DH-impacted layer,which was further inland (blue line). The points located outsideof the DH-impacted layer, denoted by the purple and black lines,showed stable resistivities with time, with a slight increase in someinstances. The last point, representative of the area with anomalousbehavior (red line), showed proportionally larger changes in resis-tivity with time.
Specific conductance
The subsurface specific conductance values ranged from 1.1 to2.5 S∕m. The lower specific conductance values occurred in thewinter months, and the higher values occurred in the summermonths. These data were acquired from the approximate locationof the water table, within the DH-impacted sediments. The averagevalue of the specific conductance was 1.73 S∕m with a standarddeviation of 0.34 S∕m, as compared to the average seawater con-ductivity of 5 S∕m (Hanor and Mercer, 2010).
Microbiology
To determine the ability of the native microbial community todegrade hydrocarbons, microcosms with samples from various lo-cations in the DH-impacted regions were constructed, as well asmicrocosms using the samples collected from a location in thenon-DH-impacted area (Figure 2). Figure 9 shows degradation ofbenzene and toluene in microcosms prepared with soil/sedimentsamples collected at the center of the resistivity line in the impactedarea of the beach (Figure 9a) and from the unimpacted area of thebeach (Figure 9b). In addition, the presence of few hydrocarbon-
Figure 6. Changes in the average resistance of each data set (700 to779 measurements) with time. The resistance shows a strong de-crease toward the midpoint of data collection of the experimentbut then flattens with time.
B6 Heenan et al.

degrading genes such as 1, 2-CTD, 2,3-CTD, 3,4-PCA, TOD, Phe,Bhp, Nah, and Alk B were tested for in all samples collected at thesite. Results show the presence of Phe at all locations includingsamples collected from the nonimpacted location. Ring-cleavinggenes, 1,2-CAT, 2,3-CAT, and 3,4-PCA were detected at the twoinland sample locations in the impacted area but not in samplesfrom locations closest to the shore. Ring hydrolxylating genes(TOD, Bhp, Nah) and the alkane hydroxylating gene (AlkB) werenot detected in any of the tested samples.The microcosm studies and the survey for the presence of a va-
riety of hydrocarbon degrading genes at contaminated locations areimportant for understanding the capability of indigenous micro-organisms to degrade hydrocarbons. Such information could aidin understanding and advancing bioremediation of contaminatedsites. Interestingly, ring hydroxylating genePhe was detected in all samples including sam-ples from the non-impacted location. Phe is amonooxygenase that catalyzes the initial stepin degradation by incorporating a hydroxyl moi-ety in a variety of aromatic compounds such asbenzene, indole, phenol, and substituted phenols(fluoro-, chloro-, amino-, and methyl-phenols)(Neujahr and Gaal, 1973; Neujahr and Kjellen,1978; Qu et al., 2012) converting these com-pounds to catechol, which is then broken downby ring cleaving 1,2-CAT and 2,3-CAT and as-similated for growth. Microorganisms withmulticomponent phenol hydroxylase are distrib-uted worldwide and seem to be the most ubiqui-tous in the environment (Sandhu et al., 2009).For further details on the results of the DNAanalysis, please refer to the section “Results ofDNA analysis” in Appendix A.
DISCUSSION
Resistance data and inverted resistivity imagesindicate a steady decrease in resistivity of thesubsurface for the first five months of data col-lection, with the largest decreases associated withthe DH-impacted zone. The resistance data andresistivity images then begin to stabilize five tosix months into data collection, consistent withthe conceptual evolution of conductivity shownin Figure 1b as the contaminant matures. Theseresults indicate the viability of resistivity moni-toring of the degradation of hydrocarbon con-taminants in a remote environment. Our resultsare consistent with the conductive hydrocarbondegradation model (Atekwana et al., 2000;Sauck, 2000; Bradford, 2007; Cassidy, 2007,2008; Atekwana and Slater, 2009; Atekwanaand Atekwana, 2010), proposing that aging hy-drocarbon plumes become less resistive overtime. This experiment represents the first field at-tempt (as far as we are aware) to capture an oilspill from an early stage and study the evolutionof the subsurface electric properties as the spillmatures. As implied by this conceptual model,the interpreted hydrocarbon contamination at
our site appears to become more conductive over time. Due tothe fact that no engineered remediation efforts were performed atthe site, and hydrocarbon degrading microbes are in abundance,we infer that the observed decrease in resistivity is likely drivenby the microbial degradation of the hydrocarbon contamination.The single pixel analysis confirmed that the long-term resistivity
decreases are strongest in and around the DH-impacted layer (Fig-ure 8). The stabilization of the resistivity between May and August2011 may potentially signify a decrease in the rate of degradation orthe completion of the degradation process. If changes in ground-water composition due to the tide were the driving force on resis-tivity changes at the site, then resistivity would likely showincreases and decreases with time and not the long-term trend tolower resistivity observed here. Furthermore, we would expect that
Figure 7. Ratio resistivity images indicate a decrease in resistivity within the DH-impacted layer with time. This layer is located at approximately 0.6–1.0-m depthand is characterized by a higher resistivity anomaly when compared to the surroundingarea, with the exception of the inland, shallow resistive anomaly. The location andgeometry of this resistivity anomaly is consistent with the inferred location of theDH oil layer in the conceptual model of the site (Figure 3a). In these sections, >1 in-dicates an increase, 1 indicates no change, and <1 indicates a decrease.
ERI at oil-impacted sites B7

tidal processes would change the conductivity in a similar way in-side and outside of the zone of contamination. The distribution ofresistivities outside of the DH-impacted layer (Figure 8) indicatesthat temporal variations in the resistivity were smaller and do notshow the trend observed within the DH-impacted zone. The onlyexception to this was a shallow inland zone in which the changeswere not consistent with changes seen in other regions during theexperiment. These variations are likely associated with periodicvegetation growth observed at these locations and the resultingvariations in moisture content driven by evapotranspiration. Alter-natively, these variations may have been driven by gas accumulationresulting from biodegradation processes. This is considered lesslikely in this specific instance because this region was not locatedover the contaminated layer.The increases in pixel conductivity within the contaminated layer
coincide with increases in specific conductance seen in this layer asshown in Figure 10, in which the ratio of the first specific conduct-ance measurement to the tth specific conductance measurement isplotted in a time series with the ratio conductivity σ inside (Fig-ure 10) and outside of the contaminated layer (Figure 10). Thisis consistent with previous studies in which degrading or degradedhydrocarbons were imaged as more conductive anomalies due todegradation by-products such as increased ion concentration inthe pore fluid. The ratio conductivity outside of the contaminatedlayer shows no correlation to the variations in the ratio specific con-ductance whereas the ratio conductivity within shows the evidenceof a positive correlation.We believe that the low-molecular-weight hydrocarbons, ali-
phatic as well as aromatic hydrocarbons, are removed through vola-tilization at the surface. However, this is not a major attenuating
Figure 8. Selected pixel resistivity variation over time. The pointswithin the interpreted DH-impacted zone (green and blue) show adecrease in resistivity over time. The points outside of the DH-impacted zone (black and purple) show much weaker changes inresistivity over the duration of the experiment. The inland andnear-surface high-resistivity anomalies (red) show more pro-nounced fluctuations and larger changes over time. The breaks re-present periods in time when the site experienced system outages.
Figure 9. (a) Biodegradation of hydrocarbons in microcosms set upwith samples from location 4 (DH-impacted site). Benzene and tol-uene degraded quickly in active bottles compared to autoclaved bot-tles suggesting biologic degradation capacity. The secondary spikesin concentration are a result of the active bottles being refed benzeneor toluene. (b) Biodegradation of hydrocarbons at location 2 (out-side the zone of DH contamination). No appreciable degradation ofbenzene or toluene occurred in three weeks.
Figure 10. Single pixel ratio conductivities from the second meas-urement period (inside and outside of the contaminated region,color matched to Figure 8) plotted alongside ratio-specific conduct-ance measurements. The ratio resistivity conductivities from thepoint outside of the contaminated region remain largely constant.Variations in ratio resistivity from within the contaminated layerare consistent with variations in the ratio specific conductance.
B8 Heenan et al.

factor in the deeper layers of the sediments. In deeper sections ofsediment, biotic processes catalyzed by microorganisms dominate.Microbiological tests confirmed the presence of hydrocarbondegraders in the beach sediments. Different species of hydrocarbondegraders appear to be present throughout the area, and this is ex-pected because Gulf islands and beaches are subjected to hydrocar-bon contamination due to small oil spills and natural seeps. Aroundthe monitoring site, in which DH oil was verified to be present,there was less variability in species, with hydrocarbon degradersbeing the dominant ones. Interestingly, when tested in the labora-tory, complete degradation of 17–28 μmol∕bottle of benzene andtoluene occurred within two weeks for samples from the DH-im-pacted location (Figure 9a). Furthermore, subsequent addition ofthe hydrocarbons resulted in increased rates and complete degra-dation occurring in <7 days suggesting an enrichment of the hy-drocarbon-degrading microbial population. On the other hand,negligible amounts of benzene and toluene were degraded in threeweeks in microcosms prepared with samples from the location thatwas not impacted by the DH spill (Figure 9b). This suggested alack of sufficient microbial activity despite the fact that microbialdiversity analysis at this location indicated the presence of organ-isms with hydrocarbon degradation capacity. The exact reason forthe lack of sufficient degradation activity is unknown, but it couldbe due to a low number of hydrocarbon degraders requiring longerincubations. Alternatively, these organisms may not be adaptedfor benzene and/or toluene degradation, but for other fractionsin crude oil. The rapid degradation of benzene and toluene atthe DH-impacted locations suggests that the microorganismshave been recently exposed to hydrocarbons, specifically to theDH spill.
CONCLUSIONS
This experiment demonstrated the viability of long-term ERImonitoring as a technology for noninvasively monitoring the deg-radation of fresh oil spills in remote coastal environments. Theresistivity measurements clearly show a consistent, long-term resis-tivity decrease within the DH-impacted layer, with limited changesoccurring in the surrounding area. Our results suggest that ERI issuitable for deployment in remote areas impacted by hydrocarbonspills. Surface ERI is relatively easy to deploy in comparison withusing drilling equipment in areas such as GT1. Our findings suggestthat the method might be used to image the oil distribution duringearly stages of contamination and then monitor the long-term fate ofthe oil as the degradation progresses.These results, coupled with the proven abundance of hydrocar-
bon degraders, lead to the inference that microbial activity withinthe DH-impacted zone makes a strong contribution to the observeddecrease in resistivity. Although this does not provide a strictlyquantitative relationship between the stages of degradation of theDH oil, it does provide a qualitative analysis of whether or notthe region of DH contamination is undergoing active degradation.The results seen here strongly support the conductive hydrocarbondegradation model because the DH-impacted zone imaged in thesurvey progressively became more conductive with time.
ACKNOWLEDGMENTS
This work was supported by the United States EnvironmentalProtection Agency National Exposure Research Laboratory, Office
of Research and Development Student Services Contract RFQ-RT-11-00103 to J. Heenan, National Science Foundation RAPIDAward, OCE-1049301, American Chemical Society, PetroleumResearch Fund, grant no. 49823-ND8, and the Chevron EnergyCorporation.
APPENDIX A
DETERMINING MICROBIAL DIVERSITYAND BIODEGRADATION POTENTIAL
Sediment samples, representative of DH-impacted and nonim-pacted areas, were collected in sterile plastic containers at variouslocations and at different depths above the water table at the studysite (Figure 2), which, based on physical observation, was collo-cated with the DH-impacted layer (∼60‐cm below the surface).The non-DH-impacted area described here refers to a site onGT1 that was not visibly affected by the DH oil spill but is not ex-pected to be “clean” of hydrocarbon contamination. Due to GT1,along with the other barrier islands of the LA coast, periodicallyreceive hydrocarbon contaminants as a result of smaller scale oilspills and naturally occurring oil seeps, it is more accurate if weassume that the impacted area is impacted by the young DH spills,whereas the nonimpacted areas are likely affected by aged hydro-carbons possibly present.To determine the biodegradation potential of indigenous popula-
tions at the site, microcosms were prepared with 160-ml capacityserum bottles containing 10 g of soil/sediment and 40 ml of mineralsalts medium (Nicholson and Fathepure, 2004).Microbial community composition was determined by isolating
total DNA from soil/sediment samples using the MoBio ultracleansoil DNA extraction kit (MoBio Laboratories, Carlsbad, California)using the manufacturer’s instructions. 16S rRNA genes were am-plified using the universal primer set 515F and 1391R, and PCRmethod described elsewhere (Sei and Fathepure, 2009).To determine in situ biodegradation potential of hydrocarbons,
we screened for the presence of a variety of genes that code formonooxygenase and dioxygenase enzymes in soil/sediment sam-ples collected at the site. These include catechol 1,2-dioxygenase(1,2-CAT), catechol 2,3-dioxygenase (2,3-CAT), protocatechuate3,4-dioxygenase (3,4-PCA), toluene dioxygenase (TOD), phenolmonooxygenase (Phe), biphenyl dioxygenase (Bhp), naphthalenedioxygenase (Nah), and alkane hydroxylase (Alk B). Total DNAfrom samples was extracted using the method described above.Ring-hydroxylating and ring-cleaving genes were PCR amplifiedusing above degenerate primers, and the appropriate ampliconswere cloned and sequenced to confirm the presence of the hydro-carbon-degrading genes in samples taken at all locations on the site(Baldwin et al., 2003; Sei and Fathepure, 2009; Paisse et al., 2011).
RESULTS OF DNA ANALYSIS
Analysis of 16S rRNA genes revealed the presence of diversemicrobial taxa in samples collected from a location on the beachimpacted by the BP oil spill (location 4) and what was inferredto be a nonimpacted location (location 2). Analysis showed thepresence of a diverse microbial community at both locations regard-less of whether hydrocarbons were detected or not in these soilsamples. A total of 21–28 bacterial and archaeal taxa were de-tected. The hydrocarbon-degrading halophilic archaea and bacteria
ERI at oil-impacted sites B9

such as Haloferex sp., Idiomarina sp., Marinobacter sp., andHalomonas sp. were detected at location 2 (non-DH-impactedarea). Similarly, hydrocarbon-degrading halophilic bacteria includ-ing Marinobacter sp. and Halomonas spp. were detected at DH-impacted location 4 (Le Borgne et al., 2008). Our analysis showedthat phyla Proteobacteria, Bacteroidetes, Firmicutes, Actinobacte-ria, and Acidobacteria were found at both locations. Among these,members of Proteobactera and Firmicutes were the dominant or-ganisms comprising 25%–30% and 10%–15% of the total clones,respectively. Halomonas, Marinobacteria, Idiomarina, and Halo-ferex were present at both locations, and members of these generaare known as hydrocarbon-degrading organisms in high-salinityenvironments (Le Borgne et al., 2008) (Figure A-1).
REFERENCES
Atekwana, E. A., and E. A. Atekwana, 2010, Geophysical signatures of mi-crobial activity at hydrocarbon contaminated sites: A review: Surveys inGeophysics, 31, 247–283, doi: 10.1007/s10712-009-9089-8.
Atekwana, E. A., W. A. Sauck, and D. D. Werkema, 2000, Investigations ofgeoelectrical signatures at a hydrocarbon contaminated site: Journalof Applied Geophysics, 44, 167–180, doi: 10.1016/S0926-9851(98)00033-0.
Atekwana, E. A., and L. D. Slater, 2009, Biogeophysics: A new frontier inearth science research: Reviews of Geophysics, 47, doi: 10.1029/2009RG000285.
Atekwana, E. A., D. D. Werkema, and E. A. Atekwana,eds., 2006, Biogeophysics: The effects of microbialprocesses on geophysical properties of the shallowsubsurface, in Applied hydrogeophysics, Springer,161–193.
Baldwin, B. R., C. H. Nakatsu, and L. Nies, 2003, De-tection and enumeration of aromatic oxygenasegenes by multiplex and real-time PCR: Appliedand Environmental Microbiology, 69, 3350–3358,doi: 10.1128/AEM.69.6.3350-3358.2003.
Binley, A., 2007, Freeware— Free resistivity software,http://www.es.lancs.ac.uk/people/amb/Freeware/R2/R2.htm, accessed 25 November 2012.
Binley, A., G. Cassiani, R. Middleton, and P. Winship,2002, Vadose zone flow model parameterisation us-ing cross-borehole radar and resistivity imaging:Journal of Hydrology, 267, 147–159, doi: 10.1016/S0022-1694(02)00146-4.
Binley, A., and A. Kemna, 2005, DC resistivity andinduced polarization methods, in Hydrogeophysics,Y. Rubin, and S. S. Hubbard, eds., Springer,Water Science and Technology Library, vol. 50,129–156.
Bradford, J. H., 2007, Frequency-dependent at-tenuation analysis of ground-penetrating radar data:Geophysics, 72, no. 3, J7–J16, doi: 10.1190/1.2710183.
Cassidy, N. J., 2007, Evaluating LNAPL contaminationusing GPR signal attenuation analysis and dielectricproperty measurements: Practical implications forhydrological studies: Journal of Contaminant Hy-drology, 94, 49–75, doi: 10.1016/j.jconhyd.2007.05.002.
Cassidy, N. J., 2008, GPR attenuation and scattering ina mature hydrocarbon spill: A modeling study: Va-dose Zone Journal, 7, 140–159
Crone, T. J., and M. Tolstoy, 2010, Magnitude of the2010 Gulf of Mexico oil leak: Science, 330, 634,doi: 10.1126/science.1195840.
Daily, W., A. Ramirez, and A. Binley, 2004, Remotemonitoring of leaks in storage tanks using electricalresistance tomography: Application at the Hanfordsite: Journal of Environmental and Engineering Geo-physics, 9, 11–24, doi: 10.4133/JEEG9.1.11.
Daily, W., A. Ramirez, D. Labrecque, and J. Nitao,1992, Electrical-resistivity tomography of vadosewater-movement: Water Resources Research, 28,1429–1442, doi: 10.1029/91WR03087.
deGroot-Hedlin, C., and S. Constable, 1990, Occam’sinversion to generate smooth, two-dimensional mod-
els from magnetotelluric data: Geophysics, 55, 1613–1624, doi: 10.1190/1.1442813.
Ellis, D. E., 2009, Sustainable remediation white paper — Integrating sus-tainable principles, practices, and metrics into remediation projects:Remediation, 19, 5–114, doi: 11410.1002/rem.20210.
Environmental Response Management Application, 2013, ERMA deep-water Gulf response, http://gomex.erma.noaa.gov/erma.html#x=-89.37870&y=29.14486&z=6&layers=17770+5723+22869+22881, ac-cessed 1 April 2013.
Geospatial Platform Resource Center, 2013, Mapping the response to BP oilspill in the Gulf of Mexico, http://resources.geoplatform.gov/news/mapping-response-bp-oil-spill-gulf-mexico, accessed 3 April 2013.
Hanor, J. S., and J. A. Mercer, 2010, Spatial variations in the salinity of porewaters in northern deep water Gulf of Mexico sediments: Implications forpathways and mechanisms of solute transport: Geofluids, 10, 83–93, doi:10.1111/j.1468-8123.2009.00271.x.
Johnson, T. C., L. D. Slater, D. Ntarlagiannis, F. D. Day-Lewis, and M. El-waseif, 2012, Monitoring groundwater-surface water interaction usingtime-series and time-frequency analysis of transient three-dimensionalelectrical resistivity changes: Water Resources Research, 48, W07506,doi: 10.1029/2012WR011893.
Keller, G. V., and F. C. Frischknecht, 1966, Electrical methods in geophysi-cal prospecting: Pergamon
Koestel, J., A. Kemna, M. Javaux, A. Binley, and H. Vereecken, 2008, Quan-titative imaging of solute transport in an unsaturated and undisturbed soilmonolith with 3D ERT and TDR: Water Resources Research, 44,W12411, doi: 10.1029/2007WR006755.
LaBrecque, D., M. Miletto, W. Daily, A. Ramirez, and E. Owen, 1996, Theeffects of noise on Occam’s inversion of resistivity tomography data: Geo-physics, 61, 538–548, doi: 10.1190/1.1443980.
LaBrecque, D. J., G. Heath, R. Sharpe, and R. Versteeg, 2004, Autonomousmonitoring of fluid movement using 3-D electrical resistivity tomography:
Figure A-1. (a) Microbial community composition at site location 4 (DH oil-impactedlocation on the beach). Pseudomonas sp., Marinobacter sp., and Halomonas sp. (openbars), are known hydrocarbon degraders. (b) Microbial community composition at loca-tion 2 (outside zone of DH contamination). As expected, many hydrocarbon-degradinghalophilic organisms are present at this location including Marinobacter sp., Idiomarinasp., Halomonas sp., and an archaeon Haloferax sp. (shown as open bars).
B10 Heenan et al.

Journal of Environmental and Engineering Geophysics, 9, 167–176, doi:10.4133/JEEG9.3.167.
Le Borgne, S., D. Paniagua, and R. Vazquez-Duhalt, 2008, Biodegradationof organic pollutants by halophilic bacteria and archaea: Journal ofMolecular Microbiology and Biotechnology, 15, 74–92, doi: 10.1159/000121323.
Neujahr, H. Y., and A. Gaal, 1973, Phenol hydroxylase from yeast: EuropeanJournal of Biochemistry, 35, 386–400, doi: 10.1111/j.1432-1033.1973.tb02851.x.
Neujahr, H. Y., and K. G. Kjellen, 1978, Phenol hydroxylase from yeast:Reaction with phenol derivatives: Journal of Biological Chemistry,253, 8835–8841
Nicholson, C. A., and B. Z. Fathepure, 2004, Biodegradation of benzene byhalophilic and halotolerant bacteria under aerobic conditions: Applied andEnvironmental Microbiology, 70, 1222–1225, doi: 10.1128/AEM.70.2.1222-1225.2004.
Oldenburg, D. W., and Y. Li, 1999, Estimating depth of investigation in DCresistivity and IP surveys: Geophysics, 64, 403–416, doi: 10.1190/1.1444545.
Operational Science Advisory Team, 2011, Summary report for fate and ef-fects of remnant oil in the beach environment, http://www.restorethegulf.gov/sites/default/files/u316/OSAT2%20report%20no%20-ltr.pdf, ac-cessed August 15, 2012
Paisse, S., R. Duran, F. Coulon, and M. Goni-Urriza, 2011, Are alkane hy-droxylase genes (alkb) relevant to assess petroleum bioremediation proc-esses in chronically polluted coastal sediments?: Applied Microbiologyand Biotechnology, 92, 835–844, doi: 10.1007/s00253-011-3381-5.
Qu, Y. Y., S. N. Shi, H. Zhou, Q. Ma, X. L. Li, X. W. Zhang, and J. T. Zhou,2012, Characterization of a novel phenol hydroxylase in indoles biotrans-formation from a strain Arthrobacter sp. W1: PLoS ONE, 7, doi: 10.1371/journal.pone.0044313.
Robinson, J. L., L. D. Slater, and K. V. Schäfer, 2012, Evidence for spatialvariability in hydraulic redistribution within an oak-pine forest from re-sistivity imaging: Journal of Hydrology, 430, 69–79, doi: 10.1016/j.jhydrol.2012.02.002.
Rucker, D. F., J. B. Fink, and M. H. Loke, 2011, Environmental monitoringof leaks using time-lapsed long electrode electrical resistivity: Journal ofApplied Geophysics, 74, 242–254, doi: 10.1016/j.jappgeo.2011.06.005.
Sandhu, A., L. Halverson, and G. Beattie, 2009, Identification and geneticcharacterization of phenol-degrading bacteria from leaf microbial com-munities: Microbial Ecology, 57, 276–285, doi: 10.1007/s00248-008-9473-9.
Sauck, W. A., 2000, A model for the resistivity structure of LNAPL plumesand their environs in sandy sediments: Journal of Applied Geophysics, 44,151–165, doi: 10.1016/S0926-9851(99)00021-X.
Sauck, W. A., E. A. Atekwana, and M. S. Nash, 1998, High conductivitiesassociated with an LNAPL plume imaged by integrated geophysical tech-niques: Journal of Environmental and Engineering Geophysics, 2, 203–212.
Sei, A., and B. Fathepure, 2009, Biodegradation of BTEX at high salinity byan enrichment culture from hypersaline sediments of Rozel point at GreatSalt Lake: Journal of Applied Microbiology, 107, 2001–2008, doi: 10.1111/j.1365-2672.2009.04385.x.
Sen, P. N., and P. A. Goode, 1992, Influence of temperature on electricalconductivity on shaly sands: Geophysics, 57, 89–96, doi: 10.1190/1.1443191.
Shevnin, V., A. Mousatov, A. Ryjov, and O. Delgado‐Rodriquez, 2007, Es-timation of clay content in soil based on resistivity modelling and labo-ratory measurements: Geophysical Prospecting, 55, 265–275, doi: 10.1111/j.1365-2478.2007.00599.x
Slater, L., A. M. Binley, W. Daily, and R. Johnson, 2000, Cross-hole elec-trical imaging of a controlled saline tracer injection: Journal of AppliedGeophysics, 44, 85–102, doi: 10.1016/S0926-9851(00)00002-1.
Slater, L. D., and S. K. Sandberg, 2000, Resistivity and induced polarizationmonitoring of salt transport under natural hydraulic gradients: Geophys-ics, 65, 408–420, doi: 10.1190/1.1444735.
Versteeg, R., K. Wangerud, A. Richardson, T. Rowe, and G. Heath, 2006,Managing a capped acid rock drainage (ARD) repository using semi-autonomous monitoring and modeling: Presented at 7th InternationalConference on Acid Rock Drainage.
ERI at oil-impacted sites B11