electoral registration statistics and voting patterns
TRANSCRIPT
Providing research and information services to the Northern Ireland Assembly
Research and Information Service Briefing Note
1
Paper 17/14 4 February 2014 NIAR 907-13
Dr Raymond Russell
Electoral Registration statistics and voting patterns
1 Introduction
This Briefing Note reviews voting behaviour in the Northern Ireland Assembly
Elections, held on 5 May 2011. In particular, as requested, the note will consider the
following three questions:
1. The percentage turnout by constituency.
2. The percentage of women who voted and / or registered to vote by
constituency; and
3. The percentage of the population registered as an ethnic minority by
constituency (2013).

NIAR 907-13 Briefing Note
Providing research and information services to the Northern Ireland Assembly
2
2 Turnout by Constituency
Turnout in the last Northern Ireland Assembly election, held on 5 May 2011, was 55.7
per cent. This represented a continued decline from the 70 per cent turnout at the first
Assembly election in 1998, 64 per cent in 2003 and 62.9 per cent in 2007.
Table 2.1 presents the official turnout figures for each of the 18 constituencies, sorted
from high to low.
Table 2.1: Official Turnout in Northern Ireland Assembly Election, 2011
Constituency Eligible
Electorate Votes Polled Turnout
(%)
Fermanagh and South Tyrone 70,985 48,949 69.0
Mid Ulster 66,602 43,522 65.3
West Tyrone 62,970 40,323 64.0
Newry and Armagh 77,544 47,562 61.3
Strangford 62,178 30,186 58.5
South Down 73,240 42,551 58.1
Belfast West 61,520 35,618 57.9
Foyle 68,663 39,686 57.8
Upper Bann 77,905 43,113 55.3
North Antrim 74,760 40,983 54.8
East Londonderry 65,226 35,303 54.1
Belfast East 61,263 32,828 53.6
Lagan Valley 67,532 35,842 53.1
Belfast South 62,484 32,752 52.4
Belfast North 68,119 34,280 50.3
South Antrim 65,231 32,652 50.1
East Antrim 61,617 29,430 47.8
North Down 62,170 28,528 45.9
Total 1,210,009 674,108 55.7
Source: Electoral Office for Northern Ireland (2011)
The table shows that the constituency of Fermanagh and South Tyrone had the highest
turnout in 2011 (69.0 per cent), while North Down (45.9 per cent) had the lowest. In
general, the highest turnout figures were recorded in the west of Northern Ireland, and
the lowest in the east.

NIAR 907-13 Briefing Note
Providing research and information services to the Northern Ireland Assembly
3
3 Voting Patterns and Gender
There are no official figures relating to either voting behaviour or electoral registration
by gender. In the case of voting behaviour, the ballot is held in secret and there are no
gender identifiers on the ballot paper. Similarly, the electoral registration form issued
by the Electoral Office for Northern Ireland contains only personal identifiers (i.e. name,
address, National Insurance No. and nationality).
However, Dr John Garry, QUB, conducted a survey of voting behaviour in the 2011
Assembly election, using a representative sample of 1,200 households across all 18
Assembly Areas. Fieldwork was carried out between 18 May and 17 June 2011 1.
Respondents were asked if they voted in the Assembly election, and Table 3.1
(overleaf) provides an analysis of turnout (the ‘yes’ responses) by gender and
constituency. Overall, it was found that men and women were equally likely to vote (57
per cent), although there is some variation across the constituencies 2.
The study also found a relationship between participation and age: the older you were
the more likely you were to vote. Just over half (51 per cent) of 18 – 22 year olds
voted, compared with 66 per cent of those aged 65 or over (Fig 3.1).
Similarly, Catholics (65 per cent) were more likely to vote than their Protestant
counterparts (55 per cent). Somewhat surprisingly, a relationship was also found
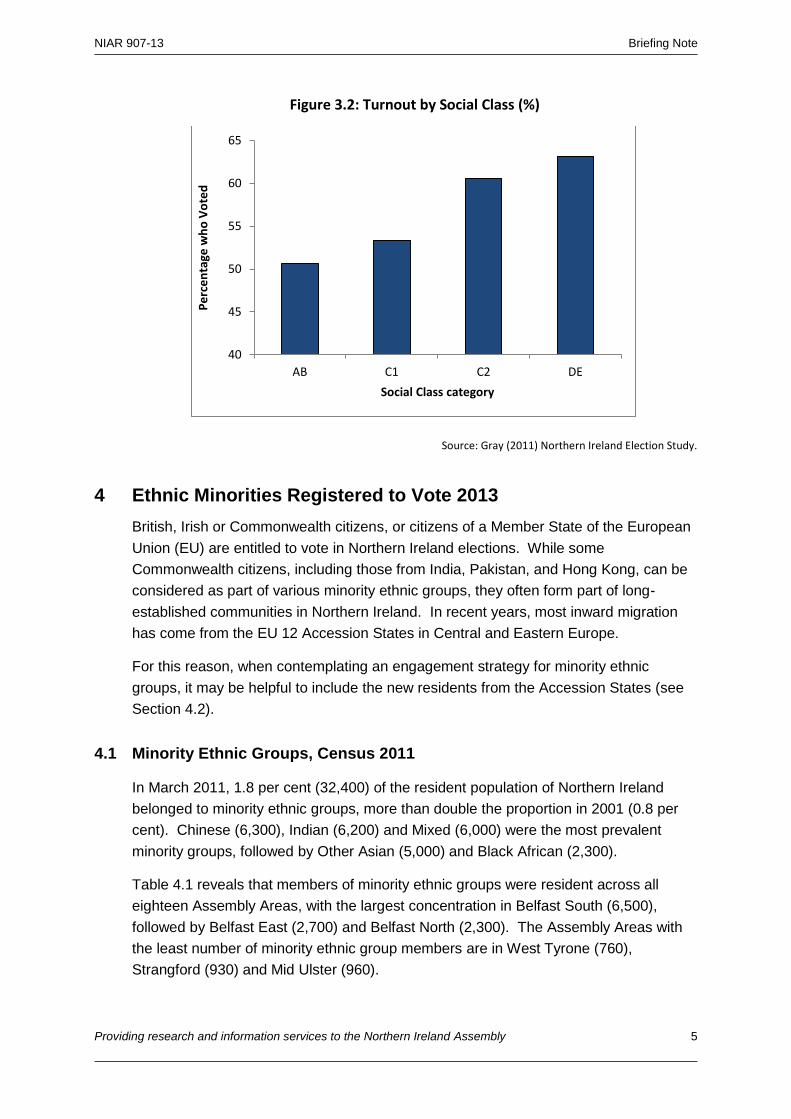
between participation and social class (Fig 3.2): the C2 and DE categories (‘working
class’) were more likely to vote than the AB and C1 groups (‘middle class’). This
finding is at variance with many international studies, which show that it is the affluent
who are more likely to become involved in the democratic process.
Gary (2011) suggests that this finding “ … may be explained by the relationship
between religion and voting. Catholics are considerably more likely to vote than
Protestants. Catholics are also more likely to be working class than Protestants, hence
driving up the working class participation rate.” (p.9)
1 Garry, J. (2011). Report prepared for the Electoral Reform Society on the 2011 Northern Ireland Assembly Election and
AV Referendum. School of Politics, International Studies and Philosophy, The Queens University Belfast. Available at: http://www.qub.ac.uk/schools/SchoolofPoliticsInternationalStudiesandPhilosophy/FileStore/Stafffiles/JGarry/Filetoupload,281998,en.pdf
2 While the overall finding of 57 per cent is robust, as it is based upon the entire sample of 1,200 respondents, and accords with
official turnout figures, caution should be exercised when drawing inferences about individual constituencies. This is
because the N (number of respondents) for those who answered ‘yes’ is relatively small, ranging from 58 in Foyle to only
16 in North Down. In this situation, even a small change of one or two in the count can dramatically change the
percentage figure.

NIAR 907-13 Briefing Note
Providing research and information services to the Northern Ireland Assembly
4
Table 3.1: Did you vote in the Assembly elections on 5 May 2011? Analysis of ‘Yes’ responses by Gender
Male (%)
Female (%)
N of ‘yes’ count
Northern Ireland 57.3 57.2 687
Foyle 75.7 81.1 58
West Tyrone 80.8 77.1 48
East Londonderry 50.0 69.2 37
North Antrim 47.1 68.4 42
Belfast West 82.1 67.6 46
Mid Ulster 65.4 65.7 40
South Down 57.6 63.4 45
Newry and Armagh 54.5 62.1 42
East Antrim 48.3 59.4 33
Belfast East 50.0 57.7 29
Lagan Valley 58.8 56.8 41
Upper Bann 69.7 53.7 45
Fermanagh and S. Tyrone 50.0 48.7 33
Belfast South 54.3 48.5 35
Belfast North 61.5 45.7 32
Strangford 66.7 42.5 37
South Antrim 41.2 36.8 28
North Down 27.3 25.0 16
Source: Garry, J. (2013) NI Assembly Election Survey Data (SPSS)
Figure 3.1: Turnout by Age Group (%)
40
50
60
70
18-22 23-24 25-44 45-64 65 +
Pe
rce
nta
ge w
ho
Vo
ted
Age Group
NIAR 907-13 Briefing Note
Providing research and information services to the Northern Ireland Assembly
5
Figure 3.2: Turnout by Social Class (%)
Source: Gray (2011) Northern Ireland Election Study.
4 Ethnic Minorities Registered to Vote 2013
British, Irish or Commonwealth citizens, or citizens of a Member State of the European
Union (EU) are entitled to vote in Northern Ireland elections. While some
Commonwealth citizens, including those from India, Pakistan, and Hong Kong, can be
considered as part of various minority ethnic groups, they often form part of long-
established communities in Northern Ireland. In recent years, most inward migration
has come from the EU 12 Accession States in Central and Eastern Europe.
For this reason, when contemplating an engagement strategy for minority ethnic
groups, it may be helpful to include the new residents from the Accession States (see
Section 4.2).
4.1 Minority Ethnic Groups, Census 2011
In March 2011, 1.8 per cent (32,400) of the resident population of Northern Ireland
belonged to minority ethnic groups, more than double the proportion in 2001 (0.8 per
cent). Chinese (6,300), Indian (6,200) and Mixed (6,000) were the most prevalent
minority groups, followed by Other Asian (5,000) and Black African (2,300).
Table 4.1 reveals that members of minority ethnic groups were resident across all
eighteen Assembly Areas, with the largest concentration in Belfast South (6,500),
followed by Belfast East (2,700) and Belfast North (2,300). The Assembly Areas with
the least number of minority ethnic group members are in West Tyrone (760),
Strangford (930) and Mid Ulster (960).
40
45
50
55
60
65
AB C1 C2 DE
Pe
rce
nta
ge w
ho
Vo
ted
Social Class category

NIAR 907-13 Briefing Note
Providing research and information services to the Northern Ireland Assembly
6
Table 4.1: Minority Ethnic Groups by Assembly Area (Count), Census 2011
Geography Chinese Indian Mixed Other Asian
Black African
Irish Traveller
Paki-stani Other
1 Total
N. Ireland 6,303 6,198 6,014 4,998 2,345 1,301 1,091 4,164 32,414
Belfast South 1,852 1,403 771 1,008 602 68 186 610 6,500
Belfast East 540 513 427 579 228 25 71 284 2,667
Belfast North 294 568 380 479 225 43 69 211 2,269
Upper Bann 385 253 464 380 186 54 179 305 2,206
Lagan Valley 333 434 368 272 131 26 46 221 1,831
Foyle 251 603 374 180 80 71 46 220 1,825
Fermanagh & ST 164 233 322 227 121 112 42 551 1,772
Belfast West 171 311 290 449 124 158 24 140 1,667
South Antrim 300 449 361 188 109 20 99 136 1,662
North Down 252 247 381 250 122 14 84 289 1,639
East Antrim 419 230 345 157 74 11 52 101 1,389
East Londonderry 272 157 279 201 69 34 40 145 1,197
Newry & Armagh 197 219 221 104 37 211 45 136 1,170
South Down 182 102 254 97 60 47 15 232 989
North Antrim 184 158 185 141 38 90 52 125 973
Mid Ulster 181 90 202 65 92 183 18 133 964
Strangford 216 100 229 91 33 14 11 239 933
West Tyrone 110 128 161 130 14 120 12 86 761 Source: NINIS, NISRA (2013) Table KS201
Note: 1 ‘Other’ includes Black Caribbean, Black Other, Bangladeshi, and Other.
Chinese residents, the largest ethnic minority, were most numerous in Belfast South
(1,800) and Belfast East (540), while the lowest numbers were recorded in West
Tyrone (110) and Fermanagh and South Tyrone (160). Similarly, the largest number
of Indian residents were living in Belfast South (1,400) and Foyle (600), while the
smallest number were in Mid Ulster (90) and Strangford (100).
4.2 EU 12 Migrants, Census 2011
The proportion of the population born outside Northern Ireland rose from 9 per cent
(151,000) in April 2001 to 11 per cent (202,000) in March 2011. This change was
largely as a result of inward migration by people born in the 12 countries which have
joined the European Union (EU 12) since 2004. These EU accession countries
accounted for 2 per cent (35,700) of usual residents in Northern Ireland on Census Day
2011, while their share of the 2001 Census population was 0.1 per cent.

NIAR 907-13 Briefing Note
Providing research and information services to the Northern Ireland Assembly
7
The top three Accession states are Poland (19,700 residents), Lithuania (7,300) and
Slovakia (2,700). Together, they accounted for 83 per cent of all EU 12 residents living
in Northern Ireland on Census Day 2011.
Table 4.2 shows that the largest proportion of Polish nationals live in Upper Bann (2
per cent of resident population), followed by Fermanagh and South Tyrone (1.9 per
cent), Newry and Armagh, and Belfast South (1.7 per cent). Similarly, Lithuanian
migrants are more likely to live in Fermanagh and South Tyrone (1.9 per cent), Newry
and Armagh (1.3 per cent), and Upper Bann (1.0 per cent). The highest concentration
of Slovakian residents live in Mid Ulster (0.5 per cent), North Antrim (0.4 per cent) and
Belfast South (0.3 per cent).
Bringing all four Belfast constituencies together yields a combined total of 6,000 Polish,
Lithuanian and Slovakian nationals living in the Belfast Assembly areas in March 2011.
Table 4.2: Country of Birth, Top 3 EU Accession Countries by Assembly Area, Census 2011
All usual residents COUNT
Poland COUNT
Lithuania COUNT
Slovakia COUNT
Poland PER
CENT Lithuania PER CENT
Slovakia PER CENT
Northern Ireland 1,810,863 19,658 7,341 2,681 1.1 0.4 0.1
Belfast East 92,221 1,424 91 222 1.5 0.1 0.2
Belfast North 102,531 1,224 88 184 1.2 0.1 0.2
Belfast South 111,402 1,942 132 279 1.7 0.1 0.3
Belfast West 93,986 344 68 42 0.4 0.1 0.0
East Antrim 90,067 296 48 45 0.3 0.1 0.0
East Londonderry 99,673 1,060 46 30 1.1 0.0 0.0
Fermanagh and Sth Tyrone 102,553 1,960 1,943 143 1.9 1.9 0.1
Foyle 100,807 599 72 19 0.6 0.1 0.0
Lagan Valley 101,710 777 331 43 0.8 0.3 0.0
Mid Ulster 99,155 922 754 462 0.9 0.8 0.5
Newry and Armagh 112,401 1,967 1,419 126 1.7 1.3 0.1
North Antrim 108,207 1,413 48 400 1.3 0.0 0.4
North Down 89,498 357 56 49 0.4 0.1 0.1
South Antrim 99,238 872 336 239 0.9 0.3 0.2
South Down 108,835 966 427 52 0.9 0.4 0.0
Strangford 89,370 323 206 47 0.4 0.2 0.1
Upper Bann 118,010 2,309 1,123 174 2.0 1.0 0.1
West Tyrone 91,199 903 153 125 1.0 0.2 0.1
Source: NINIS, NISRA (2013) Table QS208

NIAR 907-13 Briefing Note
Providing research and information services to the Northern Ireland Assembly
8
Map 4.1 combines the figures for EU 12 residents with those born outside the EU to
illustrate the dispersal and concentration of migrants across the Assembly Areas. The
map reveals that EU 12 and non-EU residents are concentrated in the south and west
(Fermanagh and South Tyrone, Newry and Armagh, Upper Bann) and Belfast (Belfast
South and Belfast East).
Map 4.1 Proportion of residents born in either EU 12 or outside EU by Assembly Area
The scale of recent inward migration to particular Assembly Areas becomes even
clearer when viewed at ward level. Table 4.3 (overleaf ) shows those wards (35) where
ten per cent or more of the usually resident population were born either in the EU
Accession states or outside the EU.
Top of the list are five wards, four of which are in the Dungannon area, where more
than 20 per cent of the resident population were born either in the EU Accession states
or outside the EU.

NIAR 907-13 Briefing Note
Providing research and information services to the Northern Ireland Assembly
9
Table 4.3: Wards where 10 per cent or more of usual residents were born either in EU 12 or outside EU, Census 2011
Ward Name Assembly Area Resident Pop Total EU12 and Outside EU Per cent
Coolhill Fermanagh and South Tyrone 2,716 749 27.6
Ballysaggart Fermanagh and South Tyrone 2,730 739 27.1
Killymeal Fermanagh and South Tyrone 2,891 637 22.0
Drumglass Fermanagh and South Tyrone 2,357 492 20.9
Castle Demesne North Antrim 2,126 438 20.6
Mullaghmore Fermanagh and South Tyrone 2,351 433 18.4
Annagh Upper Bann 3,042 524 17.2
Windsor Belfast South 8,141 1,280 15.7
Shaftesbury Belfast South 7,214 1,054 14.6
Ballynafeigh Belfast South 5,928 849 14.3
Callan Bridge Newry and Armagh 2,817 402 14.3
Woodstock Belfast South 5,445 739 13.6
Park North Antrim 2,139 283 13.2
Dunclug North Antrim 2,363 306 12.9
Corcrain Upper Bann 3,320 414 12.5
Fair Green North Antrim 1,784 222 12.4
Springfarm South Antrim 4,186 518 12.4
Botanic Belfast South 8,945 1,099 12.3
Newbuildings Mid Ulster 2,187 266 12.2
St Mary’s Newry and Armagh 2,284 275 12.0
Strule West Tyrone 1,496 179 12.0
Island Belfast East 5,014 594 11.8
Drumgor Upper Bann 2,745 323 11.8
Blackstaff Belfast South 3,998 465 11.6
The Mount Belfast East 5,591 650 11.6
Drumalane Newry and Armagh 3,352 389 11.6
Harbour (North Down) North Down 3,022 343 11.4
Church Upper Bann 2,131 235 11.0
St Patrick’s Newry and Armagh 3,530 389 11.0
Central (Coleraine) East Londonderry 1,835 202 11.0
Moy Fermanagh and South Tyrone 3,009 331 11.0
Kernan Upper Bann 6,107 667 10.9
The Mall Newry and Armagh 1,740 186 10.7
Moygashel Fermanagh and South Tyrone 2,189 223 10.2
Daisy Hill Newry and Armagh 3,155 321 10.2 Source: NINIS, NISRA (2013) Table KS204

NIAR 907-13 Briefing Note
Providing research and information services to the Northern Ireland Assembly
10
4.3 Electoral Registration by Nationality
As noted above, apart from UK and Ireland nationals, the only other citizens eligible to
vote in Northern Ireland are citizens from the Commonwealth, British Overseas
Territories, and EU Member States.
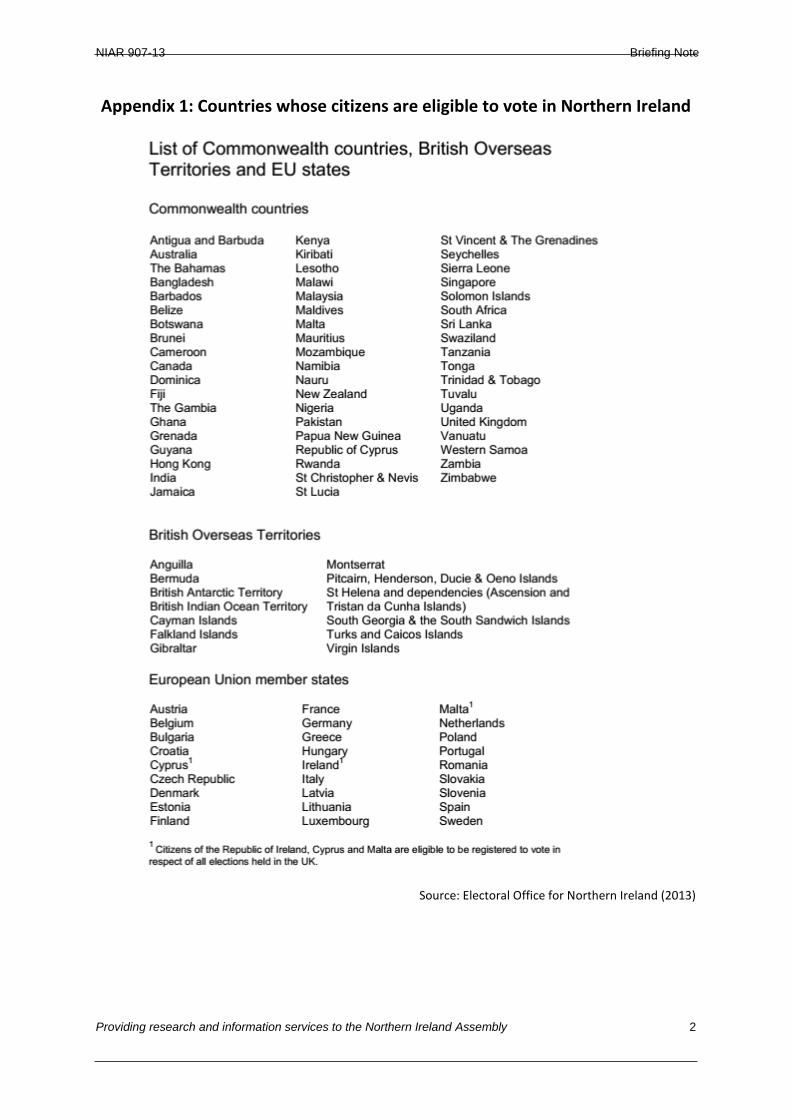
On 2 December 2013, the Electoral Office published the final statistics from the 2013
electoral registration canvass. Sixty eight countries are represented in the electoral
registration database (Appendix 1). Table 4.4 lists the top 10 countries of origin by
Assembly Area, which together account for 83 per cent of all Commonwealth and EU
citizens on the Register.
The register largely reflects Census 2011, with most new registrants coming from the
EU 12 Accession states. Polish citizens form the largest group (9,660, 37 per cent),
followed by Lithuania (3,903, 15 per cent) and Portugal (1,849, 7.1 per cent). Indian
and Slovakian nationals are also well-represented, accounting for over five per cent of
the total.
In terms of Assembly Areas, Upper Bann (3,132), Fermanagh and South Tyrone
(2,692) and Newry and Armagh (2,326) have the largest concentration of EU and
Commonwealth registrants. Belfast West (364), East Antrim (416) and Strangford
(428) have the least.

NIAR 907-13 Briefing Note
Providing research and information services to the Northern Ireland Assembly
1
Table 4.4: Electoral Registrants by Top 10 Countries of Origin (British Commonwealth and EU only, excludes UK and Ireland)
Country Poland Lithuania Portugal India Slovakia Latvia Hungary Germany Romania France Top 10 Total
Upper Bann 1,335 700 608 53 123 158 56 35 27 37 3,132
Fermanagh and South Tyrone 756 919 609 35 62 190 62 34 10 15 2,692
Newry and Armagh 982 826 26 59 59 238 64 28 25 19 2,326
Belfast South 912 78 79 433 97 61 58 78 81 94 1,971
Mid Ulster 406 388 197 18 207 165 34 7 17 9 1,448
Belfast East 793 75 23 150 153 27 24 49 26 48 1,368
North Antrim 699 13 19 26 213 37 4 27 169 15 1,222
Belfast North 653 44 54 119 83 23 50 26 11 36 1,099
South Antrim 453 147 37 83 133 6 27 19 22 17 944
Lagan Valley 429 181 32 69 29 50 23 37 31 22 903
West Tyrone 415 79 7 5 56 45 197 12 12 12 840
South Down 334 196 9 26 24 79 29 27 18 34 776
East Londonderry 583 17 19 5 14 35 14 39 5 22 753
North Down 194 34 24 61 25 29 20 62 19 23 491
Foyle 235 29 14 100 5 11 8 36 7 21 466
Strangford 145 119 18 15 11 66 13 17 9 15 428
East Antrim 182 30 60 45 17 6 9 25 20 22 416
Belfast West 154 28 14 87 10 7 21 14 10 19 364
Total (Count) 9,660 3,903 1,849 1,389 1,321 1,233 713 572 519 480 21,639
Per cent (of total) 37.1 15.0 7.1 5.3 5.1 4.7 2.7 2.2 2.0 1.8 83.1
Source: Electoral Office for Northern Ireland (2013). Elector Summary by Country / Constituency, Personal Communication, 6 December 2013
NIAR 907-13 Briefing Note
Providing research and information services to the Northern Ireland Assembly
2
Appendix 1: Countries whose citizens are eligible to vote in Northern Ireland
Source: Electoral Office for Northern Ireland (2013)