eg 201 472 - v01.01.01 - human factors (hf); usability - etsi
TRANSCRIPT

Draft ETSI EG 201 472 V1.1.1 (1999-12)ETSI Guide
Human Factors (HF);Usability evaluation for the design of telecommunication
systems, services and terminals

ETSI
Draft ETSI EG 201 472 V1.1.1 (1999-12)2
ReferenceDEG/HF-00006
Keywordsservice, system, terminal
ETSI
Postal addressF-06921 Sophia Antipolis Cedex - FRANCE
Office address650 Route des Lucioles - Sophia Antipolis
Valbonne - FRANCETel.: +33 4 92 94 42 00 Fax: +33 4 93 65 47 16
Siret N° 348 623 562 00017 - NAF 742 CAssociation à but non lucratif enregistrée à laSous-Préfecture de Grasse (06) N° 7803/88
Individual copies of this ETSI deliverablecan be downloaded from
http://www.etsi.orgIf you find errors in the present document, send your
comment to: [email protected]
Important notice
This ETSI deliverable may be made available in more than one electronic version or in print. In any case of existing orperceived difference in contents between such versions, the reference version is the Portable Document Format (PDF).In case of dispute, the reference should be the printing on ETSI printers of the PDF version kept on a specific network
drive within ETSI Secretariat.
Copyright Notification
No part may be reproduced except as authorized by written permission.The copyright and the foregoing restriction extend to reproduction in all media.
© European Telecommunications Standards Institute 1999.All rights reserved.
ETSI
Draft ETSI EG 201 472 V1.1.1 (1999-12)3
Contents
Intellectual Property Rights................................................................................................................................5
Foreword ............................................................................................................................................................5
Introduction ........................................................................................................................................................5
1 Scope ........................................................................................................................................................7
2 References................................................................................................................................................7
3 Abbreviations .........................................................................................................................................103.1 Abbreviations................................................................................................................................................... 10
4 What is usability?...................................................................................................................................104.1 The ISO definition of usability ........................................................................................................................ 104.2 Social and economic impact of considering usability in the design process .................................................... 12
5 Usability evaluation and the Human-Centred Design Process ..............................................................135.1 The Human-Centred Design Process ............................................................................................................... 135.2 Usability evaluation within the Human-Centred Design Process..................................................................... 15
6 Choosing the evaluation method............................................................................................................16
7 Usability evaluation techniques in detail ...............................................................................................187.1 Reliability and validity of usability evaluation................................................................................................. 187.2 Experiments ..................................................................................................................................................... 207.2.1 When should experiments be used in usability evaluation?........................................................................ 207.2.2 Requirements of experiments ..................................................................................................................... 207.2.3 Usual experimental designs ........................................................................................................................ 217.3 Field observation.............................................................................................................................................. 237.4 Heuristic evaluation ......................................................................................................................................... 247.4.1 What is heuristic evaluation and when can it be used?............................................................................... 247.4.2 Recommendations for using heuristic evaluation ....................................................................................... 247.4.3 A list of heuristics....................................................................................................................................... 257.5 Focus groups .................................................................................................................................................... 257.5.1 Advantages and disadvantages of focus groups, and applications.............................................................. 267.5.2 How to conduct focus groups ..................................................................................................................... 267.6 Input logging.................................................................................................................................................... 277.7 Surveys............................................................................................................................................................. 297.8 Questionnaires ................................................................................................................................................. 297.8.1 What are questionnaires and when can they be used? ................................................................................ 297.8.2 Deciding the question format ..................................................................................................................... 307.8.2.1 Open ended questions ........................................................................................................................... 307.8.2.2 Multiple choice items ........................................................................................................................... 307.8.2.3 Rating scales ......................................................................................................................................... 317.8.2.4 Nominal or grade scales........................................................................................................................ 317.8.2.5 Rankings ............................................................................................................................................... 327.8.2.6 Discrete numerical rating scales ........................................................................................................... 327.8.2.7 Comparison scales ................................................................................................................................ 327.8.2.8 Graphical scales (Continuous rating scales) ......................................................................................... 327.8.3 Practical issues in questionnaire design...................................................................................................... 337.9 Interviews......................................................................................................................................................... 347.9.1 When should interviews be used in usability evaluation? .......................................................................... 347.9.2 Guidelines for carrying out interviews ....................................................................................................... 357.10 Performance measures ..................................................................................................................................... 377.10.1 Reaction time.............................................................................................................................................. 387.10.2 Duration ..................................................................................................................................................... 387.10.3 Accuracy .................................................................................................................................................... 387.10.4 Frequency................................................................................................................................................... 387.11 Thinking aloud................................................................................................................................................. 38

ETSI
Draft ETSI EG 201 472 V1.1.1 (1999-12)4
7.12 Audio and video records .................................................................................................................................. 39
8 Data Analysis .........................................................................................................................................408.1 Measurement Theory and its implications for data analysis............................................................................. 408.2 Descriptive or exploratory data analysis .......................................................................................................... 428.3 Reporting trial results and statistical data ........................................................................................................ 438.3.1 Plots............................................................................................................................................................ 448.4 Experimental data analysis: testing comparative hypotheses ........................................................................... 468.4.1 Comparing two means: Student's t-tests ..................................................................................................... 468.4.2 Comparing more than two means: ANOVA models .................................................................................. 478.4.3 Repeated measures ANOVA...................................................................................................................... 488.5 An introduction to multivariate analysis models .............................................................................................. 488.5.1 A table to choose among alternative multivariate analysis models............................................................. 49
9 Ethical issues in usability testing ...........................................................................................................529.1 Respect for people's rights and dignity ............................................................................................................ 529.2 Privacy and confidentiality .............................................................................................................................. 529.3 Informed Consent to Research ......................................................................................................................... 53
History ..............................................................................................................................................................55
ETSI
Draft ETSI EG 201 472 V1.1.1 (1999-12)5
Intellectual Property RightsIPRs essential or potentially essential to the present document may have been declared to ETSI. The informationpertaining to these essential IPRs, if any, is publicly available for ETSI members and non-members, and can be foundin SR 000 314: "Intellectual Property Rights (IPRs); Essential, or potentially Essential, IPRs notified to ETSI in respectof ETSI standards", which is available from the ETSI Secretariat. Latest updates are available on the ETSI Web server(http://www.etsi.org/ipr).
Pursuant to the ETSI IPR Policy, no investigation, including IPR searches, has been carried out by ETSI. No guaranteecan be given as to the existence of other IPRs not referenced in SR 000 314 (or the updates on the ETSI Web server)which are, or may be, or may become, essential to the present document.
ForewordThis ETSI Guide (EG) has been produced by ETSI Technical Committee Human Factors (HF), and is now submitted forthe Membership Approval Procedure.
Intended users of the present document are:
- usability experts who have to conduct usability evaluations and want to consult about methods to carry them out;
- designers who want to know basic principles of usability evaluation, and perhaps want to choose between themost commonly used methods;
- any person interested in usability, and more particularly in usability testing methods.
IntroductionSince the publication of ETSI ETR 095 [1] in 1993, usability evaluation methods have evolved greatly. TC HF, as theTechnical Body in charge of usability issues within ETSI, has considered important to review the evaluation methodsand procedures currently used in either the telecommunications or in the software design areas, so that usability experts,service and terminal designers, and people interested in these issues have the best information and can make the bestchoice amongst the range of available techniques.
It is also important to note the appearance of important standards or draft standards regarding usability since thepublication of ETR 095 [1] : ISO 9241 [2], which specifies usability requirements for office work with computers, andthe recently approved standard ISO 13407 [3], on the Human-Centred Design Process.
Research in any area, either scientific or in applied settings, requires the use of a commonly accepted and provenmethodology. Furthermore, it comprises both a "philosophy", or a standard process, and the use of common methodsand procedures. Using a standard research methodology across different projects allows for comparisons and thepossibility of obtaining conclusions which would be impossible if different methods are used.
Different techniques and procedures are more appropriate depending which purpose and which moment in thedevelopment process. The aim of the present document is to provide guidance to make the best choice of the method,and to provide the necessary information to carry it out in the practice.
The purpose of the present document is to provide the basis for the use of a common methodology when performingusability evaluations. Another important objective of the present document is providing guidance on the Human-CentredDesign (HCD) Process, and particularly, fighting against the idea of usability evaluation as a “final test". In the HCDapproach, usability evaluation, in a form or other, is a step in several stages of the proposed iterative process. Thepresent document presents criteria for choosing the applicable method taking into account the design phase in theHuman-Centred Design Approach.

ETSI
Draft ETSI EG 201 472 V1.1.1 (1999-12)6
On the other hand, within the 4th Research Framework supported by European Commission, and more especificallywithin the ACTS program (Advanced Communication Technologies and Services), numerous advanced technologytrials with real users have been carried out. One of these projects, USINACTS (Usability Support in ACTS) hasreviewed the different approaches and procedures used in these trials, and one of the first conclusions obtained is thatinformation about usability evaluation methods is not so easy to find, even for usability experts. Another importantoutput of this project is a study of the application of the HCD in real projects. USINACTS [4] has made an extensivereview of these procedures, and prepared a tutorial on usability assessment methodology, which is the basis for thepresent document.
Previous EU-funded Research Programs results, as those in RACE-ISSUE [5] or TELEMATICS-INUSE [6] have alsobeen reviewed for the purposes of the present document.

ETSI
Draft ETSI EG 201 472 V1.1.1 (1999-12)7
1 ScopeThe present document gives guidance on usability evaluation methods and procedures, with special emphasis on itsapplication within the framework of the Human-Centred Design Process.
The present document is applicable to the usability evaluation of telecommunication systems, services and terminals,taking into account their intended users from the initial phases of the design process. A closer definition of systems,services and terminals is required here: with systems, services and terminals we mean complete products for its use,either finished or in a prototype state, but not particular components. For these, there may exist particular testingmethods, which are not covered in the present document. For instance, refer to current ETSI and ITU standards for icontesting, video or audio quality, etc.
The approach of the present document is applied instead of theoretical: the choice criteria for a person in charge of theevaluation process to choose which method in which design phase are exposed first, and then the different methods andprocedures are reviewed, and examples are provided whenever considered appropriate. Directly applicable material, as,e.g., response format for questionnaires, will be provided wherever appropriate.
Particular issues presented in the present document are:
- A review of the current standards on Human-Centred Design Process (ISO 13407 [3] ) and their application fortelecommunications systems, terminals and services design.
- The state of the art in usability assessment techniques, including new methods appeared since the publication ofETR 095 [1] either in telecommunications or in software design areas.
2 ReferencesThe following documents contain provisions which, through reference in this text, constitute provisions of the presentdocument.
x References are either specific (identified by date of publication, edition number, version number, etc.) ornon-specific.
x For a specific reference, subsequent revisions do not apply.
x For a non-specific reference, the latest version applies.
x A non-specific reference to an ETS shall also be taken to refer to later versions published as an EN with the samenumber.
[1] ETR 095: "Human Factors; Guide for Usability Evaluations of Telecommunications Systems andServices".
[2] ISO 9241 (1988): "Ergonomic requirements for office work with visual display terminals (VDT’s).Geneva: International Standards Organization".
[3] ISO 13407 (1999): "Human-centred design processes for interactive systems".
[4] Concejero, P., Clarke, A. M., Kaasinen, A. (1999): "The USINACTS Usability AssessmentTutorial. Proceedings of 17th International Symposium on Human Factors in Telecommunications".Copenhagen, May 4-7. 1999. USINACTS Usability Assessment Tutorial is available in Internet:http://atwww.hhi.de/usinacts.html
[5] RACE 1065-ISSUE (1992): "ISSUE Usability Evaluation Guidelines. Brussels: Commission of theEuropean Communities".
[6] INUSE project document (1996): "User Centred Design. TELEMATICS APPLICATIONPROGRAMME, Brussels Commission of the European Communities".
[7] EEC Directive 90/270/EEC: "Council Directive of 29 may (1990): On minimum safety and healthrequirements for work with display screen equipment. Brussels: European Union".

ETSI
Draft ETSI EG 201 472 V1.1.1 (1999-12)8
[8] Nielsen, J. (1993): "Usability Engineering. New York: Academic Press".
[9] Nielsen, J. and Landauer, T. K. (1993): "A mathematical model of the finding of usabilityproblems". Proc. ACM INTERCHI '93 Conf (Amsterdam, The Netherlands, 24-29 April) 206-213
[10] Adam, N., Y. Yesha et al. (1996): "Strategic Directions in Electronic Commerce and DigitalLibraries". ACM Computing Surveys, vol. 28, no. 4, Dec. 1996.
[11] Kaasinen, E., Clarke, A., Concejero, P. (1999): "Usability Training for Project Managers andDesigners". Human-Computer Interaction HCI '99. Munich, August 1999.
[12] USINACTS Deliverable 7: "ACTS Usability Evaluation Guideline". Brussels: EuropeanCommission.
[13] USINACTS Deliverable 14: "Matrix of usability issues in USINACTS User Group". Brussels:European Commission.
[14] Campbell, D. T., and Stanley, J. C. (1966): "Experimental and Quasi-Experimental Designs forResearch". Chicago: Rand Mc. Nally.
[15] Cook, T.D., and Campbell, D. T. (1979): "Quasi-experimentation: Design and Analysis Issues forField Settings". Chicago: Rand Mc. Nally.
[16] ACTS SII Guideline G4 (1996): "Organization of advanced communication services trials withresidential users". Brussels: European Commission. ACTS Research Program.
[17] Miller, S. (1975): "Experiment Design and Statistics". Essential Psychology Series A8, Methuen.
[18] Wilkinson, J. (1995): "Direct Observation". In Breakwell, G. M., Hammond, S. and Fife-Schaw, C.(eds) Research Methods in Psychology. London, Sage.
[19] Cronbach L J, Gleser G C, Nanda H and Rajaratnam N, (1972): "The dependability of behaviouralmeasurements". New York, Wiley
[20] Mack, R. L. and Nielsen, J. (1993): "Usability inspection methods". ACM SIGCHI Bulletin 25, 1(January), 28-33.
[21] Molich, R. and Nielsen, J. (1990): "Improving a human-computer dialogue". Communications ofthe ACM 33, 3 (March), 338-348
[22] Millward, F. (1995): Focus Groups. In Breakwell, G. M., Hammond, S. and Fife-Schaw, C. (eds)Research Methods in Psychology. London, Sage.
[23] Tryfos, P. (1996): "Sampling methods for Applied Research". New York. Wiley
[24] Fife-Schaw, C. (1995): "Surveys and Sampling Issues". In Breakwell, G. M., Hammond S. andFife-Schaw C. (eds): Research Methods in Psychology. London. Sage
[25] ITU-R BT.500-7 (1995): "Methodology for the subjective assessment of the quality of televisionpictures". International Telecommunications Union, Geneva.
[26] Rubin, T. (1988): "User Interface design for computer systems". Ellis Horwood, Chichester.
[27] Lewis, C. (1982): "Using the "thinking-aloud" method in cognitive interface design". ResearchReport RC 9265. IBM T. J. Watson Research Center, Yorktown Heights, New York.
[28] Ericsson, K. A. and Simon, H. A. (1984): "Protocol Analysis": Verbal Reports as Data. The MITPress, Cambridge, MA, USA.
[29] O'Malley, C. E. et al. (1984): "Constructive interaction: A method for studying human-computer-human interaction". PROC IFIP INTERACT '84 First Intl Conf Human-computer Interaction(London UK, 4-7 September) 269-274.

ETSI
Draft ETSI EG 201 472 V1.1.1 (1999-12)9
[30] Hewett, T. T. and Scott, S. (1987): "The use of thinking-out-loud and protocol analysis indevelopment of a process model of interactive database searching". Proc IFIP INTERACT '87second Intl Conf Human-Computer Interaction (Stuuttgart, Germany 1-4 September) 51-56.
[31] Mack, R. L., and Burdett, J. M. (1992): "When novices elicit knowledge: Question-asking indesigning, evaluating and learning to use software". In Hoffman, R. (ed.): The Psychology ofExpertise: Cognitive Research and Empirical AI. Springer-Verlag, New York, pp. 245-268.
[32] Tukey, J. W. (1977): "Exploratory Data Analysis". Cambridge: Addison Wesley.
[33] American Psychological Association (1994): Publication Manual, 4th ed. Washington: APA.
[34] Hays, W. L. (1988): Statistics. 4th. edition. Chicago: Holt, Rinehart and Winston.
[35] Kirk, R. B. (1982): "Experimental Design Procedures for the Behavioral Sciences". Monterey,California: Brooks Cole.
[36] Maxwell, S. E. and H. D. Delaney (1990): "Designing Experiments and Analyzing Data: A ModelComparison Perspective". Belmont, California: Wadsworth.
[37] Montgomery, D. C. (1991): "Design and Analysis of Experiments". 3rd. edition. New York: Wiley.
[38] Hoaglin, D. C., F. Mosteller and J. W. Tukey, eds. (1991): "Fundamentals of Exploratory Analysisof Variance". New York: Wiley.
[39] Gorsuch, R. L. (1983): "Factor analysis". Hillsdale, NJ: Lawrence Erlbaum.
[40] Lawley, D. N., and Maxwell, A. E. (1971): "Factor analysis as statistical method". New York:Elsevier.
[41] Afifi, A. A., and S. P. Azen. (1979): "Statistical Analysis: A Computer Oriented Approach. 2d ed.New York: Academic press.
[42] Harman, H. H. (1967): "Modern Factor Analysis". 2d ed. Chicago: University of Chicago Press.
[43] Jöreskog, K. G. and D. Sörbom (1979): "Advances in Factor Analysis and Structural EquationModels". Cambridge, Massachussetts: Abt associates.
[44] Saris, W. and H. Stronkhorst (1984): "Causal Modelling in Nonexperimental Research: AnIntroduction to the LISREL Approach". Amsterdam: Sociometric Research Foundation.
[45] Kruskal, J.B. and Wish, M. (1978): "Multidimensional Scaling. Sage University Paper series onQuantitative Applications in the Social Sciences", 07-011. Beverly Hills and London: SagePublications.
[46] Arabie, P., Carroll, J.D., and DeSarbo, W.S. (1987): "Three-Way Scaling and Clustering. SageUniversity Paper series on Quantitative Applications in the Social Sciences", 07-065. Beverly Hillsand London: Sage Publications.
[47] Tabachnick, B. G., and L. S. Fidell (1989): "Using Multivariate Statistics". New York: Harper andRow.
[48] Afifi, A. A., and V. Clark (1984): "Computer-aided Multivariate Analysis". Belmont, CA: LifetimeLearning Publications.
[49] Hartigan, J. A. (1975): "Clustering Algorithms". New York: Wiley.
[50] Aldenderfer, M. S. (1984): "Cluster Analysis". Beverly Hills: Sage Publications.
[51] Davidson, M. L. (1980): "The Multivariate Approach to Repeated Measures". BMDP TechnicalReport #75. Los Angeles:. BMDP Satatistical Software, Inc.
[52] Bishop, Y. M., S.E. Fienberg and P. W. Holland (1975): Discrete Multivariate Analysis: Theoryand Practice. Cambridge, Massachussetts: MIT Press.
[53] Hosmer, R. J. and S. B. Lemeshow (1989): "Applied Logistic Regression". New York: Wiley.

ETSI
Draft ETSI EG 201 472 V1.1.1 (1999-12)10
[54] British Psychologists Association: "The Code of Conduct". Available in Internet in:http://www.bps.org.uk/charter/codofcon.htm
[55] American Psychological Association (1992a): "Ethical principles of psychologist and code ofconduct". American Psychologist, 47, 1957-1611. Available in Internet in:http://www.apa.org/ethics/code.html
[55] Measurement Theory: "Frequently Asked Questions". Available in Internet in:ftp://ftp.sas.com/pub/neural/measurement.html
[56] ISO/DIS 9241-11: "Ergonomic requirements for office work with visual display terminals (VDTs)-- Part 11: Guidance on usability".
3 Abbreviations
3.1 AbbreviationsFor the purposes of the present document, the following abbreviations apply:
ACTS Advanced Communications Technologies and ServicesANOVA ANalysis Of VArianceAPA American Psychological AssociationBPS British Psychological SocietyDV Dependent VariableEG ETSI GuideEG ETSI GuideETR ETSI Technical ReportETSI European Telecommunications Standards InstituteEU European UnionFAQ Frequently Asked QuestionsHCD Human Centred DesignISO International Standards OrganizationISSUE IBC Systems and Services Usability Engineering (a RACE Project)ITU International Telecommunications UnionIV Independent VariableLISREL LInear Structural RELationships (A multimariate statistical technique)MANOVA Multivariate ANalysis Of VAriance (A multivariate statistical technique)MDS Multi-Dimensional Scaling (A multivariate statistical technique)MOS Mean Opinion ScorePCA Principal Components Analysis (A multivariate statistical technique)RACE Research on Advanced Communications in Europe (an EU-funded Research Program)RT Reaction TimeTC HF Technical Committee Human FactorsUSINACTS USability IN ACTS (an ACTS project)
4 What is usability?This clause presents current definitions of usability, including the social and economic impact of the application of thetechniques for improving usability in product development.
4.1 The ISO definition of usabilityETR 095 [1] attempted to make a definition of usability, based on the distinction between performance measures andattitudes towards a system. Since its publication, the most widely accepted standard on usability is ISO 9241 [2] , onwhich the definitions of usability in the present document are based.

ETSI
Draft ETSI EG 201 472 V1.1.1 (1999-12)11
The ISO 9241 [2] standard describes ergonomic requirements for office work with visual display terminals. Part 2 of thestandard is Guidance on usability aspects. This standard defines how to specify and measure the usability of products.and the factors which have an effect on usability.
The standard states that when specifying or measuring usability, the following information is needed:
1. A description of the intended goals.
2. A description of the components of the context of use including users, tasks, equipment and environments. This maybe a description of an existing context, or a specification of intended contexts. The relevant aspects of the contextand the level of detail required will depend on the scope of the issues being addressed. The description of thecontext needs to be sufficiently detailed so that those aspects of the context which may have a significant influenceon usability could be reproduced.
3. Target or actual values of effectiveness, efficiency, and satisfaction for the intended contexts.
In order to specify or measure usability it is necessary to identify the goals and to decompose effectiveness, efficiencyand satisfaction and the components of the context of use into sub components with measurable and verifiable attributes.
x Effectiveness is the accuracy and completeness which specified users can achieve specified goals in particularenvironments.
x Efficiency: the resources expended in relation to the accuracy and completeness of goals achieved.
x Satisfaction: the comfort and acceptability of the work system to its users and other people affected by its use.
The components and the relationships between them are illustrated in figure 1.
goals
product
equipment
task
user
environment
Context of use
effectiveness
efficiency
satisfaction
Usability measures
intendedobjectives
outcome ofinteraction
usability: extent to which goals are achievedwith effectiveness, efficiency and satisfaction
Figure 1: Usability framework according to ISO/DIS 9241-11 [56]
The context of use defined by the standard includes the following factors:

ETSI
Draft ETSI EG 201 472 V1.1.1 (1999-12)12
Description of users
Characteristics of the users need to be described. These can include knowledge, skill, experience, education, training,physical attributes, and motor and sensory capabilities. It may be necessary to define the characteristics of differenttypes of user, for example users having different levels of experience or performing different roles.
Description of tasks
Tasks are the activities undertaken to achieve a goal. Characteristics of tasks which may influence usability should bedescribed, e.g. the frequency and the duration of the task.
Detailed descriptions of the activities and processes may be required if the description of the context is to be used as abasis for the design or evaluation of details of interaction with the product. This may include description of theallocation of activities and steps between the human and technological resources. Tasks should not be described solelyin terms of the functions or features provided by a product or system. Any description of the activities and stepsinvolved in performing the task should be related to the goals which are to be achieved.
For the purposes of evaluating usability, a set of key tasks will typically be selected to represent the significant aspectsof the overall task. User tasks and sub-tasks can be identified by task analysis.
Description of equipment
Relevant characteristics of the equipment need to be described. The description of the hardware, software and materialsmay be in terms of a set of products, one or more of which may be the focus of usability specification or evaluation, or itmaybe in terms of a set of attributes or performance characteristics of the hardware, software and other materials.
Description of environments
Relevant characteristics of the physical and social environment need to be described. Aspects which may need to bedescribed include attributes of the wider technical environment (e.g. the local area network), the physical environment(e.g. workplace, furniture), the ambient environment (e.g. temperature, humidity) and the social and culturalenvironment (e.g. work practices, organizational structure and attitudes).
Usability measures
Usability measures include effectiveness, efficiency and satisfaction. These are measured in user trials of the product.
4.2 Social and economic impact of considering usability in thedesign process
What benefits can be achieved through an appropriate application of the Human-Centred Design approach?
There are many reasons, and one of them is the recent legal regulations for designing safe systems which do not harmthe health or the well being of their users EEC Directive 90/270/EEC [7].
But usability engineering has proved that application of the principles of Human-Centred design have high payoffs(INUSE project document: User Centred Design, 1996) [6]:
x Reduced production costs: the overall development times and costs can be reduced by avoiding over design andreducing the number of changes required late in design.
x Reduced support costs: systems which are easier to use require less training, less user support and lesssubsequent maintenance.
x Reduced costs in use: systems better matched to user needs improve productivity and the quality of actions anddecisions. Easier to use systems reduce stress and enable workers to handle a wider variety of tasks. Difficult touse systems reduce health and well being, motivation and may increase staff turnover and absenteeism. Difficultto use systems are time consuming to use, and are not exploited to full advantage, as the user may bediscouraged from using advanced features. In some circumstances, they may never be used. An ineffectivesystem may be a major financial liability for the user organization.
x Improved product quality: Human-centred design results in products which have a higher quality of use and aremore competitive in a market which is demanding easier to use systems.

ETSI
Draft ETSI EG 201 472 V1.1.1 (1999-12)13
All these benefits are obtained taking on account the total life-cycle costs of the product, not only those of thedevelopment, but also the set-up phase and the maintenance phase. The initial costs of human-centred design activitiesare compensated by all the benefits that produce at the end. In spite of being so important benefits, they are seldomexpressed in economic terms.
It is not so easy to estimate the benefits produced by applying Human-Centred Design. This is usually a difficult task,which has only recently found some solutions. For instance, Jakob Nielsen has reported estimates of the benefitsproduced by the application of usability techniques in software development (Nielsen, 1993 [8]). Nielsen and Landauer(1993) [9] have also reported benefits in several projects which they claim can be up to 5000 times the cost.
On the other hand, social impact of these technologies is experimenting spectacular growth. As the global informationinfrastructure expands in exponential fashion (e.g., during last years, Internet population doubled every few months),there are important changes in how people work and in some other aspects of daily life (cf. Adam et al. 1996) [10] . Theinformation is now more global, and more easily accessed. Virtually all entities, from large companies to individuals,through small and medium enterprises, are engaged in activities that increasingly involve accessing remote databases,and the competitiveness depend heavily on the effectiveness and efficiency of that access.
As a consequence, the potential user community for advanced technologies is becoming very large, and rather non-technical, incorporating people not previously used to computers or I.T., or telecommunication technologies. It istherefore urgently necessary and strategically critical to put in practice all kinds of techniques and approaches thatenable these people to become used with advanced technologies. Among the most urgent tasks are to develop userinterfaces that require minimal technical expertise by the users, and support a wide variety of information-intensivetasks.
5 Usability evaluation and the Human-Centred DesignProcess
Which are the principles of Human-Centred Design?
The essential principles of Human-Centred Design are:
x an appropriate allocation of functions between user and system should be carried out;
x the design solutions should be iterative, and the decisions should be made depending on the results of usability;
x evaluations, thus providing feedback from each phase to the others;
x it requires that users actively involve in the design;
x the design teams should be multidisciplinary, thus taking on account all knowledge required to produce a usablesystem.
To what products can the HCD be applied?
The procedures outlined in this clause can be applied to any system component the user may have to interact with. Thisincludes hardware and software components, as well as user manuals.
5.1 The Human-Centred Design ProcessISO standard ISO 13407 [3], Human centred design processes for interactive systems, provides guidance on humancentred design activities throughout the life cycle of computer-based interactive systems. The standard is targeted topeople who manage design processes. According to ISO 13407 [3] , human centred design consists of four differenttypes of design activities:
x understand and specify the context of use;
x specify the user and organizational requirements;
x produce design solutions;

ETSI
Draft ETSI EG 201 472 V1.1.1 (1999-12)14
x evaluate design against requirements.
According to ISO 13407 [3] , a development project must specify the procedures used, the information collected and usemade of the results.
The main problem with the currently available HCD process found by the USINACTS project [11] [12] [13] is that itcannot be clearly connected to the software design process. It is essential to be able to talk to the designers in their ownlanguage, i.e. to describe the phases of software design process and integrate the activities of human centred design tothis familiar process. ISO 13407 [3] is a concrete step to this direction.
The results of user involvement are most effective in the early phases of the projects. That is why HCD process makesemphasis in the application of methods for user requirements definition and software requirements analysis. Userrequirements cannot be fixed in the beginning of the project but the project must be prepared to refine user requirementsthroughout the design process. New ideas during the development should be registered even if the project does not planto implement them at that moment. Each requirement shall be equipped with information about where the requirementcame from and how the project decided to handle the requirement. If the requirement was rejected, the project shallrecord why.
The usability activities in the design process can be described as illustrated in figure 2.
1) define initial user requirements;
2) visualise design decisions in the software requirements phase:
- use case descriptions;
- screen views, user interface prototypes;
- collect feedback and new ideas from the users;
3) prototype during the design phase and evaluate with the users;
4) organise field trials in the end, but it is recommended not to plan field trials without having laboratory tests withthe users first. In the laboratory trials the main usability problems can be identified and they can be solved beforethe field trials. In the field trials you can get feedback of the usability of the system in real and continuous use.

ETSI
Draft ETSI EG 201 472 V1.1.1 (1999-12)15
P r oduct r equi r ements
In i t ial userr equir ements
In ter views, obser vat ion ,evaluat ion of pr evious pr oducts
D esign and implemen tation
Evaluation
Ready made system or ser vice
Scenar ios of useand mock-ups
REF IN ED U S ER REQ U IRE ME N T S
P r ototypes
IT ER AT ION
IT ER AT ION
IM P L EM EN T AT ION REQU IREM EN T S
Figure 2: Usability activities during the design process as recommended by the USINACTS Project
The application of HCD in development projects has proven to provide a great benefit. Below you will find answer totypical questions regarding this application:
What can a Human-Centred Design do?
A Human-Centred Design can be an important contribution to guarantee the success of the product with a variety ofdifferent users and to avoid the failure of the product. This could happen if a technologically sound product does nottake into account the requirements of the users, one of which is usability.
What a Human-Centred Design cannot do?
Neither Human Factors, nor usability engineering can do any kind of magic for solving usability problems at the end ofprojects. This is a very common mistake. For this reason, it is important to stress the participation of the usabilityspecialists in all the steps of the design process, to avoid surprises when the system is fully specified and working.
Usability engineering, even when carefully planned and carried out, cannot guarantee to sell a product per-se. Althoughan increasingly important attribute for people's purchasing decisions, marketing activities must complement and stressthe most important features of the product.
5.2 Usability evaluation within the Human-Centred DesignProcess
Very often, usability techniques are only considered at the end of the development of a product, which is a mistake,since it is most useful in all steps of the development process. ETSI ETR 095 [1] specifies the application of usabilitytechniques in the different phases:
ETSI
Draft ETSI EG 201 472 V1.1.1 (1999-12)16
Definition of usability goals.
The usability goals are the desired end states which should be met for the system or service be judged as usable. Thedimensions of usability have already been commented: effectiveness, efficiency, satisfaction, learnability and flexibility.
These goals should be particularized in measurable criteria, either absolute (e.g., the minimum level the system orservice should meet), or relative (in comparison with previous systems or prototypes). It is important to specify how thevalidity of these measures going to be analyzed, this is, up to what extent the measures being taken will relate to theglobal measure of the system. E.g., how much error rates relate to the user's final consideration of the system.
Identification of user's population, task and environmental characteristics.
This step specifies the target group for the evaluation. It is essential to perform sampling or the selection of the userswho will participate in the evaluation process. Tasks are usually many, and very different. Appropriate sampling oridentification of the critical tasks for evaluation are the base of further steps of the evaluation process. Environmentalcharacteristics should also be defined, since they may have influence on the measures being undertaken. These variablesshould be identified during this phase and addressed in the design phase.
Specification of usability criteria.
Usability criteria specify how any one particular goal is to be achieved. This includes operationalization of the variables,this is, specifying how they will be measured, the precision with which it can be achieved, etc.
Scenario building.
A scenario represents a sequence or flow of user actions required to achieve a specific task. There are usually manydifferent ways to achieve the goal, and then different users may follow different steps while interacting with the systemor service.
Building the scenarios for each task ensures that all users follow the same process, and that measures taken arecomparable (e.g., time and errors measures, and subjective data).
The scenarios should be based on realistic user tasks, and only after the whole set of them have been assembled it will bepossible to perform the usability testing.
Usability testing.
This step should only be performed after all the previous steps have been accomplished, and if the design (see below foreach technique) has been completed. This is by far the most expensive and time-consuming phase, so its success orfailure critically depends on its appropriate planning.
6 Choosing the evaluation methodThis clause is intended to give a summary table of the properties of each method reviewed in the present document, sothat evaluators can compare them and choose the most appropriate for their requirements and the moment of theevaluation.
The table is divided into two different parts: first part describes testing and evaluation methods, and the second partincludes data collection and measurement techniques. This means that you can prepare one of the methods in the formercategory with any (although not always!) of the data collection methods in the later category. For instance, you can planexperiments gathering data by means of audio-video recording and questionnaires at the same time. But, for example,questionnaires are usually not made at the same time that observation.
Of course, the usability expert is always free to choose according to some other needs. Here we try to put the mostcommon techniques, and also its most common applications.

ETSI
Draft ETSI EG 201 472 V1.1.1 (1999-12)17
Table 1: Testing and evaluation methods
Method Name Design cycle Stage Users Needed Main Advantage Main DisadvantageExperiments Components
(hardware orsoftware) design.Establishing genericprinciples forsystem design,basic HF research.
Depends oncomplexity. At least10 for design cell.
It allows to testdesign hypothesesor competingalternatives in anoptimal way.
Complex techniquesinvolved, whichrequires expertknowledge formaximum benefit.Usually made in theusability laboratory,and not in the realuse environment.
Field Observation Final testing.Task analysis.
3 or more It is made in realuse environment:provides first-handfeedback on theuser’s interactionsin the context of thereal task, and it isflexible tocircumstances.
Very costly.Difficult to analyze,and to know thereasons forbehaviour.Different observersmay differ ininterpretations
Heuristic evaluation Early design, "innercycle" of iterativedesign
None (it is made byexperts)
Finds out individualusability problems.Can address expertuser issues.
Does not involvereal users, so doesnot find "surprises"relating to theirneeds.
Focus groups Task analysis, userrequirements
6-9 per group Spontaneousreactions and groupdynamics.Allows to find outopinions or factorsto be incorporatedin other methods(e.g., surveys)
Hard to analyze.Low validity.
Input logging Final testing, follow-up studies
At least 20 Finds highly used orunused features.Can runcontinuously, andmay be felt non-intrusive.Data gathering isautomatic, and apermanent record ofthe interaction canbe kept.
Analysis programsneeded for hugemass of data.Data is at a veryfine level, requiringtime-consumingdata consolidationand reduction.Violation of users'privacy.
Surveys Follow-up studies,User feedback.User requirements.
Hundreds Tracks changes inuser requirements.Analysis of user'sopinion for theworking system inits real environment.
Samplingprocedures and fieldtests organizationrequire a lot of work,thus costly.

ETSI
Draft ETSI EG 201 472 V1.1.1 (1999-12)18
Table 2: Data collection and measurement techniques
Technique Method in which it isused
Main Advantage Main Disadvantage
Questionnaires Surveys.Experiments. Structured interviews.
Easily elaborated andcompared, once avalidated instrument isdeveloped.Written interchangeinherently more “formal"and less natural than aspoken interchangeMay be self-completed byusers , and thus easy andcheap to repeat.Usually appropriate to findout subjective userpreferences and attitudes.
Pilot work needed tovalidate the instrument canbe costly and complex.May require prompting tousers for stimulatingcompletion.Less effectivecommunication: questionsand answers may beinterpreted differently ornot be well understood.Contradictions may beoverlooked or requiresecond round of questionsto check.
Interviews User requirements. Task analysis
Flexible, in-depth attitude,experience probing andspontaneous information.Effective communication:ability to explain questionsbetter and to interpretanswers better.Contradictions may bepointed out and explainedright away.
Time consuming. Hard toanalyze and compare.Open answers data mustbe consolidated andstructured for comparison.Requires considerablemanpower.Reactions may beinfluenced by interviewer.
Performance measures(e.g., reaction time, errorrates)
Performance evaluationExperiments
Objective measures.Results easy to compare.They can be also taken byexperts (e.g. mistakes)and include expertjudgements
Does not find subjectiveconstructs (opinion,attitudes, satisfaction).
Thinking aloud Experiments.Interviews.
Points out cognitiveprocesses implied in theuse of the system. It highlights usersmisconceptions andconceptual models.
Unnatural for users. Hardfor expert users toverbalise.Information is difficult toanalyze.
Audio-video recording ObservationExperiments
Records all behavioursand can be kept foranalysis in the future.Wealth of data also on“body language" reactionsPossibility of multipleanalysis by differentobservers increasingreliability of results
Ethical and legalrequirements (see clause9).Behaviour has to becategorized.Very costly and lengthy(10 hours to analysesatisfactorily 1 hour ofvideotape)
7 Usability evaluation techniques in detail
7.1 Reliability and validity of usability evaluationReliability and validity are two important principles in any scientific research, and also in usability evaluation. Bothconcepts are traditional in Psychometrics and related fields (e.g., survey research), but also apply to any usability testing.
Reliability is defined as the property of a measure of being stable on time and across different conditions, i.e., a reliablemeasure should not be affected by changes in the interviewer, language, or environmental conditions. For instance, if aquestionnaire is reliable it should yield the same results if used by different researcher on different occasions.

ETSI
Draft ETSI EG 201 472 V1.1.1 (1999-12)19
Validity is defined as the degree to which the research procedure has measured whatever it was intended to measure.The validity of a measurement (e.g. that obtained by means of a survey) is a technical concept which refers to the degreein which the empiric evidence and the theoretical basis support the interpretations and inferences made from themeasurements. Validity also comprises the degree of adequation of the measurement instrument (and therefore of themeasurements made from it) for a specific usage.
A thorough review of validity testing is clearly beyond the scope of the present document, but it is important to state thedifferent types of validity. The best known approach to validity in social research was commenced by Campbell yStanley (1966) [14], and updated in 1979 by Cook and Campbell [15]. Best known classification of validity is in twoconcepts:
x Internal Validity: the degree to which the observed relationship between variables is obtained from thehypotheses handled by the researcher, or there are other hypotheses that can explain the same results. A classicalexample of lack of internal validity is the presence of spurious correlation's.
This includes Content and/or construct validity: this is a concept which refers to the degree which the items or questionsof the test or survey represent the totality of the possible items for the construct or behaviour being measured. On theother hand, usability testing procedures usually measure non-observable constructs, in some cases very complex ones,e.g., attitudes. Construct validity refers to the degree which the questions or items in the test or questionnaireappropriately represent the construct under measurement.
x External Validity: the degree to which the conclusions from a particular research, made in particularconditions, can be generalized to any other kind of conditions or contexts (e.g., different samples, places ormoments in the time). A typical problem for external validity is the representativeness of the sample in theresearch. As part of the HCD process, as outlined above, the identification of the user population is a crucialstep. To achieve the goal of having a representative group of users of that population, sampling is an essentialprocess in many usability testing procedures. Good advice about this particular issue can be found in ACTS SIIguideline G4, "Organization of advanced communication services trials" [16].
Campbell and Stanley distinguish between four types of external validity:
Criterion-related or predictive validity
The criterion is a variable or characteristic of real interest whose performance we are interested to predict from themeasure (e.g. purchasing a particular device from an attitude towards it). The criterion is a direct and independentmeasurement which is tried to predict by the measure. Criterion validity can be tested by computing the correspondencebetween the classification done with the measure and the classification made with the external criterion.
Historic validity:
This is the degree to which the research is dependent on the particular historic moment in which the research is made.This of course greatly depends on the particular research area.
Ecologic validity:
This is the degree to which the research results can be generalized to real-world situations (in practice, all research ismade in more or less artificial situations).
Validity of statistical conclusions:
it comprises answering the question "are results due to any statistical artifact or not?". Many modern statisticalprocedures are so complex that they can produce results which have no real relationship with the real world.

ETSI
Draft ETSI EG 201 472 V1.1.1 (1999-12)20
7.2 Experiments
7.2.1 When should experiments be used in usability evaluation?
Experiments are still the quintessential scientific research method. There are many reasons for this, and the first one isthat experiments allow to obtain "strong" conclusions about research hypotheses, and to make optimum decisionsbetween competing alternatives. Another very important reason is that using appropriately the experimental frameworkthe obtained knowledge is accumulative, the continuous replications and variations of the conditions in a particularseries of experiments allow the researcher to obtain more data to confirm or not his or her hypotheses. This sense of"research framework" and of replication and variation of particular conditions has been used as a kind of philosophy, aswell as taking advantage of the available techniques, for applied research areas, like in quality control. Furthermore, it isperhaps the only practical way for usability experts to develop theories or models to explain how and why people prefersome things against others, for example. In this sense, experiments are essential to develop guidelines that can begeneralized to a broader scope than the case that has been tested.
However all these advantages, its use in applied settings, as in usability evaluation, may become really complex, and wethink it is important to clearly point out its requirements so that the usability expert can obtain the maximum benefit ofthese powerful techniques. Some well known usability researchers, as Nielsen (1993) [8], do not cover traditionalexperiments in their handbooks, and they prefer other quicker and less complex techniques. Actually, if you get anexperimental design handbook, you will find out how complex this issue can be, and at the same time, how it hasbecome an area for specialists itself, with very few references or examples of real applications.
Our aim then with this part of the present document is to provide a summary of the most common experimental methods,especially those applicable to usability evaluation, and to clearly specify their requirements to take full advantage of itsapplication. Other points in this chapter provide guidance about choosing the particular design and controlling theexperimental factors and other variables, another characteristic feature of this method.
7.2.2 Requirements of experiments
x Experiments are the best method to test between competing hypotheses or alternatives. This also means that, forreally making an experiment, there must be alternative systems or situations to be compared. In systemdevelopment this can be complex, difficult, or impossible. However, they are usually very easy to do in theprototype phase. The usability expert should make clear to the development group that following theexperimental approach, these methods provide optimum results. The hypothesis being tested should be veryclearly made before the experiment, and the optimum way is to have them formalized in a mathematical way.
x Experiments can be carried out even if the system being tested does not exist. For instance, Wizard of Oztechniques are a tool to produce alternative menu procedures in speech recognition services. Basically, in the"Wizard of Oz" technique, the user interacts normally with the system, but the user input is transmitted to the"wizard" who is the experimenter, and who simulates the functioning of the non-existing service [8].
x The basis of any experiment is control. The more variables are controlled, the better. However, this does notmean that for controlling the variables they should be included in the experimental design. In this sense, the lesscomplex the better. Therefore, all intervening variables must be controlled, or randomized, and only those ofinterest to the evaluator included in the experimental design.
x Experiments are never made isolated. It is a complex and costly technique, which only gives its full potentialwhen made in a most planned and structured way. Therefore, think on any particular experiment not as the finalpart of a research program, but as the beginning of a series of experiments to iteratively find out the solution tothe hypotheses. The basic concept of experiments is replication.
x Detailed design of all aspects of the experiment is essential. For complex research situations (e.g., manyinteracting factors), avoid complex designs as those including many experimental factors, and try to solve thecomplex problems in an iterative way, eliminating and controlling more factors in each step. Experiments arenot the best method to handle the complexity of many applied usability evaluations, but used appropriately canprovide response to surprisingly complex questions.

ETSI
Draft ETSI EG 201 472 V1.1.1 (1999-12)21
x Sampling of the participants in the experiments (usually called subjects) is an essential phase of the experimentalmethod. Although it is very often neglected, a rigorous sampling is the best guarantee to have generalizableresults from the experiments. In this sense, we do not consider these methods as different from those as surveysor observation.
7.2.3 Usual experimental designs
Experimental design is a very complex issue, for its great variety of procedures in very different areas, and a detaileddescription of even a few of them is beyond the scope of the present document. Therefore, we will only deal with themost basic ways of designing an experiment in our context.
As it has been said, the aim of experimental design is to highlight the effect of the experimental factor and avoidundesired effects by strictly controlling the influence of irrelevant variables. Underlying most experimental designs isthe idea of comparing the performance of groups of subjects who have experienced different levels of the experimentalfactor. The influence of irrelevant subject-related variables can be controlled by randomly allocating the subjects orexperimental units to the various conditions of the experiment.
Repeated Measures
The most direct way of controlling subject variables is to ensure that all groups of experimental subjects have identicalcharacteristics. This seemingly impossible goal is achieved by simply using the same subjects in each experimentalgroup. This is called a repeated measures design, i.e. one where repeated measures are made on the same subjects underall the experimental conditions. These are the most usual experimental designs in usability research, as in Psychology orMedical Research, because, all other things being equal, the researcher needs fewer subjects for controlling the effects ofthe various variables than with independent groups designs. However, there is also a disadvantage, and is that, ingeneral, statistical analysis of data obtained with this type of designs is more cumbersome, and can make difficult todistinguish between hypotheses and alternatives.
The arrangement is illustrated in the figure below. For instance, subject1 experiences condition 1, 2, 3, etc. This isrepeated for each subject and the data are then compared. Any differences between the two conditions should only resultfrom experimenting the different conditions.
Subject 1
Subject 2
...
Subject n
Level 1 Level 2 Level 3 ... Level p
Figure 2: Illustration of repeated measures experimental design
The problem with the repeated measures design is that it is vulnerable to another irrelevant variable - the order effect.This effect refers to the influence on the response produced by the order in which the subjects experience eachexperimental condition. If for instance, the experimental conditions involve similar tasks (which they often do), then thesubjects may learn from the first condition and achieve consistently higher scores during the second condition. This typeof order effect is called a practice effect. If the experimental condition is quite long, for example an hour or more, thenthe subjects may become tired leading to consistently lower scores in the second experimental condition. This is called afatigue effect. In order to control for order effects when using a repeated measures design a procedure known ascounterbalancing is employed. This requires that half the subjects perform the experimental tasks in one order (i.e. A-B)and the other half perform the tasks in the reverse order ( B-A). The advantages of any practice effects and thedisadvantage of any fatigue effects are thereby allocated evenly to the two experimental conditions (ISSUE UsabilityGuidelines) [5].

ETSI
Draft ETSI EG 201 472 V1.1.1 (1999-12)22
Independent Groups
In the independent groups designs, subjects are allocated randomly to the separate experimental conditions. The randomallocation of subjects to the experimental groups is the essential condition to reduce the risk of systematic bias. Allthings being equal, and in comparison with repeated measures designs, these designs require more subjects. Therefore,the more groups, the more people needed. This is one reason why these designs are usually kept very simple (few levels,few groups). Results obtained with these designs depend on the variability in each group: if this is high, then findingeffects can be quite difficult; if it is low, then it is very possible to find them. Provided that the sample sizes are thesame, independent group designs are known to be less powerful than repeated measures designs.
Group 1
Level 1
Subject 1
Subject 2
Subject 3
.
.
.
Subject n
Group 2
Level 2
Subject n+1
Subject n+2
Subject n+3
.
.
.
Group p
Level p
.
.
.
Subject np
. . .
Figure 3: Image representing independent groups design
Choosing the appropriate experimental design
A major aim of all three experimental designs dealt with below is to eliminate systematic differences that are introducedby the subjects themselves. Knowing which experimental design is the most appropriate for a given experiment islargely a matter of experience on the part of the experimenter; there are no fixed rules. However in choosing anappropriate design, the experimenter has to make a number of key decisions. This process is summarized in the form ofthe flowchart that appears in Figure below.
Can you obtain (conveniently) pairs ofsubject matched on the variables whichare likely to have a major influence onperformance?
If subjects are tested under differentconditions of the experiment, would youexpect the order effects to be small and/orsymmetrical?
Use repeated measure design
Use matched pairs design
Use independent groups design
Yes
Yes
No
No
Figure 4: How to control subject variables (from Miller, 1975) [17]

ETSI
Draft ETSI EG 201 472 V1.1.1 (1999-12)23
Controlling Situational Variables
Experimental design does not end with the control of subject variables. The influence of the experimental situation mayalso undermine an experiment. As stated previously, the basic technique is to hold as many variables as possibleconstant in the experimental scenario. The situational variables include the physical characteristics of the experimentalroom or laboratory such as temperature, lighting, background noise and apparatus. Clearly once these variables are heldconstant, they are incapable of introducing either systematic or random bias into the experimental data.
A further source of situational bias may originate from the experimenters themselves. Most psychological studies rely ona set of standardized instructions (or 'script') to ensure that subjects receive identical information and any influence thatmay be due to the experimenter is minimized. There is evidence that experimenter characteristics such as age, sex and ingeneral his or her behaviour may have subtle effects on subjects' performance.
These types of situational variables are not always apparent during the planning of the experimental trials. This is one ofthe many reasons why it is important to perform a pilot trial before introducing 'real' subjects into the experimentalscenario. A pilot trial corresponds approximately to a 'dry run' of the experimental trial where the experimenters canfamiliarise themselves with the experimental procedure and apparatus/software may be tested for reliability. Someexperimenters find it useful to take on the role of the subject during the pilot trial phase. This is a useful technique fordetecting those situational variables that may not be apparent 'on paper'.
7.3 Field observationObservation can be considered a fundamental aspect of any science. For instance, there would have not been Physics aswe know it today without researchers observing the behaviour of physical objects of any kind. The same can be said inmany other research areas, including ours.
First, we have to point out some important concepts:
Observation can also be considered a data collection method. For instance, the records taken by the usability expertwhen a user is testing a prototype. However, we are considering observation as a research method. In this sense,observation is a method in itself, which distinguishes from others in that it requires that the system is tested in its naturaluse environment.
Observation is not simply watching. Observation requires a structured plan, and in this sense, it has the same complexitythan other methods, as experiments.
Observation is structured, planned and systematic.
Therefore, the main feature of observation is that it is made in the natural environment. All behaviours of interest, in allthe different moments in time, and in all environments of interest, will be considered as the population of observationunits. The first phase is precisely defining this population of observational units (Wilkinson, 1995) [18]. Then, theremust be a process of event and time sampling, which consists of choosing a representative subgroup of these elements,and which will be the observation plan. Sampling techniques are perfectly applicable for these purposes.
A system to record behaviour has to be devised. Audio-video recordings are the best procedure, since they allow thatdifferent observers categorize the behaviours. However, there can also be other records, as those taken by observers(field notes), checklists, or ratings.
The following step is producing behaviour categories, which will provide the data for the analyses. This step isextremely important, since quantifying behaviour as a function of these categories will be the most time-consuming taskof this procedure. Therefore, ensuring the validity of the categories is an essential point.
After the categorization of behaviours by at least 2 observers, tests should be made to find out whether there aredifferences because of the observers or because of the behaviours. Statistical procedures to test inter-observer agreementare usually found in books, but the most complete approach for this purpose is still Generalizability Theory (Cronbach,Gleser, Nanda and Rajaratnam, 1972) [19].
There are different approaches to observation (Wilkinson, 1995) [18], in particular non-participant (the most traditionalapproach) and participant observation. This last category means that the observer has some intervention in the situation(e.g., when the experimenter interacts with a user of a videoconferencing system).

ETSI
Draft ETSI EG 201 472 V1.1.1 (1999-12)24
Advantages
x It is a direct method.
x Since it should be made in the natural environment, observation provides data impossible to get in the usabilitylaboratory. For instance, when testing a public telephone, people's reaction will sure be different in a controlledthan in a public environment.
x There is no experimental or other manipulation.
x Useful when there are behaviours or situations on which subjects are unable to report with accuracy, such as,e.g., with children, or non-verbal behaviour.
Disadvantages
x Very costly and really difficult to carry out.
x Validity depends heavily on the categorization process.
x It can be biased by using different observers, who may produce different records, thus producing "the observereffect" (there are differences as a function of observers, thus making difficult making conclusions).
x It can be difficult to know the reasons why particular behaviours are made.
7.4 Heuristic evaluation
7.4.1 What is heuristic evaluation and when can it be used?
The goal of heuristic evaluation is to find the usability problems in a user interface design so that they can be attended toas part of an iterative design process. To make the evaluations we need a few evaluators that examine and makeevaluations about the interface. This evaluations are based on usability principles (Heuristics). In this paper we use theNielsen heuristics [8] [20] [21], but we can find other principles in the interface and usability guidelines. The task of theevaluator is generate a list of usability problems found in the interface, annotated with references to those usabilityprinciples that were violated by the designing each case.
A number of advantages are claimed for heuristic evaluation. They include:
x it is cheap;
x it is intuitive and it is easy to motivate people to do it;
x it does not require advanced planning;
x it can be used early in the development process.
A disadvantage of the method is that it sometimes identifies usability problems without providing direct suggestions tosolve them The method is biased by the current mindset of the evaluators and normally does not generate breakthroughsin the evaluated design.
7.4.2 Recommendations for using heuristic evaluation
In the heuristic evaluation design the experimenter has to considerate the follow issues:
x In several investigations the results showed that only one evaluator performing a heuristic evaluation foundonly 35% of the usability problems in the interface so that different evaluators are recommended to be used. Onaverage over 5 evaluators (at least three) are necessary.
x The results of one evaluator can not be known by the other ones until all evaluators finish their trial.
x The results of the evaluation have to be recorded while are generated (for example, saying aloud the problemsfound and the experimenter writing it).

ETSI
Draft ETSI EG 201 472 V1.1.1 (1999-12)25
x The experimenter cannot give more information that necessary (especially if non-expert evaluators are beingused), because with this information the evaluator can infer actions and solutions about problems that the finaluser cannot.
x The evaluation session should not be longer that two hours.
x A general recommendation would be that the user go through the interface at least twice. The first pass wouldbe intended to get a feel for the flow of the interaction and the general scope of the system. The second passthen allows the evaluator to focus on specific interface elements.
x When the heuristic evaluation is insert in the design process, is recommended conduct a session including theevaluators, experimenters and interface designers. In this session should be discussed the problems, solutionsand redesign of the interface.
x Major individual differences are found between evaluators in the problems identification task, howeverevaluators experienced in usability and interface have better results that non-experienced evaluators.
7.4.3 A list of heuristics
These usability principles should be followed by all user interface designers. This specific list was developed by JakobNielsen and Rolf Molich [21], and can be easily applied to a large range of different systems:
x Simple and natural dialogue: Dialogues should not contain information that is irrelevant or rarely needed. Everyextra unit of information in a dialogue competes with the relevant units of information and diminishes theirrelative visibility. All information should appear in a natural and logical order.
x Speak the users' language: The dialogue should be expressed clearly in words, phrases, and concepts familiar tothe user, rather than in system-oriented terms.
x Minimize the users' memory load: The user should not have to remember information from one part of thedialogue to another. Instructions for use of the system should be visible or easily retrievable wheneverappropriate.
x Consistency: Users should not have to wonder whether different words, situations, or actions mean the samething.
x Feedback: The system should always keep users informed about what is going on, through appropriate feedbackwithin reasonable time.
x Clearly marked exits: Users often choose system functions by mistake and will need a clearly marked"emergency exit" to leave the unwanted state without having to go through an extended dialogue.
x Shortcuts: Accelerators -unseen by the novice user- may often speed up the interaction for the expert user suchthat the system can cater to both inexperienced and experienced users.
x Good error messages: They should be expressed in plain language (no codes), precisely indicate the problem,and constructively suggest a solution.
x Prevent errors: Even better than good error messages is a careful design that prevents a problem from occurringin the first place.
x Help and documentation: Even though it is better if the system can be used without documentation, it may benecessary to provide help and documentation. Any such information should be easy to search, be focused on theuser's task, list concrete steps to be carried out, and not be too large.
7.5 Focus groupsThe focus group can be considered a "discussion-based interview" (Millward, 1995) [22]. Following this definition, itinvolves multiple respondents who are "focused" (i.e., discuss about an external stimulus), and relatively staged by amoderator.

ETSI
Draft ETSI EG 201 472 V1.1.1 (1999-12)26
The focus group began with research into the effectiveness of wartime propaganda, and the social effects of masscommunication. Its evolution was made by marketing consultants, for whom focus groups have become central toanswering the question of "why" consumers behave as they do.
Although it is considered the quickest and most cost efficient mean of generating consumer relevant information, this isyet to be proved. Currently, as Millward points out, "this method has evolved into a 'quick and dirty' means of fulfillingclient needs rather than as a sophisticated research tool".
Nowadays, after adapting the method to different purposes, it has become more popular in other behavioural or socialsciences settings, as, e.g., health psychology and marketing research, areas in which this method allow to geta great dealof information, for instance, about the issues involved inmarketing a product. Nielsen (1993) [8] cites this method in hislist of methods for usability assessment.
7.5.1 Advantages and disadvantages of focus groups, and applications
The focus groups not only enhance the ability of the usability evaluators to answer research questions, but, and perhapsmore important, they can generate questions from new angles and perspectives (Millward, 1995). It has to be noted thatit is currently the only method in which people interactuate, and in which the opinion of a group (people interacting) canbe studied. One characteristic advantage of using the group as opposed to the individual as the medium of investigationis its "isomorphism to the process of opinion formation and propagation in everyday life", because "opinions about avariety of issues are generally determined not by individual information gathering and deliberation but throughcommunication with others".
This method, however, depends heavily on how rigorously is conducted. There are several issues to guarantee its qualitycontrol". In particular, it is important to recall that the aim of focus groups is to get closer to participants' understandingsof and perspectives on certain issues. It is not geared to the formal testing of hypotheses in the traditional hypothetico-deductive sense. In a rigorous sense, it can be considered a method of data collection or a supplement to other methods.
This technique is especially applicable when:
x New and different services or systems, to find out first impressions of the service.
x When population is not specialized, and the target is the normal population.
x Marketing issues. To find out the attributes, opinions, attitudes, etc. that can be used to produce a successfulmarketing campaign.
x Attitude change. When there is the need to know which aspects can be changed in a product.
Special attention can be paid to the use of focus groups together with surveys: used together with surveys , the focusgroups can be used for testing results coming from the surveys, or can provide the issues which will be tested with thequestionnaires. "They can establish the variety of opinion concerning a topic, establish relevant dimensions of attitudesand identify relevant indicators for the constructs being measured. Focus groups can also ve used to test variousquestionnaire items for readability, comprehension, wording, order effects and response variation.
Once the survey has been conducted, there are other useful applications: first to assess respondents' reaction to thesurvey and in particular to trace the cognitive and social processes involved in answering, and second, to aid in theinterpretation of survey findings by exploring in greater depth the implications of certain quantitative patterns andrelationships.
7.5.2 How to conduct focus groups
The number of participants is, in average, of nine participants per session, with a conventional range from six to twelve.There is evidence that group size is inversely related to the degree of participation. There are more reasons to keep thesize small, and they are that large groups are difficult to manage and monitor, and there is the risk of break intosubgroups. Sessions last between one and two hours.
The character of "focused" is provided by a particular stimulus object, event or situation. In the context we are talkingabout, the stimulus might be a scenario for using a service, a particular system, or even a concept (a system or servicenot yet developed).

ETSI
Draft ETSI EG 201 472 V1.1.1 (1999-12)27
The group should be chosen on theoretical grounds as reflecting those segments of the population who will provide themost meaningful information in terms of the project objectives. But, as with any other usability testing method, theconcept of "representativeness" of the group of participants is essential.
This particular method largely relies on the moderator style and skills. Moderation is all about process facilitation andwhat is called "listening and questioning skills". Central to this is the concept of participant empowerment. Basically thismeans that the moderator is the facilitator of some else's discussion.
Data are collected in the form of transcripts from audio or video tape. With video recording of the sessions,observational data can also be extracted.
There are very few data analysis techniques for this technique, in particular content analysis, or the categorizationtechniques used in observation.
7.6 Input loggingInput logging consists on the use of a recording device embedded or attached to a system or users to capture and recordthe users' performance.
The main advantages of input-logging method are:
x the method can be applied on a large sample of users;
x it can be used over a long period of time (longitudinal);
x it does not require the presence of the evaluator. It is accurate;
x it can capture low level and detail data.
So, a large amount of detailed data can easily be obtained in a unobtrusive manner.
The disadvantages are:
x the method may affect system performance (e.g. increased response times);
x it is unfocused, and a large amount of data captured makes analysis difficult;
x if contextual information is not captured, interpretation is difficult;
x the set up and the analysis may be time-consuming if no automatic system for analysis is available.
So the interpretation of the results from logs may be difficult, due to the lack of contextual information.
With input logging the data can be automatically collected for a large number of users without the constant presence ofan evaluator. This makes it ideal for longitudinal studies particularly in field settings.
The large amount of data captured makes it critical for the evaluator to have clear and focused goals and if possible toavoid 'data trawling' by capturing too much data. Analysis of such potentially large amounts of data can clearly beimproved through the use of relevant statistical packages.
In any case, it is recommended that logging is always used in conjunction with other methods (like questionnaires orinterviews). These other methods are necessary to ensure that sufficient contextual information is gathered, which willfacilitate the analysis and ensure greater validity of the results.
It should also be noted that experts with specialist skills in computing will be required to write and embed requiredsoftware.

ETSI
Draft ETSI EG 201 472 V1.1.1 (1999-12)28
Logging model
Considering conditions and precautions of use, a logging model is proposed to minimize the disadvantages of input-logging technique.
The logging model design is guided by the following intentions:
a) To reduce the amount of data and to focus the analysis:
x All the data captured will be events at the semantic level; that is to say that the capture will be performed atthe application level (not at the window manager level); for example, it will be capture the event "ask forhelp", not the window manager event "mouse click on the button located at x=10, y=100".
x A set of appropriate capture points will be selected to allow the analysis of main user tasks.
b) To minimize the performance reduction.
x An event model at the semantic level (included in the present document) reduces, classifies and codifies theevents to be captured.
c) To facilitate the data analysis.
x An analysis tool would take advantage of the referred event model to facilitate data analysis andinterpretation.
x All the logged data won't be associated exclusively with user actions; information introduced by users, thesystem state, and written comments introduced by users during real operation, can also be logged; thisextended input-logging will allow to capture some contextual information or other data required bydevelopers.
x A written daily log of the system use (not embedded in the logging system) should complete the capture ofcontextual information (like working hours, holidays, other problems, etc.).
Event model
All the events that can be captured can be classified as:
Single event: events that occur in a short time; for evaluation purposes, a single time can be assigned to these events.
Double or continue event: actions that occur during a significant period of time for the evaluation purposes; two singletimes can be assigned to these events:
Start event: time in which the user begins to perform actions associated with the continue event.
End event: time in which the user performs the last action associated with the continue event.
Every continue event can be successful, when the user managed to reach the goal (for example, pushing an "OK"button), or unsuccessful, when the user did not manage to reach the goal (for example, pushing a "Cancel" button);although, each start event can have many different end events, we consider as continue events only those that finishsuccessfully, and furthermore we consider that only one successful end event exists for each continue event; thisdecision will focus the analysis on goals achieved, however we will be able to measure unsuccessful tasks by measuringincomplete continue events.
User information event: sometimes the information introduced by users is important to evaluate or characterize someaspect of the system use (like dates, etc.); this event is equivalent to a single event but it also includes the informationintroduced by the user.
System state event: sometimes the state of a system component is important to evaluate or characterize some aspect ofthe system use (like document size, etc.); this event is equivalent to a single event but it also includes the system state.
User comment event: a user comment about the system use, obtained in real time, can provide essential information tointerpret the data logged or to discover usability defects; this event is equivalent to a single event but it also includes awritten user comment.

ETSI
Draft ETSI EG 201 472 V1.1.1 (1999-12)29
It is important to remark that only the logging of single events and continue events is mandatory to be considered aninput-logging.
On the other hand, a specific application (embedded or called by the application), must be developed if the usercomments will be captured during real time operation.
7.7 SurveysSurvey is a research procedure more usually associated with Sociology or Political Science. However, it is also acommon technique in Marketing Research, and also in Usability Engineering, although it is not as popular as othermethods, since surveys are usually very costly, and not applicable until there is a working system, thus not being useful,in general, in previous phases of the development process.
A survey consists of delivering an instrument of data collection, usually a questionnaire, although it can also be aninterview, to a sample of the target population. Many survey designs are longitudinal, i.e., they are made along time totrack the change of opinion in the population. Other technique, developed in Marketing, is panel research. A panel is asample of the population who participates in research during a period of time. Perhaps the most famous application ofthese methods is the TV audience measurement. Panel research, however, can be very problematic, since there can bemany other factors affecting the behaviour, e.g., whether there is an economic benefit in participating in research or not.
The most important stage of any survey design is the sampling. A sample is a representative subset of the targetpopulation, and who are chosen using random procedures, trying to guarantee that all components of the population havethe same probability of coming into the sample. Thus, these procedures usually require having a census of thepopulation. Sampling procedures are quite complex, and beyond the scope of this tutorial, but the interested reader canconsult Tryfos (1996) [23], as a good introduction.
Surveys in usability engineering can be used to obtain user feedback from using the system. Requirements for asuccessful application are, then, having a working system or service, and that participants actually use the system.
Below you can find a table of advantages and disadvantages (Fife-Schaw,1995) [24]:
Advantages:
x Sampling methods, if appropriately applied, can yield very high-quality results about the attitudes and opinionsof a population.
x Easy to repeat, thus providing results along the time.
Disadvantages:
x Although it depends of how the sample is approached (e.g., it can be a panel, or it can be used a mailquestionnaire, or interviews), getting all planed people to participate in the investigation is very difficult, andusually very costly.
x Sampling is usually very complex, and there will always be groups of the population impossible to reach.
x The instrument has to be fixed for all the participants, thus usually making difficult the study of particular cases.
7.8 Questionnaires
7.8.1 What are questionnaires and when can they be used?
A questionnaire is a set of written questions requiring a written response which describes past behaviours, the userexpectations, attitudes and opinions towards the system (ETR 095 [1]).
Questionnaires, whatever its form, have the following advantages:
x They are cheap and easy to apply to large samples of users.
x Can quickly provide both quantitative and/or qualitative data.

ETSI
Draft ETSI EG 201 472 V1.1.1 (1999-12)30
But usually have these disadvantages:
x Questions are fixed: there is seldom the possibility to include new questions on request from the respondent, andthey cannot be explained in more detail in a standardized way. When questions require clarification, theevaluator should be present, and help the respondent, but in such a way that it does not make any influence onthe subject's opinion.
x The evaluator cannot always control the situation or the manner in which the questionnaire is answered.
x As with any other research technique, misrepresentativeness of the sample may produce wrong results.
In general, we can recommend using a questionnaire in usability evaluation for the following reasons:
x to assess, in a standard and formal way, subjective judgements, attitudes, opinions or feelings about the usabilityof all or part of an existing system, or a prototype or release version of a system.
x to check the acceptance of the total system, usually within the user's normal operating environment.
x Questionnaires can also be used to measure subjective responses in an experimental context.
7.8.2 Deciding the question format
The choice for a specific question format depends on the testing aims, and for the precision with which it has to bemeasured. Very important issues about the level of measurement achieved with the different formats will be consideredbelow and in the point about data analysis.
7.8.2.1 Open ended questions
These allow the respondent to write their answer in their own words and do not constrain them to choosing from a set offixed alternatives or a straight yes/no reply. They allow the user to express views which have not been considered by theinvestigator. With this format, the user can express his or her opinions with complete freedom. The usual trade-offbetween flexibility and precision makes this way of asking questions very difficult to analyze, and statistical analysis isusually very difficult (content analysis), or even not possible.
In addition it is very easy for respondents to misinterpret the question, especially if the questionnaire has beenadministered remotely. For these reasons open-ended questions are typically less reliable than closed questions and arenot recommended beyond a scoping exercise to determine response ranges or in situations when having opinions notalready covered in the other questions is critical.
7.8.2.2 Multiple choice items
With these questions, users are offered a closed set of options, and he or she has to mark (usually only one) of them.
This question format offers significant practical advantages over open-ended questions: the level of detail is determinedby the investigator; the questionnaire is usually quick to complete and quick to analyse; the limited response rangemakes quantitative coding by non-experts possible and easy.
The disadvantages largely relate to the limited response choice. Respondents may be forced to choose betweenalternatives which do not correspond to their preferred answer for the question, forced to choose a single answer whenmore than one is appropriate or forced to choose an answer when they do not have enough knowledge to make anyinformed response. The problem is particularly significant with dichotomous forced choice questions (Yes/No;True/False; Agree/Disagree etc.) where any misunderstanding of the question can change an answer from one extreme tothe other.
This type of questions should be used only when the number of possible responses is limited or when there is a fixednumber of options the researcher is interested in. Its level of measurement is nominal: this means that the experimentercan only make conclusions about the presence or absence of different responses, it is not possible to make a scale of theoptions included (but for the percentage of responses for each alternative), and the statistical procedures should be thoseappropriate for this level of measurement (see the data analysis chapter). Whenever a scale of preference (or anysubjective construct) is to be made, more adequate techniques are rating scales.

ETSI
Draft ETSI EG 201 472 V1.1.1 (1999-12)31
Caution should be taken with the "don't know" response: this can be useful in some situations, but can be an enormousproblem when many participants tend to choose this option, thus having no useful responses. Then, the usualrecommendation is to include this option only if it is especially interesting for the testing purposes.
7.8.2.3 Rating scales
Measurement of psychological constructs is usually known as scaling. Scaling, and specially judgement scaling, can bedealt with in several ways, which will determine the measurement scale and precision of the resulting scales.
Usability testing by means of rating scales may be more vulnerable to error and bias than other types of responses andtheir results can suggest a greater degree of precision than is true. Most mistakes are made in the design phase, since theanalysis phase is fairly standard. Very specific instructions must be made explicit for really being able to extract usefulconclusions.
As far as the measurement level is concerned, scales obtained can be qualitative, or nominal, where the numbers are onlycodes of some characteristics, but no other properties like order or differences are maintained; ordinal, where order ispreserved, but not differences between numbers; and interval scales, where both order and differences between numbersare preserved. This important issue distinguishes different types of rating scales we will review in more detail.
7.8.2.4 Nominal or grade scales
These scales are based on the choice of the level of the subjective attribute being measured made by the subject from alimited set of alternatives, marked with words indicating different grades of the subjective construct being measured(e.g., perceived image quality). Two main requirements have to be fulfilled when we want to use rating scales:
x The stability of the attribute to be measured. That is important since the opinion changes accordingly as aphenomenon changes.
x Divisions between the ranges of opinion. In grading scales, each grade represents a range of opinion, and theseranges can be narrow or wide in such a way that the division between them is the fact which in principle mightbe evaluated, rather than the grades themselves.
Although these scales may not be under complete control, especially due to the fact that words have different meaningacross subjects, a well-designed opinion rating experiment ensures a high degree of stability over long periods of time.
It is better to minimize verbal descriptions, leaving the observer as much freedom as possible to establish his ownstandards. The following example of quality scale (ITU-T BT500-7 standard [25]) shows the words within brackets as asuggestion rather than rigid descriptions.
A Excellent
B Good
C Fair
D Poor
E Bad
The reason of using letters instead of numbers is to avoid that observers treat the scale as one of apparent magnitude.However, the investigator can also use numbers if some explanation is given previously about how respondent shouldtreat them. Very often, respondents avoid extreme points, when their opinion is really that one.
The level of measurement is theoretically nominal, so statistical techniques to be used are restricted to those notassuming higher levels of measurement. However, some statistical techniques are known to be robust to deviations ofthis assumption, and can be used for scaling purposes.

ETSI
Draft ETSI EG 201 472 V1.1.1 (1999-12)32
7.8.2.5 Rankings
This technique involves asking respondents to rank a number of alternative items in order of importance or relevance oragainst a dimension such as 'effectiveness' or 'ease of use'.
Although the concept is readily understood and appears to give clear cut answers with little risk of misinterpretation bythe investigator there are significant drawbacks. The most important one is the level of measurement: although itemsmay be ordered there can be no assumption that the rank differences are equivalent. The ordering can only be interpretedin a relative fashion i.e. 10 items may be ranked in order of importance but they may all be thought to be trivial by therespondent. As the number of items increases the difficulty of the task increases and the reliability of the results declines.On balance, ranking is a less satisfactory technique than the use of rating scales. Additionally, statistical analysis ofordinal data is usually quite difficult, since there are very few techniques to perform it (non-parametric techniques).
7.8.2.6 Discrete numerical rating scales
Also known as Likert-type scales, numbers (1-5, 1-7, 1-9, etc.) denote the scale divisions and the intervals are assumedto represent equal intervals of magnitude of some measure. They simply propose a numerical range with anchors in theextremes, but without marking the intermediate points. Most usual ranges are 1 to 5 and 1 to 9, although this is veryarbitrary. However, it has been shown that using more numbers increases the complexity for both the researcher and therespondent, and it adds no more precision.
The most important feature of these scales is that, if some conditions are met, can be considered as interval level ofmeasurement. This means that you can make conclusions not only about the ordering, but also about the quantitativedifferences between conditions, just in the same way as with temperature. The conditions are that respondents should bevery clearly explained how to use the scale. Then, including instructions like those in the example is very important.
These scales are very widespread in many fields, are very easy to respond by subjects, can be analyzed very quickly,and, provided that you follow the recommendations to design them, provide very good results.
7.8.2.7 Comparison scales
This is a variation of numerical scales. In them, the subject has to make a comparison between two tasks or conditionsaccording to an attribute (for instance, quality). This procedure is similar to the rating method known as "pairedcomparisons" in which a number of conditions are compared in all possible combinations, but is far more economical.The following discrete numerical scale is the usual one. Note that it is centred in zero, which is the reference point.
Both the above type of scales are vulnerable to types of systematic bias. In the 'halo effect' an individual's overallresponse to a system influences their response to its individual aspects. Thus if they decide that they don't like aparticular system they will give consistently poor ratings for ease of use, help facilities, dialogue structure, commandnames etc. without considering each aspect on its own merits. Similarly, if all the rating scales are laid out with the sameorientation (i.e. the 'positive' end of the scale is always on the left or right) then the respondent may tend to move downthe page making marks in a vertical 'column'. A simple way of this problem is to randomise the direction of the scales sothat the respondent is forced to consider each scale separately.
7.8.2.8 Graphical scales (Continuous rating scales)
They consist of an unbroken line without divisions, representing points on a continuum, or with only one representingthe medium point. There also exists the possibility of including several points in the line, each point being defined by atrait label, definition or adjective. However, this is not usual, for all the problems with people's different understandingof the verbal concepts.
They are preferred to grading scales because these ones would introduce appreciable error due to the use of numbers fortheir analysis. Subjects must be trained on the used of the scale prior to the experiment. They usually express the ratingsby means of a small mark on the line in the point between the extremes which best reflects their opinion. Several studiesin the most diverse fields have found that consistency and reliability of these scales are very good, but its use willrequire that several conditions must be assured to preserve the advantages: clear instructions, previous practice withnon-experimental items, and explanation of objectives of the measurement and scale are very important to achieve theseobjectives.

ETSI
Draft ETSI EG 201 472 V1.1.1 (1999-12)33
7.8.3 Practical issues in questionnaire design
These recommendations are extracted from the ISSUE Usability Assessment Guidelines [5]:
Question wording
The wording of individual items is a critical aspect of a questionnaire's validity and reliability. They should aim for thesimplest wording possible while still conveying the intended meaning. They should not be ambiguous or require anyinferences to be made by the respondents. Care should be taken to ensure that the questions are 'neutral' i.e. that they donot imply an expected or "correct" answer. If a question depends on the respondent's memory then the time period inquestion should be clearly defined. The goals should be clarity, simplicity and intelligibility.
Question length
Lengthy questions should be avoided but where necessary it is better to try to break a long complex sentence into shortersentences. It may be possible to have an introductory sentence to set the context followed by a short sentence whichposes the question. In general aim for twenty words or less per sentence.
Leading and loaded questions
As stated above, great care should be taken to avoid leading or loaded questions. Loading can take the form ofindicating a majority response, explicitly referring to one answer rather than another or by citing a prestigious group orindividual.
Positive and Negative wording
It is recommended that questions are worded positively. They are preferred by respondents and are understood moreeasily. Double negatives should never be used, because it has been demonstrated that they introduce great confusion insubjects.
Selecting modifiers for response alternatives in rating scales
e.g. Easy/Difficult, Frequently/Infrequently, Friendly/Unfriendly
x When adjectives or adverbs need to be used to generate response alternatives, it is important that they areunderstandable and also represent equidistant points on a continuum to the respondent.
x If possible, descriptors in rating scales should reflect the question wording i.e. if the question concerns serviceusefulness then the descriptors should be "very useful, of little use" etc.
x Descriptors from different continua e.g. Difficult, Frequent should never be mixed.
x The term "average" should be avoided since it is always a relative valuation (the average performance of onegroup may well be above or below the of another).
x Alternatives should be balanced whenever possible. i.e. if the term 'easy' is used then the contrary term 'difficult'should be used. The simplest way of generating a set of balanced descriptors is to choose a term and its literalopposite (e.g. effective and ineffective), add a modifier to mark the extreme options (i.e. very effective and veryineffective) and then provide a neutral midpoint.
x If respondents are being asked to state a frequency (e.g. Frequency of system use) it is better to providequantitative examples than purely verbal labels (i.e. every day, once a week, once a month rather than'frequently', 'sometimes' or 'occasionally') since frequency phrases are interpreted with great variability.
Question sequence
Question sequence is not often a serious issue and is more often a localized problem affecting a group of questionsaddressing the same subject rather than with the order of different groups of questions each addressing separate topics.The problem arises when an initial question influences the way in which the respondent answers subsequent questionsbecause it establishes a specific, and limiting, point of view. This problem can usually be avoided by way of carefulpiloting.

ETSI
Draft ETSI EG 201 472 V1.1.1 (1999-12)34
Filter questions
This type of question may be may be placed at the beginning of a section to ensure the relevance of subsequent answers.Thus a filter question might ask the respondent to describe their experience with a particular system before askingfurther questions about problems encountered. If the individual has no relevant experience then they can be directed onto the next set of questions. If this is not done then some respondents will quite happily give answers on the basis of nodirect experience at all!
Piloting
This is best carried out by asking a typical respondent to read each question and then explain their understanding of itsmeaning, the response alternatives if appropriate, and the reasons for their answer. The respondents should beencouraged to comment on anything that appears to be unclear or surprising about the content, format or layout.
After pre-testing, each question should be reviewed. If a high proportion of answers are of the "Don't know" variety thenserious revision may be required. Any question which does not add significant information or simply duplicates theresults of another should be excluded response rates tend to decline as questionnaires get longer, so only ask thosequestions which are needed.
7.9 Interviews
7.9.1 When should interviews be used in usability evaluation?
Interviews are a very useful procedure in the user requirements phase, and in the follow-up stage. In general, they arerecommended for situations where a great flexibility is required, but not when you want to generalize to a population ofusers, since they don't allow the required formality.
Structured interviews (e.g., those following a script) are better considered. The information from these interviews shouldbe used for preparing other data capture techniques, especially for questionnaires.
Although interviews may be capable of discrimination from questionnaires in terms of their degree of formality theyshould not be considered as less important.
Instead they should be used in a manner that makes best use of their respective strengths. Rubin (1981) suggests thefollowing sequence of stages in a usability evaluation:
Preliminary interviews with a few users.Identification of salient topics andresponse ranges for questionnaires.
Stage 1Construction of questionnaire items andratings scales.Reliability and validity check via pilotstudies.
Stage 2
Administration of final questionnaireto a representative sample of users.Analysis of responses.
Stage 3 Stage 4Follow-up interviews with selectedusers to clarify responses and obtainadditional information.
Evaluation Stage
Development Stage
Figure 5: Stages in a usability evaluation (Rubin, 1988)

ETSI
Draft ETSI EG 201 472 V1.1.1 (1999-12)35
In Rubin's model, interviews are used at the beginning and end of an evaluation; initially to gather general information toform the basis for a questionnaire and after the questionnaire to clarify its results and filling gaps. However there are noabsolute rules for the use of questionnaires and interviews, as with much human factors research it depends very muchon the circumstances and the type of system being evaluated. In many respects, within the context of a usabilityevaluation, the choice between structured interviews and directly administered questionnaires is likely to be a matterdetermined by cost and convenience. The evaluator has to make a decision based on knowledge of the domain and of theadvantages and limitations of the two techniques as discussed in the following sections.
Interviews designed to elicit information are used in a variety of usability evaluation contexts, e.g.:
x as part of a user requirements analysis in a specification exercise;
x follow-up interviews after an experimental trial;
x to investigate usage problems in a newly implemented system.
The type of interviewing carried out within a usability evaluation context can be compared to the survey interviewsundertaken to investigate social attitudes or voting intentions. In these interviews the format will be highly structured,i.e. the questions will be very carefully phrased, presented in a standardized manner and an invariant order. In addition,the respondents' answers are often limited to a restricted number of alternatives since the interviewer is frequentlyseeking specific answers to well defined research questions. This approach allows the use of sophisticated statisticalanalysis and the accurate prediction of population trends and intentions without requiring highly skilled staff. Thetechnique's major limitation is its inflexibility; the investigator's conceptual framework is imposed and this may restrictimportant, but unexpected, information from being offered by the respondent.
In contrast, the style of interviewing employed in usability research is usually much less formal. The sample ofinterviewees is typically considerably smaller and more tightly defined and the interviewer is likely to require training ininterviewing techniques as well as an understanding of the domain. Whilst there is often a standard list of questions, theinterviewer may well ask supplementary questions to explore an issue, not usually a possibility with survey interviews.The interview style is intentionally conversational in order to put the interviewee at ease and encourage as muchcomment as possible (the interviewer is often as interested in the minority comment as in the majority view). Theapparent lack of formality does, however, place an extra demand on the interviewer to ensure that the necessary issuesare covered in adequate depth and the interaction does not lose its focus. This type of interview can be a highly effectiveway of establishing basic user requirements at an early point in the design cycle or exploring usability problems with anew design or prototype. The results of these exploratory interviews can then be used to inform more specific evaluationexercises (see figure above).
There are a number of limitations in the use of the interview technique for elicitation of task information. The firstproblem is that an interview relies on human memory which is frequently inaccurate. In addition memory for taskinformation is likely to become more unreliable if the person is asked to recall it away from the testing place. Finallypeople often find it difficult to describe tasks which are carried out physically or which they have carried out so often thetask has become semi-automatic, e.g. it is very difficult for an experienced driver to explain how to drive a car.
7.9.2 Guidelines for carrying out interviews
The following recommendations are standard interview guidelines (ISSUE Usability Evaluation Guidelines [5]).
Social context
x Inform the subject: Try to put the subjects at their ease and begin the interview with a brief summary of whoyou are (avoiding jargon and unnecessary technical detail), what information you are trying to collect and whatit will be used for. The better informed the subjects are the more involved they will feel and the more likely theyare to provide the co-operation required.
x Assure Confidentiality: assure the interviewees that any information volunteered will not be passed on to otherpersons. This is particularly true if the interview is to be tape-recorded. In this case, the interviewee's consentshould always be requested first. (ethical / legal implications of usability assessment)
x Be non-evaluative: assure the interviewee that it is the system's performance that is important and that you arenot particularly interested in anyone's personal performance: try and make the interviewee feel like a co-evaluator. It is helpful to assure the subjects that their contribution is important even if their comments or viewsseem trivial to them.

ETSI
Draft ETSI EG 201 472 V1.1.1 (1999-12)36
x Relative numbers: It can be helpful to organize group interviews or discussions particularly when usabilityissues/requirements are not defined. A great deal of information can be elicited and it is sometimes necessary tohave an additional note taker in attendance. If only one person is being interviewed it is better to have only oneinterviewer.
Planning
x Advance preparation: despite the apparent informality it is essential to plan interviews carefully.
x Ordering questions: Group questions according to the major issues to be investigated. The sequence of groupsshould seem logical to the interviewee and should reflect, for example, the structure of their own work.
x Time table: Determine a maximum duration for the interview (up to 1 hour) and then allocate time accordingly.Write this information on the interviewer's schedule. This will help prevent all the time being taken up on thefirst few questions.
x Form of questions: Questions should be open ended (How?, Why?, When? etc.) rather than closed (Do you?, Isit true that? Have you ever? etc.). Closed questions can be answered with a simple "Yes" or "No" which givevery little information. For example, ask "What problems do you encounter when doing ....?" rather than "Hasthe machine ever failed when you have been using it?". Questions should not indicate a preferred answer (e.g.'Some experts believe that would you agree with this?')
x Level of questions: Make sure that your questions are appropriate for the interviewee concerned. i.e. don't askoperators about scheduling policy or managers about operator job satisfaction.
x Pilot before use: An interview should be treated like any other experimental 'tool' and should be tried out beforeit is implemented for data collection purposes. This should involve collecting and analysing sample data. Thisprecaution should determine whether the questions can be fully understood, whether they are liable tomisinterpretation, and whether they will produce comprehensive answers.
Implementation
x Location: It is better to conduct the interview at the interviewees' normal workplace or desk since their 'homeground' is likely to be less threatening. However, if the content of the interview is potentially sensitive (andprivacy is necessary) or there are likely to be frequent interruptions or significant background noise, etc., then aquiet room nearby may be required.
x Manner. Try to be businesslike rather than either overly familiar or too formal. Allow the interviewees toexpress themselves without interruption but ensure that they are reminded of the question if they stray 'off thetrack'. A moderate degree of positive reinforcement, uniformly distributed, can significantly improve the amountof information volunteered by the respondents. This only requires the interviewer to appear interested, makecomments such as "good" and "fine" after the respondent's answers and smile and nod appropriately. Finally,remember to thank the interviewees. You may need to contact them again to confirm a point.
x Records: Take notes throughout and do not rely on memory. Although tape recording may seem an attractivesupport it may inhibit some interviewees, can be unreliable and require considerable transcription effortafterwards. It does however have some use as a back-up to interview notes, particularly if the interviewee speaksrapidly. It is important to gain the informed consent of the interviewees before recording them
x Remain detached: Avoid the temptation to argue or offer your own opinion. If there are apparent contradictionsin the interviewee's account do not point them out; it is better to say that you have not quite understood and askthem to clarify the issues. Try to ensure that you discriminate fact from opinion. If the subject matter isprocedural or technical it is useful to have paper and pencils available so that the interviewees can draw a sketchif they wish.
x Afterwards: Try and 'write up' the interview from the notes as quickly as possible. Make a note of any internalinconsistencies and any new issues which should be raised with subsequent interviewees. It may be appropriateto send a copy of your summary to the interviewee so that they can check it for accuracy.

ETSI
Draft ETSI EG 201 472 V1.1.1 (1999-12)37
Analysis
The analysis of qualitative data is, in contrast to the analysis of quantitative survey data, much less statistically oriented.This is not only because the size of the respondent sample is often relatively small, but also because the purpose of theexercise is not to predict the behaviour of large groups of people. Instead the information is used to extend and interpretdata collected from objective tests i.e. to suggest trends or pick out common areas. The investigator may be able to countthe number of respondents expressing particular attitudes and categorise them but often-even measures of variability willbe inappropriate. The data analysis is therefore very much content oriented and descriptive.
7.10 Performance measuresIt is possible to obtain quantitative estimates of performance, behaviour, events and phenomena through objectivemeasurements. What makes a measurement objective is the absence of interpretation in recording the data. Theinterpretation of data comes later, but it is not critical part of the measurement process itself.
The different type of performance measures which can be used are:
I) Frequency measures, for example:
x How often a particular input device was used (e.g. mouse versus cursor keys).
x How often particular function keys were used (e.g. "F6" for help or "R" for reload).
x How often certain types of tasks were carried out (e.g. number of local versus remote file transfers) orapplications used (e.g. word processor or spreadsheet).
x How often certain types or errors occurred.
2) Time measures, for example:
x The time between two or more actions (e.g. between different keystrokes).
x Total time to complete a task (e.g. to dial a set of digits or add a set of numbers)
x Time spent on supplementary tasks (e.g. using "Help").
3) Error detection measures, for example:
x Wrong keystrokes (which?).
x False or incomplete data entry.
x Use of wrong or inappropriate procedures.
4) Physiological measures, for example:
x Amplitudes and latencies of event related potential components (e.g. P300).
x Heart rate variability.
Advantages
Lack of subjectivity of observation and judgement which leads to questions of validity and reliability.
Disadvantages
They may provide information less related to global user satisfaction than subjective measures.
Certain contexts do not permit objective measurements because the task performance must be overt. Perceptual andcognitive activities must be self reported and dimensions of task and jobs, such as team co-ordination, the objectivemeasurements may be inadequate because they are not designed to measure attributes.
In the following subclauses you will find some of the most usual performance measures in usability testing:

ETSI
Draft ETSI EG 201 472 V1.1.1 (1999-12)38
7.10.1 Reaction time
Reaction time (RT) is the time between the occurrence of an event requiring an action on the part of the user and thestart of the action demanded by event. The major purpose of measuring RT is to determine how quickly the user canreact to an initiating stimulus.
Reaction time is meaningful only when there is a system or task requirement to react as quickly as possible (for examplewhen the user is prompted to notice, or correct, an error).
In general, the shortest time in which an user can respond to a single, discrete stimulus like a light is 200 to 300milliseconds, but as the stimulus becomes more complex and requires difficult cognitive processes, that minimum periodcan become longer. When the user response is covert, it may be difficult for the experimenter to know when the user hasmade his response and this time usually is the addition of several user activities (perception time, process time, decisiontime, muscular activity time, etc.)
7.10.2 Duration
Duration is the time from initiating stimulus to the time the task or function is accomplished. It therefore includes the RTmeasure and extends it. Duration is an extremely common measurement and it is important when the system prescribes amaximum duration for a task or group of task.
Ordinarily duration measurement does not have to be extremely precise. Task in a series may flow into each other andthere mat be no clearly defined start and stop points to bounds the limits of the measurement. Duration time usuallyinclude the user time and the system time.
7.10.3 Accuracy
Accuracy, or its converse, error, is probably the most common and perhaps the most useful measure of personnelperformance. There are systems and task in which RT and duration are not important, but accuracy is critical in all.
Some error will always occur because of the inherent variability of the human. In consequence, error data are usuallymeaningful only in terms of how the system is affected by error, and only in relationship to the number of opportunitiesto make the errors In the operational environment accuracy/error data are important primarily for diagnosis of problem.An excess of error may be indicative of a design problem.
7.10.4 Frequency
Frequency determine how frequently the user's responses occur or how frequently certain task are performed. frequencyis occurrence as a function of same time interval. In systems that make commercial products frequency of outputs isimportant because determines productivity, but is much less important when the system is performing a mission.
The relative frequency of certain types of error may suggest special difficulties the user has in using the system.
7.11 Thinking aloudA thinking-aloud test involves having a test subject use the system while continuously thinking out loud. (Lewis1982) [27]
Verbalizations allow the researcher to understand how users are interpreting the interface. This allows the detection ofthe main user errors and those parts in the interface that are more problematic. This method was originally applied forpsychologist researchers to obtain data about the mechanism and internal structures of the cognitive processes (Ericssonand Simon. 1980), [28].
Advantage:
It allows as the obtaining of a great mount of qualitative data with a few subjects. The information recollected from theuser is charged with personal recommendations that can be used in the design process.

ETSI
Draft ETSI EG 201 472 V1.1.1 (1999-12)39
Disadvantage:
No quantitative records are possible and only intuitive interpretations can be done.
Practical considerations
x Subjects tend to justify their errors and failures as design problems.
x Experimenter have to attend to what the evaluator are doing during the task and not attend to the rationalizationsof subjects.
x A lot of people find that thinking-aloud is a not natural and they have problems in realising the task.
x Verbalizations can interfere with cognitive processing and decrease the subject’s action.
x Verbalizations can motivate to subjects and promote the subject’s action.
x Researcher must put questions to the subjects to facilitate the verbalizations (for example, what are you thinkingnow?)
x Researcher have to be attentive to the subject’s task and ask himself if the user acts surprised after a systemaction.
x To avoid the initial surprise with the thinking-aloud task a learning trial is recommended. The user can also see avideo of others subjects doing similar tasks.
Different approaches to thinking aloud.
Constructive interaction.
It is identical to thinking aloud, but there are two subjects verbalizing simultaneously. Users must co-operate in the task.The situation is more natural, but the disadvantage is that the co-operative interaction can not be done because each userhave different strategies for learning and using computers. It is specially recommended to work with children. (O'Malleyet al. 1984) [29].
Retrospective testing.
The subject is working with the interface and his actions are recorded in video format. Later the subject views therecording and makes comments about the task. With this method is possible to get information carefully and withouttime problems. (Hewett and Scott 1987) [30].
Coaching method.
An expert user teaches to a non-expert user to use the interface. The experimenter writes what parts are having problemsand what information it is necessary to give to generate manuals on training. (Mack and Burdett 1992) [31].
7.12 Audio and video recordsAudio and video recordings are the best way to register user behaviour with a system, and are usually made inexperimental environments, e.g., in the usability laboratory, for experimental or observation purposes. Users interactingwith the system are videotaped, and their behaviour analyzed using structured observation techniques. Measurements oferrors and performance times are easily taken and can be analyzed using suitable statistical techniques. Use of theseprocedures provides a way to effectively observe, register and validate the design hypotheses.
The same principles and recommendations as in observation methods can be applied. It is important to emphasize theuse of timecodes and task start/finish time notation for later use during analysis and evaluation. This is the kind ofsimple detail that can save new researchers hours of unnecessary work.
Audio and video recording of participant's behaviour has specific ethical and legal requirements (see clause 9).

ETSI
Draft ETSI EG 201 472 V1.1.1 (1999-12)40
8 Data AnalysisOnce the usability evaluation has been carried out, the researcher has to make decisions and extract conclusions from thedata. Statistical methods are most appropriate for these purposes, and they are introduced in this chapter.
8.1 Measurement Theory and its implications for data analysisETR 095 [1] devoted a full chapter to this issue, because data analysis depends on the decisions about the measurementscale of the data gathered, and because there are many misconceptions about this particular issue. For these reasons thepresent document keeps this part, and reproduces the most up-to-date approach, obtained from the Measurement FAQ(excerpts) [55]:
What is measurement theory?
Measurement theory is a mathematical theory that is directly applicable to many problems of measurement and dataanalysis. The fundamental idea of measurement theory is that measurements are not the same as the attribute beingmeasured. Hence, if you want to draw conclusions about the attribute ,you must take into account the nature of therelationship between the attribute and the measurements.
Why should I care about measurement theory?
When we measure something, the resulting numbers are usually, to some degree, arbitrary. We choose to use a 1 to 5Likert scale instead of a –2 to 2 scale. We choose to use Fahrenheit instead of Celsius. We choose to use miles pergallon instead of gallons per mile. The conclusions of a statistical analysis should not depend on these arbitrarydecisions, because we could have made the decisions differently. We want the statistical analysis to say something aboutreality, not simply about our whims regarding meters or feet.
What is measurement?
Measurement of some attribute of a set of things is the process of assigning numbers or other symbols to the things insuch a way that properties of the numbers or symbols reflect properties of the attribute being measured. A particular wayof assigning numbers or symbols to measure something is called a scale of measurement.
What are permissible transformations?
Permissible transformations are transformations that preserve the relevant properties of the measurement process.Permissible is a technical term; use of this term does not imply that other transformations are prohibited in data analysisany more than use of the term normal implies that other distributions are pathological.
What are levels of measurement?
There are different levels of measurement that involve different properties(relations and operations) of the numbers orsymbols that constitute the measurements. Associated with each level of measurement is a set of permissibletransformations. The most commonly discussed levels of measurement are as follows:
Nominal
Two things are assigned the same symbol if they have the same value of the attribute. Permissible transformations areany one-to-one or many-to-one transformation, although a many-to-one transformation loses information.
Ordinal
Things are assigned numbers such that the order of the numbers reflects an order relation defined on the attribute. Twothings x and y with attribute values a(x) and a(y) are assigned numbers m(x) and m(y) such that if m(x) > m(y), then a(x)> a(y). Permissible transformations are any monotone increasing transformation, although a transformation that is notstrictly increasing loses information.
Interval
Things are assigned numbers such that differences between the numbers reflect differences of the attribute. If m(x) -m(y) > m(u) - m(v), then a(x) - a(y) > a(u) - a(v). Permissible transformations are any affine transformation t(m) = c * m+ d, where c and d are constants; another way of saying this is that the origin and unit of measurement are arbitrary.

ETSI
Draft ETSI EG 201 472 V1.1.1 (1999-12)41
Log-interval
Things are assigned numbers such that ratios between the numbers reflect ratios of the attribute. If m(x) / m(y) > m(u) /m(v), then a(x) / a(y) > a(u) / a(v). Permissible transformations are any power transformation t(m) = c * m ** d, where cand d are constants.
Ratio
Things are assigned numbers such that differences and ratios between the numbers reflect differences and ratios of theattribute. Permissible transformations are any linear (similarity) transformation t(m) = c * m, where c is a constant;another way of saying this is that the unit of measurement is arbitrary.
Absolute
Things are assigned numbers such that all properties of the numbers reflect analogous properties of the attribute. Theonly permissible transformation is the identity transformation.
These measurement levels form a partial order based on the sets of permissible transformations:
- Interval -/ \
Nominal -- Ordinal Ratio -- Absolute\ /Log-interval
Weaker <-----------------------------------> Stronger
In real life, a scale of measurement may not correspond precisely to any of these levels of measurement. It is common tohave scales that lie somewhere between the ordinal and interval levels in that the permissible transformations areconsidered to be smooth monotone transformations. There are more complicated types of measurement that yield morecomplicated types of scales; for example, it is common to have mixtures of nominal and ordinal information in a singlescale, such as questionnaires that have several non-response categories. Unfortunately, there are also many situationswhere the measurement process is too ill-defined for measurement theory to apply. In such cases, it may still be fruitfulto consider what arbitrary choices were made in the course of measurement, what effect these choices may have had onthe measurements, and whether some plausible class of permissible transformations can be determined
Is measurement level a fixed, immutable property of the data?
Measurement level depends on the relationship between the measurements and the attribute. Given a set of data, onecannot say what the measurement level is without knowing what attribute is being measured. It is possible that a certaindata set might be treated as measuring different attributes at different times for different purposes.
Once a set of measurements have been made on a particular scale, it is possible to transform the measurements to yield anew set of measurements at a different level. It is always possible to transform from a stronger level to a weaker level.For example, a temperature measurement in degrees Kelvin is at the ratio level. If you convert the measurements todegrees Celsius, the level is interval. If you rank the measurements, the level becomes ordinal. In some cases it ispossible to convert from a weaker scale to a stronger scale. For example, correspondence analysis can sometimesconvert nominal or ordinal measurements to an interval scale.
What does measurement level have to do with discrete vs. Continuous variables?
Measurement level has nothing to do with discrete vs. continuous variables. The same happens with objective versussubjective data. While measurements are always discrete due to finite precision, attributes can be conceptually eitherdiscrete or continuous regardless of measurement level.
Does measurement level determine what statistical methods are appropriate?
Measurement theory cannot determine some single statistical method or model as appropriate for data at a specific levelof measurement. But measurement theory does in fact prove that some statistical methods are inappropriate for certainlevels of measurement if you want to make inferences about the attribute being measured.
If one wishes to make statistical inferences regarding an attribute based on a scale of measurement, the statistical methodmust yield invariant (or equivariant) results under the permissible transformations for that scale of measurement. If thisinvariance does not hold, then the statistical inferences apply only to the measurements, not to the attribute that wasmeasured.

ETSI
Draft ETSI EG 201 472 V1.1.1 (1999-12)42
Since there has been so much confusion on this point, it must be emphasized that measurement theory does not restricttransformations in a statistical analysis to the class of permissible transformations. That is not what permissibletransformation means. The point is that statistical methods should be used that give invariant results under the class ofpermissible transformations, because those transformations do not alter the meaning of the measurements.
It is important to understand that the level of measurement of a variable does not mandate how that variable must appearin a statistical model. However, the measurement level does suggest reasonable ways to use a variable by default.
How does measurement level relate to statistical methodology?
Measurement level must be considered to avoid making meaningless statements. A typical example of a meaninglessstatement is the claim by the weatherman on the local TV station that it was twice as warm today as yesterday because itwas 40 degrees Fahrenheit today but only 20 degrees yesterday. Fahrenheit is not a ratio scale, and there is nomeaningful sense in which 40 degrees is twice as warm as 20 degrees. It would be just as meaningless to compute thegeometric mean or coefficient of variation of a set of temperatures in degrees Fahrenheit, since these statistics are notinvariant or equivariant under change of origin. There are many other statistics that can be meaningfully applied only todata at a sufficiently strong level of measurement.
The general principle is that an appropriate statistical analysis must yield invariant or equivariant results for allpermissible transformations. Obviously, one cannot actually conduct an infinite number of analyses of a real data setcorresponding to an infinite class of transformations. However, it is often straightforward to verify or falsify theinvariance mathematically. The application of this idea to summary statistics such as means and coefficients of variationis fairly widely understood. For example, a mean is equivariant under changes of origin and scale, hence it is a suitablelocation estimator for a variable measured at the interval level. The coefficient of variation is not invariant underchanges of origin, so it is not a suitable scale estimator for an interval-level variable.
What's the bottom line?
Measurement theory shows that strong assumptions are required for certain statistics to be meaningful. Measurementtheory encourages people to think about the meaning of their data. It encourages critical assessment of the assumptionsbehind the analysis. It encourages responsible real-world data analysis.
How does all this apply to usability evaluation?
Usability is a construct with no clear definition, or better, with a very complex definition, involving many variables.Until now, there is no usability scale yet. However, this does not imply that there will never be such scale. The workundertaken in other telecommunication areas has produced commonly agreed scales to rate system properties, as theMOS (Mean Opinion Score) scale in audio quality for telephone lines, and it proves that it is fairly possible.
The most usual scales in usability evaluation are interval scales (number of errors or ratings, for example). These scalesallow for comparisons on the differences between overall ratings of two systems: for instance, system A obtains 6,system B 8 and system C 12 points. We can say that the difference between A and C is three times the differencebetween A and B, but we cannot say that system C is twice as usable as system A. In most, if not all, cases, usabilitymeasurements (either objective or subjective) will be relative, allowing for comparisons between systems or services,but not absolute.
8.2 Descriptive or exploratory data analysisDescriptive statistics should be employed in the first steps of a statistical analysis to present raw data into a smallnumber of representative figures. Data sets are summarized in order to describe two important features of the datadistributions: the spread of scores and where within that range most of the data falls, e.g. the average of the scores(ISSUE Usability Evaluation Guidelines) [5]. Measures of central tendency are used to assess the 'middle' or 'average'value in a distribution and measures of dispersion in order to estimate the amount of variability contained within the dataand thus the degree to which the average is a typical value.
In nominal scale variables (e.g., forced choice questions), the description is made by means of percentages for eachalternative. In ordinal variables, the central tendency statistic is the median. With interval scale variables, the descriptiveanalysis should include measures of central tendency, as the mean, together with dispersion statistics as the standarddeviation or the variance. It is very useful to include the confidence interval for the mean (usually 95% confidencelevel), since this indicates with more precision the range of values of the variable falling in the centre of the population.Remember that statistics was made for measures with error, so it is not exact to describe a whole population with onlyone value.

ETSI
Draft ETSI EG 201 472 V1.1.1 (1999-12)43
Exploring the data is now considered a very important part of the data analysis process, because it can provide veryuseful insight about 'what went on' in the experimental or evaluation phase, before really testing your hypotheses. A noteof caution is to be given about the presence of outliers: these are extreme values and can happen because of codingerrors, mistakes, etc. They are usual, for example, in user's response times, if the user does not know what to do in aparticular situation. This situation can produce wrong overall results, especially if very few subjects participated in theexperiment. For instance, if you have 10 subjects, with a mean response time of 2 seconds. If only one subject has aresponse time of 10 seconds, your overall mean could be much higher than what is representative for the group of tenpeople. These outliers can be identified by means of statistical techniques, and if they affect the results or thecomputations, eliminated from the analysis.
Another concern in the analysis phase is that of statistical model assumptions. These can be of several types: e.g.,linearity in ANOVA or regression models, normal distribution of errors. When your data do not follow theseassumptions in an extreme way (statistical models are always tolerant for deviations), you can consider a transformationof data. A recommended text about this issue and, in general, exploratory data analysis, is Tukey (1977) [32].
8.3 Reporting trial results and statistical dataAPA Publication norms [33] are good advice about how to present the results of usability test. The usability expertsshould follow these recommendations:
1) Selecting the Method of analysis.
Authors are responsible for the statistical method selected and for all supporting data.
Access to computer analyses of data does not relieve the authors of responsibility for selecting the appropriatestatistic.
2) Selecting Effective Presentation by means of tables and figures.
The following recommendations apply to tables:
- Tables are efficient, enabling the researchers to present large amount of data in small space.
- Tables show exact numerical values.
- Tables allow comparisons.
- Authors should choose not to present too many tables: readers may lose track of the message.
- Author should reserve tables for crucial data that are directly related to content (results/most importantmessage).
- Tables presenting numbers are only efficient if data are arranged in such a way that it is possible to see meaningat a glance.
In a usability report, tables should at least display:
- Descriptive statistics: mean, median, frequency, percentage, number of data from which these statistics werecomputed.
- Where means are reported, always include associate measure of variability.
- For specialized analyses, like ANOVA tables and others, refer to APA norms [33], 3.69.
The following recommendations apply to figures:
Figures convey at a quick glance an overall pattern of results.
A well-prepared figure can also convey structural or pictorial concepts more efficiently than text.

ETSI
Draft ETSI EG 201 472 V1.1.1 (1999-12)44
A good figure:
- Arguments rather than duplicates the text.
- Conveys only essential factors.
- Omits visually distracting detail.
- Is consistent with similar figures in the same paper.
3) Reference for statistics.
- Do not give reference for statistic in common use. Do give if:
- You use a less common statistic.
- A statistic used in a controversial way.
4) Reporting Statistical Tests (Inferential).
- Include sufficient information to permit the reader to corroborate the analyses, and as a minimum:
- Obtained magnitude or value of the test.
- Degrees of freedom.
- Probability level.
- Direction of effect.
- Assume that reader has professional knowledge of statistic.
8.3.1 Plots
Even the simplest usability evaluation experiment can produce large amounts of quantitative data. When these data arepresented in their 'raw' form-as lists of errors made, for example- it can be very difficult to appreciate their meaning. Apowerful technique for organizing results into a more easily understandable form is to represent the data pictorially inthe form of a chart. Most people are familiar with the use of charts as pictorial representations of numeric information.The advantage of the chart is that it allows the investigator to see immediately both the magnitude and distribution ofscores within a set of data.
There is a considerable variety of ways to plot different data sets. In the following point you will find generalrecommendations about which ones are appropriate for different purposes:
Table 3: Types of plots and their application for presenting results
Graphical Technique Example
Bar charts and histograms
Bar charts plot the frequency orpercentage of different objects or events.These are considered to be notquantitative, but discrete events.Histograms are a variation of bar chartsused when the x axis is scaled as afunction of a continuous variable, whichcan be time or the range of values for acontinuous variable. These are useful fortesting distribution assumptions (butthere are formal statistical techniques forthis) by plotting the normal curve on it.The attached plot shows the distributionof the global evaluation for a prototype

ETSI
Draft ETSI EG 201 472 V1.1.1 (1999-12)45
system.
Stacked Bar Charts.
These are a variation of bar charts, andare useful to show the distribution(frequency) of different alternatives orvariables as a function of anothervariable (e.g., group). Care should betaken not to present too many variables,groups, or, in general, making a toocomplicated plot, since then it is lessuseful.
Box and whisker plots
These show the mean, the confidenceinterval of the mean, and maximum andminimum values of one variable inseveral groups. They are very useful fordetecting the presence of outliers.
Scatterplots
These show the joint distribution of twovariables. They are useful for finding outrelationships (linear or non-linear)between two variables (at a minimum ofinterval level of measurement).
Multiple Scatterplots
They are used to graphically show therelationship between several variables, ina matrix form. They are useful forexploratory analysis in case of trying tofind out constructs explaining severalvariables (those correlating highlybetween them can be considered toexplain the same concept).

ETSI
Draft ETSI EG 201 472 V1.1.1 (1999-12)46
Pie charts
These are very usual in normal life. Theydepict the percentage for different thingsout from the total.
Lines plots
These graphics are often used to showthe means for different conditions of anexperimental factor. Lines connecting thepoints (means) depict the results for oneexperimental factor, while x axis scalerepresents another factor. In this context,they are also called means plots.
8.4 Experimental data analysis: testing comparative hypothesesThe choice for statistical technique to test for comparative hypothesis is completely dependent on the design. However,there is a variety of techniques for similar problems. One of the choices the researcher has to make is about parametricor non-parametric tests. Parametric tests are usually preferred, since they provide more power (capability to detectdifferences), and are more accepted in the scientific areas. These tests require that several assumptions have to be metbut they are quite flexible for small deviations of the assumptions. For each techniques we will explain, we will reviewup to what extent they are applicable with different violations. However, in case of extreme violations of theassumptions, the researcher should also perform non-parametric tests, which are usually more reliable with 'messy' data,to see if the results are comparable to those obtained with parametric tests.
8.4.1 Comparing two means: Student's t-tests
This statistical procedure is only appropriate for comparing two means obtained from independent samples of apopulation (this is the case for matched pairs and independent groups designs with only two levels of the experimentalfactor). It is inappropriate in all cases for comparing more than 2 means. For instance, in an experiment with 3 levels (a,b, c) of an experimental factor, you have 3 possible comparisons: a vs. b, a vs. c and b vs. c. All statistics books advicethat performing simple t-tests to make the three comparisons can lead to mistakes. When you have more than 3 means tocompare, you should use analysis of variance procedures (ANOVA), explained below.
Student's t tests assume normal distribution of the scores. However, they are usually very robust to non-extremeviolations of this assumption. They also require homogeneity of variance (called homoscedasticity), and they are not sorobust for violations of this assumption. The approach in these cases, which are fairly common, is to reduce the degreesof freedom. These procedures are called robust, and reduce the possibility of detecting differences, but make the testmore reliable. All statistics packages computing t-tests provide facilities to compute these tests, and should be usedwhenever the researcher, after exploring data, finds that they don't have homogeneous variance.

ETSI
Draft ETSI EG 201 472 V1.1.1 (1999-12)47
Another assumption we will insist on is independence of measures: these procedures are never appropriate for testingrepeated measures, this is, when subjects experience the two experimental conditions we are making the test on. Forthese situations, see repeated measures ANOVA below.
A good reference for these procedures can be found in Hays (1988) [34] and Kirk (1982) [35].
Non-parametric alternative to Student's t tests is Wilcoxon's procedure(again, see Hays, 1988).
8.4.2 Comparing more than two means: ANOVA models
Although not generally known, analysis of variance (ANOVA) models area subclass of the more general linear modelwhich will be exposed in following point, whenever the predictor variables are qualitative (as it is usually the case forexperimental factors).
There are complete books dealing with these models, and their application in experimental design and analysis, coveringfixed effects, random effects, confounded, fractional models. For these, see Kirk (1982) [35], Maxwell et al.(1990) [36]and Montgomery (1991) [37]. We will only deal with the most simple models for the experimental designs in previouspoints: independent groups and repeated measures.
The ANOVA model is a linear model formulated in the following way:
Yij= P+Dj+Hij i=1..n subjects or observations
j=1..p levels of the experimental factor
Yij is the observation or measurement
P is the population mean, a constant in the model
Dj is the effect for each level(j) of the experimental factor
Hij ~ N IND (0,V2e) is the measurement error, one for each observation, and should be independent of each other, with 0
mean and constant variance.
The consequences of this formulation is that ANOVA is a very flexible procedure for testing comparative hypothesisdealing with multiple levels of the experimental factor. However, it is not appropriate for non-linear relationshipsbetween the factor and the measurement. In the case that the relationship is non-linear, you can perform transformationson your data to have new measurements (see Hoaglin, Mosteller and Tukey, 1991) [38].
The independence of errors assumption excludes from ANOVA models all hypotheses of variation along time, since theerror parameter must be independent of each other, which is not the case for repeated measurements in the samecondition in different moments.
Again, the assumptions of these tests is normal distribution of scores. However, it has been shown (Kirk, 1982) [35] thatANOVA is very robust against even extreme deviations of normality. However, it is very much affected by violations ofother assumption: homoscedasticity. When data show very different variances across groups or levels of theexperimental factor, you may find significant differences when they do not really exist, and viceversa. There are specifictests for this assumption, and, in any case, you have robust techniques available. These procedures reduce the likelihoodof finding significant differences, making the test less powerful to detect them, and, at the same time, more reliable.
The statistical hypothesis tested in ANOVA can be formulated in the following way:
H0: Dj=0 �j there is no significant effect for any level of the experimental factor.
H1: some Dj different from �� there is at least one significant effect in one level of the experimental factor.
The ANOVA test produces a table which shows the different computations carried out. First, two measures of variabilityare computed: the sum of squares for the effect of the experimental factor or group (SS between) and a measure of error(SS within). These measures are relative to the number of experimental conditions of groups and of observations forwhich the test is computed (degrees of freedom). Dividing SS by their degrees of freedom you will have the MeanSquare estimates (MS). The F test tells how much of the variability due to the effect of the experimental factor explainsthe total variability. This computation is compared with the F distribution with its degrees of freedom, and a probabilityof rejecting the null hypothesis is finally obtained.

ETSI
Draft ETSI EG 201 472 V1.1.1 (1999-12)48
If the probability tests of the F contrast is below 0.05, it is generally accepted that there has been a significant effect ofthe experimental factor. But take into account that this is not a rule of thumb.
Even though differences are considered significant, results of ANOVA do not indicate which particular levels of thefactor are significantly different of each other. Many researchers make simple t-tests (pairwise comparisons), which canlead to wrong conclusions. Recommended procedures for post-ANOVA pairwise comparisons are called multiplecomparisons procedures. You have a range of techniques, from Bonferroni tests, to Scheffé or Tukey tests (see Kirk,1982) [35].
8.4.3 Repeated measures ANOVA
This model is appropriate when subjects experience all the conditions in the experimental factor. The model is the sameas for independent measures ANOVA, with an added parameter:
Yij= P+Dj+Wj+Hiji=1..n subjects or observations
j=1..p levels of the experimental factor
The new parameter (Wj ) is introduced for all the effects included by using the same experimental unit (subject) for thedifferent experimental conditions.
Assumptions are the same as stated previously, but for a different conception of homoscedasticity (homogeneity ofvariance). The assumption is now called sphericity, and involves testing the variance-covariance matrix of scores. Thisis usually very difficult, so always perform robust tests, like Greenhouse-Geisser or Huyhn-Feldt degrees of freedomadjustments (see Kirk, 1982 [35] for a reference on these procedures). Most modern statistical software should providethese tests, by default or as an option.
Sum of squares computations are different. In particular, the SS error is computed in a different way. On the other hand,the interpretation of the results is exactly the same as in independent measures ANOVA.
8.5 An introduction to multivariate analysis modelsLinear multivariate models are a general class of mathematical models defined in the following way (matrix notation):
y= X EE + HH
where y is a vector of criterion variable
X is a matrix of predictor variables
EE is the vector of coefficients or weights of the model
HH is a vector of errors, which are assumed to be independent, with 0 mean and constant variance
Two things are important in this model:
x There is only one criterion, or variable being predicted (e.g., performance with the system in the workingcontext). There are multiple predictor variables (e.g., training, etc.). The criterion must be at least of intervallevel of measurement. Predictors can be either interval level, or lower (ordinal -seldom- and nominal orqualitative). In this case, it can be shown that you will have an ANOVA model.
x The most important assumption is that of the form of the relationship: this is linear. Non-linear relationships canbe estimated using other methods, known as non-linear regression. We will not deal with them here. As withANOVA, the independence of errors assumption prevents these models to be used with time-dependent data.
These techniques are widely used in all knowledge areas, especially for prediction of important real life variables, likeperformance in the work context (as opposed to the laboratory context), from other observation variables (number ofhours of training, satisfaction with new technologies, etc.).The scatterplot shown in the exploratory analysis chaptershows the results of fitting two alternative linear models to some data.

ETSI
Draft ETSI EG 201 472 V1.1.1 (1999-12)49
8.5.1 A table to choose among alternative multivariate analysis models
The main problem of these models for testing linear hypotheses come from the lack of a priori knowledge about whichvariables are better predictors. The iterative nature of the computation algorithms can make the results variabledepending on the order of introduction of each variable. There are several statistical procedures devised to solve this:stepwise regression tries to introduce the variables in the equation following iterative forward and backward rules.However, this technique is now considered to be merely exploratory, since results can also depend on computationalaspects rather than of substantive things about the predictors. Best subsets regression is a technique to find out the bestand most economical model for prediction. However, this is very computation and time-consuming, and is usually onlypossible when you have few predictor variables.
These models are called multivariate because they are devised to find out relationships between several dependentvariables. Dependent Variables (DV), also named criteria, are the variables to be explained by the model. For example,items in a questionnaire are considered as dependent variables in a factor analysis. In some models, IndependentVariables (IV) are also considered. In linear regression, for instance, IV or predictors are the variables which will formthe model to predict the criteria. In MANOVA (Multivariate Analysis Of VAriance), independent variables may alsodefine groups of subjects.
Therefore, some multivariate models probe the effect of IV on DV (Discriminant Analysis, Multivariate Regression andMANOVA). However, in other methods (Principal Components Analysis, Factor Analysis, Cluster Analysis, CanonicalCorrelation Models and Log-Linear Models) it is not possible to distinguish between different types of variables. Inthese models, all variables are considered in the same way, and the particular model will try to find out relationshipsbetween them.
The table below intends to present a summary of the different available techniques in such a way that it is easy for theusability researcher to make comparisons between them and to choose the best one for the research purposes.
Table 4: Mutivariate statistical models
Principal Components Analysis
Aim To explain the data in a more parsimonious way. To obtain a new set ofconstructs, fewer than original variables, that explains the whole set oforiginal variables.
When to use it We have a variables set and we want to explain them with fewer constructs. Inaddition, we require that the new set of constructs are uncorrelated.
Types of variables It involves multiple dependent variables at interval level of measurement and noindependent variables.
Comments The PCA makes a new variables set (named factors) from raw data. The factorshave two characteristics: they are uncorrelated and ordered as a function of thevariance explained (the first factor is the best explaining the total variance).
References Gorsuch (1983) [39], Lawley y Maxwell (1971) [40]
Factor Analysis
Aim To explain the data in a more parsimonious way. To obtain a new set ofconstructs, fewer than original variables, that explains the whole set oforiginal variables.
When to use it We have a variables set and we want to explain them with fewer constructs. Thereare several possibilities about the relationship between the constructs: they may beuncorrelated, correlated, and rotated in different ways (orthogonal and non-orthogonal).
Types of variables It involves multiple dependent variables at interval level of measurement and noindependent variables.
Comments Factor analysis has the same objectives that PCA, but it is based on a differentmodel
References Afifi and Azen (1979) [41], Harman (1967) [42]
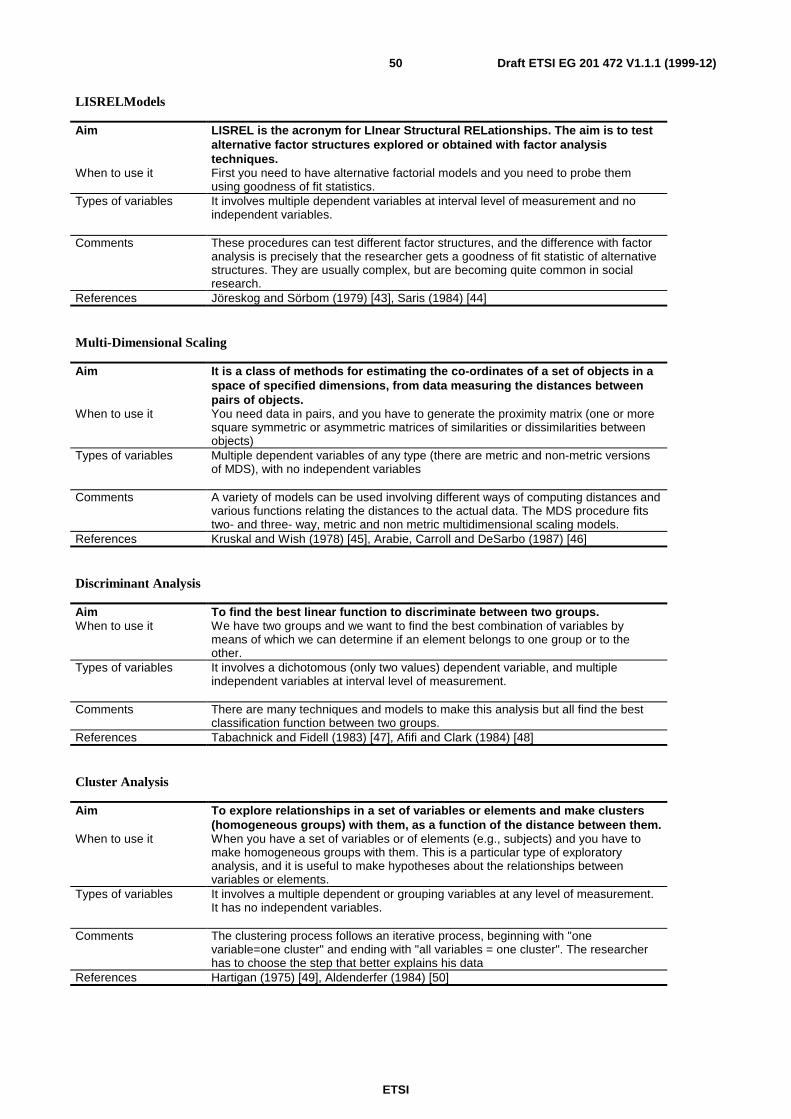
ETSI
Draft ETSI EG 201 472 V1.1.1 (1999-12)50
LISRELModels
Aim LISREL is the acronym for LInear Structural RELationships. The aim is to testalternative factor structures explored or obtained with factor analysistechniques.
When to use it First you need to have alternative factorial models and you need to probe themusing goodness of fit statistics.
Types of variables It involves multiple dependent variables at interval level of measurement and noindependent variables.
Comments These procedures can test different factor structures, and the difference with factoranalysis is precisely that the researcher gets a goodness of fit statistic of alternativestructures. They are usually complex, but are becoming quite common in socialresearch.
References Jöreskog and Sörbom (1979) [43], Saris (1984) [44]
Multi-Dimensional Scaling
Aim It is a class of methods for estimating the co-ordinates of a set of objects in aspace of specified dimensions, from data measuring the distances betweenpairs of objects.
When to use it You need data in pairs, and you have to generate the proximity matrix (one or moresquare symmetric or asymmetric matrices of similarities or dissimilarities betweenobjects)
Types of variables Multiple dependent variables of any type (there are metric and non-metric versionsof MDS), with no independent variables
Comments A variety of models can be used involving different ways of computing distances andvarious functions relating the distances to the actual data. The MDS procedure fitstwo- and three- way, metric and non metric multidimensional scaling models.
References Kruskal and Wish (1978) [45], Arabie, Carroll and DeSarbo (1987) [46]
Discriminant Analysis
Aim To find the best linear function to discriminate between two groups.When to use it We have two groups and we want to find the best combination of variables by
means of which we can determine if an element belongs to one group or to theother.
Types of variables It involves a dichotomous (only two values) dependent variable, and multipleindependent variables at interval level of measurement.
Comments There are many techniques and models to make this analysis but all find the bestclassification function between two groups.
References Tabachnick and Fidell (1983) [47], Afifi and Clark (1984) [48]
Cluster Analysis
Aim To explore relationships in a set of variables or elements and make clusters(homogeneous groups) with them, as a function of the distance between them.
When to use it When you have a set of variables or of elements (e.g., subjects) and you have tomake homogeneous groups with them. This is a particular type of exploratoryanalysis, and it is useful to make hypotheses about the relationships betweenvariables or elements.
Types of variables It involves a multiple dependent or grouping variables at any level of measurement.It has no independent variables.
Comments The clustering process follows an iterative process, beginning with "onevariable=one cluster" and ending with "all variables = one cluster". The researcherhas to choose the step that better explains his data
References Hartigan (1975) [49], Aldenderfer (1984) [50]

ETSI
Draft ETSI EG 201 472 V1.1.1 (1999-12)51
Multivariate Regression
Aim To find out a linear model to predict the value of multiple criteria (dependentvariables) by means of two or more predictors or independent variables.
When to use it When you know that a linear function is a good way to explain or predict yourcriteria, as a function of some predictors. For example, when you want to predictboth people's performance and attitudes with a system as a function of previousexperience and global ability with computers.
Types of variables It involves multiple dependent variables at interval level of measurement. It hasmultiple independent variables at interval level of measurement (predictors) or codes(grouping variables).
Comments These models are a generalization to multiple criteria of the General Linear Model,as exposed above.
References Afifi and Clark (1984) [48]
MANOVA (Multivariate ANalysis Of VAriance)
Aim To probe if the means of two (or more) DV are different between two (or more)groups.
When to use it We have two (or more) grouping variables and two (or more) DV and we want to testif the means of the groups are different.
Types of variables It involves multiple dependent variables at interval level of measurement. It hasmultiple grouping variables, and can incorporate also covariates (at interval level ofmeasurement).
Comments These models are the multivariate generalization of the traditional ANOVA models.References Davidson (1980) [51]
Log-Linear Models
Aim It uses a logarithmic-transformed model and stepwise methods to find thefunction that maximizes the expected value of a frequency table.
When to use it We have a set of categorical variables and we want find out the most economicmodel which predicts the expected values of a frequency table.
Types of variables It involves multiple nominal dependent variables and no independent variables.
Comments This model is based in a logarithmic linear model, and is equivalent to making anovawith nominal level of measurement data (e.g., frequencies or percentages of cross-classifications in a table).
References Bishop et al (1975) [52]
Logistic regression
Aim To obtain a model which best explains a dichotomous criterion (e.g., you likeor not a system) as a function of predictors.
When to use it You have a dichotomous outcome which you want to predict as a function of a set ofvariables, which can be of several types.
Types of variables Only one dichotomous dependent variable and multiple nominal (grouping) orinterval level of measurement independent variables (or predictors)
Comments They are based on maximum-likelihood estimation techniques, and stepwise model-selection procedures. This is a specialized model to deal with regression with adichotomous criterion (e.g., yes/no response).
References Hosmer and Lemeshow (1989) [53]

ETSI
Draft ETSI EG 201 472 V1.1.1 (1999-12)52
9 Ethical issues in usability testingUsability evaluation can be considered part of psychological research, since many of the constructs used in the researchare psychological concepts, and the basis for any usability evaluation is the final user. Therefore, the psychologistsethical standards clearly apply.
In this section a list of the applicable standards of good practice are provided, obtained from the two best knownPsychological Associations, the British Psychological Society (BPS) [54] and the American Psychological Association(APA). The excerpts in the present document are, forcefully, only a small part of the whole codes of conduct, which canbe freely consulted at the addresses provided in the bibliography. For the purposes of the present document, both BPSand APA Codes of Conduct apply whenever appropriate.
The main aim of the research procedures outlined in the present document is to obtain valid evidence about how usable asystem or service is. Experts and evaluators carrying out these tests shall ensure that research is carried out in keepingwith the highest standards of scientific integrity and the ethical norms, as follows:
9.1 Respect for people's rights and dignityResearchers accord appropriate respect to the fundamental rights, dignity, and worth of all people. They respect therights of individuals to privacy, confidentiality, self-determination, and autonomy, mindful that legal and otherobligations may lead to inconsistency and conflict with the exercise of these rights. Researchers are aware of cultural,individual, and role differences, including those due to age, gender, race, ethnicity, national origin, religion, sexualorientation, disability, language, and socioeconomic status. Researchers try to eliminate the effect on their work ofbiases based on those factors, and they do not knowingly participate in or condone unfair discriminatory practices.
9.2 Privacy and confidentialityIn general, and subject to the specific requirements of law, usability experts shall take care to prevent the identity ofindividuals, organizations or participants in research being revealed, deliberately or inadvertently, without theirexpressed permission.
Specifically they shall:
x endeavour to communicate information obtained through research or practice in ways which do not permit theidentification of individuals or organizations;
x take all reasonable steps to ensure that records over which they have control remain personally identifiable onlyas long as is necessary in the interests of those to whom they refer, and to render anonymous any records undertheir control that no longer need to be personally identifiable for the above purposes;
x only make audio, video, or photographic recordings of recipients of services or participants in research (with theexception of recordings of public behaviour) with the expressed agreement of those being recorded both to therecording being made and to the subsequent conditions of access to it;
x Confidential Information in Databases.
(a) If confidential information concerning participants in usability tests is to be entered into databases or systems ofrecords available to persons whose access has not been consented to by the recipient, then use coding or othertechniques to avoid the inclusion of personal identifiers.
(b) If a research protocol approved by an institutional review board or similar body requires the inclusion of personalidentifiers, such identifiers are deleted before the information is made accessible to persons other than those ofwhom the subject was advised.
(c) If such deletion is not feasible, then before the research responsibles transfer such data to others or review suchdata collected by others, they take reasonable steps to determine that appropriate consent of personallyidentifiable individuals has been obtained.

ETSI
Draft ETSI EG 201 472 V1.1.1 (1999-12)53
9.3 Informed Consent to ResearchResearchers shall normally carry out investigations only with the valid consent of participants, having taken allreasonable steps to ensure that they have adequately understood the nature of the investigation or intervention and itsanticipated consequences.
Prior to conducting research (except research involving only anonymous surveys, naturalistic observations, or similarresearch), the usability investigators enter into an agreement with participants that clarifies the nature of the research andthe responsibilities of each party.
x The researcher should use language that is reasonably understandable to research participants in obtaining theirappropriate informed consent (except as provided below, "Dispensing with Informed Consent"). Such informedconsent is appropriately documented.
x Where it is necessary not to give full information in advance to those participating in an investigation, provide suchfull information retrospectively about the aims, rationale and outcomes of the procedure as far as it is consistentwith a concern for the welfare of the participants;
x Using language that is reasonably understandable to participants, the evaluators inform participants of the nature ofthe research; they inform participants that they are free to participate or to decline to participate or to withdraw fromthe research; they explain the foreseeable consequences of declining or withdrawing; they inform participants ofsignificant factors that may be expected to influence their willingness to participate (such as risks, discomfort,adverse effects, or limitations on confidentiality, except as provided below, Deception in Research); and theyexplain other aspects about which the prospective participants inquire.
x For persons who are legally incapable of giving informed consent, the researcher nevertheless (1) provide anappropriate explanation, (2) obtain the participant's assent, and (3) obtain appropriate permission from a legallyauthorized person, if such substitute consent is permitted by law.
x Dispensing With Informed Consent.
x Before determining that planned research (such as research involving only anonymous questionnaires, naturalisticobservations, or certain kinds of archival research) does not require the informed consent of research participants,researchers consider applicable regulations and institutional review board requirements, and they consult withcolleagues as appropriate.
x Informed Consent in Research Filming or Recording.
x Researchers obtain informed consent from research participants prior to filming or recording them in any form,unless the research involves simply naturalistic observations in public places and it is not anticipated that therecording will be used in a manner that could cause personal identification or harm.
x Offering Inducements for Research Participants.
x (a) In offering professional services as an inducement to obtain research participants, researchers make clear thenature of the trials, as well as the risks, obligations, and limitations. (b) Researchers do not offer excessive orinappropriate financial or other inducements to obtain research participants, particularly when it might tend tocoerce participation.
x Deception in Research.
x (a) Usability researchers do not conduct a study involving deception unless they have determined that the use ofdeceptive techniques is justified by the study's prospective scientific, educational, or applied value and that equallyeffective alternative procedures that do not use deception are not feasible.
x (b) Researchers never deceive research participants about significant aspects that would affect their willingness toparticipate, such as physical risks, discomfort, or unpleasant emotional experiences.
x (c) Any other deception that is an integral feature of the design and conduct of an experiment must be explained toparticipants as early as is feasible, preferably at the conclusion of their participation, but no later than at theconclusion of the research.
x Providing Participants With Information About the Study.

ETSI
Draft ETSI EG 201 472 V1.1.1 (1999-12)54
x (a) Researchers provide a prompt opportunity for participants to obtain appropriate information about the nature,results, and conclusions of the research, and psychologists attempt to correct any misconceptions that participantsmay have.
x (b) If scientific or humane values justify delaying or withholding this information, the researchers take reasonablemeasures to reduce the risk of harm.

ETSI
Draft ETSI EG 201 472 V1.1.1 (1999-12)55
History
Document history
V1.1.1 December 1999 Membership Approval Procedure MV 200005: 1999-12-07 to 1999-02-04