effects of water quality, pollution and parasitism on … · fish production systems and water...
TRANSCRIPT

Fish Production Systems and Water
Quality, Pollution and Parasitic Effects on Farmed
Fish in Nyeri County, Kenya
A Proposal Submitted in Fulfillment of Requirements for
Doctor of Philosophy Degree of University of Nairobi
(Fish Science)
Investigator: Dr. Stephen Kitonga Mavuti (BVM, MSc. UoN)

Supervisors
1. Dr. Waruiru, R.M. (BVM, MSc., PhD)
2. Dr. Maina, J.G. (BSc. Agric., MSc., PhD)
3. Prof. Mbuthia, P.G. (BVM, MSc., FRCVS, PhD)
4. Prof. Mbaria, J.M. (BVM, MSc., PhD)

Introduction
• Climate and environmental changes (water unavailability
and reduced land cover) have increased food insecurity
(Gregory et al., 2005)
• In developing countries food insecurity is attributable to
growing human population, changing diets, increased
demand for meat products and competition for resources
(CARE, 2011)
• The fastest growing food production sector in the world is
aquaculture (FAO, 1999)
• Fish is a vital source of protein and other nutrients for the
ever increasing population

Introduction cont’d
• Kenya has water resources (Indian
Ocean, lakes, rivers, swamps, ponds and other wetlands)
with a high aquaculture potential for fish production
• In Kenya, Tilapia farming started in 1920s, and catfish and
others thereafter (Mbugua et al., 2008)
• The economic Stimulus Programme (ESP) has facilitated
the construction of over 46,824 fish ponds in 160
Constituencies country-wide. This program has renewed
interest in fish farming in the country
• Fish farming is practiced in Nyeri County for subsistence
and commercial purposes


0
5,000
10,000
15,000
20,000
25,000
30,000
35,000
40,000
45,000
50,000
2006
2007
2008
2009
2010
2011
2012
2013
Pro
du
ctio
n (
MT)
Kenya Aquaculture Production from 2006-2013
Year

Eat more fish campaign (8 Jan 2014, Othaya)
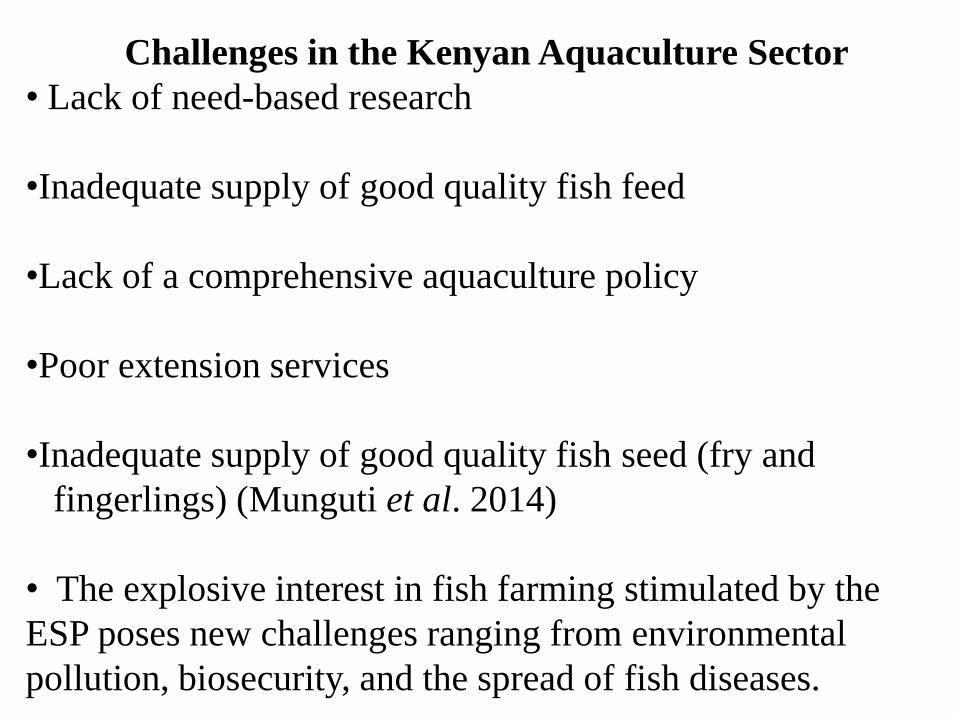
Challenges in the Kenyan Aquaculture Sector
• Lack of need-based research
•Inadequate supply of good quality fish feed
•Lack of a comprehensive aquaculture policy
•Poor extension services
•Inadequate supply of good quality fish seed (fry and
fingerlings) (Munguti et al. 2014)
• The explosive interest in fish farming stimulated by the
ESP poses new challenges ranging from environmental
pollution, biosecurity, and the spread of fish diseases.
General objective
• To characterize fish production systems and evaluate the
effects of water quality, pollution and parasitism on farmed
tilapia and catfish in Nyeri County, Kenya

Specific objectives of this study are to:
1. Characterize fish production systems in Nyeri
County, Kenya
2. Determine the physical and chemical quality of water
3. Determine the types and quantities of pollutants in water
and farmed fish (catfish and tilapia)
4. Determine the seasonal prevalence and intensity of ecto-
and endo-parasites in tilapia and catfish
5. Determine the pathology associated with water
quality, pollutants and parasites in tilapia and catfish
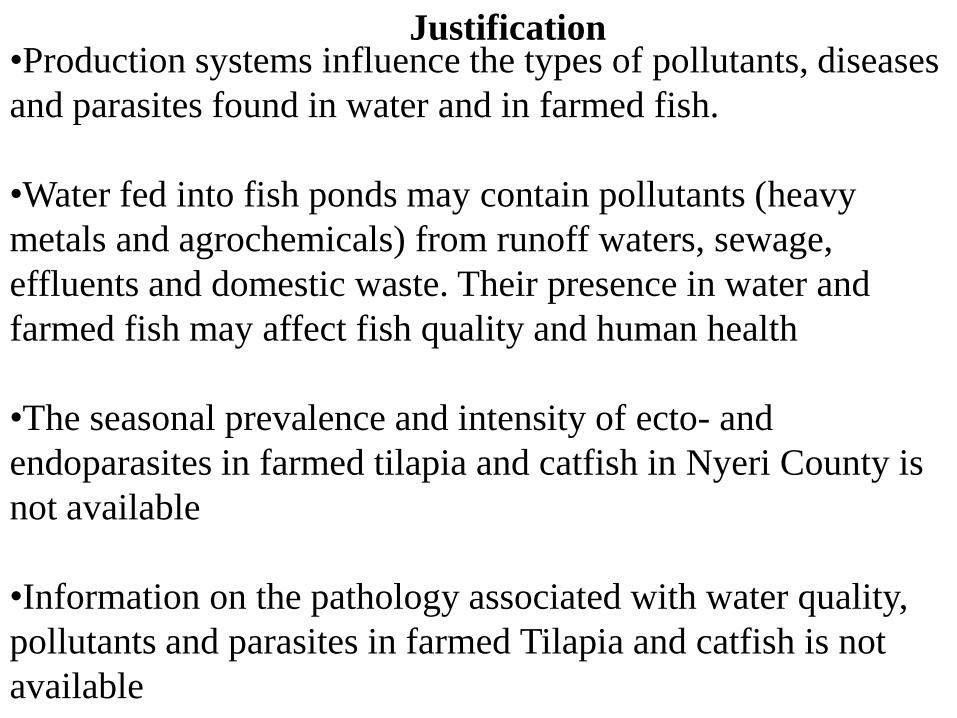
•Production systems influence the types of pollutants, diseases
and parasites found in water and in farmed fish.
•Water fed into fish ponds may contain pollutants (heavy
metals and agrochemicals) from runoff waters, sewage,
effluents and domestic waste. Their presence in water and
farmed fish may affect fish quality and human health
•The seasonal prevalence and intensity of ecto- and
endoparasites in farmed tilapia and catfish in Nyeri County is
not available
•Information on the pathology associated with water quality,
pollutants and parasites in farmed Tilapia and catfish is not
available
Justification
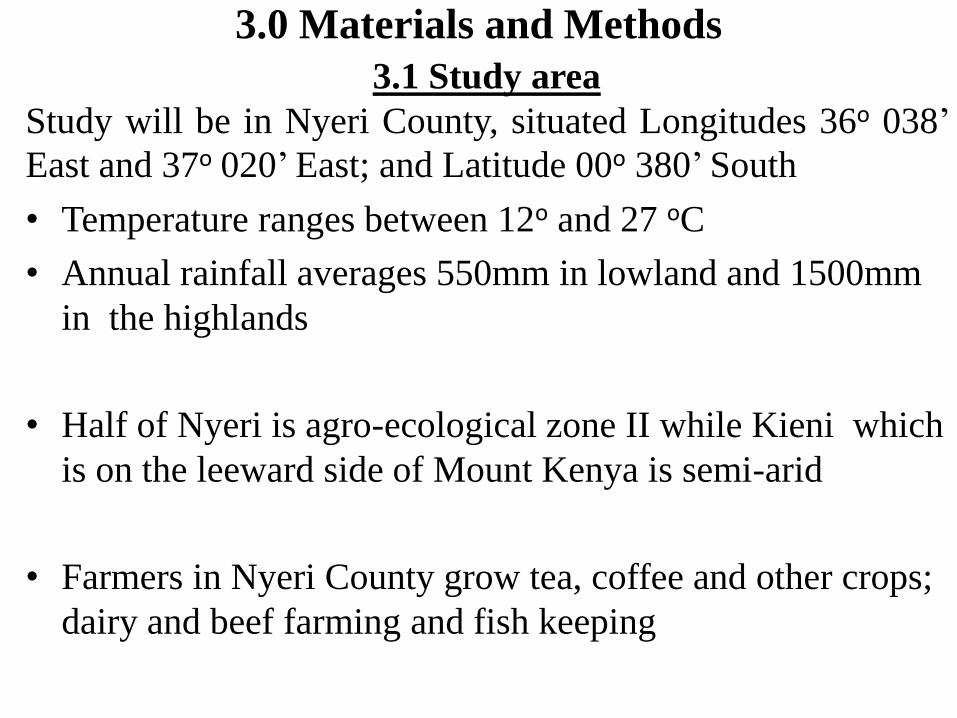
3.0 Materials and Methods
3.1 Study area
Study will be in Nyeri County, situated Longitudes 36o 038’
East and 37o 020’ East; and Latitude 00o 380’ South
• Temperature ranges between 12o and 27 oC
• Annual rainfall averages 550mm in lowland and 1500mm
in the highlands
• Half of Nyeri is agro-ecological zone II while Kieni which
is on the leeward side of Mount Kenya is semi-arid
• Farmers in Nyeri County grow tea, coffee and other crops;
dairy and beef farming and fish keeping

MATERIALS AND METHODS CONT’D
A map showing location of Nyeri County in Kenya and its Sub-counties

Materials and Methods cont’d
3.2 Characterization of fish production systems
• A questionnaire will be designed, pretested and administered to 250 randomly selected respondents in Tetuand Kieni divisions of Nyeri County. Focus group discussions will also be held with key informants.
• This questionnaire will be used to determine fish production systems, types of fish, types of pollutants, their source and effects on farmed fish

Materials and Methods cont’d
3.3 Physical and chemical analysis of water
• 146 water samples based on the formula n=Z2α pq/L2 by
Thrustfield, (1995) will be collected randomly from fish
ponds and rivers using one liter sample bottles during the
long and short rains, and the dry season
• Water samples will be transported and analyzed at Kenya
Government Chemist Laboratories.
• The water samples will be tested for physical indicators
(water temperature, conductivity, total suspended
solids, turbidity, total dissolved solids, odor, color and
feed remnants) and chemical indicators (pH, biochemical
oxygen demand, chemical oxygen demand, dissolved
oxygen and total hardness).

Materials and Methods cont’d
3.4 Analysis for presence of pollutants in fish tissues
• Fish tissue samples will be analyzed for heavy metal and pesticide residues
Heavy metal analysis • Heavy metals will be analyzed using Atomic Absorption
Spectroscopy (AAS) for Hg, Lead, Arsenic, Cadmium at Department of Geology Laboratories, Nairobi.
Pesticides analysis• Pesticide analysis will done using Gas Liquid
Chromatographic (GLC) technique for Organochlorines, organophosphates and pyrethroids at PHPT, CAVS
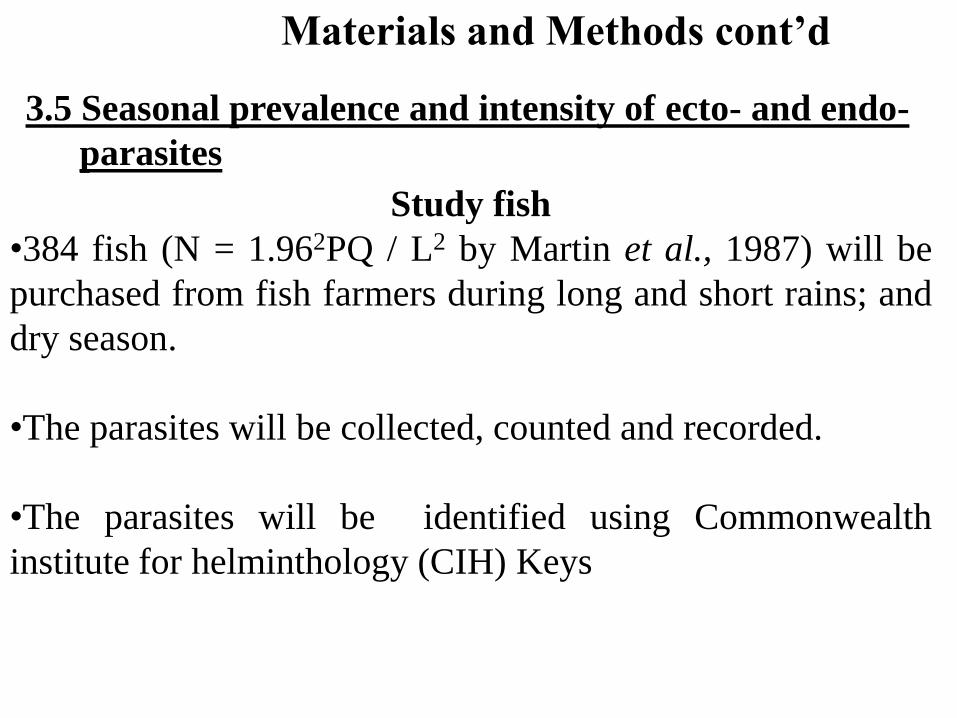
3.5 Seasonal prevalence and intensity of ecto- and endo-
parasites
Materials and Methods cont’d
Study fish
•384 fish (N = 1.962PQ / L2 by Martin et al., 1987) will be
purchased from fish farmers during long and short rains; and
dry season.
•The parasites will be collected, counted and recorded.
•The parasites will be identified using Commonwealth
institute for helminthology (CIH) Keys

Materials and Methods cont’d
3.6 Fish post mortem examination and histological
processing
•Fish post mortem examination will be done as described by
Meyers (2000). Gross lesions will be noted and recorded.
•The liver, gills, kidney, gonads, heart, spleen, gastro-
intestinal tract, muscle and the eye will be sampled for
histopathology as described by Kamundia (2011).
•Tissues for histology will be fixed in 10% neutral buffered
formalin and processed as described by Luna (1965) and
Meyers (2000).

Data presentation & analysis
• Data from the questionnaires will be entered into
Microsoft Excel. The proportions of responses will be
ranked as follows; 1%-19% - Very low, 20%-39% -
Low, 40%-59% -Average, 60%-79% - High and 61%-
100% - Very High.
• Parasite distributions will be described using prevalence
as described by Margolis et al. (1982) and Ford (1988).
• Morphometric values, gross and histological lesions’ data
will be entered into MS Excel (Microsoft 2007) and later
imported into SAS v9.2 © 2008 for descriptive statistics
and tests of association will be computed.

Month Jun Jul Aug Sep Oct Nov Dec Jan Feb Marc
h
Apri
l
Ma
y
Activity
Registration
Questionnaire
administration and
data analysis
Collection and
analysis of water
samples
Purchase of
Laboratory
materials
Purchase of fish
and postmortem
examination
Laboratory work
Data analysis
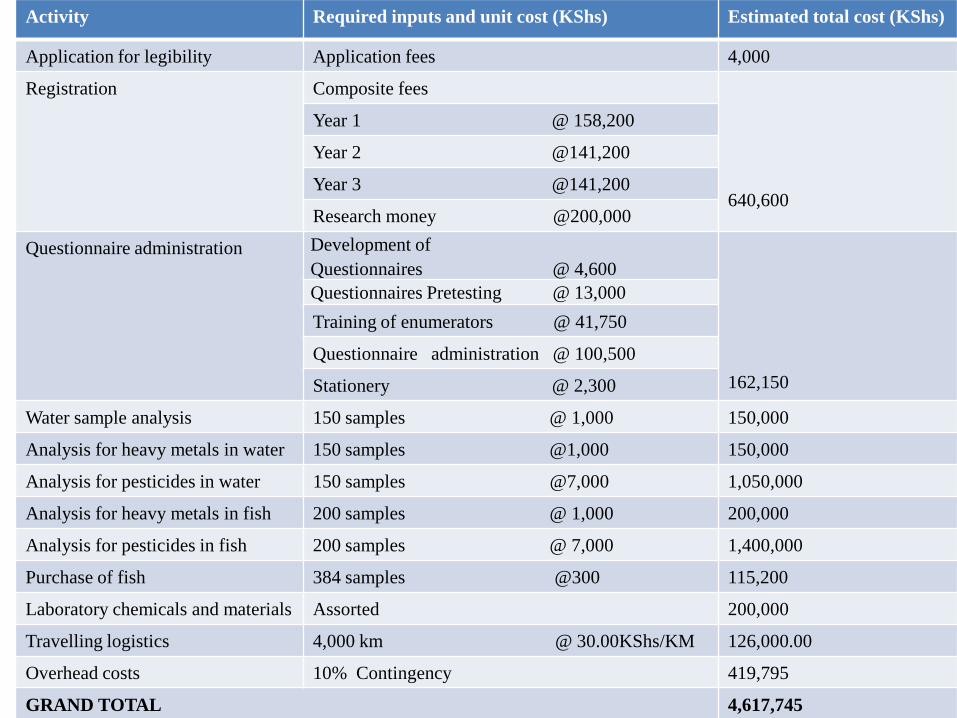
Activity Required inputs and unit cost (KShs) Estimated total cost (KShs)
Application for legibility Application fees 4,000
Registration Composite fees
640,600
Year 1 @ 158,200
Year 2 @141,200
Year 3 @141,200
Research money @200,000
Questionnaire administration Development of
Questionnaires @ 4,600
162,150
Questionnaires Pretesting @ 13,000
Training of enumerators @ 41,750
Questionnaire administration @ 100,500
Stationery @ 2,300
Water sample analysis 150 samples @ 1,000 150,000
Analysis for heavy metals in water 150 samples @1,000 150,000
Analysis for pesticides in water 150 samples @7,000 1,050,000
Analysis for heavy metals in fish 200 samples @ 1,000 200,000
Analysis for pesticides in fish 200 samples @ 7,000 1,400,000
Purchase of fish 384 samples @300 115,200
Laboratory chemicals and materials Assorted 200,000
Travelling logistics 4,000 km @ 30.00KShs/KM 126,000.00
Overhead costs 10% Contingency 419,795
GRAND TOTAL 4,617,745

THANK YOU FOR LISTENING