effects of stubble and n fertilization management on n availability and uptake under successive rice...
TRANSCRIPT

Plant and Soil 121, 11-19 (1990). © Kluwer Academic Publishers. Printed in the Netherlands. PLSO 8174
Effects of stubble and N fertilization management on N availability and uptake under successive rice (Oryza sativa L.) crops
P. E. BACON N S W Agriculture and Fisheries, Yanco Agricultural Institute, Yanco, N S W 2703, Australia. Present address." Biological and Chemical Research Institute, PMB 10, Rydalmere, N S W 2116, Australia
Received 14 March 1989. Revised July 1989
Key words: crop residues, nitrogen accumulation, nitrogen management, nitrogen mineralization, rice, soil fertility, stubble, tillage management
Abstract Experiments were conducted in fields which had a history of nil to four rice (Oryza sativa L.) crops during
the previous four summers. Incorporating stubble after each harvest reduced soil nitrate-N content between crops, but increased soil N mineralization potential. During the fourth successive crop, plots where stubble had been incorporated after the previous three harvests had an average 21% more soil NH4N and 22% more N uptake than plots where stubble had been burnt.
Soil fertility fell rapidly with increasing numbers of crops, and the unfertilized fifth crop accumulated approximately half the N (60 kg N ha -~) found in the unfertilized first crop (116 kg). Fertilizer N alleviated the effects of annual cropping; the application of 210 kg N ha ~ to the fifth crop (uptake of 156 kg N ha ~) resulted in similar N uptake to the first crop fertilized with 50 kg N ha ~ (154 kgNha ~).
Applying N at sowing had no significant effect on soil NH4-N concentration after permanent flood (PF), while N application at PF resulted in increased NH4-N concentration and N uptake until panicle initiation (PI). N applied at PI increased soil NH4-N concentration at least until the microspore stage.
Management factors such as stubble incorporation and increasing N application rate, maintained N supply and enabled successive rice crops to accumulate similar quantities of N at maturity.
Introduction
In many parts of the world, increased economic demands on farm lands have resulted in more intensive cropping. For example, in Australia annual rice cropping has largely replaced tradit- ional, extensive rotations such as 4 year pasture - - 1 year rice (Lewin and Heenan, 1987). Under the traditional rotations, organic N that accumulated during the pasture phase was mineralized during cereal growth and this mechanism provided virtu- ally all the cereals' N requirements (McDonald, 1979).
Over vigorous cereal crop growth, leading to mutual leaf shading and lodging (Murata and Mat- sushima, 1975) can be a problem under such farming systems and only small quantities of N
fertilizer are required (Heenan and Lewin, 1982). Intensified cereal cropping increases demand on soil N reserves, and increasing quantities of fer- tilizer N may be necessary to maintain productivity (McCown et al., 1988). There is an urgent need to develop fertilization management techniques which counteracts for this fall in soil fertility. Addition- ally, farmers have large quantities of crop residue (stubble) which must be managed to prevent inter- ference with sowing and growth of subsequent crops.
The studies reported below were undertaken to develop principles to facilitate high yielding annual rice cropping. This paper examines the effects of various stubble and N fertilization management strategies on soil N supply and uptake of N under increasing periods of rice cropping. The fertiliz-
i1

12 Bacon
ation and stubble management practices covered the range of options available to farmers wishing to sow rice within six months after harvest of the previous crop.
E x p e r i m e n t a l d e t a i l s
Si te conditions
Rice was established in five fields which had zero, one, two, three or four successive annual rice crops prior to the experiments. Before the experimental period all fields had a history of one cereal crop followed by at least three years of legume based pasture. The fields were located within a few hundred metres of each other at the Agricultural Institute Yanco, in south eastern Australia (Latitude 34°36'S, Longitude 146°26'E). The soil was a transitional red-brown earth (Dr 2.23, Northcote, 1979) or typic Paleustalf (Soil Survey Staff, 1975). Prior to the five experiments, the A horizon (0-10cm) had a bulk density of 1.4 and
Table 1. Experimental conditions for the annual rice cropping
contained 0.1% N, 1.2% O.C. and 20#gg -] avail- able P (Bray and Kurtz, 1945). The pH of the topsoil (0-10cm) was 4.0 (5:1 0.01 M CaC12) and contained 24, 12, 6, 0.9 and 7 m m o l k g -~ of ex- changeable Ca, Mg, K, Na and A1 respectively (extracted with 0.0125 M BaC12).
There was a marked change in both texture and colour between A and B horizons. The B horizon was a dense, impermeable medium clay with a typical saturated hydraulic conductivity of 0 . 4 m m d -~ (Van der Lelij and Talsma, 1978), making it an ideal soil for rice.
The experimental conditions are outlined in Table 1. All 5 experiments were arranged in randomised complete blocks. The first experiment involved 2 N application times: Plots received zero N or 50 kg N ha - l at either permanent flood (PF) or at panicle initiation (PI). The experiment in the second crop utilized a factorial containing 3 N application times (plus unfertilized controls), two N rates and four stubble management techniques. In the third crop the factorial array consisted of 3 N application times (plus controls), and four stubble
experiments
Rice crop number
First Second Third Fourth Fifth
Crop Management Sown Oct 12 sown Oct 29 sown Oct 7 sown Oct 26 PP Nov. 24 PF Nov 29 PF Nov 26 PF Dec 1 PI b Jan 8 PI Jan 16 PI Jan 13 PI Jan 14
Quantity of rice stubble from previous rice crop (t ha-I ) 0 14 7 7
N rate to current crop (kgha -~) 0, 50 0, 30, 60 0, 100 0, 70, 140,
210
N application time PF, Sowing, Sowing, PF, PI, PI PF, PI PF, PI Split-50%
PF + 50% PI
Stubble management Not applicable Autumn incorp. Autumn incorp. -
Spring incorp. Spring incorp. Spring incorp. Burn Burn Burn - Burn and Cult. - Retain on surface
Number of replicates 4 2 3 3
sown Oct 20 PF Nov 29 PI Jan 17
9
0, 70, 140, 210
PF, PI, Split-50% PF + 50% PI
Spring incorp.
Burn and Cult.
3
a PF = Permanent Flooding, PI = Panicle Initiation. b PI delayed by up to a week on unfertilized plots.

management techniques. In the fourth and fifth crops the factorial structure consisted of 3N application rates, 3N application times (plus controls) and 2 stubble management techniques. Nitrogen was applied as ammonium sulphate to the first two crops and as urea to the others. Earlier studies showed that these two sources produced similar plant response (Bacon, 1985).
Stubble incorporation treatments involved rotary hoeing all crop stubble into the soil within a few days of grain harvest (autumn incorporation), or rotary hoeing just prior to sowing the next rice crop (spring incorporation). Stubble was burnt in spring on another treatment (burn), while the fourth treatment consisted of burning the stubble in spring then rotary hoeing (burn then cultivate). The stubble was left undisturbed on the soil surface in the fifth treatment (stubble retained). The stubble management treatments were cumulative, for example, plots where stubble was incorporated prior to the fifth crop had stubble incorporation after the previous four crops.
All crops were drill sown into 3.5 x 11 m plots with a triple disc implement in 15 cm wide rows, then given three or four flood irrigations, with permanent flooding (PF) at the 3 leaf stage.
Seed rates and crop protection measures used were those recommended to district farmers. Soil testing indicated that N was the only fertilizer necessary. Barnyard grass (Echinochloa spp.) control was achieved with Molinate, while blood- worms (Chironomus tepperi L.) were elimiated with Trichlorfon. The N responsive cultivar, Inga, was used in all years. Sheeting was used to isolate plots where it was considered that large quantities of N applied into floodwater at PI may diffuse onto surrounding plots.
Crop and soil sampling and analysis
Crop DM and N concentration were determined seven times during the first crop, five times during the second crop, ten times during the third crop, seven times during the fourth crop and at maturity of the fifth crop. Plant samples were cut at ground level from two sites per plot. Each sample consisted of two 2-m long rows taken 45 to 90cm from the plot edge. Samples for grain and straw N content consisted of 2 x 0.9m 2 subsamples per plot. All
N availability and uptake by rice 13
samples were dried to constant mass at 70°C in a dehydrator. Plant material was ground through a 1-mm mesh and N content determined on 1 g samples using a macro Kjeldahl digestion.
Nitrate concentration in the top l0 cm of soil was measured five times between harvest of the first crop and PF of the second crop. Six cores per plot were taken from four replicate plots of each stubble management treatment. The soil was then dried at 40°C, ground, mixed and analysed for nitrate (Best, 1976).
Soil NH4-N concentration was measured on selected plots 11 times during the third crop and 7 times during the fourth crop. Sampling and analyti- cal procedures for flooded rice soil utilized the techniques of Bacon et al. (1986) adapted for reduced soils from Pym and Milham (1976).
The N mineralization potential of soil sampled just prior to PF of the third rice crop was assessed using a 2-week anaerobic incubation at 30°C based on the techniques of Waring and Bremner (1964). Soil samples (six cores per plot, 0-10cm) were taken from all plots, dried overnight at 40°C, ground finely, and then a 20g sample added to 100 mL H20. The bottles were then tightly sealed. After 2 weeks incubation, 100mL o f 4 M KC1 was added and the bottle shaken vigorously for 4 hours, filtered and analysed for NH4-N concentration (Bacon et al., 1986).
The effect of different stubble management techniques on N mineralization was estimated using changes in soil NH4-N concentration as follows:
NH4tt+l) - NH4!t) = N H 4 ( m i n e r a l i z e d ) - NH4(immobilized)
- - NU4(nitrified) - NU4(rice uptake)
where t = sample time. In these experiments, the first three terms on the right hand side were not separated so the equation becomes:
Change in NH4. to t+ 1) = N H 4 ( n e t transformations)
- - Nn4(uptake )
or
Apparent net NH4 mineralized = Change
in NH4 + N uptake.
This equation does not allow estimation of in- dividual N transformations in the soil; however, it

14 Bacon
permits comparison of the effects of management inputs within the same experiment. All five experi- ments were arranged in randomized complete blocks. Data were analysed using analysis of variance and multiple regression. Result presenta- tion is confined to main effects of stubble and N fertilizer management except where significant interactions occurred.
Results and discussion
Stubble management technique
Soil mineral-N content. Incorporating 14 t ha-i of stubble (0.4% N) in autumn following harvest of the first crop significantly reduced soil NO3-N con- centration until early in the following summer (Table 2). Plots where stubble was incorporated in autumn had a maximum of 13 kg NO3-N ha- 1 in the surface 10-cm of soil compared with up to 33 kg NO3-N ha-~ on plots where stubble was left on the soil surface. Stubble incorporation just prior to sowing of the second rice crop significantly reduced NO3-N concentration until permanent flooding (PF): Plots where stubble had been incor- porated either in autumn or spring averaged 1.6/~g g- ~ NO3-N, 0-10 cm between sowing and PF compared with 2.9/~g g ~ on burnt or stubble reten- tion plots. These results suggest that stubble incor- poration would conserve soil N by preventing accu- mulation of NO3-N in the soil between rice crops. Any NO3-N accumulated in this interval would be susceptible to denitrification during wet winters
Table 2. Effect of stubble management technique on soil NO 3-N concentration (/~g g - l, 0-100 mm). Sampling from after harvest of the first rice crop until permanent flooding of the second crop
Sampling date
Stubble management technique
Autumn Spring Retain Burn LSD incorp, incorp, on (P = 0.05)
surface
I 1 July ~ 3.7 - 7.8 - 1.78 18 September 9.6 - 22.0 - 5.57 6 November b 1.7 1.6 2.5 4.2 1.02
15 November 0.8 0.8 3.0 1.3 0.67 26 November 1.9 2.6 2.5 4.0 1.26
a Autumn incorporation occurred on 22 May. b Appropriate plots burnt, rotary hoed and sown 26-29 October. First irrigation 2 November.
(Bacon, 1987), and during the flood irrigations applied between rice sowing and PF (Bacon et al., 1986).
Stubble management technique had no sig- nificant effect on soil NH4-N concentration during the third rice crop. However, by the fourth rice crop, plots on which the stubble had been incor- porated rather than burnt after each of the previous three harvests had on average 21% higher N H : N concentration in the top 10 cm of soil (Table 3).
Soil N mineralization potential. Stubble incorpor- ation rather than burning significantly increased soil N mineralization potential. A two week anaerobic incubation of surface soil (0-10cm) collected just prior to PF from plots where stubble had been incorporated for two years resulted in 118/~g g- ~ NH 4-N being produced. This was sig-
Table 3. Effect of stubble management technique on soil NHa-N concentration (~g g ~, 0-100 mm) and N accumulation (kg N ha -~ ) during the fourth successive rice crop. Mean of all N rates and application times
Growth stage Stubble management technique Stubble management technique (sampling date) Incorp. Burn LSD Incorp. Burn LSD
(p = 0.05) (e = 0.05)
Soil NH4-N N accumulation in rice
Tillering (21 Dec) 30 27 NS a 25 13 2.5 pre PI (5 Jan) 13 10 NS a 56 39 5.2 PI (17 Jan) 11 8 1.2 59 43 5.8 Microspore (27 Jan) 22 b 18 3 76 65 6.6 Early heading (8 Feb) 17 13 3 106 91 10.8 Maturity 9 8 NS 117 108 5.7
a s ign at P = 0 .10 .
b The increase between Jan 17 and Jan 27 largely reflects the effect of topdressing on mean NH4-N concentration.
nificantly higher than that mineralized in soil taken from plots where stubble had been burnt (95 pg g- ~, LSD 5% = 10.l).
Plots on which stubble had been incorporated for three years also had higher apparent N mineralization than burnt plots. For example, between tillering (21 December) and late anthesis (29 February) of the fourth successive crop, stubble incorporation plots had an average apparent N mineralization rate of 0 .91kgha- ld -~, while stubble burn plots had an average apparent N mineralization rate of 0 .62kgNha ~d 1 (LSD 5% = 0.22). Thus several years of stubble incor- poration rather than stubble burning led to sig- nificant differences in soil N mineralization.
Rice accumulation of N. Stubble management technique had little effect on N accumulation within the second and third rice crops. However, incorporating rather than burning stubble from the previous three rice crops almost doubled N uptake during early growth during the fourth crop (Table 3) and the 12 kg N ha ] difference between stubble management systems attained during early growth was apparent throughout the season. There was more than 90% probability that stubble incorpor- ation rather than burning increased N uptake in the fifth rice crop (mean N uptake on stubble incor- poration plots = 119 kg N ha i mean N uptake on burn plots = 112 LSD 10% = 6.5).
Thus several years of stubble incorporation in- creased soil N mineralization during subsequent crops and this resulted in increased accumulation of N by rice.
N application time
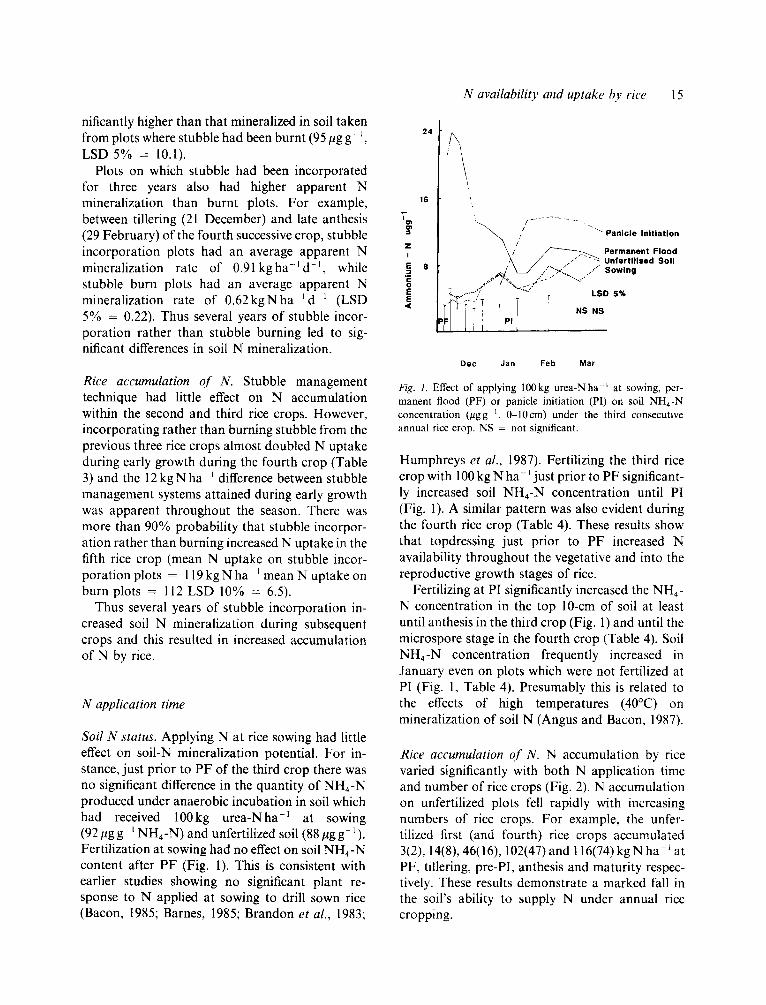
Soil N status. Applying N at rice sowing had little effect on soil-N mineralization potential. For in- stance, just prior to PF of the third crop there was no significant difference in the quantity of NH4-N produced under anaerobic incubation in soil which had received 100kg urea-Nha-l at sowing (92/~g g ~ NH4-N ) and unfertilized soil (88 ~g g- i ). Fertilization at sowing had no effect on soil NHa-N content after PF (Fig. 1). This is consistent with earlier studies showing no significant plant re- sponse to N applied at sowing to drill sown rice (Bacon, 1985; Barnes, 1985; Brandon et al., 1983;
N availability and uptake by rice 15
T
Z I E= g E E <
24
16
\
'i
//t ~'~" Panicle Initiation
\ / ~ Permanent Flood / .-" "'~ Unlertl l laed Soil
~ ~ . . ' . .............. Sowing
]Z ........... ;;" ~'="" r LSD 5%
rtTT., I .s.s
Dec Jan Feb Mar
Fig. 1. Effect of applying 100kg urea-Nha 't at sowing, per- manent flood (PF) or panicle initiation (PI) on soil NH4-N concentration (pgg ], 0-10cm) under the third consecutive annual rice crop. NS = not significant.
Humphreys et al., 1987). Fertilizing the third rice crop with 100 kg N ha- ~ just prior to PF significant- ly increased soil NH4-N concentration until PI (Fig. 1). A similar pattern was also evident during the fourth rice crop (Table 4). These results show that topdressing just prior to PF increased N availability throughout the vegetative and into the reproductive growth stages of rice.
Fertilizing at PI significantly increased the NH4- N concentration in the top 10-cm of soil at least until anthesis in the third crop (Fig. 1) and until the microspore stage in the fourth crop (Table 4). Soil NH4-N concentration frequently increased in January even on plots which were not fertilized at PI (Fig. 1, Table 4). Presumably this is related to the effects of high temperatures (40°C) on mineralization of soil N (Angus and Bacon, 1987).
Rice accumulation of N. N accumulation by rice varied significantly with both N application time and number of rice crops (Fig. 2). N accumulation on unfertilized plots fell rapidly with increasing numbers of rice crops. For example, the unfer- tilized first (and fourth) rice crops accumulated 3(2), 14(8), 46(16), 102(47) and 116(74) k g N h a L at PF, tillering, pre-PI, anthesis and maturity respec- tively. These results demonstrate a marked fall in the soil's ability to supply N under annual rice cropping.

16 Bacon
Table 4. Effect of N application time on soil NH4-N concentration ~g g-~, 0-I00 mm) during the fourth successive rice crop. Mean of stubble management techniques and N application rates (140 kg N ha-= average)
Growth stage (Sampling date)
N application time
Zero N PF Split PI LSD 50% PF, (P = 0.05) 50% PI
Tillering (21 Dec) 9.7 39.1 21,2 - 4.9 Pre PI (5 Jan) 7.6 15.4 8.5 - 3.8 PI (17 Jan) 9.6 9.4 9.1 - NS Microspore (27 Jan) 14.1 !7.7 16.8 24.4 5.5 Early Heading (8 Feb) 13.8 16.8 15.2 14.2 NS Late Anthesis (29 Feb) 8.3 9.1 9.3 8.5 NS
In general , N app l ica t ion at sowing had no sig- nificant effect on N up take and this result is consist- ent with the low N H a - N con ten t o f this soil af ter P F (Fig. 1). N app l i ca t ion jus t p r io r to P F resulted in up to four t imes the N up take o f unfert i l ized plots in the four th c rop (Fig. 2). M a x i m u m dif-
ferences in up take due to fer t i l izat ion usual ly occurred dur ing ear ly reproduc t ive deve lopment when appa ren t recoveries o f up to 43 per cent were recorded.
Crops r e sponded ext remely rap id ly to topdress- ing at PI. A p p l y i n g an average 140 kg N h a - ~ to the
160
120
80
A
r- 40
z
@
~'120 z
80
40
/ / • • o Zero N
://
3rd Crop 100 N Applied PI
/ ; ~ P F
f Zero N ~ " ~ , ~ 9 Sowing
I . I Dec Feb
Month
2nd Crop 45 N Applied
PF PI
. ~ S o w i n g ~,//,~ Zero N
~ NS LSD 5%
4th Crop PF 140 N A p p l i e d ~ S P lit PF,PI
+ ~ + PI
i Zero N
LSD 5% Dec Feb
| Fig. 2. Effect of N application time on N accumulation.(kg N ha- ) by rice at different growth stages during the first to fourth rice crops. Means of all stubble management techniques and N application rates. NS = not significant.

N availability and uptake by rice 17
Table 5. Effect of N application rate on soil NH4-N concentration (pgg ~, 0-100mm) during the fourth rice crop. Mean of stubble management techniques and N application times
Growth stage (Sampling date)
N application rate (kg N ha- i )
0 35 70 105 140 210 LSD (e = 0.05)
Till (21 Dec) 9.7 13.7 18.6 31.4 40.2 58.5 7.1 Pre-PI (5 Jan) 7.6 7.0 9.5 8.9 11.5 25.4 4.7 PI (17 Jan) 9.6 9,9 8.1 9.4 9.9 I0.3 NS Microspore (27 Jan) 14.1 - 16.4 - 21.6 24,0 a 5.5 Early Heading (8 Feb) 13.8 - 15.8 - 14.7 15.6 NS End Anthesis (29 Feb) 8.3 - 9.1 - 8.5 9.2 NS
The increased NH4-N reflects N a p p l i c a t i o n a t PI plus increased
fourth crop at PI increased accumulation rate (compared with unfertilized plots) by 2 . 4 k g N h a - ~ d I for the first 10 days after top- dressing and by 1.4 kg N ha ~d ~ over the follow- ing 12 days. These increased post-PI accumulation rates resulted in PF and PI fertilized plots often having comparable total N accumulation at matur- ity to those of the first three crops (Fig. 2). Similar results were obtained in the fifth crop, where apply- ing an average 140 kg N ha- 1 at PF or PI increased N uptake at maturity from 60 to an average of 122kgNha ~.
N application rate
Soil N status. Increasing N application rate at PF produced highly significant, linear increases in soil NH 4-N content during the vegetative phase of the fourth rice crop (Table 5). In addition there was a
Table 6, Effect of N application rate on N accumulation (kg N ha -~ ) all stubble management techniques and N application times
N mineralization due to higher temperatures.
significant N rate by time interaction at microspore stage of the fourth crop: Increasing N application at PI from 0 to 2 1 0 k g N h a ~ increased soil NH4-N from 14 to 38#gg -~ (LSD 5 % - - 9 . 6 ) at the microspore growth stage. However N application rate at PF had no significant effect on soil NH4-N concentration at this growth stage (mean 18 #g g - t). The increased NH4-N concentration after January 17 (Table 5) reflects a combination of topdressing at PI plus effects of higher temperature on soil N mineralization (Angus and Bacon, 1987).
Nitrogen uptake by rice. The quantity of N required to markedly increase rice N uptake increased with increasing numbers of rice crops. Applying 50 kg N ha-a at PF to the first crop increased N uptake just prior to PI from 46 to 6 2 k g N h a -1 (LSD 5% = 12) (Fig. 2). In the second crop apply- ing 60 k g N h a ~ at PF increased N uptake at PI from 19 to 3 2 k g N h a -~ (LSD 5% = 4), while in
at various stages during the fourth and fifth rice crops. Mean of
Growth stage (Sampling date)
N a p p l i c a t i o n r a t e (kg N ha- i )
0 35 70 105 140 210 LSD (P = 0.05)
4th Rice Crop Till (21 Dec) 9 Pre-PI (5 Jan) 16 PI (17 Jan) 19 MicrosporC (27 Jan) 31 Early Heading" (8 Feb) 47 Late Anthesis a (29 Feb) 68 Maturity 74
5th Rice Crop Maturity 60
14 22 25 40 27 41 - 53 - 71
- 8 6
- 9 2
86
25 21 26 4.6 54 61 88 9.0 52 62 107 10.0 - 81 92 8.6 - 1 0 3 1 4 0 1 4 . 0
- 1 2 2 1 3 4 1 1 . 9
- 1 1 6 1 4 3 7 .1
124 156 10.8
a Includes plots fertilized at PI.

18 Bacon
the fourth crop application of at least 140kgNha -~ just prior to PF was necessary to achieve N accumulation similar to that found under the first crop at PI.
Applying 50 kg N ha- t at PF to the first rice crop increased N uptake at maturity from 116 to 160 kg N ha- ~ (Fig. 2), giving an apparent recovery of 88%. Applying 70 kg N ha-l to plots fertilized at PF of the fourth crop increased N uptake at matur- ity from 74 to 95 kg N ha-~ giving an apparent N recovery of 28%. Thus the increased fertilizer N requirement with increasing number of consecutive rice crops apparently resulted from both reduced soil fertility--the zero N plots in the fifth crop accumulated half the N found in the unfertilized first crop plants, and from a reduction in the ap- parent N recovery.
Both the fourth and the fifth crops showed strongly linear increases (P < 0.01) in N uptake with increased N application rate. This became evident after tillering (Table 6) when the rice crop has rapidly increased demand for N (Bacon, 1985). From tillering onwards, significant increases in uptake occurred between 140 and 210 kg N ha- l, indicating that even higher quantities of N are necessary for maximum N accumulation in inten- sive rice cropping.
Relationships between soil N status and N uptake by rice
Management inputs which increased soil NH4-N content also increased rice accumulation of N. The relationship between soil NH4-N concentration during tillering and plant N accumulation by PI was constant across two experiments, each of which involved a range of stubble management techniques, N application rates and times. The relationship across these experiments was:
N uptake just prior to PI (kg N ha -~)
= 9.25 + 1.87 (soil NH4-N#gg -l)
at mid tillering, r 2 = 0.79, 64 DF.
A similar pattern was evident after PI. For example, increasing N application from 0 to
( 210 kg N ha- ~ at PI increased soil NH 4-N content at microspore stage in the fourth rice crop from 14
to 38 #g g-1 and this increased N uptake at matur- ity from 71 to 129 kg N ha-1.
The relationship in the fourth crop was:
N uptake at maturity (kgNha -~) = 60 + 1.54
(soil NH4-N at microspore stage, #gg-l).
r 2 = 0.75, 18DF.
There was a highly significant correlation between N uptake and grain production. Across all five experiments, yield increased by an average of 59.8 kg grain per kg N taken up (r 2 = 0.81).
General discussion
The effects of stubble management on N availability were evident after the first harvest and became greater with increasing number of rice crops. Stubble incorporation gradually increased soil mineralization potential and this can be ascribed to the effects of incorporation on the N cycle. Firstly stubble incorporation reduced net nitrification and the consequent potentially waste- ful accumulation of nitrate between rice crops (Bacon, 1987, Bacon et al., 1986). Secondly, incor- porating large quantities of high C :N ratio stubble could increase asymbiotic N2 fixation (Roper, 1987). Incorporating large quantities of stubble as soon as practicable after rice harvest would maximise the potential benefits of these two mechanisms. Finally, burning 8-10tha -1 of stubble containing 0.4% N each year would result in extensive loss of stubble N (Raison, 1979).
Stubble incorporation did not increase N accu- mulation until the fourth crop. However, this re- sponse was more rapid than that reported for Asian crops (Ponnamperuma, 1984), probably because the quantity of stubble and the interval between crops are less in Asia than in Australia. The N mineralization studies suggest that stubble incor- poration increases the supply of N from the soil. Incorporation may also influence the efficiency of fertilizer N use; this possibility is being inves- tigated.
N application rate and time were more import- ant than stubble management technique in deter- mining N availability and uptake. Soil N supply capacity fell rapidly with increasing numbers for

rice c rops and this c o u l d on ly be c o m p e n s a t e d fo r
by g rea t ly inc reas ing the q u a n t i t y o f fer t i l izer
app l i ed at P F o r PI. As in p r e v i o u s s tudies (Bacon ,
1985; Barnes , 1985; H u m p h r e y s et al., 1987), there
was no a d v a n t a g e in fer t i l iz ing a t sowing . T h e
s t rong ly l inear increase in N a c c u m u l a t i o n wi th
inc reas ing N a p p l i c a t i o n ra te to the f o u r t h and fif th
rice c rops suggests t ha t even m o r e t h a n
2 1 0 k g N h a ~ m a y be benef ic ia l especia l ly i f N is
app l i ed at e i ther P F o r PI.
Overa l l , the e x p e r i m e n t s s h o w the a d v a n t a g e s o f
s tubb le i n c o r p o r a t i o n and inc reased N app l i ca t i on
rates at the co r r ec t t ime u n d e r in tens ive rice c rop -
ping.
Acknowledgements
I g ra te fu l ly a c k n o w l e d g e the f inancia l s u p p o r t o f
the I r r i g a t i o n R e s e a r c h a n d E x t e n s i o n C o m m i t t e e .
I a lso t h a n k the rice r e sea rch g r o u p at Y a n c o and
G O s b o r n e , fo r the i r i nva luab l e c r i t ic i sm and assist-
ance. R S tacy a n d T W e l s h p r o v i d e d ski l led field
and l a b o r a t o r y ass is tance.
References
Angus J F and Bacon P E 1987 Simulating the nitrogen dynamics of rice crops in the Riverina. In Nitrogen Cycling in Temperate Agricultural Systems. Eds. P E Bacon, J Evans, R R Storrier and A C Taylor. Vol 2, pp442-448. Australian Society Soil Science Incorporated, Riverina Branch, Wagga, NSW.
Bacon P E 1985 The effect of nitrogen application time on Calrose rice growth and yield in south-eastern Australia. Aust. J. Exp. Agric. 25, 183-190.
Bacon P E 1987 Effect of nitrogen fertilization and rice stubble management techniques on soil moisture content, soil nitrogen status and nitrogen uptake by wheat. Field Crops Res. 17, 75-90.
Bacon P E, McGarity J W, Hoult E H and Alter D 1986 Soil mineral nitrogen concentration within cycles of flood irriga- tion: Effect of rice stubble and fertilization management. Soil Biol. Biochem. 18, 173-178.
Barnes J E 1985 The response of rice to time and rate of applica- tion of nitrogen fertilizer in the Burdekin Valley. Queensland J. Agric. Anim. Sci. 42, 71-78.
Best E K 1976 An automated method for determining nitrate nitrogen in soil extracts. Q. Dept. Prim. Ind. Div. Plant Ind. Bull. 33.
Brandon D M, Laing T R, Leonards W J Jr, Rawls S M and Simoneaux N J 1983 Timing of basal N fertilizer in relation to permanently flooding dry-seeded rice in northeast
N availability and uptake by rice 19
Louisiana. In 75th Ann. Prog. Rep., Rice Res. Stn, Crowley, Louisiana. pp 109-115.
Bray R H and Kurtz L T 1945 Determination of total organic and available forms of phosphorus in soils. Soil Sci. 59, 39-45.
Heenan D P and Lewin L G 1982 Response of Inga rice to nitrogen fertilizer rate and timing in NSW Aust. J. Exp. Agric. Anim. Husb. 22, 62-66.
Humphreys E, Muirhead W A, Melhuish F M and White R J G 1987 Effects of time of urea application on combine- sown Calrose rice in south-east Australia. I. Crop response and N uptake. Aust. J. Agric. Res. 38, 101-112.
Lewin L G and Heenan D P 1987 The agronomy of rice produc- tion in the Riverina region of south-eastern Australia. In Efficiency of Nitrogen Fertilizers for Rice. pp 69-80. Interna- tional Rice Research Institute, Los Bafios, Philippines.
McDonald D J 1979 Rice. In Australian Field Crops. Eds. J V Lovett and A Lazenby. Vol. 2, pp 70-94. Angus and Robert- son, London.
McCown R L, Cogle A L, Ockwell A P and Reeves T G 1988 Nitrogen supply to cereals in legume ley systems under pressure. In Advances in Nitrogen Cycling in Agricultural Ecosystems. Ed. J R Wilson. pp 292-314. CAB International Wallingford, UK.
Northcote K H 1979 A factual key for the recognition of Australian Soils. 2nd edition. Rellim, Glenside, South Australia.
Ponnamperuma F N 1984 Straw as source of nutrients for wetland rice. In Organic Matter and Rice. pp117-136. International Rice Research Institute, Los Bafios, Philip- pines.
Pym R V E and Milham P 1976 Selectivity of reaction among chlorine, ammonia and salicylate for determination of ammonia. Anal. Chem. 48, 1413-1415.
Raison R J 1979 Modification of the soil environment by vegetation fires, with particular reference to nitrogen trans- formations: A review. Plant and Soil 51, 73-108.
Roper M M 1987 N 2 fixation in soil by free-living bacteria utilizing straw as a source of energy. In Nitrogen Cycling in Temperate Agricultural Systems. Eds. P E Bacon, J Evans,
R R Storrier and A C Taylor. Vol. 1, pp 143-147. Australian Society of Soil Science Incorporated, Riverina Branch, Wagga, NSW.
Russell J S 1987 Concepts of nitrogen cycling in Agricultural Systems in Australia. In Nitrogen Cycling in Temperate Agricultural Systems. Eds. P E Bacon, J Evans, R R Storrier and A C Taylor. Vol. 1, pp 1-13. Australian Society of Soil Science Incorporated, Riverina Branch, Wagga, NSW.
Soil Survey Staff 1975 Soil Taxonomy. Agricultural Handbook No. 436, USDA. US Government Printing Office, Washington, DC.
Van der Lelij A A and Talsma T 1978 Infiltration and water movement in Riverine plain soils used for rice growing. In The Hydrogeology of the Riverine Plain of South East Australia. Eds. R R Storrier and I D Kelly. pp 89-98. Australian Society of Soil Science Incorporated, Riverina Branch, Griffith, NSW.
Waring S A and Bremner J M 1964 Ammonium production in soil under waterlogged conditions as an index of nitrogen availability. Nature London, 201,951-952.