effects of spatial variability ... · the nugget effect (co), the range (ao) and the threshold (co...
TRANSCRIPT

221
Comunicata Scientiae 8(2): 221-229, 2017
e-ISSN: 2177-5133www.comunicatascientiae.com
DOI: 10.14295/CS.v8i2.1030
Received: 21 October 2015Accepted: 07 April 2016
Effects of spatial variability on soil physical attributes in areas cultivated with cassava
prepared with different tillage systems
Edney Leandro da Vitória1*, Adriano Alves Fernandes1
1Universidade Federal do Espírito Santo - Campus São Mateus, ES, Brazil. *Corresponding author, e-mail: edney.vitoria@ufes,br
Article
Abstract
The objective of this study was to understand the effect of the spatial variability of the soil physical attributes in areas cultivated with cassava with different soil tillage systems, using the techniques of classical statistics and geostatistics. The experiment was carried in 2013 in São Mateus - ES, Brazil, on a cohesive ultisol, with a plan relief. The preparation of the soil for transplanting were made in two adjacent areas of approximately 0.5 ha each, using up to two passes of a harrow disk or two passes of a chisel plow. The following soil physical attributes were studied 90 days after transplanting: soil density (DS), macroporosity (Macro) and microporosity (Micro), soil water content according to two preparations systems and two depth ranges. Eighty plants were randomly selected to perform the experiment. The soil physical properties resulted in spatial variability due to the strong dependence for all variables, tillage system and soil depth. The semivariograms were adjusted to the spherical and exponential models for the evaluated physical attributes. Except for water content, it was observed an increase in the range (A0) with increasing depth for both tillage systems. The soil water content presented a decrease about 23% for the harrowing and scarification systems.
Keywords: geostatistics, Manihot esculenta Crantz, tillage systems, soil physical properties
Introduction Cassava is one of the main energy foods,
being a daily component of the diet of about 1 billion people in 105 countries, especially in developing countries. It is the third source of calories, after rice and corn (Gabriel Filho et al., 2000).
In general, the crop is better adapted in sandy soils or of medium texture, where it favors the production of uniform roots with good structure, which facilitates the harvesting. However, clay soils should be used with restrictions, as they can decrease growth, cause rotting and difficult the harvest. However, these soils may be an alternative to planting due to the new agricultural
geography (Leite e Menezes, 2013). It is important to observe the soil in depth, since the presence of a clayey or compacted layer immediately below the arable layer may limit root growth, as well as impair soil drainage and aeration (Gabriel Filho et al., 2000). Thus, it is important to consider soil attributes and their preparation for planting, since they are directly related to the cassava roots good development.
The soil physical attributes can change according to the agricultural use (Silva et al., 2013), compromising the vegetative development, influencing the plant development (Martelleto et al. 2008).
Different studies observed that the soil

222
Plant Production and Crop Protection
Com. Sci., Bom Jesus, v.8, n.2, p.221-229, Abr./Jun. 2017
density, soil resistance to penetration and soil water content did not occur randomly, but did present spatial correlation or spatial dependence (Roque et al., 2008; Cavalcante et al., 2011). For different soil water content conditions, different behavior of the spatial variability of soil resistance to penetration were observed by Bottega et al. (2011).
Geostatistics using modeling allows the quantitative description of the spatial variability of soil attributes and the non-biased estimation and with minimum variance of values of the attributes in non-sampled areas (Silva et al., 2010), geostatistics through modeling allows quantitative description of the spatial variability of soil attributes. Thus, geostatistics is an efficient support tool to able decisions regarding soil, water and crop management. Therefore, geostatistical analysis may indicate management alternatives, not only to reduce the effects of soil variability on crop production, but also to increase the possibility of estimating crop responses to specific management practices.
In this context, the aim of this research was to study the spatial variability of soil physical attributes in areas cultivated with cassava under different soil management systems, using the techniques of classical statistics and geostatistics.
Material e MétodosThe study was carried out in 2013, in
an area dedicated to the planting of cassava, located in the municipality of São Mateus-ES, Brazil, latitude 19º23'28"S, longitude 40º04'20" W at 60 m of altitude in a yellow cohesive argisol, flat relief, cultivated for five years with sugar cane and never fertilized. The climate of the region is of type Aw according to Köppen classification, with an average annual temperature of 24ºC and average annual precipitation of 1,100 mm.
As part of the characterization of the experimental area, the soil density, macroporosity, microporosity, soil resistance to penetration and soil water content were determined, as well as the textural analysis in depth ranges of 0.00 to 0.20 m and 0.20 to 0.40 m at 20 randomly selected points within the experimental area, prior to the experiment installation.
Soil preparation for transplanting was
done in two adjacent plots of approximately 0.5 ha each. In one of the plots, the soil was prepared with two passes of an off set grinder type, Brand Baldan, GTCR model, with width of 2,390 mm, 14 cutted discs and 32" of diameter. In the other area, the soil was prepared with two passes of a scarifier, Baldan, model AETH 7/5, with five stems with parabolic tip, in the width of 1,525 mm. The implements were driven by a John Deere 6125E tire tractor, nominal power of 125 hp (91.9 kW), John Deere Power tech 4045 H engine and independent electro-electronic power take-off, wheelbase of 2,400 mm and boarding weight of 4,420 kg.
The cassava transplanting was done in the single row system, spaced 1.0 x 1.0 m. The irrigation was done with fixed low pressure spray system, with emitters working with a pressure of approximately 200 kPa and flow of approximately 1.8 m³ h-1. Weed control between the lines was done with leveling grid.
The determination of soil physical attributes was performed 50 days after transplanting. A total of 80 plants were randomly selected to form the experiment. Trenches were opened at 0.30 m between lines, alongside each selected plant, where soil samples were collected in the depth ranges of 0.00 to 0.20 m and 0.20 to 0.40m. The soil physical attributes were: doil density (DS), macroporosity (MACRO), microporosity (MICRO) and soil water content.
Data were submitted to the exploratory analysis, from which the mean and median were obtained as measures of central tendency, variance (s²), standard deviation (s) and coefficient of variation (CV) as dispersion measures. The asymmetry and kurtosis coefficients were also determined to verify the position of the data in relation to the normal distribution. The outliers were identified, replacing their values by the mean values of the surrounding ones. To test the normality or lognormality hypothesis, the Kolmogorov-smirnov test was performed, at 5% of probability. The R software version 3.0.2 (R 2013) was used for the data exploratory analysis.
The spatial dependence structure was evaluated by geostatistics, calculating the experimental semivariogram (Equation 1):

223
Vitória et al. (2017) / Effects of spatial variability on soil physical ...
Com. Sci., Bom Jesus, v.8, n.2, p.221-229, Abr./Jun. 2017
In which:γ*(h) = experimental semivariance obtained by the sampled values;h = distance between the sampling points;N (h) is the number of pairs of measured values Z1(si), Z1(si+h) and Z2(si), Z2(si+h) for variables Z1 and Z2 separated by a sample distance, vector h (Walter et al., 2002).
The semivariograms adjustments were obtained by the initial selection of: lower sum of the deviations squares (SQD); higher coefficient of determination (R2); and higher evaluator of the spatial dependence. The final decision of the model that represented the adjustment was made by cross validation, as well as for the definition of the size of the neighborhood that provided the best kriging. For each attribute, the nugget effect (Co), the range (Ao) and the threshold (Co + C) were related. The spatial dependence evaluator (ADE) analysis was performed according to the following expression:
1000
×+
=CC
CADE
In which:ADE = spatial dependence estimator;
[ ]∑=
+−=)(
1
22
1 )()()()(*hN
iii hsZsZhNhγ (1)
C = structural variance;C + C0 = threshold.
The interpretation proposed for the ADE was as follows: ADE ≤ 25% indicates that the spatial variable is weakly dependent; 25% ≤ ADE ≤ 75% indicates that the spatial variable is moderately dependent; and ADE > 75% indicates that the spatial variable is strongly dependent.
Results and DiscussionThe fractions of sand, silt and clay,
obtained by the granulometry of the experimental soil are presented in Table 1. The soils with this texture are typical of coastal tableland soils observed in the Espírito Santo State and similar values were observed by Zuffo et al. (2013) in a preliminary evaluation of the soil texture located in an area of the municipality of Boa Esperança, North region of the State. The soil was classified as sandy texture.
Table 2 presents the mean physical soil properties in the experimental área with two depth ranges. The highest average values of soil density, soil resistance to penetration and water content were not observed in the depth of 0.20 to 0.40 m. Souza (2013) observed similar results when studying the soil physical-hydric attributes in the municipality of São Mateus, Espírito Santo State, Brazil, in soil with the same characteristics of this study.
Table 2. Mean ± standard error for soil density (g cm-3), macroporosity (m3 m-3), microposrosity (m3 m-3), soil resistance to penetration (MPa) and soil water content (kg kg-1) for the studied depths before the soil preparation.
AttributeDepth range
0.00 to 0.20 m 0.20 to 0.40 mSoil density 1.53 ± 0.05 1.63 ± 0.04
Macroporosity 0.19 ± 0.02 0.13 ± 0.02Microporosity 0.20 ± 0.02 0.22 ± 0.01
Resistance to penetration 2.46 ± 1.89 5.11 ± 1.55Soil water content 6.62 ± 0.23 7.33 ± 0.55
Table 1. Analysis of the soil texture in the studied depths before the soil preparation.
Fraction UnityDepth
0.00 to 0.20 m 0.20 to 0.40 mCoarse sand kg kg-1 0.570 0.440
Fine sand kg kg-1 0.150 0.200Total Sand kg kg-1 0.720 0.640
Silt kg kg-1 0.140 0.120Clay kg kg-1 0.140 0.240

224
Plant Production and Crop Protection
Com. Sci., Bom Jesus, v.8, n.2, p.221-229, Abr./Jun. 2017
Table 3 presents the data related to the descriptive analysis of the soil physical attributes. The mean and median values are similar for all variables, related to soil preparation and in the
depth ranges of 0.00 to 0.20 m and 0.20 to 0.40 m, indicating the symmetrical distribution of the data and normality according to the Kolmogorov-smirnov test, at 5% of significance.
Table 3. Descriptive statistics of soil density (g cm-3), soil water content (kg kg-1), macroporosity (m3 m-3), microporosity (m3 m-3) and macro- and microporosity at the depths 0.00 to 0.20 m and 0.20 to 0.40 m in the two studied tillage systems.
Harrowing (0.00 to 0.20 m)Variable Mean Median s2 S CV Cs Ck D
DS 1.28 1.29 0.004 0.07 5.1 0.10 0.51 0.061ns
Θ 12.86 12.84 0.097 0.31 2.4 0.29 0.55 0.101ns
Macro 0.321 0.322 0.007 0.09 26.5 0.09 -0.55 0.080 ns
Micro 0.151 0.164 0.001 0.04 24.8 -0.18 0.03 0.044*Harrowing (0.20 to 0.40 m)
DS 1.55 1.54 0.002 0.04 2.6 0.02 0.29 0.072ns
Θ 12.41 12.33 0.098 0.31 2.5 0.22 0.06 0.081ns
Macro 0.151 0.162 0.002 0.05 32.2 -0.43 0.22 0.082 ns
Micro 0.213 0.200 0.004 0.07 31.3 -0.24 -0.03 0.024*Scarification (0.00 to 0.20 m)
DS 1.35 1.34 0.003 0.05 3.9 0.61 0.06 0.087 ns
Θ 12.71 12.62 0.558 0.75 5.9 -0.20 0.13 0.039*Macro 0.302 0.313 0.008 0.09 31.1 -0.52 0.50 0.054 ns
Micro 0.144 0.135 0.002 0.04 30.4 -0.26 -.014 0.040*Scarification (0.20 to 0.40 m)
DS 1.43 1.42 0.003 0.06 4.2 0.11 -0.26 0.087 ns
Θ 13.47 13.46 0.204 0.45 3.4 0.07 -0.36 0.069ns
Macro 0214 0.213 0.006 0.08 37.2 0.06 -0.09 0.054 ns
Micro 0.170 0.169 0.003 0.06 32.4 0.14 -0.22 0.040*s2 = variance; s = standard deviation; Cs = assimetry coefficient; Ck = curtose coefficient; d = level of significance according to the Kolmogorov-smirnov test. Ds = soil density; θ = soil water content; Macro = macroporosity; Micro = microporosity.
Analyzing Table 3, it is verified that the asymmetry and kurtosis coefficients for most attributes are close to zero, which means that they are compatible with the normal distribution. However, attributes such as microporosity, in both depth and soil preparation form, and soil water content in soil with scarification and at the depth of 0.00 to 0.20 m did not presented normal distribution. This fact may be related to the determination process in the laboratory, or the variability of the attributes in field conditions. According to Silva et al. (2012), these results are related to soils of coastal tablelands.
Soil density and soil water content resulted in the lowest CV values, being considered low (CV <6%). In the harrowing operation and depth range of 0.00 to 0.20m, the lowest CV value was observed for soil water content, 2.4%. Macroporosity and microporosity presented a CV value between 24.8 and 37.2%, classified as moderate (12% to 60%). The highest CV (37.2%) value was observed for macroporosity in the scarification and depth range of 0.20 a 0.40 m. Tavares et al. (2012) studied the spatial relation of
physical and mechanical attributes of a cohesive argisol, observing a similar behavior for the coefficient of variation for the studied variables. Although the observed CV values for macro and microporosity are moderate, this is not a good indicator of the spatial variability of soil attributes, since in field conditions high or low values may occur in the field (Sanchez et al., 2009). Zucoloto et al. (2011) studied the spatial variability of soil physical attributes and productivity in an orange orchard in a yellow dystrophic latosol and concluded that the coefficients of variation for total porosity and soil density presented low variability. Therefore, the use of CV should not be generalized and is important to evaluate these results according to each study purposes.
The geostatistical analysis performed in the data, through semi-graphs, showed (Table 4) that the physical attributes of the studied soil presented spatial dependence, since it did not presented pure nugget effect, fact that could determine a random distribution of the data. It is observed that the semivariograms were adjusted to the spherical and exponential model for the
225
Vitória et al. (2017) / Effects of spatial variability on soil physical ...
Com. Sci., Bom Jesus, v.8, n.2, p.221-229, Abr./Jun. 2017
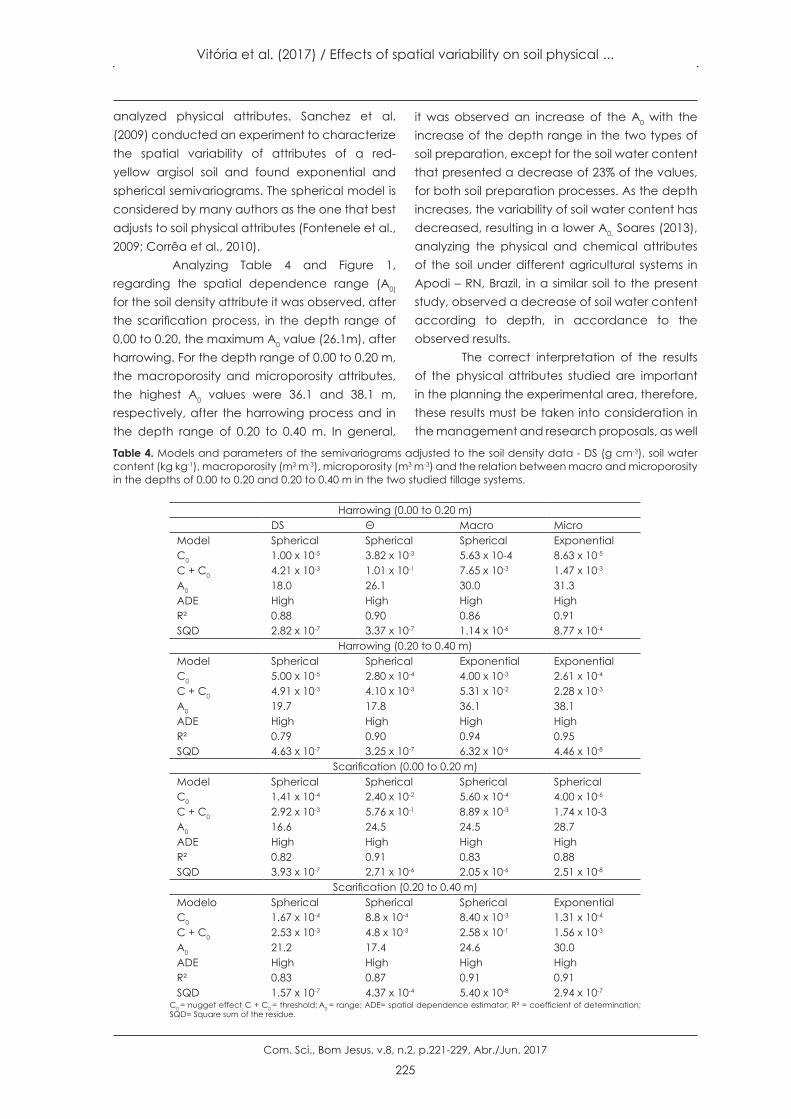
Table 4. Models and parameters of the semivariograms adjusted to the soil density data - DS (g cm-3), soil water content (kg kg-1), macroporosity (m3 m-3), microporosity (m3 m-3) and the relation between macro and microporosity in the depths of 0.00 to 0.20 and 0.20 to 0.40 m in the two studied tillage systems.
Harrowing (0.00 to 0.20 m)DS Θ Macro Micro
Model Spherical Spherical Spherical ExponentialC0 1.00 x 10⁻⁵ 3.82 x 10⁻³ 5.63 x 10⁻⁴ 8.63 x 10⁻⁵
C + C0 4.21 x 10⁻³ 1.01 x 10⁻¹ 7.65 x 10⁻³ 1.47 x 10⁻³
A0 18.0 26.1 30.0 31.3ADE High High High HighR² 0.88 0.90 0.86 0.91SQD 2.82 x 10⁻⁷ 3.37 x 10⁻⁷ 1.14 x 10⁻⁶ 8.77 x 10⁻⁴
Harrowing (0.20 to 0.40 m)Model Spherical Spherical Exponential ExponentialC0 5.00 x 10⁻⁵ 2.80 x 10⁻⁴ 4.00 x 10⁻³ 2.61 x 10⁻⁴
C + C0 4.91 x 10⁻³ 4.10 x 10⁻³ 5.31 x 10⁻² 2.28 x 10⁻³
A0 19.7 17.8 36.1 38.1ADE High High High HighR² 0.79 0.90 0.94 0.95SQD 4.63 x 10⁻⁷ 3.25 x 10⁻⁷ 6.32 x 10⁻⁶ 4.46 x 10⁻⁸
Scarification (0.00 to 0.20 m)Model Spherical Spherical Spherical SphericalC0 1.41 x 10⁻⁴ 2.40 x 10⁻² 5.60 x 10⁻⁴ 4.00 x 10⁻⁶
C + C0 2.92 x 10⁻³ 5.76 x 10⁻¹ 8.89 x 10⁻³ 1.74 x 10⁻³A0 16.6 24.5 24.5 28.7ADE High High High HighR² 0.82 0.91 0.83 0.88SQD 3.93 x 10⁻⁷ 2.71 x 10⁻⁶ 2.05 x 10⁻⁶ 2.51 x 10⁻⁸
Scarification (0.20 to 0.40 m)Modelo Spherical Spherical Spherical ExponentialC0 1.67 x 10⁻⁴ 8.8 x 10⁻⁴ 8.40 x 10⁻³ 1.31 x 10⁻⁴
C + C0 2.53 x 10⁻³ 4.8 x 10⁻³ 2.58 x 10⁻¹ 1.56 x 10⁻³
A0 21.2 17.4 24.6 30.0ADE High High High HighR² 0.83 0.87 0.91 0.91SQD 1.57 x 10⁻⁷ 4.37 x 10⁻⁴ 5.40 x 10⁻⁸ 2.94 x 10⁻⁷
C0 = nugget effect; C + C0 = threshold; A0 = range; ADE= spatial dependence estimator; R² = coefficient of determination; SQD= Square sum of the residue.
analyzed physical attributes. Sanchez et al. (2009) conducted an experiment to characterize the spatial variability of attributes of a red-yellow argisol soil and found exponential and spherical semivariograms. The spherical model is considered by many authors as the one that best adjusts to soil physical attributes (Fontenele et al., 2009; Corrêa et al., 2010).
Analyzing Table 4 and Figure 1, regarding the spatial dependence range (A0)
for the soil density attribute it was observed, after the scarification process, in the depth range of 0,00 to 0.20, the maximum A0 value (26.1m), after harrowing. For the depth range of 0.00 to 0.20 m, the macroporosity and microporosity attributes, the highest A0 values were 36.1 and 38.1 m, respectively, after the harrowing process and in the depth range of 0.20 to 0.40 m. In general,
it was observed an increase of the A0 with the increase of the depth range in the two types of soil preparation, except for the soil water content that presented a decrease of 23% of the values, for both soil preparation processes. As the depth increases, the variability of soil water content has decreased, resulting in a lower A0. Soares (2013), analyzing the physical and chemical attributes of the soil under different agricultural systems in Apodi – RN, Brazil, in a similar soil to the present study, observed a decrease of soil water content according to depth, in accordance to the observed results.
The correct interpretation of the results of the physical attributes studied are important in the planning the experimental area, therefore, these results must be taken into consideration in the management and research proposals, as well

226
Plant Production and Crop Protection
Com. Sci., Bom Jesus, v.8, n.2, p.221-229, Abr./Jun. 2017
Figure 1. Semivariograms of soil physical atributes: soil density (g cm-3), soil water content (kg kg-1), macroporosity (m3 m-3), microporosity (m3 m-3) and macro and microposity ratio for the depths of 0.00 to 0.20 m and 0.20 to 0.40 m of the harrowed area.
as the number of points that must be sampled to increase the representativeness (Vitoria et al., 2012b).
The degree of spatial dependence (ADE) in all soil physical attributes, soil tillage and depth ranges were considered high (>75%), explained by the fact that the variables that present a strong degree of dependence are more influenced by intrinsic soil properties, such as texture, structure,
organic matter content, density, mineralogy, and water content (Carneiro et al., 2009; Vendruscolo et al., 2011; Soares, 2013). Tavares et al. (2012) evaluated the spatial relation of the soil density, porosity, macroporosity, microporosity and soil water content, verifying medium (27-75%) to high (>75%) degree of spatial dependence, for all evaluated attributes, indicating that these variables are non-random in space.

227
Vitória et al. (2017) / Effects of spatial variability on soil physical ...
Com. Sci., Bom Jesus, v.8, n.2, p.221-229, Abr./Jun. 2017
Figure 2. Semivariograms of soil physical atributes: soil density (g cm-3), soil water content (kg kg-1), macroporosity (m3 m-3), microporosity (m3 m-3) and macro and microposity ratio for the depths of 0.00 to 0.20 m and 0.20 to 0.40 m of the area prepared with scarification
The results of the variographic analysis showed that all physical attributes had spatial dependence (Figures 1 and 2). Several models were tested until one was considered optimal. Directional models, which take into consideration the anisotropic semivariograms were considered, and a similar methodology was used by Vitória (2012a).
When anisotropy occurs, the direction affects the structure of the spatial variability for the parameters: nugget effect; range and level. The decision of the stationarity, the used estimators, the model of the adjusted semivariogram and the decision on the adopted isotropy, that is, the whole modeling process, was tested by cross validation (Walter et al., 2000). No anisotropic

228
Plant Production and Crop Protection
Com. Sci., Bom Jesus, v.8, n.2, p.221-229, Abr./Jun. 2017
model was superior to isotropic models. The models of the adjusted semivariograms were spherical and exponential. These models are considered transitive because they reach a value called threshold, and the distance at which they reach this threshold is called range. Samples separated by a distance greater than the range do not show spatial semivariance distance (m) .
ConclusionThe coefficients of variation indicated
low variability for soil density and soil water content, high variability for macroporosity and microporosity in the studied soils, despite the depth evaluated;
Soil attributes presented a high degree of spatial dependence, despite soil preparation and depth;
The observed range values for soil physical attributes can be considered for experimental planning, specifically in the sampling definition.
References Bottega, E. L., Bottega, S. P., Silva, S. A., Queiroz, D. M., Souza, C. M. A., Rafull, L. Z. L. 2011. Variabilidade espacial da resistência do solo à penetração em um Latossolo Vermelho distroférrico. Revista Brasileira de Ciências Agrárias (Agrária)/ Brazilian Journal of Agricultural Sciences 06: 331-336.
Carneiro, M. A. C., Souza, E. D., Reis, E. D., Pereira, H. S., Azevedo, W. D. 2009. Atributos físicos, químicos e biológicos de solo de cerrado sob diferentes sistemas de uso e manejo. Revista Brasileira de Ciência do Solo 33: 147-157.
Cavalcante, E. G., Alves, M. C., Souza, Z. M., Pereira, G. 2011. Variabilidade espacial de atributos físicos do solo sob diferentes usos e manejos. Revista Brasileira de Engenharia Agrícola e Ambiental 15: 237-243.
Corrêa, R. M., Freire, M. B. D. S., Ferreira, R. L., Silva, J. A., Pessoa, L. G., Miranda, M. A., Melo, D. V. 2010. Atributos físicos de solos sob diferentes usos com irrigação no semiárido de Pernambuco1. Revista Brasileira de Engenharia Agrícola e Ambiental 14: 358-365.
Fontenele, W., Salviano, A. A. C., Mousinho, F. E. P. 2009. Atributos físicos de um Latossolo Amarelo sob sistemas de manejo no cerrado piauiense. Revista Ciência Agronômica 40: 194-202.
Gabriel Filho, A., Pessoa, A. C. S., Strohhaecker, L., Helmich, J. J. 2000. Preparo convencional e cultivo mínimo do solo na cultura de mandioca
em condições de adubação verde com ervilhaca e aveia preta. Revista Ciência Rural 30:953-957.
Leite, A. F., Menezes, S. S. M. 2013. A resistência e permanência de agricultores
Familiares no meio rural alicerçada pela produção de iguarias derivadas da mandioca. Revista de Geografia 30:208-226.
Martelleto, L. A. P., Ribeiro, R. D. L. D., Martelleto, M. S., Vasconcellos, M. A. D. S., Marin, S. L. D., Pereira, M. B. 2008. Cultivo orgânico do mamoeiro 'Baixinho de Santa Amália' em diferentes ambientes de proteção. Revista Brasileira de Fruticultura 30: 662-666.
R Development Core Team. R: A language and environment for statistical computing. R Foundation for Statistical Computing, Vienna, Austria. 2013. http://www.R-project.org/< Acesso em 16 de Nov 2013>.
Roque, M. W., Matsura, E. E., Souza, Z. D., Bizari, D. R., Souza, A. D. 2008. Correlação linear e espacial entre a resistência do solo ao penetrômetro e a produtividade do feijoeiro irrigado. Revista Brasileira de Ciência do Solo 32: 1827-1835.
Sanchez, R. B., Marques Júnior, J., Souza, Z. D., Pereira, G. T., Martins Filho, M. V. 2009. Variabilidade espacial de atributos do solo e de fatores de erosão em diferentes pedoformas. Bragantia 68: 873-884.
Silva, S. A., Lima, J. S. S., Xavier, A. S., Teixeira, M. M. 2010. Variabilidade espacial de atributos químicos de um latossolo vermelho-amarelo húmico cultivado com café. Revista Brasileira de Ciência do Solo 34:15-22.
Silva, E. A., Gomes, J. B. V., Araújo Filho, J. C., Silva, C. A., Carvalho, S. A.; Curi, N. 2013. Podzolização los solos de áreas de Depressão de topo dos Tabuleiros Costeiros do Nordeste brasileiro. Revista Brasileira de Ciência do Solo 37:11-24.
Soares, S. R. F. 2013. Atributos físicos e químicos do solo sob formas de cultivo no assentamento milagre, apodi/RN. 32 f. (Dissertação de Mestrado) - Universidade Federal Rural do Semi-árido, Mossoró, Brasil.
Souza, J. M. 2013. Atributos físico-químicos do solo em lavoura de café conilon submetida à subsolagem. 75 f. (Dissertação de Mestrado) – Universidade Federal do Espírito Santo, São Mateus. Brasil.
Tavares, U. E., Rolim, M. M., Pedrosa, E. M., Montenegro, A. A., Magalhães, A. G., Barreto, M. T. 2012. Variabilidade espacial de atributos físicos e mecânicos de um Argissolo sob cultivo
229
Vitória et al. (2017) / Effects of spatial variability on soil physical ...
Com. Sci., Bom Jesus, v.8, n.2, p.221-229, Abr./Jun. 2017
de cana-de-açúcar. Revista Brasileira de Engenharia Agrícola e Ambiental 16: 1206-1214.
Vendruscolo, J., Ribeiro, T. S., Mesquita, F. O., Alves, A. S., Santos, G. A. D. 2011. Propriedades físicas de um latossolo e argilosso comparados com quatro tipos de solos na paraíba-brasil. Revista Verde de Agroecologia e Desenvolvimento Sustentável 06: 204-212.
Vitória, E. L., Fernandes, H. C., Teixeira, M. M. 2012. Correlação espacial entre a produtividade de Brachiaria brizantha, densidade do solo e porosidade total em função do sistema de manejo do solo. Revista Engenharia Agrícola 32:909-919.
Vitoria, E. L., Fernandes, H. C., Teixeira, M. M. 2012. Correlação linear e espacial entre produtividade de capim-mombaça e atributos físicos solo em função do sistema de manejo. Revista Agrotecnologia 02: 30-43.
Zucoloto, M, Lima, J. S. S, Coelho, R. I., Silva, S. A., Passos, R. R. 2011. Variabilidade espacial de atributos fiscos e variáveis agronômicas de citrus em uma parcela experimental em Jerônimo Monteiro (ES). Revista Engenharia na Agricultura 19: 28-35.
Zuffo, V. J., Pires, F. R.; Bonoma, R., Vitória, E. L., Filho, A. C.; Santos, E. O. J. 2013. Effects of tillage systems on physical properties of a cohesive yellow argisol in the northern state of Espírito Santo, Brazil. Revista Brasileira de Ciência do Solo 37: 1372-1382.
Walter, A.M., Christensen, S., Simmelsgaard, S.E. 2002. Spatial correlation between weed species densities and soil properties. Weed Res. 42: 26-38.