effects of nacl and ph on the structural conformations of kidney bean vicilin
TRANSCRIPT
Food Chemistry 139 (2013) 624–630
Contents lists available at SciVerse ScienceDirect
Food Chemistry
journal homepage: www.elsevier .com/locate / foodchem
Effects of NaCl and pH on the structural conformations of kidney bean vicilin
Sule Mundi, Rotimi E. Aluko ⇑Department of Human Nutritional Sciences, University of Manitoba, Winnipeg, Manitoba, Canada R3T 2N2The Richardson Centre for Functional Foods and Nutraceuticals, University of Manitoba, Winnipeg, Manitoba, Canada R3T 2N2
a r t i c l e i n f o
Article history:Received 28 August 2012Received in revised form 6 November 2012Accepted 21 December 2012Available online 16 January 2013
Keywords:Kidney beanVicilinFluorescence intensityTryptophanCircular dichroismAmino acid composition
0308-8146/$ - see front matter � 2013 Elsevier Ltd. Ahttp://dx.doi.org/10.1016/j.foodchem.2012.12.051
⇑ Corresponding author. Tel.: +1 204 474 9555; faxE-mail address: [email protected] (R.E
a b s t r a c t
Structural changes as a result of variations in pH value and salt concentration were determined for puri-fied vicilin, the major globular protein in kidney beans using intrinsic fluorescence and circular dichroism(CD). The vicilin consisted of two polypeptide chains of about 43 and 45 kDa in size when analysed underreducing SDS–PAGE. Amino acid analysis showed that the vicilin had high contents of acidic amino acidsand a low lysine/arginine ratio. Intrinsic fluorescence measurements were performed to measure expo-sure of tyrosine and tryptophan as a means of estimating protein conformational changes. Generally, thevicilin showed an unfolded structure at pH 3.0, 5.0, 7.0, and 9.0 as evident by the extensive red shift(>350 nm) of the wavelength of maximum tryptophan fluorescence intensity. At pH 3.0 and 5.0, the fluo-rescence intensity (FI) was greater than values obtained at pH 7.0 and 9.0, which suggests that the micro-environment of tryptophan was less hydrophilic at acidic pH. Addition of NaCl also led to increased FI, anindication of structural changes of tryptophan in response to the hydrophilic environment. These changesin FI were due mostly to tryptophan emission because tyrosine emission (at 303 nm) was suppressed. Thefar-UV CD spectra showed that vicilin had minimal measurable secondary structures at pH 3.0 and 5.0when compared to pH 7.0 and 9.0. Addition of NaCl led to an increase in the tertiary structure conforma-tion of vicilin as determined from the near-UV CD spectra.
� 2013 Elsevier Ltd. All rights reserved.
1. Introduction
Pulses, including kidney beans (Phaseolus vulgaris L.), are high indietary fibre and low in fat, making beans a good source of choles-terol and blood sugar lowering food, which can reduce the risk ofcardiovascular diseases and type 2 diabetes (Aykroyd & Doughty,1982). In addition, they are high in proteins (20–30% on a dryweight basis) (Yin, Tang, Wen, & Yang, 2010a), which put themamong some of the richest food sources of proteins for humanand animal nutrition, as well as for food industry applications.The main storage protein in kidney beans is the globular phaseolin,also known as vicilin (Yin et al., 2010a). Depending on the cultivar,vicilins are composed of two (dimer) or three (trimer) polypeptidechains (Romero, Sun, McLeester, Bliss, & Hall, 1975). In addition tophaseolin, kidney beans also contain lectins, which are glycopro-teins that reversibly and non-enzymatically bind to specific sugars,and in doing so, play a range of crucial roles in many cell–cell rec-ognition events that trigger several important cellular processes(Chandra et al., 2006). All of the biological functions reported forproteins are directly affected by the structure and other physicalproperties such as size, charge and hydrophobicity of the protein,
ll rights reserved.
: +1 204 474 7593.. Aluko).
which affect interactions with or affinity for ligands (Chandraet al., 2006). Environmental factors can cause conformationalchanges and specific alterations in the function of the protein.For example, the presence of protein structure perturbants (e.g. so-dium dodecyl sulfate, urea and dithiothreitol) and other environ-mental parameters, such as pH, ionic strength, binding of ligandsand temperature can affect molecular organization, which influ-ences biological functions. Thus, understanding the impact of pro-tein conformation under various buffer conditions on the biologicalfunctions remains a primary focus in protein chemistry, especiallyduring various food processing events. Cooking and other forms offood preparation or processing are usually necessary for the reduc-tion of anti-nutrient factors in kidney beans (Shimelis & Rakshit,2007). During processing events, the conditions in the food envi-ronment changes and hence, the structure could be affected. Theknowledge of changes in temperature, pH, or ionic strength, andtheir effects on structure–function relationships as well as theircontrol during food preparation is essential.
Spectroscopic methods, including circular dichroism (CD) andfluorescence spectroscopy (FS) of proteins can provide sensitiveindications of the conformational changes that may occur (at themolecular level) due to changes in the protein environment. CDand FS of proteins provide important structural information con-cerning the details of the helical content of proteins or the asym-metric environment of aromatic residues. Previous studies (Dyer,
S. Mundi, R.E. Aluko / Food Chemistry 139 (2013) 624–630 625
Nelson, & Murai, 1992; Tang and Ma, 2009; Tang, Sun, & Foegeding,2011; Yin, Tang, Wen, Yang, & Yuan, 2010b; Yin, Tang, Yang, &Wen, 2011b; Yin et al., 2010a, 2011a) have investigated the effectsof protein structure perturbants and pH on the conformationalproperties of phaseolin and kidney bean isolate (KPI). By usingCD, FS and differential scanning calorimetry (DSC), protein confor-mational and structural changes due to heat (Dyer et al., 1992;Tang and Ma, 2009), succinylation and acetylation (Yin et al.,2010b) and glycation (Tang et al., 2011) have been determined.The effects of polar, neutral, anionic and cationic quenchers suchas acrylamide, nitrate and caesium ion respectively have also beenstudied (Yin, Tang, Yang, & Wen, 2011b). The results showed signif-icant changes in the a-helix content and highly ordered secondarystructures (a-helix + b-strand) in addition to tertiary conformationunfolding and subsequent rearrangement process. Yin et al.(2011a) studied the effects of pH on the secondary and tertiaryconformations of phaseolin by using CD spectra in near/far UV re-gion and showed that there were changes in protein conformationwith shifts in pH values. However, there is paucity of informationon the combined effects of varying NaCl concentrations and pHon the CD and FS properties of purified kidney bean globular pro-tein (vicilin). Therefore, the goal of the current research was tostudy the effects of changes in pH alone or in combination withNaCl concentrations on the structural conformations of purifiedkidney bean vicilin using CD and FS.
2. Materials and methods
2.1. Preparation of crude globulin sample
Red kidney bean seeds were obtained from a local store in Win-nipeg and were ground into flour using a Retsch ZM200 centrifugemill (Retsch GmbH, Haan, Germany). Globulin proteins were ex-tracted from the flour according to the previously describedammonium sulfate precipitation method (Aluko, 2004). The majorglobulin fraction in kidney beans was obtained by adjusting anaqueous extract (obtained using 0.1 M phosphate buffer, pH 7.0containing 0.4 M NaCl) of the flour to 40% ammonium sulfate sat-uration, in order to precipitate albumins and other smaller proteinsand enzymes. After centrifugation (9000g, 45 min, 4 �C), the super-natant was then brought to 80% ammonium sulfate saturation toprecipitate the globulins. The ammonium sulfate was then re-moved from the isolated globulins by dialyzing sample againstwater at 2 �C using dialysis membrane with molecular weightcut-off of 6–8 kDa. The dialysis bag content was centrifuged(9000g, 45 min, 4 �C) and the resultant precipitate (globulin) wasfreeze-dried and further purified using Fast Protein Liquid Chroma-tography (FPLC).
2.2. Purification of vicilin by FPLC
The kidney beans globulin protein was separated using ÄK-TAPurifier FPLC system equipped with a size exclusion column, Hi-Load 26/60 Superdex 200 Prep grade (GE Healthcare, Montreal,PQ). Sodium phosphate (0.1 M) prepared to contain 0.4 M NaClwas used as the equilibration buffer for the column, and as an elu-tion buffer. Two millilitres of 100 mg/mL globulin protein solution,filtered through 0.2 lm filter disks were loaded onto the Superdexcolumn and run at a flow rate of 2.5 mL/min; eluted proteins weredetected from the UV absorbance at 214 nm. The major fractionwas collected and desalted using Hiprep 26/10 desalting column,following which the sample was freeze dried, analysed for proteincontent (Markwell, Haas, Bieber, & Tolbert, 1978) and stored at�20 �C until further analysis.
2.3. Sodium dodecyl sulphate–polyacrylamide gel electrophoresis(SDS–PAGE)
The freeze dried globulin fraction was subjected to SDS–PAGEaccording to the method of Aluko and McIntosh (2004) with minormodifications. Ten milligramme protein was dispersed in a Tris/HCl buffer (pH 8.0) containing SDS and mercaptoethanol, each at10% (w/v), followed by heating at 95 �C for 10 min, cooling andcentrifugation (15 000g) for 5 min. After centrifugation, approxi-mately 1 lL of supernatant was loaded onto an 8–25% gradientgel and electrophoresis performed with a Phastsystem Separationand Development unit according to the manufacturer’s instruc-tions (GE Healthcare, Montréal, PQ). A mixture of Promega stan-dard proteins (10–225 kDa) was used as the molecular weightmarker (Fisher Scientific, Oakville, ON, Canada).
2.4. Amino acid analysis
HPLC system was used for the analysis of the amino acid pro-files after samples were hydrolyzed with 6 M HCl according tothe method described by Bidlingmeyer, Cohen, and Tarvin(1984). The cysteine and methionine contents were determinedafter performic acid oxidation (Gehrke, Wall, & Absheer, 1985)and tryptophan content was determined after alkaline hydrolysis(Landry & Delhaye, 1992).
2.5. Intrinsic fluorescence emission spectrophotometry
Intrinsic fluorescence spectra were recorded on the JASCO FP-6300 spectrofluorimeter at 25 �C using a 1 cm pathlength cuvette.Protein stock solution was diluted to 0.002% (w/v) with respectivebuffers or buffers that contain NaCl. Fluorescence spectra were re-corded at excitation wavelengths of 275 (tyrosine + tryptophan)and 295 (tryptophan) with emission recorded from 280 and 300to 500 nm, respectively, using 2.5 nm band width (Schmid,1989). Emissions of the buffer or buffer + NaCl blanks were sub-tracted from those of the respective samples to obtain fluorescencespectra of the sample.
2.6. Measurements of circular dichroism (CD) spectra
CD measurements were carried out at 25 �C in a J-810 spectro-polarimeter (JASCO, Tokyo, Japan) using the spectral range of 190–240 nm (far UV) for secondary structure determinations and 250–320 nm (near UV) for tertiary structure (Schmid, 1989). The vicillinwas solubilized in 10 mM phosphate buffer (pH 3.0, 5.0, 7.0, and9.0) that contained appropriate NaCl concentration followed bycentrifugation (10 000g) for 30 min (to remove particulate matter)and supernatant used for CD structural analysis. For secondarystructure determinations, a cuvette with pathlength of 0.05 cmwas used and contained 1 mg/ml protein solution while the ter-tiary structure was measured in a 0.1 cm cuvette that contained2 mg/ml protein concentration. Vicilin at 1 and 2 mg/ml (0.1%and 0.2% w/v, respectively) was completely soluble at all the pHvalues used; solubility range of vicilin is 5% at pH 5.0 and 75% atpH 9.0. All the CD spectra were obtained as the average of threeconsecutive scans with automatic subtraction of the buffer or buf-fer + NaCl spectra.
3. Results and discussion
3.1. Fast protein liquid chromatography (FPLC) purification and gelelectrophoresis
Kidney beans globulin proteins were separated based on thedifferential exclusion from the pores of the column’s packing

Table 1Amino acid composition (g/100 g) of crude and purified red kidney bean vicilin.*
Amino acid Purified vicilin Crude vicilin
ASX 13.60 13.58THR 3.57 3.03SER 6.83 6.21GLX 18.59 21.34PRO 3.34 3.40GLY 3.71 3.34ALA 3.58 3.51CYS 0.05 0.01VAL 4.57 4.03MET 0.62 0.93ILE 4.47 4.07LEU 9.30 9.23TYR 3.87 3.84PHE 7.26 7.18HIS 3.16 2.89
626 S. Mundi, R.E. Aluko / Food Chemistry 139 (2013) 624–630
material. Fig. 1A shows that the FPLC fractionation resulted in onemajor peak, the 7S vicilin and a minor fraction. The major fractionwas collected, freeze-dried (protein content of 96%) and used forthe structural characterization reported in this study. SDS–PAGEwas used to separate proteins according to their electrophoreticmobility as a function of polypeptide molecular weight (MW).The gel electrophoresis under reducing condition (Fig. 1B) revealedthat two major polypeptide bands with estimated MW of 45 &43 kDa were present in the purified (lane 2) and crude (lane 3) pro-teins, results that are consistent with the I and S types of vicilin(Montoya et al., 2006). Two minor polypeptide bands correspond-ing to �100 and 23 kDa were also observed for the crude globulinpreparation (lane 3) (Fig. 1B). Similar electrophoretic patterns tothe major bands reported in this study with MW of 43 & 45 kDahave also been reported for red kidney beans 7S vicilin (Montoyaet al., 2006).
LYS 7.29 7.39ARG 5.62 5.11TRP 0.53 0.90
BCAA 18.34 17.33AAA 11.66 11.92BCCA/AAA 1.57 1.45EAA 45.14 43.50
* ASX = aspartic acid + asparagine; GLX = glutamic acid + glutamine; BCAA; bran-ched chain amino acids (LEU, ILE, VAL):AAA; aromatic amino acids (TYR, PHE, TRP)EAA: essential amino acids (HIS, ILE, LEU, VAL, TRP, TYR, MET + CYS, THR, PHE, LYS).
3.2. Amino acid analysis
As shown in Table 1, the kidney bean protein had high levels ofaspartic acid + asparagine and glutamic acid + glutamine. Gluta-mine is also important in human nutrition because it promotes gly-cogen production in the liver, increases protein synthesis anddecreases protein degradation in skeletal muscle (Franzese T. A.,2000). The high contents of lysine and arginine in the kidney beanproteins may provide important source of ingredients for food for-tification. This is because dietary supplementation of foods withbasic amino acids has been shown to normalise hormonal stressresponses in human beings with high trait anxiety (Smriga et al.,2007). As in other legumes, the nutritionally limiting amino acidsfound in the kidney bean proteins are the sulfur-containing aminoacids (methionine and cysteine). The content of branched-chainamino acids (leucine + isoleucine + valine) was slightly increased(from 17.33% to 18.34%) but there was no change in aromatic ami-no acid (AAA) content after FPLC purification. Proteins with highlevels of branched-chain amino acids are appropriate for formulat-ing physiologically active foods, including diets that are designed
Fig. 1. (A) Fast protein liquid chromatography profile of kidney bean globular proteinphosphate (pH 7.0) as elution buffer. (B) Reducing SDS–PAGE profiles of red kidney beanrespectively. Lane 1 is the promega standard proteins.
to improve nutritional status of patients with medical conditionssuch as burns, cancer, liver failure, and trauma (Weisdorf, 1989).The percentage ratio of the essential to total amino acids wasabove the 35% value that is reported for ideal proteins (DRI.,2005). The purified kidney bean vicilin showed a low lysine/argi-nine (L/A) ratio (1.30), which is comparable to fish proteins but islower than L/A ratio for casein (1.89) and whole milk protein(2.44). A low lysine/arginine ratio in proteins is believed to haveless lipidemic and atherogenic effects (Wanasundara & Shahidi,2003). Thus, the kidney bean 7S globulin may be a better choicefor formulating hypolipidemic diets when compared to casein (L/A = 1.89) and whole milk (L/A = 2.44).
purified using HiLoad 26/60 Superdex 200 prep grade column and 0.1 M sodiumglobular protein. Lanes 2 and 3 are the bands for purified and unpurified globulin,

pH 3
320 340 360 380 400 420 440 460 4800
50
100
150
200
250
300
1.0 M
0.5 M
0.1 M
0.0 M
Wavelength (nm)
F I
pH 5
320 340 360 380 400 420 440 460 4800
50
100
150
200
250
300 0.5 M
1.0 M
0.1 M
0.0 M
Wavelength (nm)
F I
pH 7
320 340 360 380 400 420 440 460 4800
50
100
150
200
250
300
0.1 M0.5 M
1.0 M
0.0 M
Wavelength (nm)
F I
pH 9
320 340 360 380 400 420 440 460 4800
50
100
150
200
250
300
0.5 M1 M0.1 M
0.0 M
Wavelength (nm)
F I
Fig. 2. The intrinsic fluorescence intensity (FI) spectra of kidney bean vicilin excited at 295 nm (tryptophan) as affected by pH and salt concentration.
pH 3
300 320 340 360 380 400 420 440 4600
50
100
150
200
250
3000.1 M
0.5 M
1.0 M
0.0 M
Wavelength (nm)
F I
pH 5
300 320 340 360 380 400 420 440 4600
50
100
150
200
250
300
0.5 M
0.1 M
1.0 M
0.0 M
Wavelength (nm)
F I
pH 7
300 320 340 360 380 400 420 440 4600
50
100
150
200
250
300
0.1 M
1.0 M
0.5 M
0.0 M
Wavelength (nm)
F I
pH 9
300 320 340 360 380 400 420 440 4600
50
100
150
200
250
300
0.1 M
1.0 M
0.5 M
0.0 M
Wavelength (nm)
F I
Fig. 3. The intrinsic fluorescence intensity (FI) spectra of kidney bean vicilin excited at 275 nm (tyrosine + tryptophan) as affected by pH and salt concentration.
S. Mundi, R.E. Aluko / Food Chemistry 139 (2013) 624–630 627
628 S. Mundi, R.E. Aluko / Food Chemistry 139 (2013) 624–630
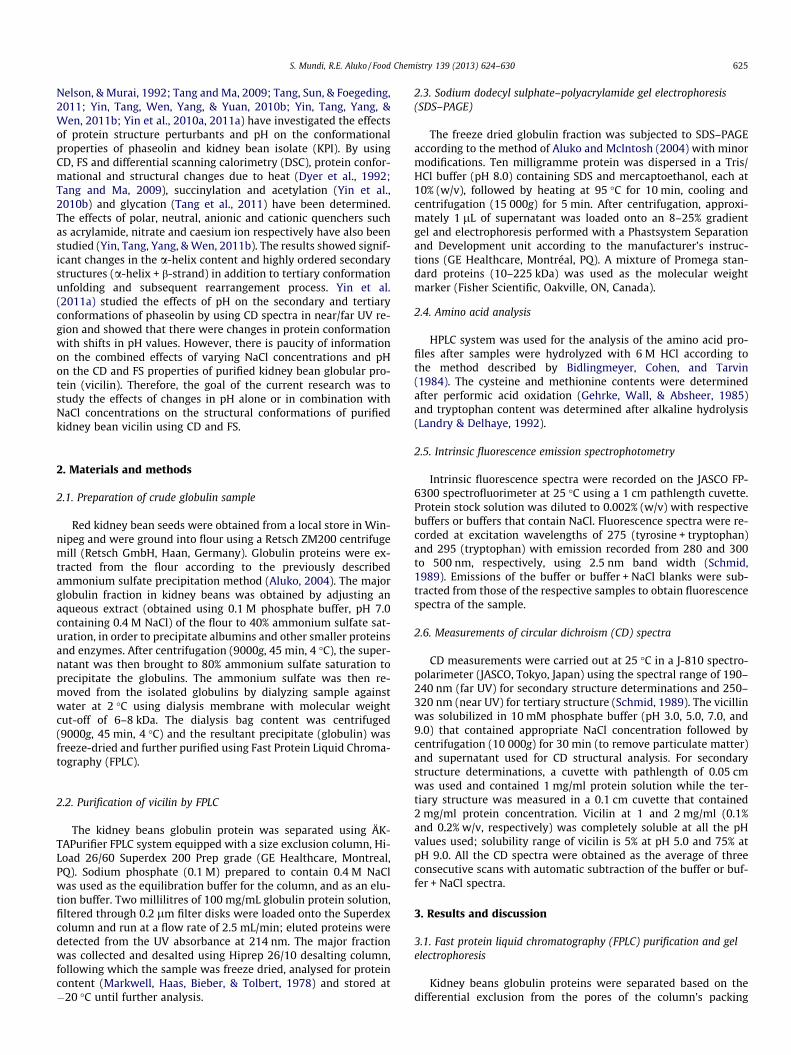
3.3. Intrinsic fluorescence
The emission maximum of the fluorescent amino acids such astyrosine and tryptophan in their specific environment could be auseful signature because it provides a sensitive means of character-ising proteins based on their conformation, dynamics, and inter-molecular interactions (Pain, 1996). Protein fluorescence canreveal a variety of information, including the extent of rotationalfreedom, the exposure of amino acid side chains to quenchers,and intramolecular distances (Gorinstein et al., 2000). Therefore,changes in intrinsic fluorescence can be used to monitor structuralconformations of proteins. In the current work, we measured pro-tein fluorescence as a function of pH and NaCl concentrations. As apossible food ingredient, vicilin-rich kidney bean globulin will besubjected to pH and salt changes during food manufacturing, lead-ing to conformational and structural changes which could eventu-ally impact the nutritional and functional properties (Yin et al.,2011b).
The fluorescence chromatograms shown in Figs. 2 and 3 relateto fluorescence intensity (FI) obtained after excitations at 295(tryptophan) and 275 (tryptophan + tyrosine) nm, respectively.Changes in pH can affect the overall charge on the ionizable resi-dues such as arginine, histidine, lysine, glutamic acid and asparticacid, and consequently alter electrostatic interactions which maychange protein conformation (Yin et al., 2011b). Figs. 2 and 3 showquenching of the fluorescence intensity at neutral and alkaline pH
pH 3
250 260 270 280 290 300 310 320 330-400
-300
-200
-100
0
100
200
0.1 M
0.5 M
1.0 M
0.0 M
Wavelength (nm)
M R
E (d
eg.c
m2 .d
mol
-1)
pH 7
250 260 270 280 290 300 310 320 330-400
-300
-200
-100
0
100
200
0.1 M
0.5 M
1.0 M
0.0 M
Wavelength (nm)
M R
E (d
eg.c
m2 .d
mol
-1)
Fig. 4. Effects of pH and salt concentrations on the tertiary structure (near-UV CD spe
values, which can be attributed to protein unfolding that leads toincreased interactions with the hydrophilic environment (Arnt-field, Ismond, & Murray, 1987). Thus the vicilin protein had a morecompact structure at pH 3.0 and 5.0, which reduced the intramo-lecular quenching of aromatic amino acid fluorescence (Stanciuc,Rapeanu, Bahrim, & Aprodu, 2012). Addition of NaCl generally ledto increased FI, which indicates salt-induced changes in proteinstructure to reduce hydration of aromatic amino acids and associ-ated quenching of aromatic amino acid fluorescence. Depending onpH, increase in NaCl concentration can cause structural rearrange-ments that enhance interactions between the tryptophan residuesand hence increased FI as obtained at pH 3.0. In contrast at pH 5.0and 9.0, FI was decreased at 1.0 M NaCl concentration, which sug-gests structural changes that reduced tryptophan interactions rel-ative to the conformation at 0.5 M NaCl. However, at pH 7.0, thestrongest interactions between the tryptophan residues occurredwith 0.1 M NaCl concentration; subsequent NaCl increases hadthe opposite effect. The wavelength of maximum FI (kmax) was>350 nm for all the samples, which indicates that the tryptophanresidues were positioned within a highly hydrophilic environment.This is because in a hydrophobic environment, tryptophan kmax istypically between 331 and 347 nm (Arntfield et al., 1987). Thepresent results are different from the kmax value of 331 nm re-ported by Yin et al. (2011a),Yin et al. (2011b), probably due to dif-ferences in extraction and purification methods. In the absence ofNaCl, the tryptophan microenvironment became less hydrophilic
pH 5
250 260 270 280 290 300 310 320 330-400
-300
-200
-100
0
100
200
0.1 M
0.5 M1.0 M
0.0 M
Wavelength (nm)
M R
E (d
eg.c
m2 .d
mol
-1)
pH 9
250 260 270 280 290 300 310 320 330-400
-300
-200
-100
0
100
200
0.1 M0.5 M
1.0 M
0.0 M
Wavelength (nm)
M R
E (d
eg.c
m2 .d
mol
-1)
ctra) measured as mean residue ellipticity (MRE) of purified kidney bean vicilin.
S. Mundi, R.E. Aluko / Food Chemistry 139 (2013) 624–630 629
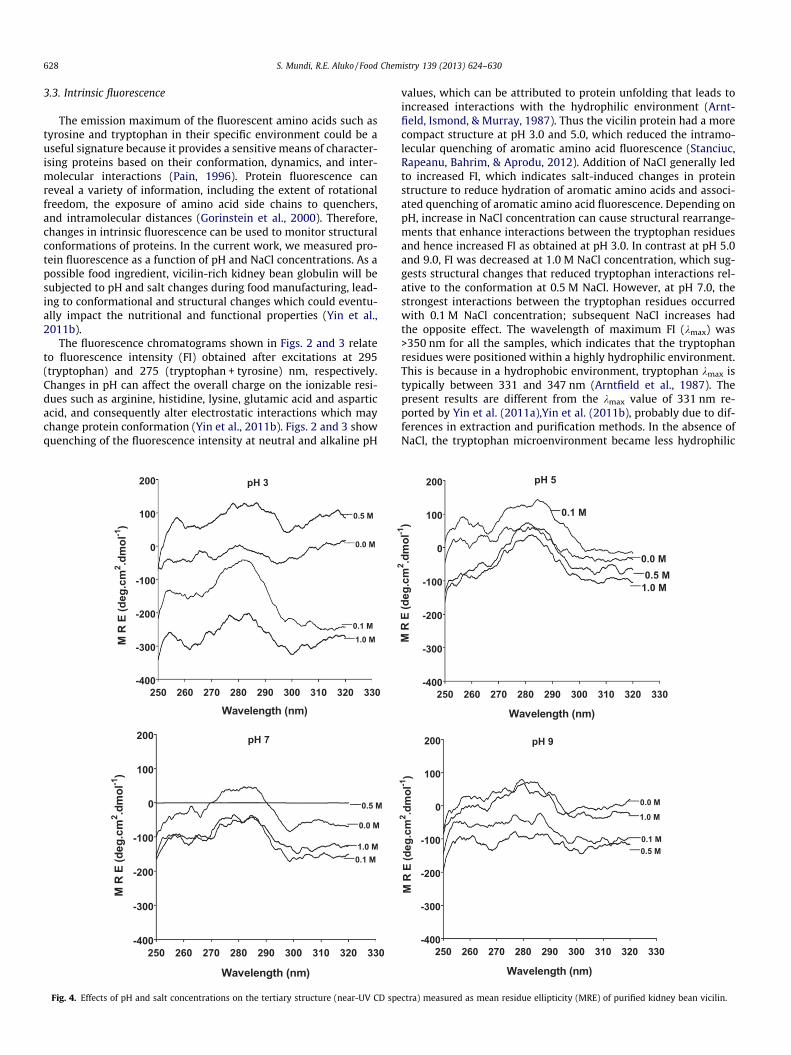
as evidenced by the blue shift in wavelength of maximum fluores-cence (kmax) from 368 nm at pH 3.0 to 360 at pH 9.0. The data sug-gest that the tryptophan residues became gradually buried in theprotein as the environment became more hydrophilic (ionisationof amino acids) at higher pH. Addition of NaCl at pH 3.0 led to grad-ual transfer of the tryptophan residues away from the hydrophilicenvironment as shown by the blue shift from 368 nm for 0.0 NaClto 362 and 364 nm for 0.5 and 1.0 NaCl, respectively. The blue shiftin kmax was accompanied by increased FI as NaCl increased at pH3.0. The results suggest that at pH 3.0, the presence of NaCl couldhave attracted water molecules away from the protein core, whichreduced quenching of tryptophan fluorescence. In contrast, therewere no changes in kmax at pH 7.0 while only the addition 0.5 MNaCl led to a red shift at pH 5.0 and 9.0.
Overall, the highest tryptophan fluorescence was observed atpH 5.0, which is close to the isoelectric point of the vicilin wherea more compact tertiary structure could have reduced both intra-molecular distance between the tryptophan molecules and fluores-cence quenching by the hydrophilic molecules. But as pH wasincreased to 7.0 and 9.0, the overall tertiary structure of the vicilinbecame less compact; this alternate conformation lead to structureof increased rotational freedom (longer intramolecular distancesbetween tryptophan residues) and hence reduced FI intensity(Stanciuc et al., 2012). The tryptophan kmax for fully unfolded pro-teins has been reported to be �354 nm (Stanciuc et al., 2012);therefore, the values obtained in this work suggest a highly un-folded state for the proteins within a strong hydrophilic environ-ment. Fig. 3 shows similar data such as the blue shift in kmaxand reduced FI as the pH was increased. The typical kmax for tyro-sine is �303 nm when excited at 275 nm; thus the longer kmax val-ues reflect tryptophan fluorescence and not tyrosine (Fig. 3). Due to
pH 3
180 190 200 210 220 230 240 250-12000
-8000
-4000
0
4000
8000
1.0 M
0.0 M 0.1 M0.5 M
Wavelength (nm)
M R
E (d
eg.c
m2 .d
mol
-1)
pH 7
180 190 200 210 220 230 240 250-12000
-8000
-4000
0
4000
8000 0.0 M
0.1 M 0.5 M
1.0 M
Wavelength (nm)
M R
E (d
eg.c
m2 .d
mol
-1)
Fig. 5. Effects of pH and salt concentrations on the secondary structure (far-UV CD sp
the stronger fluorescence quantum yield of tryptophan and its abil-ity to receive transfer of non-radiative energy, it is recognised thattyrosine fluorescence (303 nm) is barely detectable in the presenceof tryptophan (Schmid, 1989). However, it is also possible that forsuch an unfolded protein, extensive interaction with the hydro-philic microenvironment led to an effective quenching of tyrosinefluorescence. These results differ from those reported by Yin et al.(2011a) who reported a tyrosine maximum emission peak at318 nm, possibly as result of differences in protein preparationmethods and extent of protein unfolding.
3.4. Circular dichroism
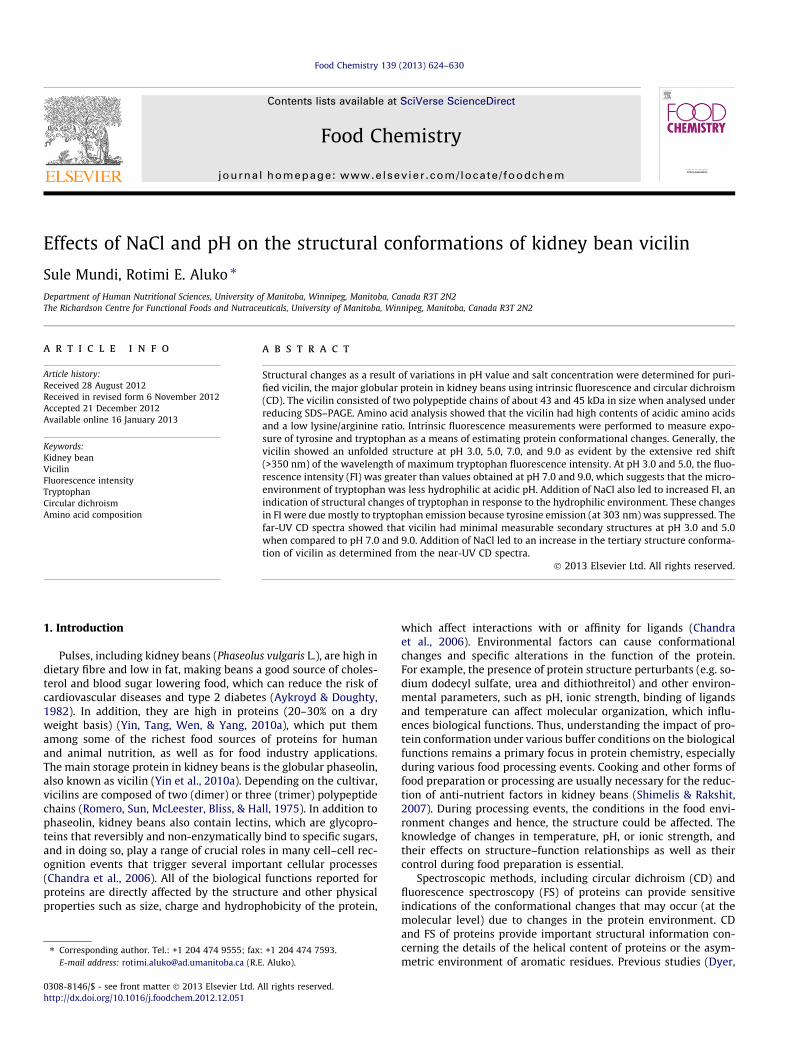
Signals arising from chromophores, including the amide groupof the polypeptide backbone with associated peaks falling in thefar UV region (190–240 nm), and the aromatic residues (phenylal-anine, tyrosine, and tryptophan) around the near UV region (250–320 nm) of the spectrum, makes CD suitable for examining proteinconformation and folding under a wide range of experimental con-ditions (Schmid, 1989). In the current study, conformationalchanges of kidney bean 7S vicilin were investigated as a functionof changes in pH and NaCl concentrations. Fig. 4 shows thatchanges in the tertiary structure of vicilin were influenced moreby NaCl content than by pH. In the absence of NaCl (0.0 M), the vic-ilin had reduced tertiary structures at different pH values as evi-dent in the mean residue ellipticity (MRE) values being veryclose to zero. Addition of NaCl led to significant (p < 0.05) changesin the tertiary structure (MRE values) mostly at pH 3.0 in the pres-ence of 0.1 and 1.0 M concentrations.
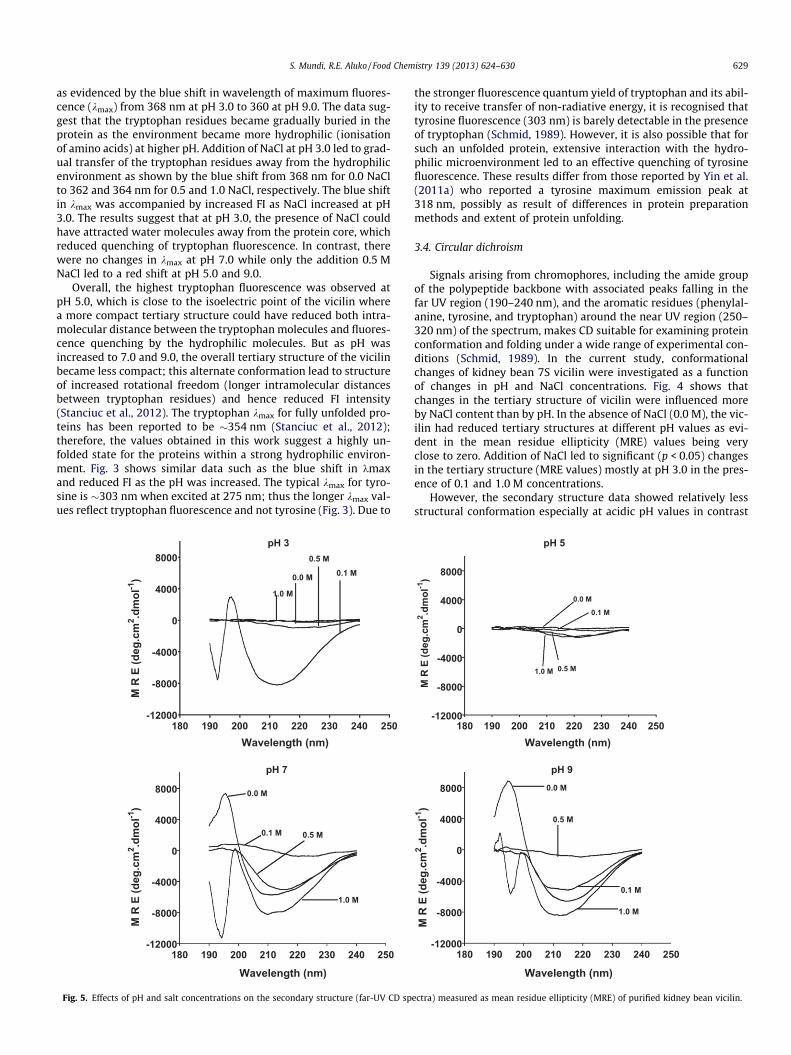
However, the secondary structure data showed relatively lessstructural conformation especially at acidic pH values in contrast
pH 5
180 190 200 210 220 230 240 250-12000
-8000
-4000
0
4000
8000
0.1 M
0.0 M
0.5 M1.0 M
Wavelength (nm)
M R
E (d
eg.c
m2 .d
mol
-1)
pH 9
180 190 200 210 220 230 240 250-12000
-8000
-4000
0
4000
8000 0.0 M
0.5 M
0.1 M
1.0 M
Wavelength (nm)
M R
E (d
eg.c
m2 .d
mol
-1)
ectra) measured as mean residue ellipticity (MRE) of purified kidney bean vicilin.

630 S. Mundi, R.E. Aluko / Food Chemistry 139 (2013) 624–630
to pH 7.0 and 9.0 where conformations were more evident (Fig. 5).At pH 5.0, the relative secondary structure transition was almostabsent in the presence or absence of NaCl, which suggests a looseprotein secondary structure (Schmid, 1989) at the isoelectric pointwhen compared to the protein structure at other pH values. Addi-tion of 0.1 M NaCl led to significant secondary structure develop-ment at pH 3.0; increases in NaCl to 0.5 and 1.0 M had oppositeeffects in eliminating the secondary structure conformations(Fig. 5). The secondary structure conformations showed the pres-ence of the typical b-sheet (peak at 195 nm) and a-helix (peak at215 nm) transitions for the vicilin in the absence of NaCl (0.0 M)at pH 7.0 and 9.0. Tang et al. (2011) and Yin et al. (2011a) also ob-served prominent negative band at pH 7.0, around 215–220 nmand a positive band at about 195–200 nm in the far-UV spectraof vicilin purified using DEAE-Sepharose fast flow column chroma-tography. In our work, addition of NaCl reduced these b-sheet anda-helix transitions, which suggests salt-induced structural dena-turation of the vicilin. It is possible that the presence of NaCl intro-duced excess ionic charges which increased repulsions betweenthe secondary structure fractions of the protein.
4. Conclusions
Purification led to decreased lysine/arginine ratio of the vicilin,which suggests that the protein may be used as an ingredient toformulate anti-atherogenic diets. Intrinsic fluorescence studies ofred kidney bean vicilin showed that tryptophan interacted exten-sively with the hydrophilic environment at pH 3.0, 5.0, 7.0, and9.0 as evident in the tryptophan fluorescence with kmax values>350 nm. Tryptophan fluorescence quenching was higher at neu-tral and basic pH values, which indicates interaction with a morehydrophilic microenvironment when compared to acidic pH val-ues. The structural conformations of the vicilin suggest close prox-imity of tyrosine to tryptophan or quenching of tyrosinefluorescence by a hydrophilic microenvironment because of theabsence of tyrosine emission (typically detected at 303 nm) at allthe pH values and NaCl concentrations. In the presence of NaCl,tryptophan fluorescence was enhanced, which suggests salt-in-duced reduction in the intramolecular distance between the aro-matic amino acid residues or NaCl-dependent reduction intryptophan hydration. Circular dichroism studies showed a rela-tively less defined secondary structure (when compared to pH3.0, 7.0 and 9.0) of the vicilin at pH 3.0 and 5.0, which is close tothe isoelectric point. At pH 7.0 and 9.0, the vicilin assumed a moredefined secondary structure conformation that was sensitive tochanges in NaCl concentrations. The vicilin showed reduced ter-tiary structure conformations at all the pH values tested but moredefined structures were produced upon addition of NaCl. Overall,data from this work add to our knowledge of pH- and ionicstrength-dependent structural modifications of food proteins,which could enhance utilisation of proteins that lack the requiredmolecular conformations during formulation of food products.
Acknowledgements
Funding for this work was provided through a Discovery grantfrom the Natural Sciences and Engineering Research Council ofCanada (NSERC) to Dr Rotimi E. Aluko.
References
Aluko, R. E (2004). The extraction and purification of proteins: An introduction. In R.Y. Yada (Ed.), Proteins in food processing (pp. 323–346). Woodhead PublishingLimited and CRC Press LLC.
Aluko, R. E., & McIntosh, T. (2004). Electrophoretic and functional properties ofmustard seed meals and protein concentrates. Journal of the American OilChemists’ Society, 81, 679–683.
Arntfield, S. D., Ismond, M. A. H., & Murray, E. D. (1987). Use of intrinsic fluorescenceto follow the denaturation of vicilin, a storage protein from Vicia faba.International Journal of Protein and Peptide Research, 29, 9–20.
Aykroyd, W. R., & Doughty, J. (1982). Legumes in human nutrition. Food andAgriculture Organization of the United Nations. FAO Food and Nutrition, Paper20, pp. 1–152.
Bidlingmeyer, B. A., Cohen, S. A., & Tarvin, T. L. (1984). Rapid analysis of amino acidsusing pre-column derivatization. Journal of Chromatography-BiomedicalApplications, 336, 93–104.
Chandra, N. R., Kumar, N., Jeyakani, J., Singh, D. D., Gowda, S. B., & Prathima, M. N.(2006). Lectindb: A plant lectin database. Glycobiology, 16, 938–946.
DRI (2005). Dietary reference intakes for energy, carbohydrate, fiber, fat, fatty acids,cholesterol, protein, and amino acids (macronutrients). Food and nutrition board.Washington, DC: The National Academies Press.
Dyer, J. M., Nelson, J. W., & Murai, N. (1992). Biophysical analysis of phaseolindenaturation induced by urea, guanidinium chloride, pH, and temperature.Journal of Protein Chemistry, 11, 281–288.
Franzese T. A. (2000). Medical nutrition therapy for rheumatic disorders. In L. K.Mahan, & S. Escortt-Stump (Eds.), Krause’s food, nutrition & diet therapy (10thed., pp. 970–986). W.B. Saunders.
Gorinstein, S., Goshev, I., Moncheva, S., Zemser, M., Weisz, M., Caspi, A., et al. (2000).Intrinsic tryptophan fluorescence of human serum proteins and relatedconformational changes. Protein Journal, 2000(19), 637–642.
Gehrke, C. W., Wall, L. L., & Absheer, J. S. (1985). Sample preparation forchromatography of amino acids: Acid hydrolysis of proteins. Journal of theAssociation of Official Analytical Chemists, 68, 811–821.
Landry, J., & Delhaye, S. (1992). Simplified procedure for the determination oftryptophan of foods and feedstuffs from barytic hydrolysis. Journal ofAgricultural and Food Chemistry, 40, 776–779.
Markwell, M. A. K., Haas, S. M., Bieber, L. L., & Tolbert, N. E. (1978). A modification ofthe Lowry procedure to simplify protein determination in membrane andlipoprotein samples. Analytical Biochemistry, 87, 206–210.
Montoya, C. A., Lalles, J.-P., Beebe, S., Montagne, L., Souffrant, W. B., & Leterme, P.(2006). Influence of the Phaseolus vulgaris phaseolin level of incorporation, typeand thermal treatment on gut characteristics in rats. British Journal of Nutrition,95, 116–123.
Pain, R. H (1996). Determining the fluorescence spectrum of a protein. In Currentprotocols in protein science (pp. 7.7.1–7.7.19). John Wiley & Sons.
Romero, J., Sun, S.-M., McLeester, R. C., Bliss, F. A., & Hall, T. C. (1975). Heritablevariation in a polypeptide subunit of the major storage protein of the bean,Phaseolus vulgaris L.. Plant Physiology, 56, 776–779.
Schmid, F. X (1989). Spectra methods of characterizing protein conformation andconformational changes. In T. E. Creighton (Ed.), Protein structure: A practicalapproach (pp. 251–285). Springer.
Shimelis, E. A., & Rakshit, S. K. (2007). Effect of processing on antinutrients andin vitro protein digestibility of kidney bean (Phaseolus vulgaris L.) varietiesgrown in East Africa. Food Chemistry, 103, 161–172.
Smriga, M., Ando, T., Akutsu, M., Furukawa, Y., Miwa, K., & Morinaga, Y. (2007). Oraltreatment with L-lysine and L-arginine reduces anxiety and basal cortisol levelsin healthy humans. Biomedical Research, 28, 85–90.
Stanciuc, N., Rapeanu, G., Bahrim, G., & Aprodu, I. (2012). PH and heat-inducedstructural changes of bovine apo-a-lactalbumin. Food Chemistry, 131, 956–963.
Tang, C., & Ma, C. (2009). Heat-induced modifications in the functional andstructural properties of vicilin-rich protein isolate from kidney (Phaseolusvulgaris L.) bean. Food Chemistry, 115, 859–866.
Tang, C., Sun, X., & Foegeding, E. A. (2011). Modulation of physicochemical andconformational properties of kidney bean vicilin (phaseolin) by glycation withglucose: Implications for structure-function relationships of legume vicilins.Journal of Agricultural and Food Chemistry, 59, 10114–10123.
Wanasundara, P. K. J. P. D., & Shahidi, F. (2003). Flaxseed proteins: potential foodapplications and process-induced changes. In Flaxseed in human nutrition (2nded., pp. 387–403). AOCS Press.
Weisdorf, S. A. (1989). Nutrition in liver disease. In E. Lebenthal (Ed.), Textbook ofgastroenterology and nutrition in infancy (2nd ed., pp. 665–675). Raven Press.
Yin, S.-W., Huang, K.-L., Tang, C.-H., Yang, X.-Q., Wen, Q.-B., & Qi, J.-R. (2011a).Surface charge and conformational properties of phaseolin, the major globulinin red kidney bean (Phaseolus vulgaris L.): Effect of pH. International Journal ofFood Science and Technology, 46, 1628–1635.
Yin, S.-W., Tang, C.-H., Yang, X.-Q., & Wen, Q.-B. (2011b). Conformational study ofred kidney bean (Phaseolus vulgaris L.) protein isolate (KPI) by tryptophanfluorescence and differential scanning calorimetry. Journal of Agricultural andFood Chemistry, 59, 241–248.
Yin, S.-W., Tang, C.-H., Wen, Q.-B., & Yang, X.-Q. (2010a). Conformational andthermal properties of phaseolin, the major storage protein of red kidney bean(Phaseolus vulgaris L.). Journal of the Science of Food and Agriculture, 91, 94–99.
Yin, S.-W., Tang, C.-H., Wen, Q.-B., Yang, X.-Q., & Yuan, D.-B. (2010b). Therelationships between physicochemical properties and conformationalfeatures of succinylated and acetylated kidney bean (Phaseolus vulgaris L.)protein isolates. Food Research International, 43, 730–738.