effects of global climate change at the virginia coast reserve
TRANSCRIPT

Effects of Global Climate Change at VCR Page 1
Effects of Global Climate Change at the Virginia Coast Reserve
REPORT FROM THE VIRGINIA COAST RESERVE CLIMATE CHANGE THREATS WORKSHOP
A PROJECT FUNDED BY THE VIRGINIA ENVIRONMENTAL ENDOWMENT

THE NATURE CONSERVANCY IN VIRGINIA JUNE 2011

Effects of Global Climate Change at the Virginia Coast Reserve
REPORT FROM THE VIRGINIA COAST RESERVE CLIMATE CHANGE THREATS WORKSHOP
A PROJECT FUNDED BY THE VIRGINIA ENVIRONMENTAL ENDOWMENT
THE NATURE CONSERVANCY IN VIRGINIA
JUNE 2011
PLEASE DIRECT INQUIRES AND COMMENTS TO
Steve Parker, Director TNC/ Virginia Coast Reserve
P.O. Box 158, 11332 Brownsville Road Nassawadox, VA 23219 Phone: (757) 442-3049 Email: [email protected]
OR
Gwynn Crichton, Senior Conservation Projects Manager
TNC/ Virginia Chapter 490 Westfield Road
Charlottesville, VA 22901 Phone: (434) 951-0571
Email: [email protected]
TO DOWNLOAD A COPY OF THIS REPORT AND OTHER MATERIALS RELATED TO THE EASTERN SHORE CLIMATE CHANGE ADAPTION PROJECT, PLEASE VISIT: ://CONSERVEONLINE.ORG/WORKSPACES/E-
SHORE-VA-CC-ADAPTATION


Effects of Global Climate Change at VCR Page i
Acknowledgements The Nature Conservancy would like to thank all the workshop participants who lent their time and expertise in contributing to and informing this report.
• Marcia Berman , Virginia Institute of Marine Science • Mark Brinson , East Carolina University • Dave Byrd, US Fish and Wildlife Service • Bob Christian, East Carolina University • Mary Conley, The Nature Conservancy • Bridgett Costanzo, U.S. Fish and Wildlife Service • Gwynn Crichton, The Nature Conservancy • Judy Dunscomb, The Nature Conservancy • Mike Erwin , University of Virginia • Mike Fenster , Randolph Macon/LTER • Brian Hasty, Virginia Commonwealth University • Lou Hinds, Chincoteague National Wildlife Refuge • Ben Horton , University of Pennsylvania • Bill Kittrell, The Nature Conservancy • Mark Luckenbach , Virginia Institute of Marine Science • Karen McGlathery, University of Virginia • Laura McKay, Virginia Coastal Zone Management Program • Laura Moore, University of Virginia • Jack Musick , Virginia Institute of Marine Science • Jay Odell , The Nature Conservancy • George Oertel , Old Dominion University • Bob Orth , Virginia Institute of Marine Science • Paula Pratolongo, East Carolina University • William Reay, Virginia Institute of Marine Science • Enrique Reyes , East Carolina University • Laura Reynolds, University of Virginia • Joe Scalf, The Nature Conservancy • Art Schwartzchild , University of Virginia • Gary Speiran, U.S. Geological Survey • Steve Parker, The Nature Conservancy • Tim Tear, The Nature Conservancy • Barry Truitt, The Nature Conservancy • Bryan Watts , College of William and Mary • Pat Wiberg , University of Virginia • Alexandra Wilke, The Nature Conservancy • Rob Young, Western Carolina University • Don Young , Virginia Commonwealth University

Effects of Global Climate Change at VCR Page ii
• Richard Zimmerman, Old Dominion University • Carl Zimmerman , Assateague Island National Seashore
Special thanks to Pam Crosby, Steve Parker, Rachel Michaels, Jodi Smith, Laura Reynolds, Joe Scalf, and Alex Wilke. This project is made possible through generous grant funding from the Virginia Environmental Endowment.
©Barry Truitt Cover photo credits: left to right: Barry Truit, Hal Brindley and Hal Brindley

Effects of Global Climate Change at VCR Page iii
Executive Summary Executive Summary Since 1969, The Nature Conservancy has worked with public and private partners to protect 41,150 acres of Virginia’s Eastern Shore, which combined with the 67,520 acres under state and federal ownership, form the Virginia Coast Reserve (VCR). The 65-mile long Virginia barrier island chain is considered to be the best example of a naturally functioning barrier island system on the Atlantic seaboard, known best as a globally important concentration area for migratory and breeding coastal birds. Moreover, the natural island chain provides one of the best studied natural “laboratories” of mixed-energy (wave- and tide-influenced) barrier island systems in the world, having been the subject of the National Science Foundation-funded VCR Long-Term Ecological Research (LTER) project managed by the University of Virginia since 1986. Historically, conservation work at VCR has focused on abating the threat of incompatible development, habitat management and enhancement of barrier islands for breeding and migratory water and shore birds, restoration of coastal bays and lagoons, and restoration of upland forests for songbird habitat. Today, we understand that global climate change will profoundly affect coastal habitats throughout the world, and investments in protection and restoration may not ensure the future viability of the barrier islands, marshes, and lagoons at VCR. Accelerated sea-level rise, changing frequency and intensity of storms, warming air and water temperatures, increasing variability in seasonal and annual precipitation, and increased levels of CO2 in the air and in sea water could dramatically affect the location and distribution of physical habitats and species at VCR, fundamentally altering the processes that maintain them. To better assess the local effects of these global changes, The Nature Conservancy has launched a climate change adaptation project for VCR and the Eastern Shore as a whole to characterize the current understanding of potential ecological impacts due to climate change, and to identify strategies that may enhance resilience and facilitate adaptation of this globally important coastal area. Through outcomes of two expert workshops and literature reviews summarized in a draft report, we have sought to address how VCR conservation resources will be altered by
©Nick Caloyianis Productions
Effects of Global Climate Change at VCR Page iv
climate change. We examined effects to four ecosystems: barrier islands, coastal bays and lagoons, tidal salt marshes, and uplands. For all four of these ecosystems, we have developed hypotheses of how the resources might change due to specific climate factors and, where possible, identified key thresholds where ecosystems are likely to undergo a state change. For the purposes of this project, we have made the following assumptions:
• By 2100, sea level will rise by approximately 1 meter, air temperature will increase between roughly 3.5°F and 8°F, resulting in indeterminate increases in water temperature of coastal bays.
• Increased intensity and frequency of storms is highly uncertain, but increases in storm surges and flooding are very certain due to sea-level rise.
• Winters will be wetter, and summers will be drier with more days per year above 90°F.
• Multi-year droughts will be more frequent and severe. • Oceans will become more acidic.
We concluded that three climate factors have the greatest potential to cause the most significant alterations to the ecological systems of the Eastern Shore:
• Accelerated sea-level rise and associated storm activity • Increasing sea-water temperature • Annual and seasonal precipitation extremes
The following alterations due to sea-level rise and associated storm activity should be of high concern for future management of ecosystems on the Eastern Shore: • Accelerated barrier island rollover and landward migration, including beach erosion,
severe dune erosion or destruction, widespread dune breaching, loss of maritime forest and scrub/shrub habitat, and extensive overwash.
• Landward transgression of mainland marshes into upland areas; decrease in lateral extent of marsh islands and island fringe marshes; conversion of marshes to open water and mudflats.
• Increased incidences of drowned colonial water bird and shorebird nests on marsh islands (and to a lesser extent in overwash zones of barrier islands), reducing productivity of birds and displacing breeding colonies and pairs to higher ground where they will be more vulnerable to predation by mammals and aggressive gull species.
• Loss of high marsh along mainland edge by phragmites invasion and flooding, thereby reducing habitat for breeding sparrows and rails.
• Loss of perennial freshwater stream habitat due to storm surges and coastal inundation reaching further upstream, resulting in extirpation of unique freshwater fish assemblages and other aquatic communities.
• Loss of, or stress to, forest along seaward margin of mainland uplands due to flooding and inundation, resulting in increased susceptibility of disease and insects as well as reduced habitat availability, both of which lead to reduction in available food resources for migrating neotropical land birds.

Effects of Global Climate Change at VCR Page v
The following alterations due to increasing water temperatures should be of high concern for future management of ecosystems on the Eastern Shore: • Die-off and extirpation of eelgrass from Virginia’s coastal bays. • Increased rates of disease, predation and number of invasive species affecting oysters,
eelgrass and benthic invertebrate communities. Finally, the following alterations due to annual and seasonal precipitation extremes should be of high concern for future management of ecosystems on the Eastern Shore: • Loss of perennial freshwater stream habitat due to decreases in groundwater
discharges, resulting in extirpation of unique freshwater fish assemblages and other aquatic communities.
• Increasing stress to forests due to reduced groundwater levels during growing season, including potential mortality of deciduous soft-mast producing forest understory species due to multi-year droughts, resulting in reduced food resources of migrating neotropical land birds.
It must be noted that there will be winners and losers among the diverse assemblages of species and communities on the Eastern Shore. While projected changes to some ecological systems and species are equivocal or appear to be beneficial, monitoring and management programs must continue to track how climate change factors may affect these species.
Finally, we acknowledge the inherent uncertainty in hypothesizing future changes due to climate change in a highly dynamic, ever-changing system. We hope to address many of the critical outstanding questions raised in this project through collaboration with the LTER, VIMS and other academic and agency partners on the Eastern Shore to better adapt our conservation strategies to improve resilience of VCR ecological systems. In the immediate future, we are collaborating with researchers at the LTER to use LiDAR data to model habitat changes under future climate scenarios including sea-level rise to identify hotspots of vulnerability and resiliency. We will couple the results of this model with the findings from our report to fully inform the development of future adaptation strategies for managing ecological systems of the Eastern Shore.
©Hal Brindley

Effects of Global Climate Change at VCR Page vi

Effects of Global Climate Change at VCR Page vii
Table of Contents
Acknowledgements ..................................................................................................................................... i
Executive Summary ................................................................................................................................... iii
Introduction ................................................................................................................................................. 1
Methods........................................................................................................................................................ 4
Understanding the Potential Ecological Impacts of Climate Change ........................................... 5 Formulating Specific Ecological “Hypotheses of Change” and Determining Most Critical Climate-Induced Threats to Address ........................................................................................................ 6
Results: Barrier Island Group ................................................................................................................. 12
Barrier Island Ecological System ............................................................................................................ 12 Barrier Island/ Lagoon Breeding Birds ................................................................................................ 16 Migratory Shorebirds .................................................................................................................................. 20
Results: Coastal Bays and Lagoons Group .......................................................................................... 23
Submerged Aquatic Vegetation ............................................................................................................... 23 Oysters ............................................................................................................................................................... 26 Tidal Mudflats ................................................................................................................................................. 28
Results: Tidal Salt Marsh Group ............................................................................................................ 29
Tidal Salt Marsh System ............................................................................................................................. 29 Marsh-Specific Breeding Birds ................................................................................................................. 34
Results: Upland Habitats ......................................................................................................................... 37
Freshwater Streams and Non-tidal Wetlands .................................................................................... 37 Migratory Landbirds and Raptors .......................................................................................................... 39
Conclusions and Next Steps ................................................................................................................... 42
References ................................................................................................................................................. 45
Appendices
Effects of Global Climate Change at VCR Page viii
List of Figures Figure 1. The Nature Conservancy’s Conservation Action Planning process P. 4 Figure 2. Threat rating system used to evaluate climate change factors. P. 7 Figure 3. Certainty ranking for qualifying threat ratings for each climate change factor. P. 7 Figure 4. Conceptual model of potential global climate change effects on Virginia barrier islands
P. 15
Figure 5. Conceptual model of potential global climate change effects on breeding barrier island birds at the Virginia Coast Reserve
P. 18
Figure 6. Integrated conceptual ecological model of potential effects of global climate change at the Virginia Coast Reserve
P. 19
Figure 7. Conceptual model of potential global climate change effects on beach-specific migratory shorebirds at the Virginia Coast Reserve
P. 21
Figure 8. Conceptual model of potential global climate change effects on seagrass at VCR P. 24 Figure 9. Conceptual model of potential global climate change effects on oyster reefs at VCR P. 26 Figure 10. Conceptual model of potential global climate change effects on tidal salt marshes at VCR
P. 32
Figure 11. Conceptual model of potential global climate change effects on tidal salt marsh birds at VCR
P. 35
Figure 12. Conceptual model of potential global climate change effects on freshwater streams at VCR
P. 38
Figure 13. Conceptual model of potential global climate change effects on migratory landbirds at VCR
P. 40
Map 1. Conservation lands of Virginia Coast Reserve P. 3 List of Tables Table 1. Conservation target groups, descriptions and key ecological attributes used for VCR Climate Change Threats Workshop.
p. 8
Table 2. Summary of climate change effects and predicted changes over next century based on current literature.
p. 11
Table 3. Hypotheses and thresholds of change to barrier island ecological system due to global climate change factors.
p. 14
Table 4. Hypotheses and thresholds of change to barrier island and lagoon breeding birds due to global climate change factors.
p. 17
Table 5. Hypotheses and thresholds of change to migratory shorebirds due to global climate change factors.
p. 21
Table 6. Hypotheses and thresholds of change to eelgrass due to global climate change factors. p. 23 Table 7. Hypotheses and thresholds of change to oysters due to global climate change factors. p. 26 Table 8. Hypotheses and thresholds of change to tidal mudflats due to global climate change factors
p. 27
Table 9. Summary of marsh sedimentation rates documented in and near the Virginia Coast Reserve
p. 29
Table 10. Hypotheses and thresholds of change to tidal salt marshes due to global climate change factors
p. 31
Table 11. Hypotheses and thresholds of change to tidal salt marsh birds due to global climate change factors
p. 34
Table 12. Hypotheses and thresholds of change to freshwater streams and non-tidal wetlands due to global climate change factors
p. 37
Table 13. Hypotheses and thresholds of change to migratory landbirds p. 40
Effects of Global Climate Change at VCR Page 1
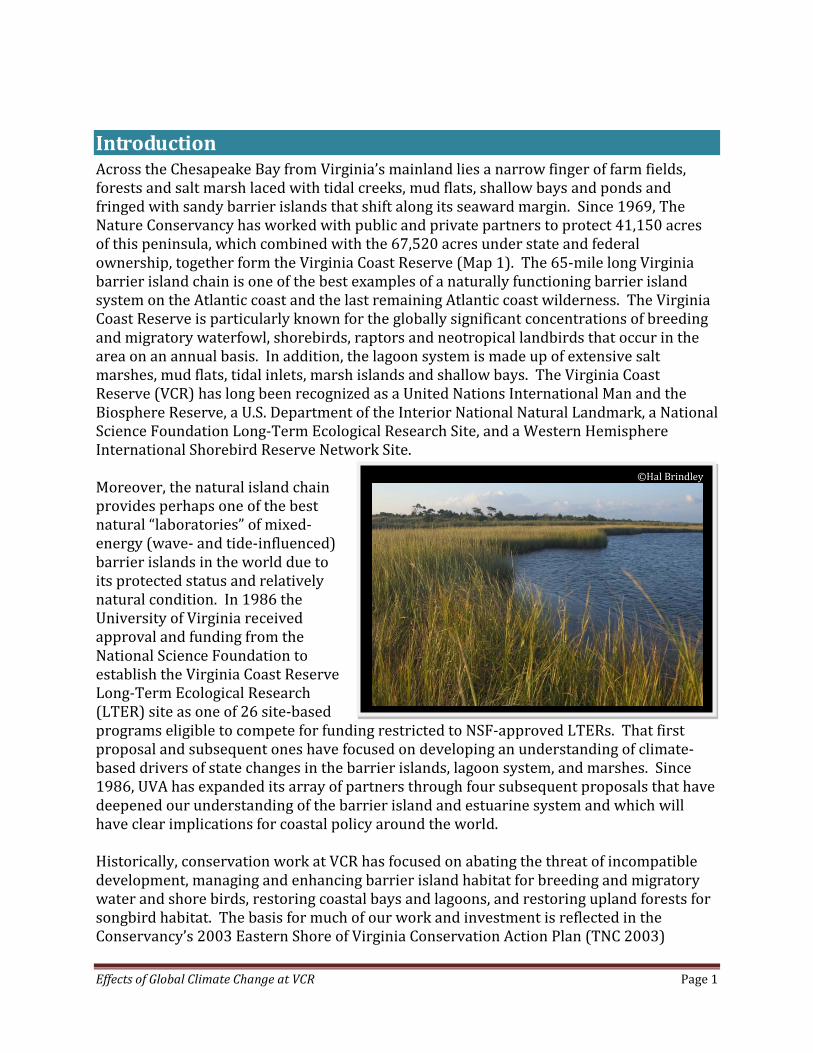
Introduction Across the Chesapeake Bay from Virginia’s mainland lies a narrow finger of farm fields, forests and salt marsh laced with tidal creeks, mud flats, shallow bays and ponds and fringed with sandy barrier islands that shift along its seaward margin. Since 1969, The Nature Conservancy has worked with public and private partners to protect 41,150 acres of this peninsula, which combined with the 67,520 acres under state and federal ownership, together form the Virginia Coast Reserve (Map 1). The 65-mile long Virginia barrier island chain is one of the best examples of a naturally functioning barrier island system on the Atlantic coast and the last remaining Atlantic coast wilderness. The Virginia Coast Reserve is particularly known for the globally significant concentrations of breeding and migratory waterfowl, shorebirds, raptors and neotropical landbirds that occur in the area on an annual basis. In addition, the lagoon system is made up of extensive salt marshes, mud flats, tidal inlets, marsh islands and shallow bays. The Virginia Coast Reserve (VCR) has long been recognized as a United Nations International Man and the Biosphere Reserve, a U.S. Department of the Interior National Natural Landmark, a National Science Foundation Long-Term Ecological Research Site, and a Western Hemisphere International Shorebird Reserve Network Site. Moreover, the natural island chain provides perhaps one of the best natural “laboratories” of mixed-energy (wave- and tide-influenced) barrier islands in the world due to its protected status and relatively natural condition. In 1986 the University of Virginia received approval and funding from the National Science Foundation to establish the Virginia Coast Reserve Long-Term Ecological Research (LTER) site as one of 26 site-based programs eligible to compete for funding restricted to NSF-approved LTERs. That first proposal and subsequent ones have focused on developing an understanding of climate-based drivers of state changes in the barrier islands, lagoon system, and marshes. Since 1986, UVA has expanded its array of partners through four subsequent proposals that have deepened our understanding of the barrier island and estuarine system and which will have clear implications for coastal policy around the world. Historically, conservation work at VCR has focused on abating the threat of incompatible development, managing and enhancing barrier island habitat for breeding and migratory water and shore birds, restoring coastal bays and lagoons, and restoring upland forests for songbird habitat. The basis for much of our work and investment is reflected in the Conservancy’s 2003 Eastern Shore of Virginia Conservation Action Plan (TNC 2003)
©Hal Brindley

Effects of Global Climate Change at VCR Page 2
developed through collaboration with federal, state and local partners. In this plan, accelerated sea-level rise and other stressors caused by human-induced climate change were assessed superficially as we did not at that time fully appreciate the potential consequences for the natural island-lagoon complex at VCR. Today, we understand that global climate change will profoundly affect coastal habitats throughout the world, and investments in protection and restoration may not ensure the future viability of the barrier islands, marshes, and lagoons at VCR. Accelerated sea-level rise, changing frequency and intensity of storms, altered patterns of precipitation, warming air and water temperature and ocean acidification could dramatically affect the location and distribution of physical habitats and species distributions at VCR, and fundamentally alter the processes that maintain them. Due to land subsidence and compaction of sediments, the Mid-Atlantic area is currently experiencing rates of sea-level rise—ranging from 2.4 mm to 4.4 mm per year—that are significantly higher than the global mean of 1.7 mm per year (Williams et al. 2009). Recent studies of ice cover and glacial melting have revealed that ice loss and subsequent melt water contributions are significantly higher than previously predicted in the 2007 Intergovernmental Panel on Climate Change (IPCC) report, and that sea levels will rise by 1 meter or more by 2100 (Williams et al. 2009).
In recent years, many proceedings and papers have been published regarding global climate change effects. However, for predictive models and theories regarding climate change to have meaning for natural area managers, these results must be scaled down to the site level by the application of local knowledge (Willis and Bhagwat 2009). Toward this end, The Nature Conservancy has launched a climate change adaptation project for VCR to characterize the current understanding of potential
ecological impacts due to climate change at VCR, and to identify strategies that may enhance resilience and facilitate adaptation of this globally important coastal area. The Conservancy received grant funds from the Virginia Environmental Endowment and the Wildlife Conservation Society to facilitate workshops with local and regional academic experts and natural resource managers to meet these objectives. Our first workshop in February 2009 brought together 30 academic experts and researchers from 12 institutions to characterize local climate change effects to ecological systems at VCR and the associated uncertainty with these effects. The synthesized outcomes of the workshop include an integrated conceptual model that depicts hypotheses of change to ecological systems resulting from climate stressors such as sea-level rise and warmer water temperatures. The following report represents the proceedings from this
©Joe Scalf
Effects of Global Climate Change at VCR Page 3
workshop. These results will inform the Conservancy’s development of adaptation strategies at VCR over the short and long term to guide conservation investments that help ensure the maximum resilience of existing biodiversity, natural systems and habitats, as well as attempt to forecast and manage for possible new conservation targets. The workshop to develop these strategies will be held in August 2010.
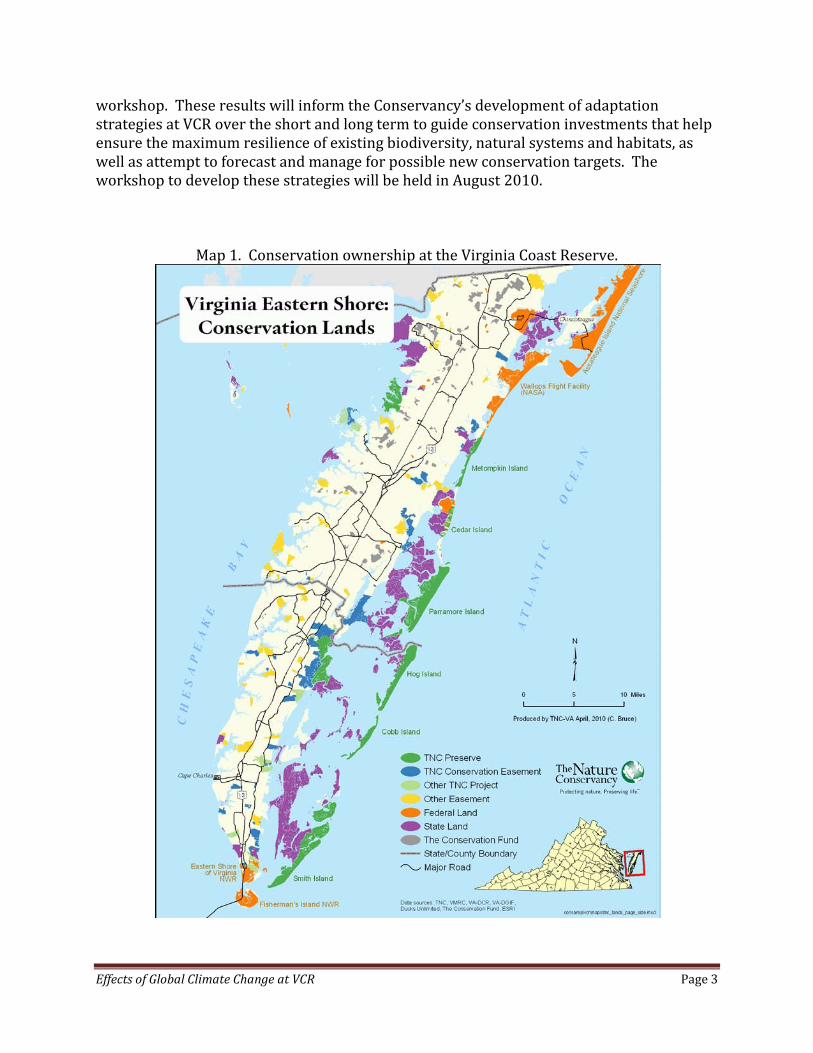
Map 1. Conservation ownership at the Virginia Coast Reserve.

Effects of Global Climate Change at VCR Page 4
Methods The VCR Climate Change Threats Workshop was structured to be consistent with the Nature Conservancy’s Conservation Action Planning process (TNC 2007) and the Open Standards for the Practice of Conservation developed by the Conservation Measures Partnership (CMP 2007) as well as Conservation Action Planning Guidelines for Developing Strategies in the Face of Climate Change (TNC 2009). These guidelines in particular reflect the work of a recent publication by the National Climate Science Center entitled Adaptation Options for Climate-Sensitive Ecosystems and Resources (Kareiva et al. 2009). In brief, the Conservation Action Planning (CAP) process includes identifying targets of conservation value at multiple scales (species, communities, ecological systems), evaluating the viability and threats of selected targets, and developing conservation strategies for threat abatement and restoration in the project area. Moreover, Conservation Action Planning is based on the principles of adaptive management in which conservation measures and monitoring are used to evaluate the effectiveness of conservation actions and modify strategies over time. Guidelines for adapting CAPs to better incorporate climate change threats include focus on helping managers answer the question: How can we improve project-based strategies and actions given the realities of conservation in a changing climate? The following guidelines are recommended for project teams to develop adaptation strategies: Step 1 – Understand the potential ecological effects of climate change Step 2 – Formulate specific ecological “hypotheses of change” Step 3 – Determine which climate-induced threats are most critical to address Step 4 – Explore potential human responses to climate change Step 5 – Evaluate whether potential climate effects fundamentally change the project Step 6 – Develop adaptation strategies and evaluate their feasibility and cost Step 7 – Develop measures, implement, adapt and learn
Figure 1. The Nature Conservancy’s Conservation Action Planning process.

Effects of Global Climate Change at VCR Page 5
The focus of this report is fulfillment of steps 1-3. See Appendix A for an annotated method. Steps 4-7 will be the subject of the second phase of this project. Specifically, we did not address the human responses to climate change in the threats workshop as our focus was how the mostly wild and unaltered barrier islands and coastal bay system will be altered by climate change factors. However, we recognize that, while the Virginia barrier island and lagoon system is mostly protected and in conservation ownership, human responses to climate change will have potential to further alter natural systems in tangible and lasting ways. Human responses to climate change will be addressed in phase two of this project on adaptation strategies. Understanding the Potential Ecological Effects of Climate Change The central question of this project is whether climate change will alter VCR conservation targets (i.e. native representative and imperiled ecological systems, natural communities and species that are focus of conservation action), and if, so how? In order to address this question, we identified a subset of conservation targets from the VCR Conservation Action Plan deemed most vulnerable to climate change. These are represented by four target groups (Table 1): barrier islands, coastal bays and lagoons, tidal salt marshes and upland habitats. Each group captures individual habitats and associated breeding and migratory bird species. Detailed descriptions of these targets may be found in Appendix B. Next, we identified the key ecological attributes (KEAs) for each conservation target most vulnerable to climate change effects (Table 1). A key ecological attribute is a critical component of a conservation target’s life history, physical processes, community interaction, habitat or interaction with other species that maintains the viability of the target. We considered such attributes of the conservation target that, if degraded or missing, would seriously jeopardize that target’s ability to persist over time. It is presumed that if a target’s KEAs are healthy, then the target will be resilient to change in its structure and composition in the face of external stresses. For each target, we evaluated the degree of alteration experienced by the target’s individual KEAs due to a specific climate change factor like sea-level rise. Based on literature reviews, we selected four climate change factors most likely to adversely impact coastal conservation targets: accelerated sea-level rise and storminess, air temperature and precipitation extremes, increased sea water temperature, and ocean acidification. For individual targets, participants considered other effects of climate change such as CO2 enrichment of emergent vegetation. Each of these climate change factors are
©D. Aygen

Effects of Global Climate Change at VCR Page 6
defined and short summaries on the current state of knowledge about trends for each are provided in Appendix C. It is important to note that the focus of this workshop was not to debate the probability of specific predictions or the legitimacy of the models used for projections regarding these climate change factors. Rather, our focus was to determine critical thresholds that may exist for conservation targets, which, if crossed, threaten the target’s ability to persist over time. Formulating Specific Ecological “Hypotheses of Change” and Determining Most Critical Climate-Induced Threats to Address To develop hypotheses of change about climate change effects, we asked participants in the workshop to develop box-and-arrow conceptual ecological models to describe the complex interactions between the effects of climate change identified above and the specific key ecological attributes of the conservation targets at VCR. As part of this exercise, participants described hypotheses of change and/or key thresholds where conservation targets were likely to undergo a state change due to the effects of global climate change. A state change occurs when target transforms into a different habitat or system. Overall, these hypotheses of change are essentially statements about the “vulnerability” of the system, the combination of “exposure” and inherent “sensitivity” of the ecology of the focal conservation targets (TNC 2009). Using the individual conceptual ecological models for the three conservation target groups, we developed an illustrated conceptual model that integrates all targets to show the interactions among these tightly linked and dynamic systems. We synthesized the information captured in the conceptual ecological models and arranged it in tables clearly articulating the key thresholds or hypothesis about a given climate change effect on a specific key ecological indicator. As part of this step in the process, we asked participants to rank the predicted level of threat or alteration associated with each climate change factor acting upon each key ecological attribute of a target using the rating system found in Figure 2. We asked participants to qualify their threat rating based on their degree of certainty defined by published scientific literature (Figure 3). Where possible, we captured references to information about existing indicators and data regarding altered KEAs. Except where noted, we used a 100-year time horizon in evaluating climate change effects, thresholds and hypotheses of change for the conservation targets at VCR. While there is inherent uncertainty in this horizon, many of the current models and projections use 2100
©Bowdoin Lusk

Effects of Global Climate Change at VCR Page 7
as a benchmark for change, and therefore we deemed a century horizon as appropriate to the greater scientific context of our work. In the results section, we present narrative summaries of the discussions of the three target groups, a simplified version of the conceptual ecological models depicting relationships between the climate change factors and the target’s key ecological attributes, and a table summarizing the hypothesis of change and level of certainty regarding each key ecological attribute.
Figure 2. Threat rating system used to evaluate climate change factors. Rank Description Very High
The factor is likely to destroy or eliminate the conservation target over some portion of the target's occurrence at the site or cause a state change.
High Likely to seriously degrade or alter the conservation target over some portion of the target's occurrence at the site.
Medium Likely to moderately degrade or alter the conservation target over some portion of the target's occurrence at the site.
Low Likely to only slightly impair the conservation target over some portion of the target's occurrence at the site.
Figure 3. Certainty ranking for qualifying threat ratings for each climate change factor. Rank Description High Studies within the VCR document this relationship Medium Studies outside of the VCR document this relationship Low Relationship is hypothesized, but has been studied.
©Alex Wilke
Effects of Global Climate Change at VCR Page 8
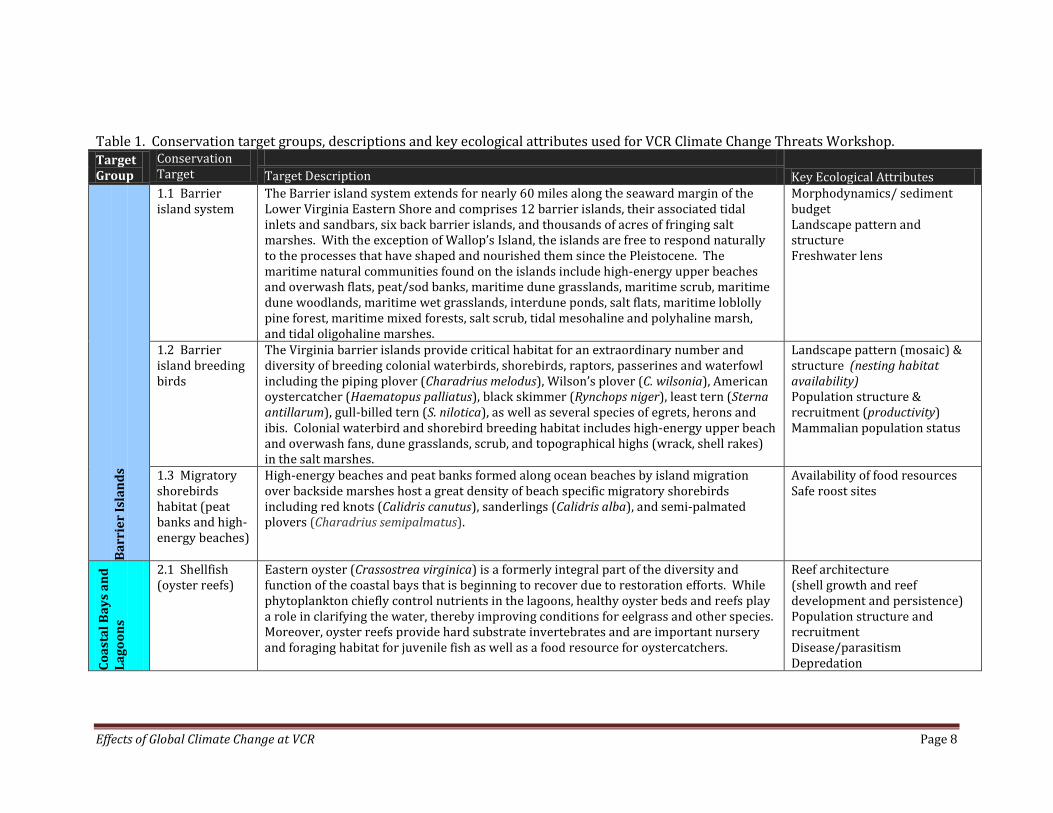
Table 1. Conservation target groups, descriptions and key ecological attributes used for VCR Climate Change Threats Workshop. Target Group
Conservation Target
Key Ecological Attributes Target Description
Bar
rier
Isla
nd
s
1.1 Barrier island system
The Barrier island system extends for nearly 60 miles along the seaward margin of the Lower Virginia Eastern Shore and comprises 12 barrier islands, their associated tidal inlets and sandbars, six back barrier islands, and thousands of acres of fringing salt marshes. With the exception of Wallop’s Island, the islands are free to respond naturally to the processes that have shaped and nourished them since the Pleistocene. The maritime natural communities found on the islands include high-energy upper beaches and overwash flats, peat/sod banks, maritime dune grasslands, maritime scrub, maritime dune woodlands, maritime wet grasslands, interdune ponds, salt flats, maritime loblolly pine forest, maritime mixed forests, salt scrub, tidal mesohaline and polyhaline marsh, and tidal oligohaline marshes.
Morphodynamics/ sediment budget Landscape pattern and structure Freshwater lens
1.2 Barrier island breeding birds
The Virginia barrier islands provide critical habitat for an extraordinary number and diversity of breeding colonial waterbirds, shorebirds, raptors, passerines and waterfowl including the piping plover (Charadrius melodus), Wilson’s plover (C. wilsonia), American oystercatcher (Haematopus palliatus), black skimmer (Rynchops niger), least tern (Sterna antillarum), gull-billed tern (S. nilotica), as well as several species of egrets, herons and ibis. Colonial waterbird and shorebird breeding habitat includes high-energy upper beach and overwash fans, dune grasslands, scrub, and topographical highs (wrack, shell rakes) in the salt marshes.
Landscape pattern (mosaic) & structure (nesting habitat availability) Population structure & recruitment (productivity) Mammalian population status
1.3 Migratory shorebirds habitat (peat banks and high-energy beaches)
High-energy beaches and peat banks formed along ocean beaches by island migration over backside marshes host a great density of beach specific migratory shorebirds including red knots (Calidris canutus), sanderlings (Calidris alba), and semi-palmated plovers (Charadrius semipalmatus).
Availability of food resources Safe roost sites
Coas
tal B
ays
and
La
goon
s
2.1 Shellfish (oyster reefs)
Eastern oyster (Crassostrea virginica) is a formerly integral part of the diversity and function of the coastal bays that is beginning to recover due to restoration efforts. While phytoplankton chiefly control nutrients in the lagoons, healthy oyster beds and reefs play a role in clarifying the water, thereby improving conditions for eelgrass and other species. Moreover, oyster reefs provide hard substrate invertebrates and are important nursery and foraging habitat for juvenile fish as well as a food resource for oystercatchers.
Reef architecture (shell growth and reef development and persistence) Population structure and recruitment Disease/parasitism Depredation

Effects of Global Climate Change at VCR Page 9
Target Group
Conservation Target
Key Ecological Attributes Target Description
2.2 Submerged aquatic vegetation
Eelgrass (Zostera marina L.) is a marine flowering plant that grows in subtidal regions of the coastal bays and is the major seagrass in the Virginia coastal bays. Similar to the shellfish reefs, eelgrass meadows provide numerous ecological services, including food, nursery spawning and refuge locations for blue crab, bay scallops and numerous other invertebrates and fish species. In addition, the complex networks of leaves, roots and rhizomes serve to trap and utilize nutrients and sediments, and dampen wave action. Through restoration efforts over the last five years, eelgrass meadows are beginning to re-colonize lagoons from Cedar Island south.
Landscape structure and connectivity Species composition / dominance Disease/ parasitism Sediment stability and movement (light regime)
2.3. Tidal mudflats
Intertidal mudflats are sedimentary habitats, comprised primarily of silt and clays, created by deposition in low energy coastal environments. They are associated with high biological productivity and abundance species, but low species diversity. These habitats are recognized as important feeding areas for a variety of bird species such as whimbrels (Numenius phaeopus), black-bellied plovers (Pluvialis squatarola), dowitchers (Limnodromus spp.), and dunlins and various sandpipers (Calidris spp.). Subtidal mudflats represent unvegetated bottom habitat within the lagoon system and may be a rich source of macroalgae. Most of the tidal habitat in Virginia’s coastal bays and lagoons (36K hectares) is intertidal, twice as much as the subtidal (18K ha) habitat.
Sediment and stability movement Abundance of food resources for fish and birds Species composition/dominance (invasive species)
Tid
al S
alt
Mar
shes
3.1 Tidal saltmarshes
Tidal saltmarshes are intertidal wetlands typically located fringing the backside of barrier islands, in the coastal lagoon as marsh islands, and along the mainland. Two primary communities occur in the coastal bays: high marsh characterized by Spartina patens and Distichlis spicata occurring in higher elevations along the mainland interface and low marsh, the more extensive type found at lower elevations, characterized by Spartina alterniflora and D. spicata. Numerous critical ecological functions are provided by salt marshes, including shoreline stabilization, fish and wildlife habitat, nutrient and sediment cycling and sequestration, and serving as the basis of primary production within the lagoon system. Eastern Shore seaside marine food webs are in large part powered by the annual primary productivity of over 80,000 acres of tidal salt marsh habitat.
Size / extent of characteristic communities Species composition / dominance Soil / sediment stability & movement Water level fluctuations (tidal amplitude and residence time) Water chemistry (surface and pore water salinity)
3.2 Marsh-specific breeding birds
High marsh is critical foraging and breeding habitat for saltmarsh sharp-tailed sparrow (Ammodramus caudacutus), seaside sparrow (Ammodramus maritimus), and clapper rails (Rallus longirostris). The lagoon marsh islands (“low marsh”) of VCR are known to be critical wintering, foraging, roosting and breeding habitat for breeding colonial water nesting birds like black skimmers, Larus gulls, common terns (Sterna hirundo), gull-billed terns (S. nilotica), royal (S. maxima) and Caspian terns (S. caspia), and the Forster’s tern (S. fosteri), a marsh-nesting obligate. Lagoon marshes are prime wintering habitat for black ducks (Anas rubripes) which nest in the maritime provinces of Canada.
Landscape pattern (mosaic) & structure (nesting habitat availability) Population structure & recruitment (productivity) Availability of food resources

Effects of Global Climate Change at VCR Page 10
Target Group
Conservation Target
Key Ecological Attributes Target Description
Up
lan
d H
abit
ats
4.1 Migratory landbirds and raptors
Each fall millions of migratory landbirds (representing nearly 200 species) and raptors funnel through the southern Delmarva Peninsula, making the mainland one of the most important stopover and staging areas along the Atlantic flyway and in the eastern United States. Migratory landbirds stopover and forage in upland mixed hardwood forest and riparian and bottomland forest habitat before flying south en route to wintering grounds. The majority of neotropical migrants utilizing the peninsula mainland are young of the year, likely funneled to the Eastern Shore by cold fronts and prevailing winds.
Average body mass index per individual species Stopover energy dynamics (density of birds per hectare per day)
4.2 Non-tidal freshwater streams and wetlands
Non-tidal, freshwater perennial and intermittent streams occur along both seaside and bayside stretches of the Eastern Shore fed largely by the sole source groundwater aquifer. These streams support a distinct Coastal Plain fish community including chubs, minnow, darters and diadromous fishes such as American eel, hickory and American shad as well as a typical Coastal Plain macroinvertebrate community. While similar streams occur throughout the Coastal Plain province, the streams of Eastern Shore are distinct because of their unique zoogeographic position and young geologic age. Non-tidal freshwater wetlands on the Eastern Shore include sea level fens and acidic seepage swamps (both groundwater fed) and seasonal depression wetlands like non-riverine wet hardwood forests.
Hydrologic regime and water chemistry Freshwater habitat size and distribution Native fish assemblages

Effects of Global Climate Change at VCR Page 11
Table 2. Summary of climate change effects and predicted changes over next century based on current literature. Factor Predicted Changes Potential Effects Sea level rise and storm frequency / intensity
• Sea levels will rise by 1 meter or more by 2100 (Williams et al. 2009). Based on tidal gauge observations, the Mid-Atlantic’s rate of sea-level rise ranges from 2.4 mm to 4.4 mm per year—compared to the global rate of 1.7 mm per year (Williams et al. 2009). Average rate of sea-level rise at the Virginia Coast Reserve is approximately 4 mm per year (NOAA 2010).
• Increasing sea surface temperatures due to global climate change may lead to increased intensity of hurricanes (Williams et al. 2009, Emanuel 2005)
• “There are likely to be more frequent deep low-pressure systems (strong storms)… with stronger and more extreme wave heights,” but “evidence in the Atlantic is insufficient to draw a conclusion about changes in [extra-tropical] storm strength” resulting from global climate change (Karl et al. 2008).
• Models currently used to predict changes in storm frequency and intensity with carbon dioxide induced increases in temperature are not in agreement and therefore no conclusions can be made regarding climate-induced increases in storminess in North America (Hayden 1999).
• Land loss through submergence and erosion of lands
• Migration of coastal land forms and habitats • Increased frequency and extent of storm-
related flooding • Wetland losses and change • Saltwater intrusion and increased salinity in
estuaries
Air temperature and precipitation extremes
• Virginia coastal plain predicted to experience a minimum of 2.56°F - 5.08°F temperature increase under low emissions scenarios and a 3.74°F - 8.10°F temperature increase under high emissions scenario (Climate Wizard 2010)
• Under low emissions scenarios, precipitation rates in Virginia’s coastal plain may decrease by 1% or increase by 15%, and under high scenarios, decrease by almost 17% or increase by 18% (Climate Wizard 2010)
• Shorter but wetter winters with fewer freezing days.
• More extreme precipitation levels, including increased downpour events interspersed with more frequent short-term droughts
Increasing water temperature
• Global surface ocean temperatures are predicted to increase between 1.5°C and 2.6°C by 2100 (Nicholls et al. 2007)
• Mortality of organisms and contraction of their geographical ranges
• General shifts in distribution and abundances of a wide range of coastal estuarine species
• Increased eutrophication and harmful algal blooms (HABs)
• Ocean acidification • Increased rates of disease and pathogens
Ocean acidification
• IPCC predicts that pH will fall to 8.00 under a low emissions scenario or to 7.7 under a high emissions scenario by the end of the century (Nicholls et al. 2007).
• Marine organisms are sensitive to a 0.2 drop in pH (Caldeira et al. 2007). • Orr et al. (2005) predict that that dissolved inorganic carbon will decrease 60% in
oceans by 2100
• Widespread reduction in calcium carbonate saturation
• Inhibits the ability of calcareous organisms such as plankton and corals to build shell exo-skeletons

Effects of Global Climate Change at VCR Page 12
Results: Barrier Island Group Barrier Island Ecological System The synergistic nature of the coastal and oceanographic processes – such as sea-level changes and storms – that operate over a wide range of spatial and temporal scales make it difficult to assess site-specific effects of climate change on barrier island systems over some time scales. Additional local/regional factors, such as changes to sediment budgets, basin accommodation (i.e., subsidence rates), antecedent geology, and the role of humans, complicate barrier island change predictions. Currently, sea levels are rising at VCR at rate of 2.4 mm-4.4 mm per year (NOAA 2010). In addition, variable rates of subsidence documented (Erwin et al. 2006a, 2006b) in the southern portion of the islands exacerbate the rate of relative sea-level rise at VCR. The workshop experts agreed that accelerated sea-level rise will amplify the elevation and magnitude of storm surges. Additionally, the intensity and destructiveness of hurricanes (i.e., more category 4 and 5 hurricanes) is expected to increase as sea-surface temperatures increase (Williams et al. 2009, Emanuel 2005). Moreover, the scientific literature suggests that the Virginia barrier islands are sand-starved (Leatherman et al. 1982) as is the Mid-Atlantic coast overall (Wright 1995). The combination of climate-driven changes to sea-level rise and storms, tidal inlet dynamics, sediment supply, and anthropogenic causes ultimately determines the alteration and configuration (morphology) of the barrier islands. In particular, global climate change can influence the relative rates of sea-level rise versus sediment supply that ultimately affect barrier island morphodyamics. For example, if sea-level rise rates exceed the rates of sediment input from an already sand-starved system, we would expect erosion along the island chain to accelerate. Accelerated sea-level rise rates will exacerbate this situation. Engineering structures designed to stabilize islands can also exacerbate downdrift island erosion trends. Workshop participants explored the scenario in which sea-level rise outpaces sediment accretion (Table 3, Figure 4). Overall, the group predicted an accelerated landward retreat of the barrier islands or barrier island transgression (westward migration). In the short term (within100 years), some of the first signs of barrier island transgression will include the flattening and loss of dune structure and resultant loss of island elevation due to higher storm surges and erosion. This situation will in turn lead to greater overwash fans and open beach habitat, and a shrinking freshwater lens on the islands due to increased inundation (Hayden et al. 1995). Over the short term, vegetation will not be able to keep pace with accelerated sea-level rise and associated storms and flooding (Johnson and Young, 1993). Workshop experts suggest that a one-meter rise in sea level could eliminate maritime forest and shrubs on Hog Island, inundating much of the island land mass, because woody species are highly sensitive to saltwater inundation and salt spray. While wax myrtle has increased in cover on the islands of the Virginia Coast Reserve by 50% over the last 30 years (Young et al. 2007), it remains to be seen whether this trend can continue in the face of accelerated sea-level rise.

Effects of Global Climate Change at VCR Page 13
Moreover, while warming air temperatures will expand the northern range of southern maritime forest understory species sable palm and palmetto (Davis and Shaw 2001), salt spray and island rollover due to storms and sea-level rise will drive major changes in landscape pattern and structure long before we see changes in the vegetation composition. In addition to loss of dune structure and increasing overwash habitat, sea-level rise and storm surges may lead to breaches of the barriers in which new inlets are formed. For a new inlet to persist over time, it must have a tidal prism (volume of water exchanged between the back-barrier bay/lagoon and the ocean over a tidal cycle) capable of maintaining the inlet channel. Most new inlets are ephemeral because they don’t have the water flow to maintain them. Inlet formation—ephemeral or not—is only likely to happen north of Parramore Island, where the islands are smaller, narrower and geologically younger than islands to the south, where inlet and island migration is more strongly influenced by deep paleo-river channels and antecedent interfluves (Oertel 2008).
Moreover, with more overwash, fringe marshes may be buried by sediments and eventually convert to mudflats or open water, thereby increasing the tidal prism. The enlarged tidal prism—also produced by accelerated sea-level rise rates—increases the volume of sediment stored within the flood- and ebb-tidal deltas. The increased
sediment sequestration by these large shoals will starve the downdrift barrier islands of sediment leading to accelerated erosion (Fitzgerald et al 2008). Over the long term (more than 100 years), this process may lead to the thinning and fragmentation of the Virginia barrier islands as they continue to move landward (Fitzgerald et al 2008). In a worst case scenario, the island transgression process crosses a threshold that produces a state change in which the islands thin and fragment to the point of becoming shoals or mudflats, join the shoreline, or potentially disintegrate all together. The phenomena of barrier island fragmentation and disintegration resulting from sea-level rise, storms and low sediment supply has been well documented in the Isles Dernieres and Chandeleur Islands, both off the coast of Louisiana (Fitzgerald et al. 2008 and citations therein). However, there is little certainty or conclusive evidence regarding the probability that global climate change will drive the Virginia barrier islands into a similar extreme
©Blue Heron Realty

Effects of Global Climate Change at VCR Page 14
state change. Nevertheless, we know that sea levels are rising here at almost double the global average, significant erosion is taking place on the barrier islands while island land masses are simultaneously subsiding, and the system overall appears sediment limited. We can assume that accelerated sea-level rise and associated storm frequency and intensity due to climate change in combination with these variables threatens to destabilize the current equilibrium state of Virginia’s barrier islands. Current research by coastal geologist Dr. Michael Fenster is ongoing to determine empirically the sediment budget for the Virginia barrier islands and the degree to which the area is sand-starved. The findings of this research, in combination with predictions of sea-level rise and subsidence levels will make it possible to model and identify potential thresholds whereby and when the Virginia barrier islands may approach a state change. Table 3. Hypotheses and thresholds of change to barrier island ecological system due to global climate change factors. Climate factor
KEA Hypothesis of change/ thresholds for change Threat rating
Level of certainty
Sea-level rise/ storminess
Morphodynamics/ sediment budget
If the rate of sea-level rise is greater than sediment input to the system, island will migrate, thin and possibly fragment, which, in turn, become shoals or mudflats or potentially disappear (Fitzgerald et al. 2008).
Medium Medium
Sea-level rise/ storminess
Morphodynamics/ sediment budget
In combination with sea-level rise and diminished sediment supply, an increase in the frequency of Class 4 (severe northeasters) and Class 5 (extreme northeasters) storms (as defined by Dolan and Davis 1992) could cause severe to extreme beach recession and erosion, severe dune erosion or destruction, widespread dune breaching, extensive overwash, and inlet formation (north of Parramore). VCR has had 15 northeasters on average per year from 1885 to 1990 (Hayden & Hayden 2003); however, these storm patterns are extremely variable and cannot be used as a reliable threshold of storm frequency at VCR.
High High
Sea-level rise/ storminess
Landscape pattern and structure
Increases of salinity via inundation will lead to loss of woody vegetation on islands. The salinity threshold leading to stress of wax myrtle (Myrica cerifera), the most dominant shrub on the barrier islands, is between 2 ppt (chronic) and 5 ppt (severe) (Sande and Young 1992). Wax myrtle and groundsel (Baccharis haliminfolia) have a 60% probability of mortality when flooded by mid-salinity concentrations of 10 ppt or greater over 31 consecutive days, and high salinity (>20 ppt) flooding lasting for 11-17 consecutive days will lead to 100% mortality of most woody vegetation on the islands (Tolliver et al. 1997). Loblolly pine will become stressed and die under extended inundation where
High Medium

Effects of Global Climate Change at VCR Page 15
Climate factor
KEA Hypothesis of change/ thresholds for change Threat rating
Level of certainty
salinity concentrations reach between >3-5 ppt (Poulter et al, 2008).
Sea-level rise/ storminess
Landscape pattern and structure
Growing season salt spray events of 5 ppt or greater occurring at a frequency of more than once per 6-8 year interval will cause mortality of woody vegetation on barrier islands, including shrub and forest habitats. (Tolliver et al. 1997 and D. Young, pers. comm.)
High High

Effects of Global Climate Change at VCR Page 16
Barrier Island/ Lagoon Breeding Birds We evaluated the habitats that support significant proportions of breeding coastal bird populations of greatest conservation concern, many of which are restricted to the barrier island/lagoon system (Table 4, Figures 5 and 6). These habitats include open beaches and overwash areas that support oystercatchers, plovers and terns; myrtle/shrub habitat that supports herons and egrets; and dune/ dune grassland habitat that supports black ducks, willets, sparrows and oystercatchers. Open Beach/ Overwash While sea-level rise combined with increased frequency and duration of storm activity will create more overwash and open beach habitat that benefits these beach-nesting species, the associated increase in frequency and/or intensity of precipitation events can flood and destroy nests, drastically reducing productivity of the birds, which would lead to a decrease and destabilization of beach-nesting bird populations (Boettcher et al. 2007, Wilke et al. 2007). According to Wilke et al. (2007), “Overwash events are documented as one of the primary causes of nest loss for American Oystercatchers…. An increase in the frequency of these events could lead to low rates of reproductive success, which would be insufficient to maintain a stable population.” Moreover, Boettcher et al. (2007) state “one of the major impending threats facing piping plovers and other beach nesting species is an increase in the frequency of beach flooding as a result of global climate change and sea-level rise, which may lead to chronic reproductive failure and eventual loss of breeding habitat.” Wilson et al. (2007) state that “Elevation is a primary determinant of storm washover. Open beaches lower than 1.5 m in elevation may be consistently open through repeated washover. Beaches higher than 3 m elevation may only be washed over during large scale storms.” Assessing location and extent of vulnerable low elevation open beach and overwash nesting sites using Light Detecting and Ranging (LiDAR) will be a necessary step in developing adaptation strategies for beach-nesting birds on the islands. Dunes/ Dune Grasslands The group hypothesized that accelerated sea-level rise coupled with persistent major storm events occurring at a frequency of greater than one every three years on the islands will flatten island dunes and prevent future dune rebuilding and persistence. This will in
©Kevin Doyle

Effects of Global Climate Change at VCR Page 17
turn reduce nesting habitat availability for nesting willets, American black ducks, American oystercatchers and sparrows. Over the long term, we will see range changes that involve the northward shifts of warm-season grasses and the loss of sedges and rushes. The dunes will increase in the amount of panic grasses and sea oats that have more of a clumping growth strategy, effecting dune morphology—especially young dunes—by creating more isolated and hummocky dunes. However, effects of these changes to the birds are unknown. Shrub/ Myrtle Increasing mortality and loss of shrub and myrtle habitat on the islands due to frequent salt spray blasts and inundation of the freshwater lens will place additional stress on the few herons and egrets that return to breed in the summer. Herons and egrets used to be common nesters in the shrub thickets; however, their numbers have declined dramatically on the islands in recent years (Watts 2004). Table 4. Hypotheses and thresholds of change to barrier island and lagoon breeding birds due to global climate change factors. Climate factor
KEA Hypothesis of change/ thresholds for change Threat rating
Level of certainty
Sea-level rise/ storminess
Nesting habitat availability
Sea-level rise coupled with increased frequency and intensity of storms will create more open beach and overwash habitat, which benefits beach-nesting birds. Islands with elevations lower than 1.5 m have the highest probability of overwash events (Wilson 2007).
Low High
Sea-level rise/ storminess
Nesting habitat availability
Accelerated sea-level rise coupled with persistent major storm events occurring at a frequency greater than one every three years will both flatten dunes and prevent new dune formation, reducing nesting habitat available for nesting willets, black ducks, oystercatchers and sparrow.
Medium Low
Sea-level rise/ storminess
Nesting habitat availability
Loss of shrub habitat on islands due to salt spray blasts and inundations as described above will contribute to the continued decline of breeding heron and egrets on the barrier islands.
High High
Sea-level rise/ storminess and altered precipitation
Breeding bird productivity
Chronic flooding caused by altered precipitation or overwash events destroys nests, drastically reducing annual productivity of the birds (Wilke et al. 2007, Boettcher et al. 2007). If piping plover average productivity falls below 1.25 chicks per pair/per year on the Virginia barrier islands, this could cause population destabilization and decline in the “southern recovery unit” defined by the USFWS Recovery Plan (USFWS 1996).
Medium Medium

Effects of Global Climate Change at VCR Page 18

Effects of Global Climate Change at VCR Page 19

Effects of Global Climate Change at VCR Page 20
Migratory Shorebirds Overall, there is little published literature regarding the effects of global climate change on shorebirds, and most focuses on reduced habitat availability (Galbraith 2002) rather than availability of food resources. Regarding habitat, experts at the workshop predict that sea-level rise will cause erosion of lagoon marshes, which will lead to a net increase in mudflats and peatbank habitats (Table 5, Figures 6 and 7). The structure of exposed peat banks will attract high densities of blue mussel spat and other invertebrates, creating greater food resources for shorebirds such as red knots. Over time, the peat banks may erode to muddy banks with less structure onto which invertebrates can attach, diminishing their importance for the shorebirds. However, this is highly uncertain. Moreover, rising sea levels may cause intertidal mudflats to become subtidal. Currently, intertidal habitat covers roughly 36,000 acres while subtidal habitat occupies approximately 18,000 acres, or half that amount. Sea-level rise threatens to fundamentally alter the 2:1 ratio of intertidal to subtidal mudflats in the system. Losing significant areas of intertidal mudflats to sea-level rise would cause a reduction of migratory bird foraging areas (Galbraith 2002). Increasing air and sea water temperature threatens to decouple the synchrony between shorebird stopover and food availability. It is unknown what the long term effects of losing prey resources due to out-of-sync migration and food availability may be at for shorebirds stopping over on the Virginia barrier islands. There could be a net loss of prey resources on the island during migration as well as a lower diversity of prey resources. However, the ability of shorebirds such as red knots to prey switch as well as the northward range expansion of other food sources, such as dwarf surf clams (Mulinia lateralis), may mitigate the effects of loss of any one food source due to changing temperatures. For example, warmer water temperatures may mean blue mussel spat, an important food source for red knots, could die off before the knots reach the barrier islands due to warmer water temperatures. However, coquina clams (Donax varabilis) are equally preferable to red knots and are not affected by higher water temperatures. Much of what the group discussed is largely conjecture based on expert opinion and field experience. USFWS is working with Manomet’s Hector Galbraith to assess shorebird habitat vulnerability on the Chincoteague National Wildlife Refuge and to develop
©Barry Truitt

Effects of Global Climate Change at VCR Page 21
adaptation strategies. We hope to incorporate some of the conclusions from his study into this project in the future. Table 5. Hypotheses and thresholds of change to migratory shorebirds due to global climate change factors. Climate factor
KEA Hypothesis of change/ thresholds for change Threat rating
Level of certainty
Sea-level rise and storminess
Abundance of food resources
In short term (<100 years), sea-level rise and an increase in storm activity will cause erosion of lagoonal marshes and increased island migration which will lead to a net increase in intertidal mudflats and peatbanks, creating greater food resources for shorebirds; however, over time, the peat banks will erode to muddy banks with less structure onto which invertebrates can attach, reducing their habitat value to shorebirds.
Low Low
Sea-level rise and storminess
Available foraging habitat
Over the long term (>100 years) sea-level rise may cause a shift to a lower ratio of intertidal to sub-tidal habitat, in turn causing a loss of foraging habitat for migratory shorebirds (Galbraith et al. 2002).
Low Low
Increased water temperature
Abundance of food resources
Increasing sea water temperature may decouple the synchrony between shorebird stopover and food availability at Virginia barrier islands. However, birds’ ability to prey switch as well as the northward range expansion of other new food sources such as dwarf surf clams may mitigate the impacts of loss of any one food source due to changing temperatures.
Low Low

Effects of Global Climate Change at VCR Page 22
Effects of Global Climate Change at VCR Page 23
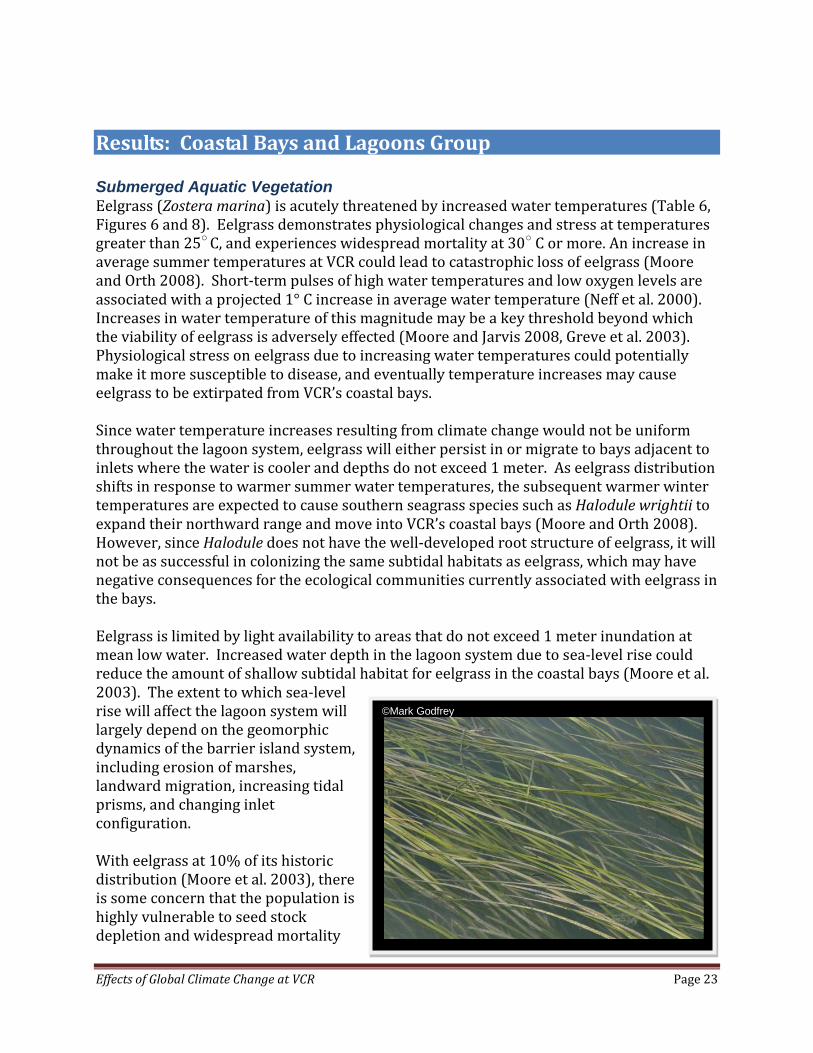
Results: Coastal Bays and Lagoons Group Submerged Aquatic Vegetation Eelgrass (Zostera marina) is acutely threatened by increased water temperatures (Table 6, Figures 6 and 8). Eelgrass demonstrates physiological changes and stress at temperatures greater than 25○ C, and experiences widespread mortality at 30○ C or more. An increase in average summer temperatures at VCR could lead to catastrophic loss of eelgrass (Moore and Orth 2008). Short-term pulses of high water temperatures and low oxygen levels are associated with a projected 1° C increase in average water temperature (Neff et al. 2000). Increases in water temperature of this magnitude may be a key threshold beyond which the viability of eelgrass is adversely effected (Moore and Jarvis 2008, Greve et al. 2003). Physiological stress on eelgrass due to increasing water temperatures could potentially make it more susceptible to disease, and eventually temperature increases may cause eelgrass to be extirpated from VCR’s coastal bays. Since water temperature increases resulting from climate change would not be uniform throughout the lagoon system, eelgrass will either persist in or migrate to bays adjacent to inlets where the water is cooler and depths do not exceed 1 meter. As eelgrass distribution shifts in response to warmer summer water temperatures, the subsequent warmer winter temperatures are expected to cause southern seagrass species such as Halodule wrightii to expand their northward range and move into VCR’s coastal bays (Moore and Orth 2008). However, since Halodule does not have the well-developed root structure of eelgrass, it will not be as successful in colonizing the same subtidal habitats as eelgrass, which may have negative consequences for the ecological communities currently associated with eelgrass in the bays. Eelgrass is limited by light availability to areas that do not exceed 1 meter inundation at mean low water. Increased water depth in the lagoon system due to sea-level rise could reduce the amount of shallow subtidal habitat for eelgrass in the coastal bays (Moore et al. 2003). The extent to which sea-level rise will affect the lagoon system will largely depend on the geomorphic dynamics of the barrier island system, including erosion of marshes, landward migration, increasing tidal prisms, and changing inlet configuration. With eelgrass at 10% of its historic distribution (Moore et al. 2003), there is some concern that the population is highly vulnerable to seed stock depletion and widespread mortality
©Mark Godfrey

Effects of Global Climate Change at VCR Page 24
due to multiple large hurricanes or nor’easters. Current frequency of hurricanes is one every 10 years, and it would take an order of magnitude increase for storms (hurricanes for two consecutive years) to deplete the seed stock and extirpate the eelgrass population. Ocean acidification may cause an increase in growth and distribution of eelgrass as the species uses CO2 more easily than bicarbonate. Research conducted by Palacios and Zimmerman (2007) shows that long term CO2 enrichment significantly increased the reproductive output and productivity of eelgrass beds in areas of adequate sunlight penetration, but this was not the case in light limited environments. Palacios and Zimmerman (2007) go on to posit that increased levels of CO2 in estuaries that do not suffer from eutrophication or reduced light levels may enable eelgrass to colonize deeper areas in the future. Moreover, denser eelgrass beds enriched by CO2 will be more effective at trapping sediments, creating a positive feedback loop by improving water clarity and creating more potential habitat for eelgrass. (This may have the adverse consequence of robbing sediment from vertically accreting on lagoon marshes, contributing to their erosion and submergence.) It is unknown at what threshold increasing CO2 enrichment is necessary for eelgrass meadows to offset a given level of nutrient enrichment in coastal bays. In more eutrophic estuarine systems this change in the carbonate system may benefit macroalgae to the extent that it can competitively displace eelgrass (Palacios and Zimmerman 2007). Table 6. Hypotheses and thresholds of change to eelgrass due to global climate change factors. Climate factor
KEA Hypothesis of change/ thresholds for change
Threat rating
Level of certainty
Sea level rise and storminess
Landscape structure and connectivity
Hurricanes occurring in two or more consecutive years during growing season will significantly deplete the seed stock and may extirpate the eelgrass population from VCR’s coastal bays.
High High
Sea level rise and storminess
Sediment stability and movement (light regime)
Due to the light limitation depth for eelgrass of one meter, sea-level rise may reduce the amount of suitable subtidal habitat for seagrass in the coastal bays (Moore et al. 2003). In the short term, we may observe a change in the distribution of eelgrass to more shallow subtidal areas in the lagoons due to sea-level rise.
Medium High
Increased water temperature
Species composition / dominance
Increases in average summer water temperatures greater than or equal to 1○ C may adversely impact eelgrass viability and eventually extirpate eelgrass from Virginia’s coastal bays (Moore and Jarvis 2008, Greve et al. 2003). Eelgrass will demonstrate physiological changes and stress at temperatures greater than 25○ C, and be subject to widespread die-off if temperatures exceed 30○ C (Moore and Orth 2008).
High High

Effects of Global Climate Change at VCR Page 25
Climate factor
KEA Hypothesis of change/ thresholds for change
Threat rating
Level of certainty
Ocean acidification
Species composition/ dominance and disease/ parasitism
Increased levels of CO2 have been shown to cause an increase in reproduction and productivity of eelgrass where light is not limited (Palacios and Zimmerman 2007). This may enable eelgrass to trap more sediments and improve water quality, in turn enabling habitat to expand and potentially colonization of deeper areas. However, light-limited or eutrophic coastal bays CO2 enrichment will not benefit eelgrass but will increase productivity of invasive macroalgae that may competitively displace eelgrass.
Medium Medium

Effects of Global Climate Change at VCR Page 26
Oysters Of all the shellfish in the coastal bays, oysters (Crassostrea virginica) are the most important habitat forming species. Fortunately, VCR is located in the center of the Eastern oyster’s range, and therefore altered water temperatures will not affect its regional range of distribution in the Mid-Atlantic and Virginia. However, increased water temperatures due to global climate change will likely increase the rate of oyster growth and recruitment in the coastal bays at VCR (Table 7, Figures 6 and 9). The release of oyster spat is governed by warming water temperatures in the spring and fall averaging 20°C and the blooming phytoplankton, oyster’s main food source. Highest spatfall peaks in May and June, continuing at lower frequencies throughout the summer months, and peaking again in September. Therefore earlier springs, later falls, and longer summers will allow for an extended recruitment and higher productivity for oysters as spat falls will occur earlier and more frequently. At the same time, sustained extreme hot summer water temperatures may impede or slow oyster growth during summer months due to suppressed phytoplankton growth. In addition, warmer water temperatures make oysters more susceptible to disease such as Dermo and MSX as these organisms are more likely to survive over the winter and thrive throughout an extended growing season (Burreson and Ragone-Calvo 1996). Likewise, increased temperature will lengthen periods during which predators such as blue crab and cow-nose rays actively prey upon oysters as evidenced by the higher predation rates south of VCR in warmer waters (Shumway 1996 and citations therein). Overall, an outstanding question is the degree to which increased productivity of oysters in the coastal bays will outpace the rates of disease and predation. As in other high salinity environments along the U.S. South Atlantic coast, oysters at VCR are largely restricted to the intertidal zone, a situation that is generally attributed to greater predation rates and competition in the subtidal zone (Ross and Luckenbach 2009). Accelerated sea-level rise may cause a shift of intertidal zones currently supporting oyster reefs to subtidal conditions, leading to increased exposure to oyster diseases and predators such as mud crabs, cow nose rays, blue crabs, and oyster drills. Whether sea-level rise adversely impacts the viability and community architecture of oyster reefs at VCR will depend on the amount distribution, and stability of available substrate persisting in intertidal habitats over time.
©Bowdoin Lusk

Effects of Global Climate Change at VCR Page 27
Ocean acidification may reduce the larval recruitment and survival of oysters, decreasing growth rates due to the extra effort of continually laying down new shell (Miller, unpublished data). This in turn could also lead to greater vulnerability to predation. However, there is little certainty or evidence regarding the impact of ocean acidification on oyster reefs in Mid-Atlantic coastal bays. Table 7. Hypotheses and thresholds of change to oysters due to global climate change factors.
Climate factor
KEA Hypothesis of change/ thresholds for change Threat rating
Level of certainty
Sea-level rise and storminess
Community architecture
Sea-level rise will cause shift from intertidal to subtidal conditions for oyster reefs leading to reconfiguration/ redistribution and possible net loss of live oyster reefs.
Medium Low
Sea-level rise and storminess
Depredation
Shift from intertidal to subtidal conditions will lead to increased levels of predation and significant mortality of oysters.
Medium Low
Increased water temperature
Disease / parasitism and depredation
Higher summer water temperatures will lead to higher infection rates of disease, and higher winter water temperatures will allow disease to persist longer and enable extended periods of predation (Burreson and Ragone-Calvo 1996, Shumway 1996).
Medium Medium
Ocean acidification
Population dynamics
Ocean acidification, which causes elevated CO2 may reduce larval recruitment and survival of oysters (Miller unpublished data).
Medium Medium

Effects of Global Climate Change at VCR Page 28
Tidal Mudflats Overall, climate change may provide more benefits to tidal mudflats at VCR than adverse effects. As noted above in the “Migratory Shorebirds” section, sea-level rise and an increasing tidal prism will cause lagoonal marshes to erode, which will result in a potential net gain of tidal mudflats. Moreover, sea-level rise may cause many intertidal mudflats to shift to subtidal mudflats over the long term. While marsh erosion or destruction initially will lead to a pulse of detrital matter flux to mudflats, there will be a loss of energy exported from the marshes to the mudflats over the long term. Since the primary food source on mudflats is macro and micro algae, it is unknown the degree to which mudflats are dependent on marshes for energy and organic matter. Invertebrates like polycheate worms move and rework sediments in the mudflats, creating an intricate and dynamic habitat for many other benthic organisms. Changes in water temperature may increase the metabolic rates and expand the spawning seasons of these mudflat bioturbators. For example, spionid polycheates may shift from annual to twice yearly reproduction as is the case in North Carolina. This would lead to both an increase in productivity and abundance of food resources as well as more sediment suspension in the mudflats. However, increased turbidity resulting from such activity may be countered by the increase productivity of benthic macroalgae that in turn stabilize sediments. Warmer water temperatures, especially during the winter, will likely lead to increased benthic species diversity in mudflats, but also increases the risk invasive species that are stress tolerant like Gracalaria. Due to the lack of more definitive conclusions regarding mudflats, participants did not develop a conceptual ecological model. Table 8. Hypotheses and thresholds of change to tidal mudflats due to global climate change
Climate factor
KEA Hypothesis of change/ thresholds of change
Threat rating
Level of certainty
Sea-level rise and storminess
Sediment and stability movement
Sea-level rise causes loss of lagoonal marshes that leads to increase in mudflats as well as a shift from intertidal mudflats to subtidal, causing significant loss of intertidal habitat and associated benthic communities and foraging habitats.
Medium Low
Increased sea water temperature/ ocean acidification
Species composition and dominance
Water temperature increase and ocean acidification may increase invasiveness of Gracalaria and other species that are more stress tolerant.
Medium Low

Effects of Global Climate Change at VCR Page 29
Results: Tidal Salt Marsh Group Tidal Salt Marsh System Overall, the survival of tidal salt marshes along the Mid-Atlantic seaboard is a function of marsh elevation relative to sea-level rise. At VCR, tidal salt marshes are grouped into two categories based on associated plant communities and elevation: high marshes characterized by Spartina patens and Distichlis spicata—vegetation of low stature— occurring in higher elevations along the mainland interface, and low marshes, found at lower elevations and characterized by S. alterniflora and D. spicata, vegetation of higher stature. Marsh elevation is maintained by the rate of vertical accretion resulting from accumulation of sediments and plant organic matter. Vertical accretion is a highly dynamic, complex and sensitive process driven by many factors in addition to sea-level rise including geomorphic setting, wave and tidal energy regimes, slope, precipitation, subsidence, and carbon dioxide concentrations, factors that make predicting the effects of global climate change on marshes extremely challenging (Cahoon et al. 2009). Tidal salt marsh will be lost if sea-level rise outpaces the ability of the marsh to vertically accrete and maintain its elevation relative to sea level, causing the marsh to become submerged and converted to intertidal mudflats or open water, a process that takes decades. Kirwin and Temmerman (2009) estimate that marshes in South Carolina will take 100 years to adjust to increases in the rate of sea-level rise, and that under a continuously accelerating future sea-level scenario, accretion rates will lag behind sea-level rise by 20–30 years and will not reach equilibrium. Moreover, Reed et al. (2008) predict wetland loss along the eastern side of the Delmarva Peninsula will be marginal under a scenario in which sea-level rise increases by 2 mm above current rates per year and entirely lost under a scenario where sea-level rise increases by 7 mm above current rates per year. While the implications of both studies to VCR marshes are uncertain, the findings are sobering and indicate that marshes are highly vulnerable to accelerated sea-level rise. Participants organized their discussion on the different environmental settings for back barrier salt marshes at VCR. Oertel et al (1992) classifies VCR marshes into three categories (Table 10, Figures 6 and 10): Lagoon Marshes: Marshes surrounded by open water on all sides; Island Fringe Marshes: Marshes attached to the
©Joe Scalf

Effects of Global Climate Change at VCR Page 30
westward side of barrier island; Mainland Marshes: Marshes occurring adjacent to upland. While the persistence of the marshes in all three settings is governed by the accumulation and loss of organic and inorganic substrate, the ultimate fate of each marsh type is unique to its setting. Of all marsh types, lagoon marshes are the most vulnerable to accelerated sea-level rise and storm activity. Because lagoonal marshes are surrounded by water, they are particularly susceptible to rising seas and storm wave action that cause increased rates of lateral erosion, resulting in reduction of areal extent of these marshes. Lateral erosion of lagoon marshes due to sea-level rise and storms has been documented in the mid-Atlantic at rates as high as two meters per year (Schwimmer 2001, Erwin et al. 2006a, b). Overall, the participants agreed that increased rates of sea-level rise and increased storm intensity and frequencies will continue to increase edge erosion and submerge the marshes, converting them to open water. Participants theorized that a 1 cm/year accretion rate is needed to keep pace with current rates of sea-level rise. Table 9 summarizes observed sedimentation rates from 12 marsh locations within and adjacent the Virginia Coast Reserve. Of these, none meet the 1 cm/year threshold for marsh stability. While the full future implications of these data have not be explored, the results are of great concern and represent perhaps the most significant threat to VCR due to global climate change. Table 9. Summary of marsh sedimentation rates documented in and near the Virginia Coast Reserve Location Marsh Type Total elevation
increase (mm/yr) Source Record
length
Phillips Creek Marsh, VA short-form S. alterniflora
5 mm Blum 2009 unpublished data
12 years
Phillips Creek Marsh, VA Mid-marsh patens-distichlis
4.3 mm Blum 2009 unpublished data
12 years
Phillips Creek Marsh, VA High marsh (turf breaking up
3.3 mm Blum 2009 unpublished data
12 years
Goat Island, North Inlet, SC
Short S. alterniflora marsh platform (unfertilized)
5.1 mm Morris et al. 2002 5 years
Goat Island, North Inlet, SC
Short S. alterniflora marsh platform (fertilized)
7.1 mm Morris et al. 2003 5 years
Mockhorn, VA High marsh S. alterniflora
1.4 mm Erwin et al. 2006a 4 years
Mockhorn, VA Pond 5.8 mm Erwin et al. 2006a 4 years
Curlew Bay, VA (near Wachapreague)
High marsh S. alterniflora
1.4 mm Erwin et al. 2006a 4 years
Curlew Bay, VA (near Wachapreague)
mid marsh S. alterniflora
0.7 mm Erwin et al. 2006a 4 years
Oyster, VA S. alterniflora 1- 2.2 mm Oertel et al. 1989b 60 years
Chimney Pole Marsh, VA Marsh 1.5-2.1 mm Kastler and Wiberg 1996
1 year
Monie Bay, Eastern shore of Chesapeake Bay, MD
Marsh 7.8 mm Kearney & Stevenson 1991
unknown

Effects of Global Climate Change at VCR Page 31
The island fringe marshes are maintained and expanded by the shoreward influx and deposition of inorganic sediment from overwash events. Provided that the barrier islands do not migrate too quickly, marsh species such as Spartina can colonize sediments deposited on back island mudflats during overwash events thus converting an overwash mudflat to marsh (Walsh 1998). However, if the rate of sea-level rise or flooding and storm events drive the islands to migrate above a threshold rate, the island fringe marshes will be unable to keep pace and will be buried by sediments as the islands roll over, converting gradually to intertidal mudflats. Kastler and Wiberg (1996) attribute a loss of more than 10% of marsh area on south Parramore Island to overwash in the eight-year period from 1982-1990. The marshes of the mainland edge may represent the most important opportunities for the persistence of marsh habitat in the coastal lagoons. As sea-level rises, wetlands and upland forests of the mainland potentially can be converted into marsh (Brinson et al 1995, Christiansen et al. 2000, Kastler and Wiberg 1996). The ability of mainland marshes to encroach on terrestrial uplands and migrate overland in response to rising sea levels is a function of landscape slope, sediment supply, and upland land use alteration (Brinson and Blum 1995). Either a marsh is able to encroach on terrestrial uplands due to gentle slope and intact natural land use conditions, or overland migration is “stalled” due to the steep slope or altered land use of the uplands (Brinson and Blum 1995). Other factors that constrain overland migration are the shading of marsh species from upland trees or shrubs, distance from tidal creeks and/or rates of brackish water intrusion, and soil hydrology (well-drained or wetland) (Brinson and Blum 1995). In almost all cases, the lagoon edge of the marsh continues to erode due to low sediment supply from the tidal creeks. It is unknown whether overland migration can keep pace with erosion of the marshward margin to prevent a net loss of marsh aerial extent. Agricultural upland edges limit marsh migration due to the potential land use conflict and the fact that fertilizer inputs will promote invasion of the migrating marsh by Phragmites australis. Forested wetlands with gentle slopes along tidal creeks provide the best
opportunities for marsh migration to the upland. Kastler & Wiberg (1996) report a net gain in marsh area for Phillips Creek Marsh over the period from 1938-1990 due to marsh encroachment over upland areas in which the upland slope was considerably lower (0.4-0.9°) than the typical 1.5° slope for the area. Participants postulated that increased sea-level rise and storms may erode the slope of the upland transition, making the slope less steep and more conducive to overland migration.
©Hal Brindley

Effects of Global Climate Change at VCR Page 32
Sufficient width of the transition zone is also an important attribute in predicting successful marsh migration; however, no threshold for width has been identified. The group also discussed the implications of eelgrass restoration on sediment supply for lagoon marshes. Assuming that the lagoons are an important sediment supply for the marshes, some suggested that if eelgrass expansion occurs, additional sediment will be trapped, which could elevate lagoon bottoms, decrease sediment suspension and in turn cut off sediment supply to lagoon marshes. However, the dynamics of the sediment supply, the lagoon bottom, eelgrass meadows, and lagoon marshes is not well understood. Increased CO2 concentrations associated with global climate change may support more productive marshes with increased rates of sediment and decomposition. Langley et al. (2009) found that in a brackish high marsh there was more root growth with elevated CO2, which led to higher sediment surface elevation. Cherry et al. (2009) found that in a one year experiment there was 50% greater surface elevation gain in high marsh treatments with increased CO2. However, CO2 can affect plant species differently which could lead to shifts in species composition in which C3 species1 such as American bulrush (Schoenoplectus americanus) growth is accelerated and C4 species1 such as Spartina patens is inhibited. Effects such as these have implications for marsh composition and habitat and for how marshes vertically accrete biomass and wrack and should be further explored. Moreover, another recent phenomenon of “sudden marsh dieback” has occurred at Upper Phillips Creek Marsh. While studies indicate that drought and/or high temperature may be the cause for the die back, this phenomenon is not well understood and needs further study. Insufficient vertical accretion, fungal disease and overgrazing by waterfowl have all been suggested as potential causes (Cahoon et al. 2009). This is another stress that may, in tandem with sea-level rise and storms, cause more erosion and stress to marshes at VCR. 1
Climate factors
Table 10. Hypotheses and thresholds of change to tidal salt marshes due to global climate change factors
Key ecological attribute
Hypothesis of change Threat rating
Level of certainty
Sea-level rise and storminess
Sediment stability and movement
Increased rates of sea-level rise will continue to drown lagoon and mainland marshes converting them to open water if vertical accretion is not at least 1 cm/year.
Medium Medium
Sea-level rise and storminess
Sediment stability and movement
Increased storm intensity will increase edge erosion and lagoon marshes will continue to decrease in lateral extent until they are completely eroded and disappear; island fringe marshes will continue to decrease in lateral extent along the open bay margin.
High High
1 C3-plants are those in which the first product in the sequence of biochemical reactions involved in the photosynthesis has three carbon atoms (e.g. pines). C3-plants respond readily to an increase in atmospheric CO2 with increased productivity compared to C4 plants. C3 plants account for more than 95% of the earth’s plant species. C4-plants are those in which the first product in the sequence of biochemical reactions involved in the photosynthesis has four carbon atoms. Examples include marsh plants like Spartina patens. C4-plants are likely to be less efficient photosynthesizers in a carbon-enriched atmosphere compared to C4 plants. (Adopted from University of Colorado at Boulder’s Geography Department Biosphere Glossary of Terms.)

Effects of Global Climate Change at VCR Page 33
Sea-level rise and storminess
Size/Extent of Characteristic Communities
Increases in sea level will force transgression of mainland marshes into upland areas
High High
Sea-level rise and storminess
Sediment stability and movement
With increased sea-level rise and storms the slope of the upland transition might be eroded so that the slope is less steep.
Low Medium
Sea-level rise and storminess
Sediment stability and movement
With increased storm intensity, overwash events will be more likely and will bury island fringe marshes more frequently, preventing them from recovering to mature marsh between large storm events.
Medium Medium
Air Temp Increase/ Increase CO2 levels
Size/Extent of Characteristic Communities
Increased CO2 concentrations associated with global climate change may support more productive marshes with increased rates of sediment and decomposition (Langley et al 2009 and Cherry et al. 2009)
Low Low

Effects of Global Climate Change at VCR Page 34
Marsh-Specific Breeding Birds Chronic flooding of nests due to accelerated sea-level rise and associated storminess is one of the most significant threats to colonial water nesting birds on the lagoon marsh islands, leading to both a reduction in productivity as well as breeding displacement (Erwin et al 2006b) (Table 11, Figures 6 and 11). If birds seek higher ground on barrier islands, this may lead to greater rates of egg predation by mammals and gulls than are currently experienced on the lagoon islands. The high marsh habitats characterized by lower stature species Spartina patens and Distichlis spicata that are found along the mainland marsh/upland transition zone support breeding and foraging species of high conservation concern, including clapper rails, seaside sparrows, and saltmarsh sharp-tailed sparrows. It has been estimated that breeding marsh sparrows and rails require up to 50 hectares of intact undisturbed marsh habitat (Watts, unpublished data). Accelerated sea-level rise, storms and flooding will likely cause a shift from high to low marshes, characterized by higher stature Spartina alterniflora, along the mainland. If the process of erosion outpaces the ability of mainland marshes to migrate overland, or if there is weak zonation of migrating marshes resulting in a predominance of low marsh, this could significantly reduce critical areas of high marsh habitat for the sparrows. Rising sea levels will also lead to a change in freshwater discharge volumes and locations, making freshwater more available in high marshes along the mainland. This has the adverse effect of making high marshes more conducive to invasion by phragmites, which also will negatively affect the sparrows (Benoit and Askins 1999, Guntenspergen and Nordby 2006). As shown by a study conducted by Paxton (2007), “encroachment of P. australis into the lower portions of the irregularly flooded zone will reduce the amount of available habitat for species adapted to nesting in short marsh grasses and has been shown to significantly reduce the densities of these short grass specialists.” The group acknowledged that, while significant areas of marsh may be lost due to sea-level rise, there will be a gain in intertidal mud flats rich in food resources that will benefit whimbrels and other foraging shorebirds and waterfowl.
©Alex Wilke

Effects of Global Climate Change at VCR Page 35
Table 11. Hypotheses and thresholds of change to marsh-specific breeding birds due to global climate change factors Climate factors
Key ecological attribute
Hypothesis of change Threat rating
Level of certainty
Sea-level rise and storminess
Nesting habitat availability (colonial water nesting birds)
Increased rates of sea-level rise and storminess will cause chronic flooding and lateral erosion that reduce aerial extent of marsh islands, displacing breeding colonies to higher ground where they will be more vulnerable to predation by mammals and aggressive gull species.
High Medium
Sea-level rise and storminess
Breeding bird productivity
Chronic flooding will drown nests and reduce colonial water nesting bird productivity.
High High
Sea-level rise and storminess
Nesting/ foraging habitat availability (marsh sparrows and rails)
Sea-level rise, flooding and erosion of mainland marsh will cause shift from high to low marsh that will reduce high marsh patches for breeding sparrows and rails that require at least 50 ha undisturbed marsh (Watts, unpublished data).
High Medium
Sea-level rise and storminess
Nesting/foraging habitat availability (marsh sparrows and rails)
Change in freshwater discharge volumes and locations along upland marsh edge will cause invasion by phragmites that will competitively displace high marsh habitat, reducing breeding and foraging for marshes and rails (Paxton 2007).
High Medium
©Andrew Herbert

36
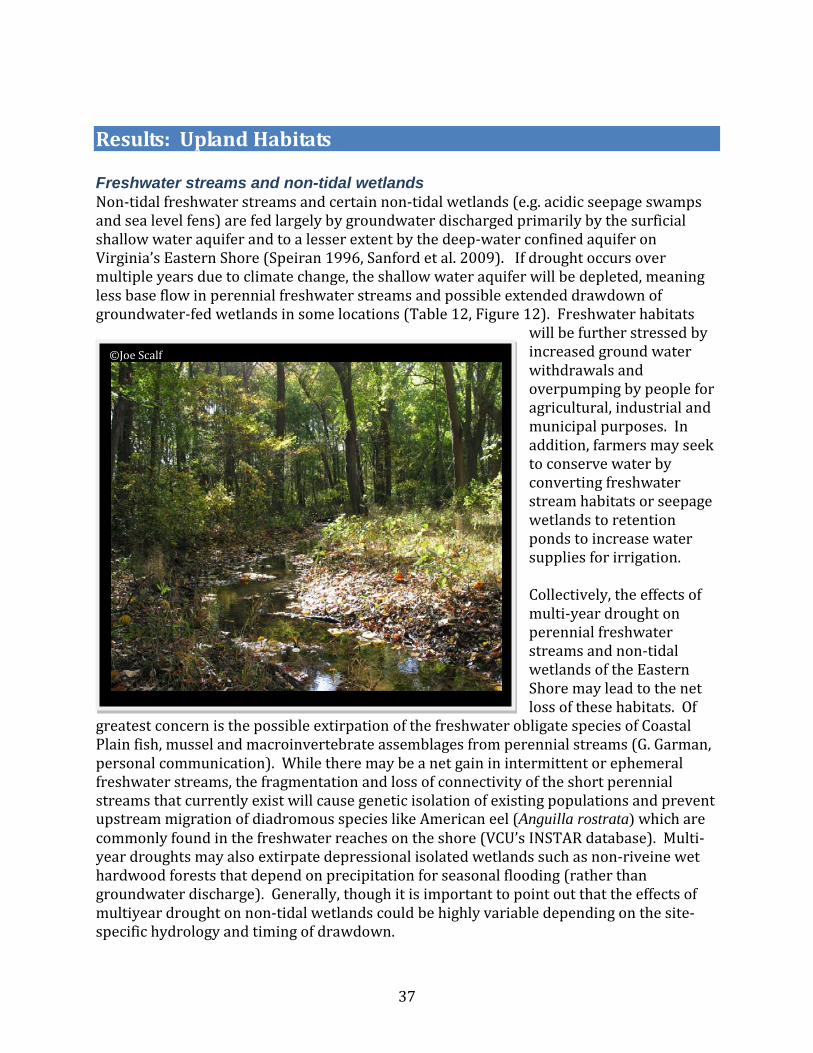
37
Results: Upland Habitats Freshwater streams and non-tidal wetlands Non-tidal freshwater streams and certain non-tidal wetlands (e.g. acidic seepage swamps and sea level fens) are fed largely by groundwater discharged primarily by the surficial shallow water aquifer and to a lesser extent by the deep-water confined aquifer on Virginia’s Eastern Shore (Speiran 1996, Sanford et al. 2009). If drought occurs over multiple years due to climate change, the shallow water aquifer will be depleted, meaning less base flow in perennial freshwater streams and possible extended drawdown of groundwater-fed wetlands in some locations (Table 12, Figure 12). Freshwater habitats
will be further stressed by increased ground water withdrawals and overpumping by people for agricultural, industrial and municipal purposes. In addition, farmers may seek to conserve water by converting freshwater stream habitats or seepage wetlands to retention ponds to increase water supplies for irrigation. Collectively, the effects of multi-year drought on perennial freshwater streams and non-tidal wetlands of the Eastern Shore may lead to the net loss of these habitats. Of
greatest concern is the possible extirpation of the freshwater obligate species of Coastal Plain fish, mussel and macroinvertebrate assemblages from perennial streams (G. Garman, personal communication). While there may be a net gain in intermittent or ephemeral freshwater streams, the fragmentation and loss of connectivity of the short perennial streams that currently exist will cause genetic isolation of existing populations and prevent upstream migration of diadromous species like American eel (Anguilla rostrata) which are commonly found in the freshwater reaches on the shore (VCU’s INSTAR database). Multi-year droughts may also extirpate depressional isolated wetlands such as non-riveine wet hardwood forests that depend on precipitation for seasonal flooding (rather than groundwater discharge). Generally, though it is important to point out that the effects of multiyear drought on non-tidal wetlands could be highly variable depending on the site-specific hydrology and timing of drawdown.
©Joe Scalf

38
Sea-level rise has the potential to slowly push deep aquifer groundwater discharge areas further inland. In addition, increasing storm surges and coastal inundation associated with sea-level rise may increase the frequency and extent of salt water intrusions into non-tidal freshwater reaches and wetlands. Both of these phenomena can lead to displacement of freshwater stream and wetland habitat by brackish water, extirpating freshwater obligate aquatic or wetland flora and fauna. Globally rare sea level fens are especially vulnerable to sea-level rise due to their position perched above the high tide line fed by fresh ground water discharge. In addition, depressional wetlands that are seasonally flooded could be vulnerable to salt water intrusions as sea levels rise. Moreover, seasonal precipitation may increase, causing more frequent and intense peak flows and flooding events during winter and spring months. This can lead to increasing rates of erosion and run-off of sediments, nutrients and other pollutants into freshwater streams, degrading water quality and stream channel structure (Poff et al. 2002, Hayhoe et al 2006). If summer base flows are low due to seasonal droughts while storm surges push salt water further upstream, this will weaken the roots of woody species in riparian areas. The loss of the forest habitat along freshwater streams due to summer drought would further contribute to erosion, loss of channel structure and increasing water temperatures due to winter flooding. Table 12. Hypotheses and thresholds of change to freshwater streams due to global climate change factors. Climate factors
Key ecological attribute
Hypothesis of change Threat rating
Level of certainty
Air temperature and precipitation extremes
Water chemistry, hydrologic regime, and native freshwater aquatic fauna
Increases in winter and spring precipitation cause higher and flashier peak flows and flooding events that in turn increase erosion and run-off of sediments, nutrients and other pollutants into freshwater habitats, reducing dissolved oxygen levels and simplifying channel structure.
High Low
Air temperature and precipitation extremes
Hydrologic regime and native freshwater aquatic fauna
Multi-year droughts will significant decrease summer and fall base flows, leading to net loss of perennial freshwater stream habitat and associated biological communities. While effects on non-tidal wetlands variable depending on hydrology, multi-year drought will likely cause extended periods of drawdown and reduced wetland habitat area.
High Medium
Sea-level rise and storminess
Water chemistry, hydrologic regime, and native freshwater aquatic fauna
Storm surges and tidal inundation will displace freshwater streams by pushing groundwater discharge areas inland, causing net loss of habitat. Low-lying non-tidal wetlands close to mainland edge and tidal creeks likely to be repeatedly inundated by salt water, causing state change in vegetation.
High Low
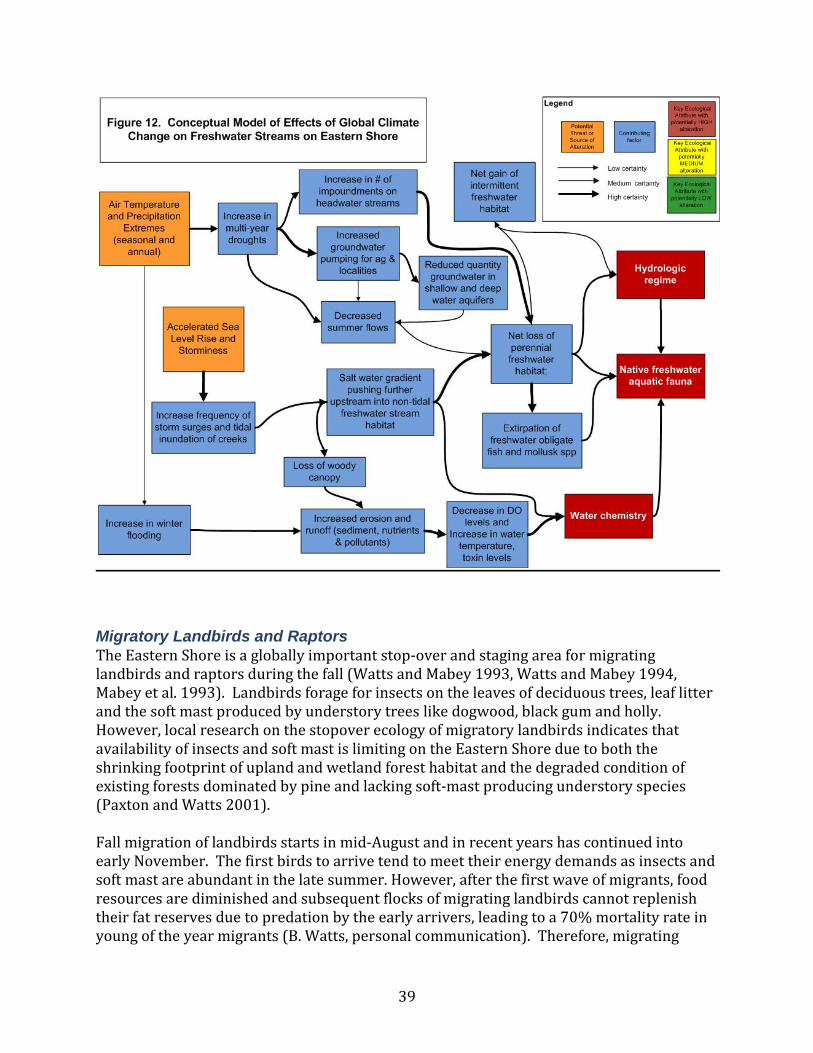
39
Migratory Landbirds and Raptors The Eastern Shore is a globally important stop-over and staging area for migrating landbirds and raptors during the fall (Watts and Mabey 1993, Watts and Mabey 1994, Mabey et al. 1993). Landbirds forage for insects on the leaves of deciduous trees, leaf litter and the soft mast produced by understory trees like dogwood, black gum and holly. However, local research on the stopover ecology of migratory landbirds indicates that availability of insects and soft mast is limiting on the Eastern Shore due to both the shrinking footprint of upland and wetland forest habitat and the degraded condition of existing forests dominated by pine and lacking soft-mast producing understory species (Paxton and Watts 2001). Fall migration of landbirds starts in mid-August and in recent years has continued into early November. The first birds to arrive tend to meet their energy demands as insects and soft mast are abundant in the late summer. However, after the first wave of migrants, food resources are diminished and subsequent flocks of migrating landbirds cannot replenish their fat reserves due to predation by the early arrivers, leading to a 70% mortality rate in young of the year migrants (B. Watts, personal communication). Therefore, migrating

40
landbirds are not meeting their collective metabolic demand for their southward journey when they stop on the lower Eastern Shore (Paxton and Watts 2001). Restoration efforts over the past decade have focused on creating forests that maximize the energetic benefits to migrating landbirds during fall months while expanding the net amount of forest cover on the mainland. Any climate change factors that reduce insect or fruit abundance in forest patches on the lower Eastern Shore will be detrimental to the fall migrants.
However, a great deal of uncertainty exists around how climate change will affect mainland forest habitats and non-tidal forested wetlands. Annual and seasonal precipitation is the primary climate factor driving the abundance and quality of forage for landbirds (Table 13, Figure 13). Droughts during the summer could lead to decrease in the quality and quantity of fruit set, which may or may not affect insect availability in the fall, depending on fall precipitation levels. Summer droughts can also lead to early leaf senescence, reducing available surface areas for insects earlier in the fall. Multi-year droughts could lead to mortality of deciduous soft-mast producing forest understory species entirely, which would significantly degrade forest habitat condition and the availability of forage resources for the birds. Moreover, multi-year droughts can also tip the balance of a mixed hardwood-pine stand to pine dominance, which is more drought tolerant than hardwood species due to its longer tap roots that reach deep into the water table. Greater pine dominance diminishes insect biomass by reducing leaf area on trees and leaf litter. Another climate-related concern is the potential net loss of mainland riparian forests and non-tidal freshwater wetlands due to sea-level rise and coastal inundation. As previously described for perennial streams, salt water intrusions into freshwater creeks, streams and wetlands will cause stress and eventual mortality to woody species in the riparian corridor. In the short term, stressed riparian trees and shrubs will be more susceptible to disease and pests, degrading the quality and quantity of food resources for migratory birds. Over the longer term, a net loss of riparian and wetland forest habitat could significantly reduce suitable stop-over habitat and associated food resources.
©Glenn Walbek

41
Table 13. Hypotheses and thresholds of change to migratory landbirds due to global climate change factors Climate factors
Key ecological attribute
Hypothesis of change Threat rating
Level of certainty
Air temperature and precipitation extremes
Average body mass index per individual species; stopover energy dynamics (density of birds per hectare per day)
Multi-year drought may cause loss of understory vegetation, reducing leaf areas and insect biomass for fall migrations. Change in growing season droughts may decrease mast production but have no effect on insect forage.
High High
Air temperature and precipitation extremes
Average body mass index per individual species; stopover energy dynamics (density of birds per hectare per day)
Multi-year drought may lead to selection of evergreens, including pines, over hardwood mast-producing species, which could lead to significant reductions of insects and fruit forage for birds.
Low Low
Accelerated SLR/ storminess
Average body mass index per individual species; Stopover energy dynamics (density of birds per hectare per day
Salt water intrusions into creeks and streams may stress woody riparian vegetation, making these forest and shrubs more susceptible to disease and pests, reducing forage for birds. Sustained salt water intrusions may cause mortality of forests and significant loss of forage base for birds.
High High

42
Conclusions and Next Steps Overall, workshop participants ranked accelerated sea-level rise and associated storminess as the greatest threat that will potentially destabilize and cause the greatest alterations to the barrier island and lagoon system of Virginia’s Eastern Shore. However, the most acute alterations resulting from sea-level rise and storminess will only occur if the rate of sea-level rise outpaces the sediment accretion rate of the barrier islands and marshes, and if the intensity and frequency of storms increases, all of which remains the subject of much debate in the scientific community (Appendix C). If both of these assumptions do prove true, the following alterations from global climate change are of greatest likelihood and concern for future management of VCR (Figure 11): • Accelerated island rollover and landward migration, including beach erosion, severe
dune erosion or destruction, widespread dune breaching, loss of maritime forest and scrub/shrub habitat, and extensive overwash.
• Landward transgression of mainland marshes into upland areas; decrease in lateral extent of marsh islands and island fringe marshes; conversion of all marsh types to open water and mudflats.
• Increased incidences of drowned nests of breeding colonial water and shorebird species in marsh islands (and to a lesser extent in overwash zones of barrier islands), reducing productivity for birds and displacing breeding colonies and pairs to higher ground where they will be more vulnerable to predation by mammals and aggressive gull species.
• Loss of high marsh along mainland edge by phragmites invasion and flooding causing a shift to low marsh species, reducing habitat for breeding sparrows and rails.
• Shift in ratio of intertidal to subtidal muflats, resulting in higher areal extent of subtidal habitat and subsequent spatial reconfiguration of eelgrass and oyster distribution.
• Depletion of eelgrass seed stock and subsequent acceleration eelgrass extirpation from VCR due to increased hurricane frequency.
• Loss of perennial freshwater stream habitat due to storm surges reaching higher elevations, resulting in extirpation of unique freshwater fish assemblages and other aquatic communities.
• Loss of or stress to forest along seaward margin of mainland uplands due to flooding and inundation, resulting in increased susceptibility of disease and insects as well as reduced habitat availability, both of which lead to reduction in available food resources for migrating neotropical land birds.
In addition to the effects of sea-level rise, alterations due to increasing water temperatures should be of high concern for future management of ecosystems on the Eastern Shore, including but not limited to: • Die-off and extirpation of eelgrass from Virginia’s coastal bays. • Increased rates of disease, predation and number of invasive species affecting oysters,
eelgrass and benthic invertebrate communities.

43
Finally, alterations due to annual and seasonal precipitation extremes should also be of high concern for future management of ecosystems on the Eastern Shore, including but not limited to: • Loss of perennial freshwater
stream habitat due to decreases in groundwater discharges, resulting in extirpation of unique freshwater fish assemblages and other aquatic communities.
• Increasing stress to forests due to reduced groundwater levels during growing season, including potential mortality of deciduous soft-mast producing forest understory species due to multi-year droughts, resulting in reduced food resources of migrating landbirds.
Based on this assessment, the conservation targets and habitats most vulnerable to climate change are tidal salt marsh, especially the lagoon marshes, eelgrass, high marsh breeding sparrows and rails, marsh island nesting colonial water and shore birds, maritime forest and shrub/scrub habitat on barrier islands, dune grasslands, mainland freshwater perennial streams and forested wetland and riparian habitats. These targets should be priorities for any climate change adaptation strategies. It must be noted that there will be winners and losers among the diverse assemblages of species and communities at VCR. While projected changes to other conservation targets are equivocal or appear to be beneficial, such as for migratory shorebirds, monitoring and management programs must continue to track how climate change factors may impact these species. While this report represents the best professional judgment and expertise of scientists, researchers and resource managers at VCR, we acknowledge the inherent uncertainty in hypothesizing future changes in a highly dynamic, ever-changing system and the need for more information and data to better anticipate future state changes. Specifically, this exercise highlighted the need for quantifiable key tipping points and thresholds where such state changes are most likely occur. We identified some thresholds during the workshop and from the literature, but the scientific community has not yet identified many of the key thresholds related to marsh and barrier island transgression. A priority for further research identified in the workshop is to better understand the sediment dynamics to predict potential state changes to the barrier islands due to sea-level rise and storms. Researchers, including Dr. Mike Fenster, Dr. Matthew Kirwin and Dr. Laura Moore, at UVA’s Long-Term Ecological Research site (LTER) are currently studying the short and long-term
©Mark Godfrey
44
drivers of change on the morphology of the Virginia barrier islands, including wave and tide dynamics, impacts of storms, sediment supply, basin accommodation and sea-level rise. In addition, Dr. Moore is working with Dr. Donald Young of Virginia Commonwealth University and Dr. Bryan Watts of William and Mary’s Center for Conservation Biology to determine biogeomorphic controls on barrier island evolution in response to climate change on Hog and Metompkin Islands, which also accounts for effects to beach nesting birds. Collectively, this research will provide the basis for determining key thresholds that could lead to state changes in the barrier island system. The hypotheses of change postulated at the workshop must be coupled with an analysis that informs our understanding of the spatial and temporal dimensions of the region’s vulnerability to sea-level rise, storms and the resulting shifts in the islands, marshes, intertidal and subtidal habitats. Toward this end, Dr. Matthew Kirwin of UVA and USGS Patuxent Wildlife Research Center is developing a landscape-scale model of to predict marsh vegetation vulnerability and loss in response to sea-level rise. We will couple the results of this model and the coastal geological research with the findings from our workshops to fully inform the development of future adaptation strategies. Phase two of this project will involve hosting a workshop with Eastern Shore natural resource managers and local county officials to identify strategies that will enhance resilience, facilitate adaptation, and improve the probability that species, habitats and ecosystems at VCR will persist. Categories of adaptation strategies will include a range of land protection mechanisms to facilitate marsh migration to uplands, policies that prevent shoreline armoring and promote living shorelines, directing oyster and eelgrass restoration efforts to increase shoreline protection, better incorporation of natural hazards in comprehensive plans and zoning ordinances, sustainable ground and surface water management and habitat enhancements to protect breeding bird nests from flooding and predation on islands. Our intended outcomes are that the results of the threats and strategies workshops will be used to inform the management of 133,330 acres of state, federal and Conservancy-protected lands. In addition, we hope the results of this project will help inform and guide Accomack and Northhampton counties in the development of local policies and programs that provide assistance to private land owners on the Eastern Shore to adapt to climate change. Moreover, it is our hope that the critical questions raised by this project will drive research agendas at the LTER, VIMS and other academic institutions with an interest in VCR. Overall, VCR has the potential to be a national and global leader in demonstrating innovative and effective implementation of climate change adaptation actions that ensure resilience of one of the most pristine stretches of Atlantic Coast. We hope to export and share lessons learned and best practices adopted by local, state and federal agencies and private landowners as a result of this project with other coastal communities along the Atlantic and beyond.

45
References Benoit, K. and R. Askins. 1999. Impact of the spread of Phragmites on the distribution of birds in Connecticut tidal marshes. Wetlands 19: 194-208. Burreson, E. M. and L. M. Ragone Calvo. 1996 Epizootiology of Perkinsus marinus disease in oysters in Chesapeake Bay with an emphasis on data since 1985. J. Shellfish Res. 15:17-34. Boettcher, R., T. Penn, R. Cross, and K. Terwilliger. 2007. And overview of the status and distribution of Piping Plovers (Charadrius melodus). Waterbirds 30: 138-151. Brinson, M.M., Christian, R.R., & Blum, L.K. 1995. Multiple states in the sea-level induced transition from terrestrial forest to estuary. Estuaries. 18(4): 648-659 Clark, J. S., 1986. Dynamism in the barrier-beach vegetation of Great South Beach, New York, Ecological Monographs, 56(2), pp 97-126. Cahoon, D.R. S.J. Williams, B.T. Gutierrez, K.E. Anderson, E.R. Thieler, and D.B. Gesch, 2009: Part I overview: The physical environment. In: Coastal Sensitivity to Sea-Level Rise: A Focus on the Mid-Atlantic Region. A report by the U.S. Climate Change Science Program and the Subcommittee on Global Change Research. [J.G. Titus (coordinating lead author), K.E. Anderson, D.R. Cahoon, D.B. Gesch, S.K. Gill, B.T. Gutierrez, E.R. Thieler, and S.J. Williams (lead authors)]. U.S. Environmental Protection Agency, Washington DC, pp. 9-10. Caldeira, K; Archer, D; Barry, JP; Bellerby, RGJ; Brewer, PG; Cao, L; Dickson, AG; Doney, SC; Elderfield, H; Fabry, VJ; Feely, RA; Gattuso, JP; Haugan, PM; Hoegh-Guldberg, O; Jain, AK; Kleypas, JA; Langdon, C; Orr, JC; Ridgwell, A; Sabine, CL; Seibel, BA; Shirayama, Y; Turley, C; Watson, AJ; Zeebe, RE, 2007. Comment on "Modern-age buildup of CO2 and its effects on seawater acidity and salinity" by Hugo A. Loaiciga, Geophysical Research Letters 34 (18): Art. No. L18608, 2007. Cherry, J.A., McKee, K.L., &Grace, J.B. 2009. Elevated CO2 enhances biological contributions to elevation change in coastal wetlands by offsetting stressors associated with sea-level rise. Journal of Ecology. 97: 67-77. Conservation Measures Partnership. 2007. Open standards for the practice of conservation. Foundations for Success, Bethesda, MD. Unpublished report, 39 pp. Dolan, R. and R.E. Davis. 1992. An intensity scale for Atlantic Coast northeast storms. Journal of Coastal Research, Vol. 8, No. 4, pp. 840-853. Dolan, R, Lins H, Hayden BP. 1988. Mid-Atlantic Coastal Storms. J. Coastal Res.. 4:417-433. Emanuel, K., R. Sundararajan, and J. Williams, 2008: Hurricanes and global warming: Results from downscaling IPCC AR4 simulations. Bulletin of the American Meteorological Society, 89(3), 347-367.

46
Emanuel, K. 2005. Increasing destructiveness of tropical cyclones over the past 30 years. Nature 436: 686-688. Erwin, R. M., Sanders, G.M., & Prosser D. J. 2004. Changes in lagoonal marsh morphology at selected northeastern Atlantic coast sites of significance to migratory waterbirds. Wetlands. 24(4): 891-903. Erwin, R.M, D.R. Cahoon, D.J. Prosser, G.M. Sanders and P. Hensel. 2006a. Surface elevation dynamics in vegetated Spartina marshes versus unvegetated tidal ponds along the Mid-Atlantic Coast, USA, with implications to waterbirds. Estuaries and Coasts 29(1): 96-106. Erwin, R.M, G.M. Sanders, D.J. Prosser, and D.R. Cahoon. 2006b. High tides and rising seas: potential effects on estuarine waterbirds. Studies in Avian Biology 32: 214-228. Fitzgerald, D.M., M.S. Fenster, B.A. Argow, I.V. Buynevich. 2008. Coastal impacts due to sea-level rise. Annual Review of Earth and Planetary Sciences. 36:601-47. Hauser, C. and S. Hamilton, 2009. Sensitivity of post-hurricane beach and dune recovery to event frequency, Earth Surface Processes and Landforms, 34, pp 613-628. Galbraith, R.J., R. Jones, R. Park, J. Clough, S. Herrod-Julius, B. Harrington and G. Page. 2002. Global climate change and sea-level rise: potential losses of intertidal habitat for shorebirds. Waterbirds 25: 173-183. Greve, T.M., J. Borum, and O. Pedersen. 2003. Meristematic oxygen variabilityin eelgrass (Zostera marina). Limnology and Oceanography, 48:210-216. Guntenspergen, G. and J.C. Nordby. 2006. Impact of invasive plants on tidal marsh vertebrate species: common reed (Phragmites australis) and smooth cordgrass (Spartina alterniflora) as case studies. Studies in Avian Biology 32: 229-237. Hayden, B. P., M. C. F. V. Santosa, G. Shao and R. C. Kochelb, 1995. Geomorphological controls on coastal vegetation at the Virginia Coast Reserve, Geomorphology, 13, pp 283-300 Hayden, B.P. 1999. Climate Change and Extratropical Storminess in the United States. Journal of the American Water Resources Association, vol. 35, Issue 6, p.1387-1397 Hayden, B.P & Hayden, N.R. 2003. Decadal and century-long changes in storminess at long-term ecological research sites. p262-285. In D. Greenland, D.C. Goodin, & R.C. Smith (eds.) Climate Variability and Ecosystem Response at Long-Term Ecological Research Sites. Oxford University Press, New York, NY, USA. Hayhoe, K., Wake, C.P., Huntington, T.G., Luo, L., Schwartz, M.D., Sheffield, J., Wood, E., et al. (2006). Past and Future changes in climate and hydrological indicators in the US Northeast. Climate Dynamics, 28,381-407.

47
Karl, T.R., G.A. Meehl, T.C. Peterson, K.E. Kunkel, W.J. Gutowski Jr., and D.R. Easterling, 2008: Executive summary. In: Weather and Climate Extremes in a Changing Climate. Regions of Focus: North America, Hawaii, Caribbean, and U.S. Pacific Islands [Karl, T.R., G.A. Meehl, C.D. Miller, S.J. Hassol, A.M. Waple, and W.L. Murray (eds.)]. Synthesis and Assessment Product 3.3. U.S. Climate Change Science Program, Washington, DC, pp. 1-9. Kareiva, P., Enquist, C., Johnson, A., Julius, S. H., Lawler, J., Petersen, B., et al. (2009). Sythesis and Conclusions, Chapter 9 . In Preliminary review of adaptation options for climate-sensitive ecosystems and resources: Final Report, Synthesis and Assessment Product 4.4. Kastler, J.A. & Wiberg, P.L. 1996. Sedimentation and boundary changes of Virginia salt marshes. Estuarine, Coastal and Shelf Science 42:683-700. Kearney, M.S. & Stevenson, J.C. 1991. Island land loss and marsh vertical accretion rate evidence for historical sea-level changes in Chesapeake Bay. Journal of Coastal Research. 7(2): 403-415. Kirwan, M.L. & Temmerman, S. 2009. Coastal marsh response to historical and future sea-level acceleration. Quaternary Science Review 28: 1801-1808. Langley, J.A, McKee, K.L., Cahoon, D.R., Cherry, J.A., & Megonigal, J.P. 2009. Elevated CO2 stimulates marsh elevation gain, counterbalancing sea-level rise. Proceedings of the National Academy Science 106(15):6182-6186. Leatherman, S.P., T. E. Rice and V. Goldsmith, 1982. Virginia Barrier Island Reconfiguration: A Reappraisal, Science, 215, pp 285-287. Miller, W. 2009. Unpublished data article at http://blogs.smithsonianmag.com/ aroundthemall/2009/06/will-oysters-survive-ocean-acidification-depends-on-the-oyster/ Moore K.A., Wilcox D.L., Anderson B., Orth R.J. (2003b). Analysis of historical distribution of SAV in the Eastern Shore Coastal Basins and Mid-Bay Island Complexes as evidence of historical water quality conditions and a restored Bay ecosystem. Special Report 383 App Mar Sci and Ocean Eng. VIMS, Gloucester Point, VA. Moore, K.A. and J.C. Jarvis. 2008. Environmental factors affecting recent summertime eelgrass diebacks in the lower Chesapeake Bay: Implications for long-term persistence. Journal of Coastal Research S.I. No. 55:135-147. Moore, K.A., and R.J. Orth. 2008. Climate change and submerged aquatic vegetation in Virginia. VIMS Climate Change White Papers series. VIMS, Gloucester Point, VA. Morris, JT, PV Sundareshwar, CT Nietch, B Kjerfve and DR Cahoon, 2002. Responses of coastal wetlands to rising sea level. Ecology, 83(10): 2869-2877.
48
Neff, R., H. Chang, C.G. Knight, R.G. Najjar, B. Yarnal and H.A. Walker. 2000. Impact of climate variation and change on mid-Atlantic region hydrology and water resources. Climate Research, 14:207-218. Nicholls, R.J., P.P Wong, V.R. Burkett, J.O. Codignotto, J.E. Hay, R.F. McLean, S. Ragoonaden and C.D. Woodroffe, 2007. Coastal Systems and low-lying areas. Climate Change 2007: Impacts, Adaptation and Vulnerability. Contribution of Working Group II to the Fourth Assessment Report of the Intergovernmental Panel on Climate Change, M.L. Parry, O.F. Canziani, J.P. Palutikof, P.J. van der Linden and C.E. Hansen, Eds., Cambridge University Press, Cambridge, UK, pp 315-356. NOAA Center for Operational Oceanographic Products and Services. 2010. NOAA Tide Predictions Database. Found at ://www.tidesandcurrents.noaa.gov/. NOAA, Sliver Spring, MD. Oertel, G.F, T.R. Allen, A.M. Foyle. 2008. The influence of drainage hierarchy on pathways of barrier retreat: an example from Chincoteague Bight, Virginia, USA. Southeastern Geology V. 45, No.3, April 2008, p. 179-201 Oertel, G.F., Kraft, J.C., Kearney, M.S, & Woo, H.J. 1992. A rational theory for barrier-lagoon development. Quaternary Coasts of the United States: Marine and Lacustrine Systems. SEPM Special Publication no. 48. 77-87. Oertel., G.F., Wong, G.T.F., & Conway, J.D. 1989b. Sediment accumulation at a fringe marsh during transgression, Oyster, VA. Estuaries 12(1): 18-26. Orr, JC, Fabry, VJ, Aumont, O, Bopp, L, Doney ,SC, Feely, RA, Gnanadesikan, A, Gruber, N, Ishida, A, Joos, F, Key, RM, Lindsay, K, Maier-Reimer, E, Matear, R, Monfray, P, Mouchet, A, Najjar, RG, Plattner, G-K, Rodgers, KB, Sabine, CL, Sarmiento, JL, Schlitzer, R, Slater, RD, Totterdell, IJ, Weirig, M-F, Yamanaka, Y, Yool ,A . 2005. Anthropogenic ocean acidification over the twenty-first century and its impact on calcifying organisms. Nature 437: 681-686. Poulter, B, N. L. Christensen and S. S. Qian, 2008. Tolerance of Pinus taeda and Pinus serotina to low salinity and flooding: Implications for equilibrium vegetation dynamics, Journal of Vegetation Science, 19(1), pp 15-22. Palacios, SL & Richard C. Zimmerman RC, 2007. Response of eelgrass Zostera marina to CO2 enrichment: possible impacts of climate change and potential for remediation of coastal habitats. Marine Ecology Progress Series 344:1-13. Paxton, B. J. 2007. Potential Impact of Common Reed Expansion on Threatened Highmarsh Bird Communities on the Seaside: Breeding Bird Surveys of Selected High-marsh Patches. Center for Conservation Biology Technical Report Series, CCBTR-07-03. College of William and Mary, Williamsburg, VA. 19pp.

49
Poff, N.L., Brinson, M.M, & Day, J.W. (2002). Aquatic Ecosystems and Global Climate Change: Potential impacts on inland freshwater and coastal wetland ecosystems in the United States. Pew Center on Global Climate Change. Reed, D.J., D. Bishara, D., Cahoon, J. Donnelly, M. Kearney, A.,Kolker, L., Leonard, R.A. Orson, and J.C. Stevenson, 2008: Site-specific scenarios for wetlands accretion as sea-level rises in the mid-Atlantic region. Section 2.1 in: Background Documents Supporting Climate Change Science Program Synthesis and Assessment Product 4.1: Coastal Elevations and Sensitivity to Sea Level Rise [Titus, J.G. and E.M. Strange (eds.)]. EPA 430R07004. U.S. Environmental Protection Agency, Washington, DC, pp. 134-174. Ross, P. G. and M. W. Luckenbach 2009. Population assessment of Eastern Oysters (Crassostrea virginica) in the seaside coastal bays. Final Report to Virginia Coastal Zone Management Program Richmond, VA, 111 pp. Sande, E. and D. R. Young, 1992. Effect of sodium choloride on growth and nitrogenase activity in seedlings of Myrica cerifera L., New Phytologist, 120, pp 345-350. Sanford, W.E., Pope, J.P., and Nelms, D.L., 2009, Simulation of groundwater-level and salinity changes in the Eastern Shore, Virginia: U.S. Geological Survey Scientific Investigations Report 2009–5066, 125 p. Schwimmer, R.A. 2001. Rates and processes of marsh shoreline erosion in Rehoboth Bay, Delaware, U.S.A. Journal of Coastal Research. 17(3): 672-683. Shumway, S. E. 1996 Natural environmental factors. Pp. 467-513 In: V. S. Kennedy, R. I. E. Newell and A. F. Abele (eds.) The Eastern Oyster, Crassostrea virginica, Maryland Sea Grant College Publication, College Park, Maryland. Speiran, G.K. 1996. Geohydrology and geochemistry near coastal ground-water-discharge areas of the Eastern Shore, Virginia. U.S. Geological Survey Water Supply Paper 2479, 73 p. The Nature Conservancy, 2009. Conservation action planning guidelines for developing strategies in the face of climate change. Arlington, VA. Unpublished report. 26 pp. The Nature Conservancy, 2005. Conservation action planning: overview of basic practices. Prepared by CAP working group. Arlington, VA. 20 pp. The Nature Conservancy, 2003. Eastern Shore of Virginia: conservation area plan. The Nature Conservancy in Virginia, Charlottesville, VA. Pp. 119 Tolliver KS, Martin DW, Young DR. 1997. Freshwater and saltwater flooding response for woody species common to barrier island swales. Wetlands 17:84–92. U.S. Fish and wildlife Service. 1996. Piping Plover (Charadrius melodus), Atlantic Coast Population, Revised Recovery Plan. Hadley, MA.

50
Walsh, J.P. 1998. Low marsh succession along an overwash salt marsh chronosequence. Ph.D. dissertation, University of Virginia, Charlottesville. Watts, B. D. 2004. Status and distribution of colonial waterbirds in coastal Virginia: 2003 breeding season. CCBTR-04-06. Center for Conservation Biology, College of William and Mary, Williamsburg, VA 25 pp. Paxton, B. J. and B. D. Watts. 2001. Fall stop-over ecology of neotropical migrants: Are inner or outer coastal habitats energy sources for migrants. Center for Conservation Biology Research Report Series, CCBTR-01-11. College of William and Mary, Williamsburg, VA. Watts, B. D. and S. E. Mabey. 1993. Spatio-temporal patterns of landbird migration on the lower Delmarva Peninsula. Center for Conservation Biology Technical Report CCBTR-93-01, College of William and Mary. Watts, B. D. and S. E. Mabey. 1994. Migratory landbirds of the lower Delmarva: Habitat selection and geographic distribution. Center for Conservation Biology Technical Report CCBTR-94-05, College of William and Mary. Wilke, A.L., D.F. Brinker, B.D. Watts, A.H. Traut, R. Boettcher, J.M. McCann, B.R. Truitt, and P.P. Denmon. 2007. Amercian Oystercatchers in Maryland and Virgina: status and distribution. Waterbirds 30:152-162. Williams, S.J., B.T. Gutierrez, J.G. Titus, S.K. Gill, D.R. Cahoon, E.R. Thieler, K.E. Anderson, D. FitzGerald, V. Burkett, and J. Samenow. 2009. Sea-level rise and its effects on the coast. In: Coastal Sensitivity to Sea-Level Rise: A Focus on the Mid-Atlantic Region. A report by the U.S. Climate Change Science Program and the Subcommittee on Global Change Research. [J.G. Titus (coordinating lead author), K.E. Anderson, D.R. Cahoon, D.B. Gesch, S.K. Gill, B.T. Gutierrez, E.R. Thieler, and S.J. Williams (lead authors)]. U.S. Environmental Protection Agency, Washington DC, pp. 11-24. Willis, K.J. and S.A. Bhagwat. 2009. Biodiversity and climate change. Science Vol. 326. no. 5954, pp. 806 – 807. Wilson, M. D., B. D. Watts, and J. E. LecLerc. 2007. Assessing habitat stability for disturbance-prone species by evaluating landscape dynamics along the Virginia barrier islands. Center for Conservation Biology Technical Report Series, CCBTR-07-06. College of William and Mary, Williamsburg, VA. 47pp. Young, D.R., J.H. Porter, C.M. Bachmann, G. Shao, R.A. Fusina, J.H. Bowles, D. Korwan and T. F. Donato. 2007. Cross-scale patterns in shrub thicket dynamics in the Virginia barrier complex. Ecosystems 10: 854-863. Zhang, K., B. Douglas and S. P. Leatherman, 2002. Do Storms Cause Long-Term Beach Erosion along the U.S. East Barrier Coast? Geology, 110, pp 493-502.

51

A-1
Appendix A. Conservation Action Planning Guidelines for Developing Strategies in the Face of Climate Change

A-2

A-3
CONSERVATION SCIENCE
THE NATURE CONSERVANCY
Conservation Action Planning Guidelines for Developing Strategies in the Face of Climate Change
October 2009
This document was prepared by The Nature Conservancy’s Central Science Division and is based on methods tested at the September 2009 Climate Adaptation Clinic held in Salt Lake City, Utah.

A-4
Table of Contents
Table of Contents 4
Introduction and Use of Guidelines 5
Step 1 – Understand the Potential Ecological Impacts of Climate Change 6
Step 2 – Formulate Specific Ecological “Hypotheses of Change” 7
Step 3 – Explore Potential Human Responses to Climate Change 11
Step 4 – Determine Which Climate-Induced Threats are MOST Critical to Address 12
Step 5 – Evaluate if Potential Climate Impacts Fundamentally Change the Project 14
Step 6 – Develop Adaptation Strategies and Evaluate their Feasibility and Cost 15
Step 7 – Develop Measures, Implement, Adapt and Learn 17
PLEASE NOTE: APPENDICES NOT INCLUDED
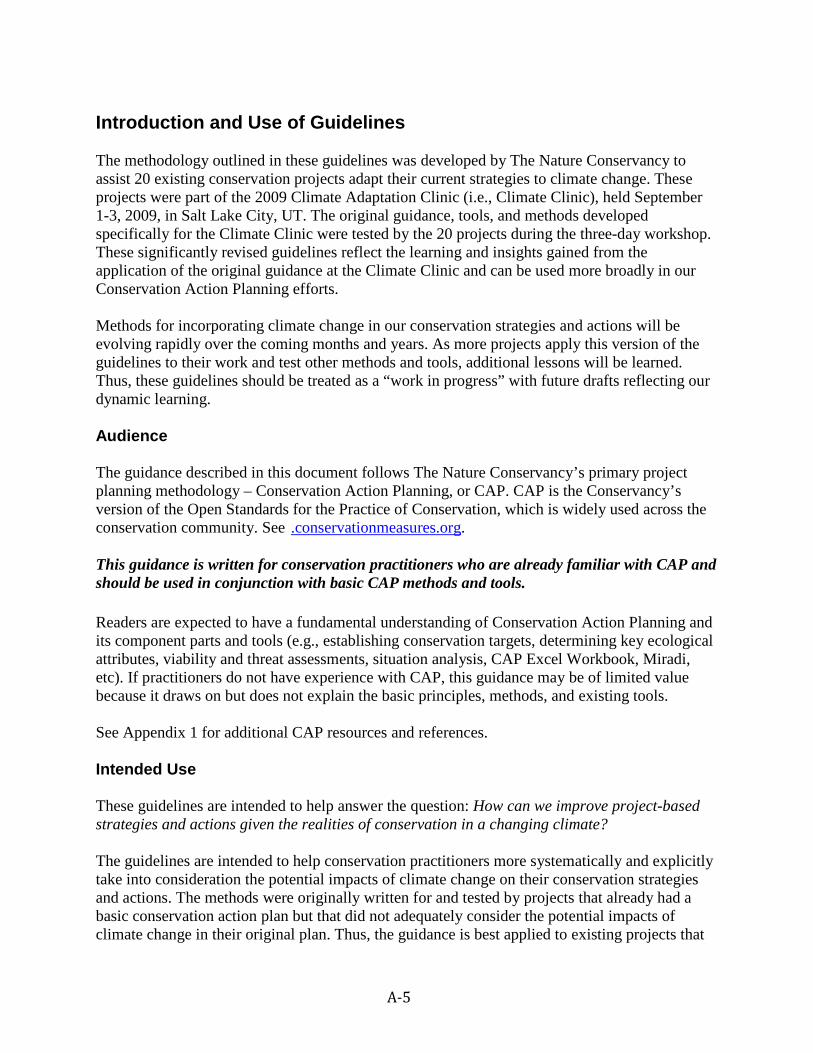
A-5
Introduction and Use of Guidelines The methodology outlined in these guidelines was developed by The Nature Conservancy to assist 20 existing conservation projects adapt their current strategies to climate change. These projects were part of the 2009 Climate Adaptation Clinic (i.e., Climate Clinic), held September 1-3, 2009, in Salt Lake City, UT. The original guidance, tools, and methods developed specifically for the Climate Clinic were tested by the 20 projects during the three-day workshop. These significantly revised guidelines reflect the learning and insights gained from the application of the original guidance at the Climate Clinic and can be used more broadly in our Conservation Action Planning efforts. Methods for incorporating climate change in our conservation strategies and actions will be evolving rapidly over the coming months and years. As more projects apply this version of the guidelines to their work and test other methods and tools, additional lessons will be learned. Thus, these guidelines should be treated as a “work in progress” with future drafts reflecting our dynamic learning. Audience The guidance described in this document follows The Nature Conservancy’s primary project planning methodology – Conservation Action Planning, or CAP. CAP is the Conservancy’s version of the Open Standards for the Practice of Conservation, which is widely used across the conservation community. See .conservationmeasures.org. This guidance is written for conservation practitioners who are already familiar with CAP and should be used in conjunction with basic CAP methods and tools. Readers are expected to have a fundamental understanding of Conservation Action Planning and its component parts and tools (e.g., establishing conservation targets, determining key ecological attributes, viability and threat assessments, situation analysis, CAP Excel Workbook, Miradi, etc). If practitioners do not have experience with CAP, this guidance may be of limited value because it draws on but does not explain the basic principles, methods, and existing tools. See Appendix 1 for additional CAP resources and references. Intended Use These guidelines are intended to help answer the question: How can we improve project-based strategies and actions given the realities of conservation in a changing climate? The guidelines are intended to help conservation practitioners more systematically and explicitly take into consideration the potential impacts of climate change on their conservation strategies and actions. The methods were originally written for and tested by projects that already had a basic conservation action plan but that did not adequately consider the potential impacts of climate change in their original plan. Thus, the guidance is best applied to existing projects that

A-6
have an understanding of their conservation purpose, challenges, and opportunities but that have not yet systematically considered climate change. These guidelines will help practitioners consider the potential effects of climate change and adjust their strategies and actions accordingly. These guidelines also may be useful for project teams just beginning to develop their conservation plan who want to incorporate climate change impacts from the start. However, please keep in mind that the guidelines have not been tested or fine-tuned for this specific application. A team that is just beginning project planning should apply the basic CAP process while taking into consideration the suggestions outlined in this paper. Scale Conservation Action Planning methods and tools can be applied to conservation projects at any scale or scope. During the 2009 Climate Clinic, an earlier version of these guidelines was applied to projects at vastly different scales with general success – from smaller site-based projects of tens of thousands of hectares to regional scale projects of tens of millions of hectares. Selecting the scale at which to develop a CAP and/or assess the potential impacts of climate change is an ongoing issue and is part of the emerging dialogue related to climate adaptation planning and the evolution of the Conservancy’s core planning methods. A thorough discussion of these issues is beyond the scope of this document. See Appendix 1 for additional resources that address planning scale and climate adaptation.
Step 1 – Understand the Potential Ecological Impacts of Climate Change It is important to take the time and effort to understand how exposure to climate change might impact the ecology of your project. The foundational components of focal conservation targets and the key ecological attributes (KEAs) developed for each conservation target provide an excellent place to start to gain an understanding of the potential ecological
impacts of climate change. Here are some suggestions for organizing this investigation:
A. Carefully review the key ecological attributes (KEAs) for your conservation targets to ensure that they represent your current best thinking.
B. See if there are journal articles written on the potential impacts of climate change on your
conservation targets (and their habitats) and/or key ecological attributes.
Tips -------------------- • You can type in Google Scholar ( ://scholar.google.com/schhp?ie=UTF-
8&hl=en&tab=ws) “climate change” “sagebrush;” or • TNC staff can search the online journals available from ConserveOnline when logged in
as a user ( ://conserveonline.org/scientificjournals.html); or • You can try the “web of knowledge” feature to search for peer-reviewed papers. This
feature can also be found on ConserveOnline in the journals section

A-7
( ://conserveonline.org/scientificjournals.html), but note, you need to be a TNC staff person logged into your ConserveOnline account to use it.
C. Explore Climate Wizard ( ://www.climatewiz.org/) – you can understand some of the basics
of projected temperature and precipitation changes for your project geography using this tool. D. Find the academic and agency experts who are studying the impacts of climate change on
your geography, conservation targets (and their habitats), or other relevant aspects of your project. Talk to these experts and ask them questions about how they think climate change will impact the conservation targets (and their habitats), viability, and threats.
E. You should also examine range or distribution maps of your conservation targets if possible.
Such maps will indicate if ecosystems or species of focus are within the center or at the edge of their range and may suggest whether the conservation target will remain in your project area under projected climate changes.
Tips -------------------- • NatureServe's Explorer has range information as well as biological information and
literature on rare species, plant communities, and ecological systems for the United States and Canada ( ://www.natureserve.org/explorer/).
• NatureServe's InfoNatura has similar information for animals and ecosystems of Latin America ( ://www.natureserve.org/infonatura/).
• You may also want to check with your state Natural Heritage Program or country Conservation Data Center for more local data.
F. We recommend considering the potential effects of climate change using a 50-year time
frame. Fifty years aligns with outputs from many climate simulation models, represents enough time for impacts to occur, and is still a reasonable time frame to consider conservation actions. Model projects for a longer time horizon such as 100 years include more uncertainty and developing conservation actions for this time frame may be too unrealistic. However, if you feel a different time frame is more appropriate, be sure to document what time frame you chose and why.
Step 2 – Formulate Specific Ecological “Hypotheses of Change” Once you have a sense of how climate change might impact your project, you can translate that information into specific hypotheses of change – that is, how you think climate change will specifically impact your conservation targets and their key ecological attributes. These hypotheses of change are essentially statements about the “vulnerability” of the system – the combination of “exposure” and inherent “sensitivity” of the ecology of the focal conservation targets. Although you can make a comprehensive list of these potential impacts, it will be important to carry forward a shorter list (e.g., up to eight) when assessing the level of threat and ultimately, developing strategies.

A-8
A. Using what you learned in Step 1, develop hypotheses of change based on your list of key
ecological attributes. These should focus on what you think the most significant changes will be to your conservation targets. These need to be specific – see examples in Table 1. Make sure to explicitly link the hypothesis of change to the key ecological attribute.
Tips -------------------- • Examples of hypotheses of change from projects that participated in the Climate Clinic
can be found at: ://conserveonline.org/workspaces/climateadaptation/documents/climate-change-project-level-guidance.
B. We recommend using a 50-year time frame for developing hypotheses of change for reasons
described above. However, if you feel a different time frame is more appropriate, document what time frame you chose and why.
C. Some of your conservation targets or key ecological attributes may not be significantly
affected by climate change. It is also possible that you will need to add new key ecological attributes or revise the original ones.
D. If you have a long list of hypotheses of change, select a subset (e.g., up to eight) to carry
forward based on those you anticipate being most “likely” to occur, and/or those that pose the greatest potential threat, and/or those that might also cause deterioration to other KEAs
(i.e., a chain reaction effect).
E. Projects at the Climate Clinic found it very helpful to develop a conceptual ecological model (e.g., box and arrow diagram or picture representing ecological relationships). Having this model provided a graphic aid to help understand and communicate the potential ecological impacts of climate change on the conservation targets and develop hypotheses of change.

A-9
Tips -------------------- • Examples of conceptual ecological models from projects that participated in the Climate
Clinic can be found at: ://conserveonline.org/workspaces/climateadaptation/documents/climate-change-project-level-guidance.
F. Because of the significant uncertainty associated with changes in climate variables, it is more
realistic to identify a range of change
rather than an absolute value (see Table 1). In some cases you will have a decent estimate of the range of projected changes in climate variables and in some cases you will not. When you do not know the specifics, use placeholders that identify the likely direction if not the quantitative range of expected change in your hypotheses (e.g., “+x-y degrees”).
G. Finally, it may be helpful to list any specific high-priority “science needs” related to the uncertainty associated with climate change impacts. These science needs can then be turned into key action steps later in the process if appropriate.
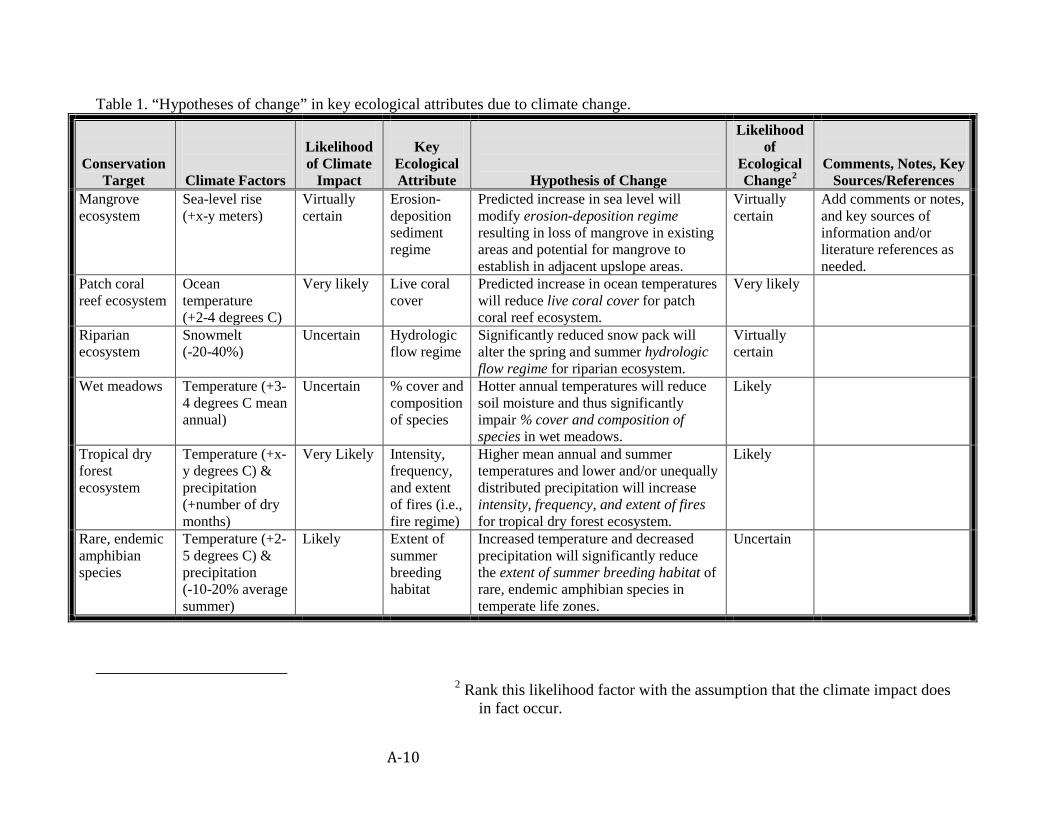
A-10
Table 1. “Hypotheses of change” in key ecological attributes due to climate change.
Conservation Target
Climate Factors
Likelihood of Climate
Impact
Key
Ecological Attribute
Hypothesis of Change
Likelihood of
Ecological Change2
Comments, Notes, Key Sources/References
Mangrove ecosystem
Sea-level rise (+x-y meters)
Virtually certain
Erosion-deposition sediment regime
Predicted increase in sea level will modify erosion-deposition regime resulting in loss of mangrove in existing areas and potential for mangrove to establish in adjacent upslope areas.
Virtually certain
Add comments or notes, and key sources of information and/or literature references as needed.
Patch coral reef ecosystem
Ocean temperature (+2-4 degrees C)
Very likely Live coral cover
Predicted increase in ocean temperatures will reduce live coral cover for patch coral reef ecosystem.
Very likely
Riparian ecosystem
Snowmelt (-20-40%)
Uncertain Hydrologic flow regime
Significantly reduced snow pack will alter the spring and summer hydrologic flow regime for riparian ecosystem.
Virtually certain
Wet meadows Temperature (+3-4 degrees C mean annual)
Uncertain % cover and composition of species
Hotter annual temperatures will reduce soil moisture and thus significantly impair % cover and composition of species in wet meadows.
Likely
Tropical dry forest ecosystem
Temperature (+x-y degrees C) & precipitation (+number of dry months)
Very Likely Intensity, frequency, and extent of fires (i.e., fire regime)
Higher mean annual and summer temperatures and lower and/or unequally distributed precipitation will increase intensity, frequency, and extent of fires for tropical dry forest ecosystem.
Likely
Rare, endemic amphibian species
Temperature (+2-5 degrees C) & precipitation (-10-20% average summer)
Likely Extent of summer breeding habitat
Increased temperature and decreased precipitation will significantly reduce the extent of summer breeding habitat of rare, endemic amphibian species in temperate life zones.
Uncertain
2 Rank this likelihood factor with the assumption that the climate impact does
in fact occur.

A-11
Step 3 – Explore Potential Human Responses to Climate Change The impacts of climate change will be both direct and indirect. In some cases, human responses to climate change will be more important than the direct effects themselves. This step of the process asks you to explore the potential human responses to climate impacts (e.g., building hard shoreline structures in response to sea-level rise; building dams to store scarce water). Starting with the ecological hypotheses of change, start to define potential actions that human communities most connected to these ecological systems are likely to take that may affect the integrity and long term viability of the ecological systems or species. Take into consideration that human responses may also be gains for conservation (e.g., government hazard planning agencies and insurance companies respond to increased threat of coastal flooding by considering a shift to buying out residents of flood prone areas rather than providing funds for rebuilding). A. The conceptual ecological models recommended for developing hypotheses of change in
Step 2 can also be expanded beyond ecological factors to gain a better understanding of the range of socio-economic and cultural resources at risk and the potential human responses. Amend your model to show human interactions including population densities, location of infrastructure, areas of significance for human livelihoods, and/or important cultural features.
B. Start with understanding the human responses to climate change impacts (e.g., hypotheses of change) that are most likely
to occur and that are most likely to elicit a significant human response.
C. Census data may be useful to understand expected population changes in your project area. Government census bureaus also have projections of economic growth and expected growth trends. Such projections may not be borne out if the climate impacts on a region are severe, but knowing which areas are projected to have more development and larger populations will help you identify areas where human intervention is most likely.
D. Purposefully identify and talk to non-traditional academic, agency, NGO, or other partners to
deepen and refine your understanding of the human response to climate change. Potential partners might include local business leaders, utility and infrastructure planners and engineers, economic development experts, coastal zone management officials, public health officers, agricultural development experts, and so forth. In some cases, these experts will have model projections or scenarios of human responses to climate change that will be informative in your planning efforts.
Tips -------------------- • TNC’s Hudson River Estuary Program has initiated a long-term climate planning process
built around non-traditional stakeholder involvement. The Rising Waters Project has brought together more than 160 regional representatives, including emergency responders, railroad companies, waterfront business owners, insurers, wastewater treatment plant operators, government agencies, environmental groups, and others. The
A-12
final report of the project is available at: ://www.nature.org/wherewework/northamerica/states/newyork/science/art23583.html
• A comprehensive assessment tool is available to help project planners and managers integrate climate change adaptation into community-level projects: the Community-based Risk Screening Tool – Adaptation and Livelihoods (CRiSTAL) ://www.cristaltool.org/.
F. The literature and available tools on the human dimensions of climate change is rich and
growing quickly. Much of it originates in the international development community. You can use Google Scholar, TNC’s online journals, and “web of knowledge” as described in Step 1. The information you gather in this step will be used to identify and rank direct and indirect threats from climate change and ultimately to develop adaptation strategies, so target your search accordingly.
Tips -------------------- • The U.S. Agency for International Development increasingly focuses on adaptation
measures to assure that their development projects are sustainable. Several manuals that may be useful for conservation planners are available at the USAID web site ( .usaid.gov). These include: “Adapting to Climate Variability and Change: A Guidance Manual for Development Planning,” “Adapting to Coastal Climate Change: A Guide Book for Development Planners,” and “Financing Climate Adaptation and Mitigation in Rural Areas of Developing Countries.”
Step 4 – Determine Which Climate-Induced Threats are MOST Critical to Address Completing the previous three steps has hopefully provided you with a better understanding of the potential ecological impacts from climate change and the potential human responses to those impacts. Now you will ask the question “how bad are the potential impacts and/or human responses, and which ones are most critical and need to be addressed now?” A. Start with the detailed threats assessment and ranking (i.e., stresses and sources of stress)
from your original CAP and revisit your rankings based on what the climate impact analysis revealed. This entails including new stresses and sources of stress AND re-ranking existing stresses and sources of stress with the added or exacerbated effects of climate change.
B. Be as specific as possible in describing your climate-related sources of stress (e.g., do not list
“climate change”). Be sure to include the potential human responses that you discovered in Step 3 in your evaluation and ranking process. The most important hypotheses of change should be incorporated into re-ranking existing threats and the identification of new threats.
C. The recommended time frame in a standard CAP threats assessment is 10 years (and longer
for some threats like invasive species). We recommend using a 50-year time frame for assessing the direct and indirect threats from climate change for reasons discussed previously. If you feel a different time frame is more appropriate, document what time frame

A-13
you chose and why. Caveat: A longer time horizon for climate change threats is needed to assess their full impact. However, using different time horizons to determine which threats warrant attention for strategy development is largely untested and warrants additional evaluation. Until then, make sure the basis of all threat ranking is clearly documented so that appropriate strategies can be developed for both near- and long-term critical threats.
D. It may also be useful to rank each threat with and without
climate change impacts (using a 50-year time frame) to fully understand the added impacts of climate change.
E. If you are developing a new conservation action plan, the CAP Excel Workbook and Miradi offer the traditional TNC stress and sources threat ranking approach and a simplified threat ranking approach which focuses on sources only. Both approaches flow from the viability analysis where sources of stress are assumed to be impacts to KEAs. In either method, you can build in climate-based sources of stress along with other human responses from your analysis. The primary differences when considering climate change from the current threats assessment in CAP are (a) use a 50-year time horizon to capture the potential impacts from climate change, and (b) capture the “most likely” changes identified in your specific hypotheses of change when defining and ranking threats.
F. The overall goal of this step is to determine the 1-3 MOST CRITICAL threats to address
with adaptation strategies. It will be difficult to impossible to adequately address all potential threats, so you must develop a priority list. Your final list of most critical sources of stress could be a confirmation or exacerbation of already existing critical threats or brand new ones.

A-14
Step 5 – Evaluate if Potential Climate Impacts Fundamentally Change the Project Before investing the time and energy in developing and evaluating adaptation strategies, we suggest you take a moment to reflect on whether there are any potential climate impacts that fundamentally change your project’s definition. Reflect on the series of probing questions below to determine if your project or conservation targets need major adjustments at this juncture. A. Step back and review your threats assessment and determine if any of your conservation
targets are on the brink of acceptable viability. In many conservation projects some conservation targets are already on the brink of acceptable viability. The added impacts from climate change may push these ecosystems or species into unacceptable health. You must try to honestly assess what it will take to conserve or restore these ecosystems and species in the face of climate change and in some cases decide to discontinue these efforts.
B. Any changes to the conservation targets in a project CAP are likely to have important
implications for both ecoregional/regional assessments as well as other project CAPs since planning efforts at multiple scales and places are often linked or influenced by one another. Changes in CAP conservation targets or project scope should be communicated to these other efforts and plans where appropriate.
Probing Questions • Do you need to add a new conservation target due to climate change?
o A significant ecosystem or species is expected to expand into the project area. o A common ecosystem or species in the project area is expected to become rare.
• Do you need to adjust any of your existing conservation targets due to climate change? o An important nested target is expected to be impacted differently than the ecosystem
which supports it (i.e., nested target unviable/broader system viable, or nested target viable/broader system unviable).
o The specific composition of the ecosystem as currently defined may not be viable with climate impacts, but the broader system type may persist with an unknown composition (e.g., unlikely to sustain a “beech-maple forest” but can sustain a “hardwood forest” with the precise composition not necessarily beech-maple over the long term).
• Do you need to adjust the project scope or boundary due to climate change? o If there are clearly more resilient areas or more resilient examples of the conservation
target in or nearby the project area (e.g., “refugia,” cooler and/or wetter), these might be the primary focus of future conservation efforts and the project scope might need to be expanded (or contracted) to include (only) these resilient areas.
o The project boundary could be adjusted to facilitate expansion and/or contraction along a trajectory of change (e.g., such as “up the mountain”).
• Do you need to consider a current conservation target elsewhere due to climate change? o Your climate impact and KEA/threats analyses indicate there are more resilient
occurrences elsewhere in the ecoregion or region.

A-15
o You can envision a more feasible and/or less expensive strategy to conserve this conservation target elsewhere in the ecoregion or region (e.g., more available resources, fewer constraints, or better management environment).
• Do you need to remove a conservation target due to climate change? o You cannot envision a reasonably feasible strategy/outcome to maintain target
viability nor can you adjust the project scope or boundary. o The conservation target will no longer need focus because of likely expansion due to
climate change. Assess whether this target should be removed or become a nested target.
Step 6 – Develop Adaptation Strategies and Evaluate their Feasibility and Cost With information from the previous five steps, you should now be ready to consider what actions are necessary to address the most important impacts of climate change or resulting human responses. Again, these threats must be of significant magnitude and scope to warrant action. A. Fundamentally, adaptation strategies are no different than other strategies that are developed
to improve viability or decrease threats. See the basic CAP resources and materials for additional advice and best practices on developing strategies.
B. Use all available materials and information for this step: hypotheses of change (Step 2); high-
priority or key “science needs”; analysis of human responses (Step 3); threats assessment (Step 4); situation analysis from your initial CAP process; list of objectives and strategic actions from your initial CAP process.
C. Just as you revisited your threats analysis in light of this new information, you will need to
revisit your situation analysis with the information you have assembled. A helpful step in developing adaptation strategies is to diagram your analysis of the threats and opportunities identified with climate change. A situation diagram captures your answers to questions such as: “What is driving this threat? Who is most involved? Why are they doing this? Who stands to gain or lose if this threat isn’t addressed?” in a visual box-and-arrow flow chart. The act of “mapping” the factors, drivers, and relationships may help you clarify stakeholders, relationships, and other context issues and illuminate important linkages and possible points of intervention to influence the conservation situation. Methods for conducting a situation analysis and developing a situation diagram are outlined in the basic CAP methods and tools.
D. Follow standard CAP guidelines for developing objectives and strategic actions
, including developing measurable objectives, strategic actions, action steps, and indicators. Remember, as with any conservation strategy, the strategic actions need to be at a sufficient scope and scale to address the threats imposed by climate change or the human responses to climate change.
E. Measurable objectives should derive from key ecological attribute indicator ratings and the hypotheses of change. They should represent a quantitative and measurable statement of

A-16
"success" for that conservation target based on its viability or threat reduction. For example: “By 2025, ensure “good” base flows in summer so that no sections of the Blue River go dry (approximately 50-75 CFS) in dry years.” “By 2020, eliminate the use of habitat-damaging fishing gear in key coral and sponge gardens and known crab nursery areas.”
F. This step includes refining or enhancing existing objectives and strategic actions or
developing new adaptation objectives and strategic actions. The framework below presents seven broad categories (Appendix 2 has examples) of conservation and management strategies specific to climate adaptation to stimulate your thinking (Kareiva et al. 2009).
• Protect key ecosystem features
Special management protections or actions are applied to the structural characteristics, organisms, or areas that are particularly important to the resilience of the overall system.
• Reduce anthropogenic stresses Through management, minimize anthropogenic stressors (e.g., pollution, overfishing, development) that hinder the ability of species or ecosystems to withstand a stressful climatic event.
• Representation Management actions focused on ensuring diversity within a specific biodiversity entity (species or ecosystem) to increase the likelihood that some variations may be more suited to the new climate.
• Replication Ensure there are “multiple bets in a game of chance” by focusing on the continued viability of more than one example of each ecosystem or species.
• Restoration In many cases natural intact ecosystems have some resilience to extreme events. Restoring various components of natural ecosystems can help increase their resilience.
• Refugia Actions aimed at the management of physical environments that are less affected by climate change than other areas, thus ensuring a “refuge” from climate change.
• Relocation Management action focused on human-facilitated transplantation of organisms from one location to another in order to bypass a barrier.
G. The Strategy Ranking Tool in Appendix 3 (which was adapted from existing tools in the
CAP Workbook and Miradi) can be used to rank each adaptation strategy. a. Benefits are the estimated degree to which the strategy will lead to the desired outcome,
that is, threat abatement leading to improvement in viability of key ecological attributes and conservation targets.
b. Feasibility reflects the probability of success and includes five ranked factors: ease of implementation, lead individual or institution, institutional support, ability to motivate key constituencies, and the ability to secure necessary funding.
c. Cost is estimated as an approximate order of magnitude number of dollars for 10 years (i.e., onetime costs + annual costs/year). This will require teams to consider whether anticipated costs are needed consistently over 10 years or staged as climate impacts ramp up over time.

A-17
H. During this assessment, it is useful to make note of any new key capacities you believe will
be needed for new strategies (to be used later in developing an implementation plan) such as new TNC staff skills, buy-in from leaders, etc.
I. The last part of this step is to integrate any new strategies and actions related to climate
change into the core components of your existing conservation action plan. The adaptation strategies and their cost/benefits should be evaluated with and prioritized against the list of objectives, strategies, and actions you already have outlined or are implementing. As in any conservation plan, only a few priority strategies can be implemented. You will need to take a look at how potential adaptation strategies stack up against other important strategies and what new opportunities climate change creates. Again, use the cost/benefits information to help you rank and develop a priority list.
Step 7 – Develop Measures, Implement, Adapt and Learn Once you have developed climate adaptation strategies and they are integrated into the rest of the strategies and actions for the project, you will need to develop appropriate measures and monitoring, and an implementation plan. A. Our standard CAP process has many methods and tools for developing measures – including
developing indicators and monitoring methods to track key indicators over time (e.g., “results chains”). This guidance includes both biological/ecological information as well as short- and long-term activities that are part of an implementation plan.
B. Because of the inherent uncertainty associated with climate change, it will be wise to track
certain ecological factors to determine if climate impacts are occurring as predicted. Often, climate or ecological data collected by partners can be used relatively easily and cost effectively to track conservation targets or threats. You will likely need to supplement available data with data specific to address the effectiveness of strategies. See Appendix 1 for a recent paper on developing a cost effective monitoring program (Montambault et al. 2009).
C. In addition to ecological data, it may be important to track some basic social information,
including how humans are responding to climate change. Again, look for information and data that is already being collected by partners.
D. This is stating the obvious, but no strategy is complete without details on implementation –
Who, What, Where, When, How Much. Again, guidance and tools for developing and tracking strategy implementation is available as part of the standard CAP methods and tools.
E. You may also want to communicate to practitioners, partners, managers, and other
stakeholders to let them know how your project plan has changed as a result of incorporating potential climate impacts. Some of this communication may be directly related to your

A-18
adaptation strategies and will part of your action steps, but updating your plan to incorporate climate impacts may also offer other more general communication opportunities.
F. It will be valuable to update your CAP workbook or Miradi file with the results of this
analysis and upload the new plan to ConPro. This should include (a) annotating the project description to explain how the project has specifically considered climate change, and identify which parts of the CAP will require additional updating as a result; and (b) uploading your hypotheses of change to your ConPro record as an “Associated File.” Also consider making your project public in ConPro if it is not already, to ensure that all important partners and stakeholders can view the updated plan.
G. Adapting and learning are a critical step in our basic CAP methodology and take on
heightened importance given the uncertainty associated with climate change. As the final step in this guidance, develop a structured, reoccurring process for reviewing your measures and using that information for adapting and learning (at least annually if not more frequently). This includes both within your project team as well as some attention to sharing lessons learned with a broader audience.

A-19
Appendix B. Conservation target descriptions Target Group 1. Barrier Islands 1.1 Barrier Island System The Barrier Island System extends for nearly 60 miles along the seaward margin of the Lower Virginia Eastern Shore and is composed of 12 barrier islands, their associated tidal inlets and sandbars, six back barrier islands, and thousands of acres of fringing salt marshes. With the exception of Wallop’s Island, the islands are free to respond naturally to the processes that have shaped and nourished them since the Pleistocene. They have proven to be biologically diverse and resilient even while being subjected to more than 400 feet in sea-level rise and migrating more than 50 miles during the last 12,000 years. Because of the dynamics of the system and its mid-Atlantic location, the natural communities of the islands and their associated plant species are spatially and temporally transitional. The maritime natural communities found on the islands include high-energy upper beaches and overwash flats, peat/sod banks, maritime dune grasslands, maritime scrub, maritime dune woodlands, maritime wet grasslands, interdune ponds, salt flats, maritime loblolly pine forest, maritime mixed forests, salt scrub, tidal mesohaline and polyhaline marsh, and tidal oligohaline marshes. 1.2 Barrier Island/Coastal Lagoon Breeding Birds The Virginia barrier islands provide critical habitat for an extraordinary number and diversity of breeding colonial waterbirds, shorebirds, raptors, passerines and waterfowl including the piping plover (Charadrius melodus), Wilson’s plover (C. wilsonia), American oystercatcher (Haematopus palliatus), black skimmer (Rynchops niger), least tern (Sterna antillarum), gull-billed tern (S. nilotica), as well as several species of egrets, herons and ibis. Colonial waterbird and shorebird breeding habitat includes high-energy upper beach and overwash fans, dune grasslands, scrub, and topographical highs (wrack, shell rakes) in the salt marshes. Results from a 2008 survey of all colonial waterbirds in coastal Virginia (except great egrets and great blue herons) show that the barrier island/lagoon system supports 74% and 70% of all colonial waterbird breeding pairs and colonies, respectively, in Virginia’s coastal plain. The region also supports more than 50% of the known Virginia coastal population of 15 of 23 species surveyed (Watts and Paxton 2009). Over 200 breeding pairs of piping plovers are currently found on island overwash beaches representing roughly 11 percent of the Atlantic coast population. More than 75 percent of these breeding pairs nest on the northern barrier islands closest to Wallops including Assawoman (U.S. Fish and Wildlife Service-owned), Metompkin (Conservancy and U.S. Fish and Wildlife Service-owned), and Cedar (Conservancy, U.S. Fish and Wildlife Service , State and private-owned) (Boettcher et al. 2007). Of the more than 700 breeding pairs of American oystercatchers documented in coastal Virginia in 2008, more than 50 percent occurred on Virginia’s barrier islands, with 40 percent occurring on Metompkin and Cedar islands alone (Wilke et al. 2009). Moreover, oystercatcher productivity rates along the

A-20
barrier island chain are some of the highest reported on the US Atlantic coast, suggesting that the islands may serve as important population sources for the East Coast population (Wilke et al. 2007). Long-term monitoring between 1976 and 2005 documented a decline in the colonial waterbird breeding population, most especially black skimmers, common terns (S. hirundo), gull-billed terns, least terns, and yellow-crowned night herons (Nyctanassa violacea) (Williams et al. 2002, unpubl. data). Declines are attributed to poor productivity due to flooding and increased mammalian predation by raccoons and red foxes (Erwin et al. 1998, Erwin et al. 2001, Rounds 2003). Recent increases in the number of piping plover and American oystercatcher pairs on the barrier islands, however, have been attributed in part to efforts to manage mammalian predator populations. The long-term response of colonial waterbird breeding populations is being documented through ongoing population monitoring efforts. 1.3 Beach-Specific Migratory Shorebirds High energy beaches and peat banks formed along ocean beaches by island migration over backside marshes host a great density of beach specific migratory shorebirds including red knots (Calidris canutus), sanderlings (Calidris alba), and semi-palmated plovers (Charadrius semipalmatus). The population of red knots has declined by 85 percent since 1990 and is a candidate for listing under the Endangered Species Act (Niles et al. 2007). Peak counts suggested that almost 25% of the rufa subspecies population of red knots stopped on Virginia’s barrier islands in May 2008, during their migration to feed on shore-dwelling invertebrates (Watts and Truitt, Center for Conservation Biology and The Nature Conservancy, unpublished data). Red knots and other shorebirds feed primarily blue mussel spat (Mytilus edulis), amphipods (family Gammaridae), and coquina clams (Donax varabilis). Target Group 2. Coastal Bays and Lagoons 2.1 Shellfish Several species of shellfish currently or formerly were integral to the diversity and function of the barrier island lagoon system, most notably the eastern oyster (Crassostrea virginica) and hardshell clams (Mercenaria mercenaria). Oyster reefs in particular are “ecosystem engineers” providing several ecological services to the barrier island lagoons. While phytoplankton chiefly control nutrients in the lagoons, healthy oyster beds and reefs play a role in clarifying the water, thereby improving conditions for eelgrass and other species. Moreover, oyster reefs provide habitat for other invertebrates and juvenile fish, and can also help to buffer shorelines from erosion. Migratory oystercatchers also spend time foraging on oyster reefs and oyster rakes and rocks. Shellfish reefs also provide hard substrate for several sessile benthic invertebrates such as polychaetes (e.g., sabellids, serpulids), hydroids, bryozoans, and sponges, as well as critical nursery and foraging habitat for juvenile fishes. Due to disease, overharvest and environmental degradation, oysters were termed “commercially extinct” by the 1990s in the Virginia coastal bays and lagoons. Since then, oysters appear to have developed immunity to the disease dermo,

A-21
which, in combination with restoration efforts, has led to healthy recruitment and growth of oyster reefs in the lagoons. 2.2 Submerged Aquatic Vegetation Eelgrass (Zostera marina L.) is a marine flowering plant that grows in subtidal regions of coastal and is the major seagrass in the Virginia coastal bays. Similar to the shellfish reefs, eelgrass meadows provide numerous ecological services, including food, nursery spawning and refuge locations for blue crab, bay scallops and numerous fish species. In addition, the complex networks of leaves, roots and rhizomes serve to trap and utilize nutrients, and dampen wave action. Eelgrass typically exhibits a seasonal change in abundance, with low biomass in winter months and rapid increases in the spring and early summer. All of the eelgrass on the Eastern Shore was killed by episodes of pandemic wasting disease with a slime mold vector, an auxiliary effect of the 1933 hurricane. Through restoration efforts over the last five years, eelgrass meadows are beginning to recolonize lagoons from Cedar Island south. However, while seagrass rebounded in Chincoteague Bay, peaking five years ago, it is now disappearing, which may be due to poor water quality and high water temperatures. The Atlantic brant feed on seagrasses and macroalgae (see subtidal mudflats). The population declined sharply in the 1930s due to eelgrass pandemic and again in the 1970s due to overharvesting, winter mortality and low productivity (Atlantic Flyway Council 2002). Since then, it has rebounded and stabilized but is still a conservation priority due to its past vulnerability. 2.3. Tidal Mudflats Intertidal mudflats are sedimentary habitats, comprised primarily of silt and clays, created by deposition in low-energy coastal environments. They are associated with high biological productivity and species, but low biodiversity. Subtidal Mudflats represent unvegetated bottom habitat within the lagoon system and may be a rich source of macroalgae. These habitats are recognized as important feeding areas for a variety of fish and bird species. Most of the tidal habitat in Virginia’s coastal bays and lagoons (36,000 hectares) is intertidal, twice as much as the subtidal (18K ha) habitat. During the spring these mudflats are exceptionally significant for several migratory shorebirds of conservation concern, including whimbrels (Numenius phaeopus), black-bellied plovers (Pluvialis squatarola), dowitchers (Limnodromus spp.), and dunlins and various sandpipers (Calidris spp.). An estimated 80% of the hemisphere’s populations of whimbrels use the mudflats as their last coastal stopover before heading inland to the interior Canadian Arctic to nest (Watts and Truitt, unpublished data). They feed on the high densities of fiddler crabs (Uca pugnax), found in abundance on mudflats in the coastal bays adjacent to the mainland. In addition, migratory oystercatchers also forage on intertidal sand and mudflats on oyster reefs. White scoters and long-tailed ducks (Clangula hyemalis) feed on mollusks and invertebrates on the mudflats, while Atlantic brant feeds on abundant macroalgae in flats.

A-22
Target Group 3. Tidal Saltmarshes 3.1 Tidal Saltmarshes Tidal saltmarshes are intertidal wetlands typically located in relatively protected lagoons behind barrier islands. Numerous critical ecological functions are provided by salt marshes, including shoreline stabilization, fish and wildlife habitat, nutrient and sediment cycling and sequestration, and serving as the basis of primary production with lagoon systems. Salt marshes provide essential breeding, refuge and forage habitats for many fish and invertebrate species. Eastern Shore seaside marine food webs are in large part powered by the continued primary production of over 80,000 acres of tidal salt marsh habitat. From “The Natural Communities of Virginia Classification of Ecological Community Groups (Version 2.2)”:
Non-riverine salt marshes are characterized by extremely low diversity and dominated by saltmarsh cordgrass (Spartina alterniflora), saltmeadow cordgrass (Spartina patens), saltgrass (Distichilis spicata
), or some combination thereof. Vegetation composition and stature generally reflect elevation of substrate, which influences salinity and frequency and duration of inundation. Low salt marsh, dominated by the “short form” of saltmarsh cordgrass, occupies lower surfaces and forms extensive mosaics on the seaside of the Eastern Shore. Saltgrass and saltmeadow cordgrass are the characteristic species of high salt marsh, which typically occurs on slightly elevated surfaces where tides may be less regular and where soils may concentrate salts.
3.2 Marsh-Specific Birds High marsh, occurring along the upland marsh interface consisting of lower stature vegetation dominated by Spartina patens and Distichilis spicata, is critical foraging and breeding habitat for saltmarsh sharp-tailed sparrow (Ammodramus caudacutus), seaside sparrow (Ammodramus maritimus), and clapper rails (Rallus longirostris). These species are cryptic and little is known about their productivity on the Eastern Shore. However, we know that sparrows and rails need large up to 50 hectares of intact undisturbed marshes for breeding (Watts, unpublished data). High marsh habitat is the most threatened marsh habitat due to its proximity to uplands and human activity as is most affected by agricultural activity, conversion, invasion by phragmites, and sea-level rise. The lagoon marsh islands (“low marsh”) of VCR are known to be critical wintering, foraging, roosting and breeding habitat for more than 70 bird species (Erwin et al. 2004). The marsh islands are of special importance for breeding colonial water nesting birds like black skimmers, Larus gulls, common, gull-billed terns, royal and Caspian terns, and the Forster’s tern, a marsh-nesting obligate. Oystercatchers also nest on the marsh islands. Mammal depredation on bird eggs is a lesser threat in lagoon marshes than on the barrier islands (an exception being Mockhorn marsh island), which is why these marshes are so important. The coastal bays and islands of the Eastern Shore of Virginia are the major wintering area in the Atlantic flyway for the American black duck (Anas rubripes) and a minor breeding

A-23
area in the summer months. The interior fresh and brackish marshes and ponds of the barrier islands provide nesting habitat for the breeding black ducks in the summer months, while the open salt marshes of the bays are prime wintering habitat for black ducks which nest in the maritime providences of Canada. Target Group 4. Upland Habitats 4.1 Migratory Landbirds and Raptors Each fall millions of migratory landbirds and raptors funnel through the lower Delmarva peninsula, making it one of the most important stopover and staging areas along the Atlantic flyway and in the eastern United States (Mabey et al. 1993, Watts and Mabey 1994, Mabey and Watts 2000). It is estimated that 5 million to 6 million neotropical (long distance migrant) landbirds and 10 million to 12 million temperate (short distance migrant) landbirds pass through the Southern Tip area during their fall migration (Watts and Mabey 1994). In addition, thousands of diurnal raptors, including bald eagles, Peregrine falcons, merlins, and sharp-shinned, red-tailed, and Cooper's hawks, pass through the southern tip of the peninsula in waves, often traveling with the waves of migrant landbirds that they depend on for food. Nearly 200 species of neotropical landbirds stop over on the Eastern Shore, representing about 70% of all breeding bird species in North America. Long-distance migrants are most abundant during the first half of the migratory period while short-distance migrants are most abundant during the last half of the season, even staying through the winter. The majority of neotropical migrants utilizing the Southern Tip are young of the year, likely funneled to the Shore by cold fronts and prevailing winds (Paxton and Watts 2001). Many of the migrant species are experiencing rapid population declines (Mabey et al. 1993, Watts and Mabey 1994). Fully one-half of all migrants flying south for the winter will not return to North America to breed in the spring, particularly those that winter on the Caribbean islands. The Eastern Shore is contributing to the decline in species, because many landbirds are not replenishing fat reserves during their stopover on the mainland. Local research on the stopover ecology of migratory landbirds indicates that food availability is limited on the Eastern Shore due to the degradation, conversion and fragmentation of diverse hardwood forest habitats. Migrants are concentrated in areas close to the Southern Tip coastline (within 0 km to 1.5 km), particularly on the lower bayside within the lower 10 km of the peninsula. However, it has been observed that birds are more abundant on barrier islands than the coastal mainland presumably due to the better foraging resources. The goal of forest restoration efforts on the Eastern Shore is to create forests that are structurally and compositionally diverse with a significant proportion of native hardwood species and soft-mast producers, so that the energetic benefit to migrants from plant and insect food items is maximized throughout the fall migration period. Specifically, hardwood-dominated forests with understory species like black gum, dogwood, holly, and sassafras are ideal stop-over habitat for land birds because they produce a high volume of
A-24
fruits and have leaves with ample surface areas that in turn produce abundant leaf litter which supports robust insect prey for migrants in the fall. 4.2 Freshwater Perennial Streams Non-tidal, freshwater reaches of seaside and bayside branches terminate in tidal creeks and marshes. Streams are low gradient, with stable, perennial groundwater fed flow, and sandy bottoms with heavy accumulation of organic debris, woody debris, and emergent vegetation growth (TNC 2002). Water chemistry is acidic to neutral, but has sufficient gradient to prevent heavy accumulation of tannins and formation of blackwater systems. Target supports a naturally depauperate, but distinct Coastal Plain fish community constituted by least brook lamprey (Lampetra aepyptera), American eel (Anguilla rostrata), chain pickerel (Esox niger), redfin pickerel (Esox americanus), Eastern mudminnow (Umbra pygmaea), golden shiner (Notemigonus crysoleucas), creek chubsucker (Erimyzon oblongus), brown bullhead (Ameiurus nebulosus), pirate perch (Aphredoderus sayanus), banded killifish (Fundulus diaphanus), mosquitofish (Gambusia holbrooki), bluespotted sunfish (Enneacanthus gloriosus), pumpkinseed (Lepomis gibbosus), and tesselated darter (Etheostoma olmstedi). Some streams likely support small runs of hickory and/or American shad. These streams also support a typical Coastal Plain macroinvertebrate community and may contain one or two relict populations of a freshwater mussel, Elliptio complanata. Freshwater perennial streams occur along both seaside and bayside stretches of the Delmarva Peninsula. Longest reaches of this system occur in branches on the bayside from northern Northampton County to Maryland and on the seaside in northern Accomack County. While similar streams occur throughout the Coastal Plain province, this target is distinct because of the unique zoogeographic position and young geologic age. Examples include Holdens Creek, Deep Creek, Bullbeggers Creek, Assawoman Creek, and tributaries of Pungoteague and Occohannock Creeks. 4.3 Non-Tidal Freshwater Wetlands Acidic Seepage Swamps (adapted from Fleming et al. 2001): Seepage swamps occur at headwaters of small streams and toe slopes of seeps. They are characterized by diffuse drainage or braided channels with sphagnum-covered hummock-and-hollow microtopography in an acidic, nutrient-poor, sandy or peaty substrate (Fleming et al. 2001). Dominant canopy species are red maple (Acer rubrum), blackgum (Nyssa sylvatica), tulip-poplar (Liriodendron tulipifera), and loblolly pine (Pinus taeda). Common understory trees and shrubs include sweetbay (Magnolia virginiana), sweet pepperbush (Clethra alnifolia), highbush blueberries (Vaccinium spp.), swamp azalea (Rhododendron viscosum) and possum-haw (Viburnum nudum) (Fleming et al. 2001). The herb layer may include skunk cabbage (Symplocarpus foetidus), Collins’ sedge (Carex collinsii), twining bartonia (Bartonia paniculata spp. paniculata) and sphagnum. Several species of dragonflies and damselflies depend on these forested seeps for breeding habitat.

A-25
Seepage swamps are distributed throughout the Piedmont and Chesapeake Bay Lowlands ecoregion. Communities are scattered along both sides of the Eastern Shore peninsula. Examples are known to occur in the headwaters of Mattawoman Creek on the bayside south of Machipongo and support populations of Plukenet’s flatsedge (Cyperus plukenetti) which is a state rare species. In addition, examples can be found in the upper reaches of the Machipongo/Parting Creek watershed. Sea Level Fens (adapted from Fleming et al. 2001): Maritime seepage wetlands occur just above highest tide levels, at the base of slopes where abundant groundwater discharges along the upper edges of estuarine bays and tidal creeks. The hydrology of these sites is best characterized as saturated, although shallow standing water and small, muck-filled pools are locally present at all sites. Soils are organic and nutrient-poor. The vegetation exhibits characteristics of both inland seepage bogs and oligohaline tidal marshes. Stands are generally a physiognomic mosaic of open woodland, scrub, and herbaceous patches. Characteristic woody species include red maple (Acer rubrum), black gum (Nyssa sylvatica), sweet bay (Magnolia virginiana), and wax myrtle (Myrica cerifica). Characteristic herbs include Cladium mariscoides, Eleocharis rostellata, Rhynchospora alba, R. oligantha, Erigeron vernus, Drosera intermedias, Eriocaulon decangulare, Centella erecta, Juncus pelocarpus, and Utricularia spp., several of which are state rare plants. These communities are globally rare and localized throughout their range from New Jersey to Virginia. Examples occur in Simoneaston Bay Fen, Assawoman Creek Fen, Mutton Hunk Fen, Coard’s Branch and Wallops Island Seeps. References Atlantic Flyway Council. 2002. Atlantic brant management plan. Retrieved from Maryland Department of Natural Resources on April 3, 2003. Website:
http://www.dnr.state.md.us/wildlife/waterfowl.html
Boettcher, R., T. Penn, R. Cross and K. Terwilliger. 2007. An overview of the status and distribution of Piping Plovers (Charadrius melodus) in Virginia. Waterbirds 30 (Special Publication 1):138-151. Brown, S., C. Hickey, B. Harrington, and R. Gill, eds. 2001. The U.S. Shorebird Conservation Plan, 2nd ed. Manomet Center for Conservation Sciences, Manomet, Massachusetts. Erwin, R.M., B.R. Truitt, and J.E. Jimenez. 2001. Ground-nesting waterbirds and mammalian carnivores in the Virginia barrier island region: running out of options. Journal of Coastal Research 17: 292-296. Erwin, R.M., J.D. Nichols, T.B. Eyler, D.B. Stotts, and B.R. Truitt. 1998. Modeling colony-site dynamics: a case study of gull-billed terns (Sterna nilotica) in coastal Virginia. Auk 115: 970-978. Mabey, S. E. and Watts, B. D. 2000. Conservation of Landbird Migrants: Addressing Local Policy. Pp. 99-108 in Stopover Ecology of Nearctic-Neotropical Landbird Migrants: Habitat
A-26
Relations and Conservation Implications (F.R. Moore, Ed.). Studies in Avian Biology No. 20, Allen Press, Lawrence, KS. Mabey, S. E., J. McCann, L. J. Niles, C. Bartlett, and P. Kerlinger. 1993. The Migratory Songbird Coastal Corridor Final Report. Report No. NA90AA-H-CZ839, Virginia Department of Environmental Quality Coastal Resources Management Program, Richmond, VA. Niles, L. J., H.P. Sitters, A.D. Dey, P.W. Atkinson, A.J. Baker, K.A. Bennett, K.E. Clark, N.A. Clark, C. Espoz, P.M. Gonzalez, B.A. Harrington, D.E. Hernandez, K.S. Kalasz, N.R. Mantus, C.D.T. Minton, R.I.G. Morrison, M.K. Peck, and I.L. Serrano. 2007. Status of the Red Knot (Calidris canutus rufa) in the Western Hemisphere. New Jersey Department of Environmental Protection, Division of Fish and Wildlife, Endangered & Nongame Species Program, Trenton, NY. Paxton, B. J. and B. D. Watts. 2001. Fall stop-over ecology of neotropical migrants: Are inner or outer coastal habitats energy sources for migrants. Center for Conservation Biology Research Report Series, CCBTR-01-11. College of William and Mary, Williamsburg, VA. Rounds, R.A. 2003. Nest-site selection and hatching success of four waterbird species in coastal Virginia. Unpublished Master of Science Thesis, University of Virginia, Charlottesville, VA. The Nature Conservancy. 2002. Chesapeake Bay Lowlands Ecoregional Plan. The Nature Conservancy’s Eastern Regional Office, Boston, MA. Unpublished report. Virginia Department of Game and Inland Fisheries. 2009. Special Status Faunal Species in Virginia. ://www.dgif.virginia.gov/wildlife/virginiatescspecies.pdf. Accessed 7 April 2010. Watts, B. D. and S. E. Mabey. 1993. Spatio-temporal patterns of landbird migration on the lower Delmarva Peninsula. Center for Conservation Biology Technical Report CCBTR-93-01, College of William and Mary. Watts, B. D. and S. E. Mabey. 1994. Migratory landbirds of the lower Delmarva: Habitat selection and geographic distribution. Center for Conservation Biology Technical Report CCBTR-94-05, College of William and Mary. Conservation Biology Technical Report CCBTR-94-05, College of William and Mary: 101 pp. Wilke, A.L., D.F. Brinker, B.D. Watts, A.H. Traut, R. Boettcher, J.M. McCann, B.R. Truitt and P. Denmon. 2007. American Oystercatchers in Maryland and Virginia: Status and Distribution. Waterbirds 30 (Special publication 1):152-162. Wilke, A.L., and R. Johnston-González . 2009. Conservation Plan for the Whimbrel (Numenius phaeopus). Version 1.0. Manomet Center for Conservation Sciences, Manomet, Massachusetts.
A-27
Wilke, A.L., R. Boettcher and C. Smith. 2009. 2008 Piping Plover, Wilson’s Plover and American Oystercatcher Breeding Status in Virginia. Final Report submitted to the Virginia Department of Conservation and Recreation Division of Natural Heritage, Nassawadox, VA. 23 Pp. Williams, W., W. Akers, M. Beck, R. Beck, and J. Via. 2001. A summary of the twenty-fifth annual beach-nesting and colonial waterbirds survey of the Virginia barrier islands 1999. Raven 72: 13-16.

A-28
A-29
Appendix C. Description of Global Climate Change Factors and Trends Accelerated Sea level Rise and Storminess Accelerated sea-level rise and resulting inundation of low-lying coastal areas such as the Eastern Shore of Virginia are among the most immediate threats resulting from global climate change. The Mid-Atlantic area (defined as New York to North Carolina) is currently experiencing rates of sea-level rise that are significantly higher than the global mean due to land subsidence and compaction of sediments (Williams et al. 2009). Based on tidal gauge observations, the Mid-Atlantic’s rate of sea-level rise ranges from 2.4 mm to 4.4 mm per year—compared to the global rate of 1.7 mm per year—with the highest rates in the region occurring between New Jersey and southern Virginia. Average rate of sea-level rise at the Virginia Coast Reserve is approximately 4 mm per year (NOAA 2010). According to the IPCC Fourth Assessment Report (Nicholls et al. 2007) global sea-level rise will likely increase by 18 mm to 59 mm by 2100. However, the rate of sea-level rise may be much higher due to melt water contributions from Greenland and Antarctica, which were excluded from the 2007 IPCC models due to uncertainty. Recent studies of ice cover and glacial melting have revealed that ice loss and subsequent melt water contributions are significantly higher than previously thought, and the prediction now generally accepted is that sea levels will rise by 1 meter or more by 2100 (Williams et al. 2009). Accelerated rates of sea-level rise may cause the following physical and ecological effects to occur in coastal systems (Williams et al. 2009 and Nicholls et al 2007):
• Land loss through submergence and erosion of lands • Migration of coastal land forms and habitats • Increased frequency and extent of storm-related flooding • Wetland losses and change • Saltwater intrusion and increased salinity in estuaries
The local effects of accelerated sea-level rise are determined by the sediment budgets, elevation and rate of subsidence as well as storm intensity and frequency. Sea-level rise also increases a coast’s vulnerability to storms since normal storm surges occur at greater elevations, magnitudes and recurrence intervals due to the increased volume of water (Fitzgerald et al. 2008). A subject of much debate in the scientific community is whether changes in the intensity and frequency of storms (also called “storminess”), especially in coastal areas, can be linked to global climate change independent of sea-level rise. Storms include both tropical storms or hurricanes and extratropical storms locally known as “nor’easters.” Storms are typically defined as weather systems that produce waves in deep water of 1.6 meters or more (Dolan et al. 1988). In Virginia, hurricanes occur mostly during summer months and are infrequent, characterized by high wind speeds and large storm surges, move rapidly and are of short duration. Extratropical storms are far more common storms of middle and higher latitudes, occurring with the highest frequency and intensity in the winter months (Hayden 2003, Dolan and Davis 1992). These storms are larger than hurricanes, moving more slowly with longer durations and capable of producing equally powerful storm surges

A-30
(Dolan and Davis 1992). Nor’easters are responsible for much of the major morphological changes such as erosion, overwash and rollover events that “rework” coastal sediments on the barrier islands, channels, and inlets (Dolan 1988). Like sea-level rise, storminess is part of the natural disturbance regime that has shaped the barrier islands and coasts for centuries, which makes it very difficult to determine changes in frequency and intensity outside the natural range of variation. The IPCC report (Nicholls et al. 2007) suggests that increases in intensity for both tropical and extra-tropical storms may occur under increased emissions scenarios leading to increased extreme water levels and wave heights, increased episodic erosion, storm damage and flooding. Researchers have observed a strong correlation between increased hurricane power and increased sea surface temperatures in the North Atlantic Ocean over the last 30 years (Emanuel et al. 2008, Karl et al 2008). Increasing sea surface temperatures due to global climate change are projected to lead to increased intensity of hurricanes, though there is much debate about whether this will also affect the frequency or tracking of these storms. The implications of these projections for the Atlantic are not well understood. Even less conclusive is whether any linkage can be established between global climate change and extra-tropical storms. A recent report from the National Climate Science Program projects that “there are likely to be more frequent deep low-pressure systems (strong storms)…with stronger and more extreme wave heights,” while also admitting that “evidence in the Atlantic is insufficient to draw a conclusion about changes in [extra-tropical] storm strength” resulting from global climate change (Karl et al. 2008). In a study of storminess in all of North America from 1885-1996, Hayden (1999) concluded that “the variation in storminess has not changed in a systematic way over the course of the past century.” The models currently used to predict changes in storm frequency and intensity with carbon dioxide induced increases in temperature are not in agreement and therefore no conclusions can be made (Hayden 1999). VCR has had 15 storms (extratropical cyclones) on average per year from 1885 to 1990. There is great variability from year to year with a low of about two storms and a high of about 39 storms; there are periods of more storminess followed by periods of less storminess (Hayden & Hayden 2003). More studies are necessary to determine whether there are statistically significant changes in storm patterns related to increased carbon emissions. The only valid prediction regarding storminess caused by global climate change is that increasing sea surface temperature may lead to more intense hurricanes. Beyond this association, given the scant evidence that global climate change is causing increased frequency and intensity of storms and for the purposes of this report, we assume that storm intensity (not frequency) is only a “threat” to the ecological systems at VCR when coupled with accelerated sea-level rise, and we do not evaluate storminess independently.

A-31
Air temperature extremes According to the most recent publication by the U.S. Global Change Research Program entitled “Global Climate Change Impacts in the United States” (Karl et al. 2009), average temperature in the United State has risen more than 2°F in the last 50 years and is predicted to accelerate in the future under even the lowest emissions scenarios (Karl et al. 2009). Using The Nature Conservancy’s Climate Wizard, a web-based interface that uses ensemble analysis to combine the output of 16 General Circulation Models under three emission scenarios and allows the user to query past and future changes for temperature and rainfall in areas at a around the world ( .climatewiz.org), the coastal plain of Virginia is likely to experience a minimum of 2.56°F - 5.08°F temperature increase under low emissions scenarios and a 3.74°F - 8.10°F temperature increase under high emissions scenarios. As summarized in the Karl et al. (2009) report, collectively, “climate models project continued warming in all seasons across the Southeast and an increase in the rate of warming through the end of this century….with the greatest temperature increases projected to occur in the summer months.” Moreover, there will be shorter winters with fewer freezing days. Altered precipitation patterns are closely associated with shifts in temperature. According to Climate Wizard, under low emissions scenarios, precipitation rates in Virginia’s coastal plain may decrease by 1% or increase by 15%, and under high scenarios, decrease by almost 17% or increase by 18%. Clearly, predicting changing trends in precipitation is equivocal at best, contradictory at worst; however, changing patterns are almost certain and will likely be characterized by more extremes, including increased downpour events (which have increased by 20% across the United States over the last century), wetter winters, and more frequent periods of short-term droughts (1-3 months). Altered water temperature Global surface ocean temperatures are predicted by the IPCC to increase between 1.5°C and 2.6°C by 2100 (Nicholls et al. 2007). Effects of warming water temperatures in coastal bays of the Eastern Shore include mortality of organisms and contraction of their geographical ranges and general shifts in distribution and abundances of a wide range of coastal estuarine species. These shifts can have far reaching impact on the relationships between predators and prey, resource competitors and resources, and pathogens/ diseases and their hosts. Moreover, the entire biogeochemistry of estuaries is a function of temperature. Temperature affects multiple key attributes of estuarine function such a light availability, dissolved oxygen, carbonate solubility, nitrogen fixation and denitrification. Increased water temperature can alter all of these functions with multiple consequences, including increased harmful algal blooms (HABs), ocean acidification, and increased rates of disease and pathogens. Ultimately, Nicholls et al (2007) conclude: “While temperature is important in regulating physiological processes in estuaries, predicting the ecological outcome is complicated by the feedbacks and interactions among temperature change and independent physical and biogeochemical processes such as eutrophication.”

A-32
Ocean acidification Higher emissions of carbon dioxide and other greenhouse gases due to human activity are largely sequestered in the ocean, one of the biggest carbon sinks on the planet. As this happens, the pH of the ocean water is reduced, leading to reduced solubility of calcium carbonate. This inhibits the ability of calcareous organisms such as plankton and corals to build shell exo-skeletons, especially in higher latitudes where colder, more calcium-rich waters are at higher risk for undersaturation (Orr et al. 2005). While average ocean pH is 8.05, the IPCC predicts that pH will fall to 8.00 under a low emissions scenario or to 7.7 under a high emissions scenario by the end of the century (Nicholls et al. 2007). Many scientists agree that marine organisms are sensitive to a 0.2 drop in pH (Caldeira et al. 2007). Moreover, Orr et al. (2005) predict that that dissolved inorganic carbon will decrease 60% in oceans by 2100, leading to widespread reduction in calcium carbonate saturation. It is unknown how pH and carbonate saturation levels will be affected in coastal and estuarine waters of the mid-Atlantic.
Caldeira, K; Archer, D; Barry, JP; Bellerby, RGJ; Brewer, PG; Cao, L; Dickson, AG; Doney, SC; Elderfield, H; Fabry, VJ; Feely, RA; Gattuso, JP; Haugan, PM; Hoegh-Guldberg, O; Jain, AK; Kleypas, JA; Langdon, C; Orr, JC; Ridgwell, A; Sabine, CL; Seibel, BA; Shirayama, Y; Turley, C; Watson, AJ; Zeebe, RE, 2007. Comment on “Modern-age buildup of CO2 and its effects on seawater acidity and salinity” by Hugo A. Loaiciga, Geophysical Research Letters 34 (18): Art. No. L18608, 2007.
References
Dolan, R. and R.E. Davis. 1992. An intensity scale for Atlantic Coast northeast storms. Journal of Coastal Research, Vol. 8, No. 4, pp. 840-853. Dolan, R, Lins H, Hayden BP. 1988. Mid-Atlantic Coastal Storms. J. Coastal Res.. 4:417-433. Emanuel, K., R. Sundararajan, and J. Williams, 2008: Hurricanes and global warming: Results from downscaling IPCC AR4 simulations. Bulletin of the American Meteorological Society, 89(3), 347-367. Fitzgerald, D.M., M.S. Fenster, B.A. Argow, I.V. Buynevich. 2008. Coastal impacts due to sea-level rise. Annual Review of Earth and Planetary Sciences. 36:601-47. Hauser, C. and S. Hamilton, 2009. Sensitivity of post-hurricane beach and dune recovery to event frequency, Earth Surface Processes and Landforms, 34, pp 613-628. Fleming, G.P., P.P Coulling, D.P. Walton, K.M. McCoy, and M.R. Parrish. 2001. The natural communities of Virginia: classification of ecological community groups. First approximation. Natural Heritage Technical Report 01-1. Virginia Department of Conservation and Recreation, Division of natural Heritage, Richmond, VA. Unpublished report. 76 pp.

A-33
Hayden, B. P., M. C. F. V. Santosa, G. Shaoa and R. C. Kochelb, 1995. Geomorphological controls on coastal vegetation at the Virginia Coast Reserve, Geomorphology, 13, pp 283-300 Hayden, B.P. 1999. Climate Change and Extratropical Storminess in the United States. Journal of the American Water Resources Association, vol. 35, Issue 6, p.1387-1397 Hayden, B.P & Hayden, N.R. 2003. Decadal and century-long changes in storminess at long-term ecological research sites. p262-285. In D. Greenland, D.C. Goodin, & R.C. Smith (eds.) Climate Variability and Ecosystem Response at Long-Term Ecological Research Sites. Oxford University Press, New York, NY, USA. Karl, T.R., G.A. Meehl, T.C. Peterson, K.E. Kunkel, W.J. Gutowski Jr., and D.R. Easterling, 2008: Executive summary. In: Weather and Climate Extremes in a Changing Climate. Regions of Focus: North America, Hawaii, Caribbean, and U.S. Pacific Islands [Karl, T.R., G.A. Meehl, C.D. Miller, S.J. Hassol, A.M. Waple, and W.L. Murray (eds.)]. Synthesis and Assessment Product 3.3. U.S. Climate Change Science Program, Washington, DC, pp. 1-9. Karl, Jerry M. Melillo, and Thomas C. Peterson, (eds.). 2009. Global Climate Change Impacts in the United States US Global Climate Change Research Program report. Nicholls, R.J., P.P Wong, V.R. Burkett, J.O. Codignotto, J.E. Hay, R.F. McLean, S. Ragoonaden and C.D. Woodroffe, 2007. Coastal Systems and low-lying areas. Climate Change 2007: Impacts, Adaptation and Vulnerability. Contribution of Working Group II to the Fourth Assessment Report of the Intergovernmental Panel on Climate Change, M.L. Parry, O.F. Canziani, J.P. Palutikof, P.J. van der Linden and C.E. Hansen, Eds., Cambridge University Press, Cambridge, UK, pp 315-356. NOAA Center for Operational Oceanographic Products and Services. 2010. NOAA Tide Predictions Database. Found at ://www.tidesandcurrents.noaa.gov/. NOAA, Sliver Spring, MD. Orr JC, Fabry VJ, Aumont O, Bopp L, Doney SC, Feely RA, Gnanadesikan A, Gruber N, Ishida A, Joos F, Key RM, Lindsay K, Maier-Reimer E, Matear R, Monfray P, Mouchet A, Najjar RG, Plattner G-K, Rodgers KB, Sabine CL, Sarmiento JL, Schlitzer R, Slater RD, Totterdell IJ, Weirig M-F, Yamanaka Y, Yool A . 2005. Anthropogenic ocean acidification over the twenty-first century and its impact on calcifying organisms. Nature 437: 681-686 Poulter B, N. L. Christensen and S. S. Qian, 2008. Tolerance of Pinus taeda and Pinus serotina to low salinity and flooding: Implications for equilibrium vegetation dynamics, Journal of Vegetation Science, 19(1), pp 15-22. Williams, S.J., B.T. Gutierrez, J.G. Titus, S.K. Gill, D.R. Cahoon, E.R. Thieler, K.E. Anderson, D. FitzGerald, V. Burkett, and J. Samenow. 2009. Sea-level rise and its effects on the coast. In: Coastal Sensitivity to Sea-Level Rise: A Focus on the Mid-Atlantic Region. A report by the U.S. Climate Change Science Program and the Subcommittee on Global Change Research. [J.G. Titus (coordinating lead author), K.E. Anderson, D.R. Cahoon, D.B. Gesch, S.K. Gill, B.T.
A-34
Gutierrez, E.R. Thieler, and S.J. Williams (lead authors)]. U.S. Environmental Protection Agency, Washington DC, pp. 11-24.