effects of fibroglandular tissue … of fibroglandular tissue distribu-tion on data-independent...
TRANSCRIPT

Progress In Electromagnetics Research, PIER 97, 141–158, 2009
EFFECTS OF FIBROGLANDULAR TISSUE DISTRIBU-TION ON DATA-INDEPENDENT BEAMFORMING AL-GORITHMS
M. O’Halloran, M. Glavin, and E. Jones
Electronic and Electrical EngineeringNational University of Ireland GalwayIreland
Abstract—The effects of the fibroglandular tissue distribution ofthe breast on data-independent microwave imaging algorithms areinvestigated in this paper. A data-independent beamformer is abeamformer whose weights do not depend on the array data and arechosen, based on a channel model, to compensate for path-dependentattenuation and phase effects. The effectiveness and robustnessof data-independent UWB beamforming algorithms relies upon twospecific characteristics of breast tissue at microwave frequencies:Firstly, that there exists a significant dielectric contrast betweencancerous tissue and normal healthy breast tissue; secondly, that thepropagation, attenuation and phase characteristics of normal tissueallow for constructive addition of the UWB returns using the ConfocalMicrowave Imaging (CMI) technique. However, two recent studiesby Lazebnik et al. have highlighted a significant dielectric contrastbetween normal adipose and fibroglandular tissue within the breast.These results suggest a much more difficult imaging scenario whereclutter due to fibroglandular tissue is a significant concern and thatconstructive addition of backscattered signals is potentially muchmore problematic than previously assumed. In this paper, threeexisting data-independent beamformers are tested on several differentbreast models, examining the effect of different fibroglandular tissuedistribution on the performance of the data-independent imagingalgorithms.
Corresponding author: M. O’Halloran ([email protected]).
142 O’Halloran, Glavin, and Jones
1. INTRODUCTION
In recent years, microwave imaging of the breast has been seen asone of the most promising alternatives to X-ray mammography forthe early detection of breast cancer. Worldwide, the incidence ofbreast cancer has increased by 0.5% annually, with between 1.35 and1.45million new cases projected by 2010. Breast cancer mortalityis on the decline in industrialized countries such as the UnitedStates, Canada, Germany, Austria and the United Kingdom and thisdecline can be attributed in no small part to increased breast cancerscreening, and the early detection and treatment of the disease [1]. Acomprehensive physical examination and regular self-examination areoften successful in tumor detection while randomized clinical trialsusing X-ray mammography have been shown to detect tumors atan earlier stage and reduce disease-specific mortality. However, thesignificant limitations of X-ray mammography in terms of sensitivityand specificity are well documented, and the motivation for improvedbreast imaging modalities is clear [1]. The goal is to develop an imagingsystem that will reliably detect the presence and location of breastcancer at the earliest stage of development, when intervention is mosteffective.
Two criteria determine the effectiveness of any breast cancerscreening methodology, specificity and sensitivity. Specificity is definedas the proportion of patients correctly identified as not having breastcancer. Conversely, sensitivity is defined as the proportion of patientscorrectly identified as having as breast cancer. Therefore, a goodscreening methodology must have both high sensitivity and specificity.If the screening technology determines the presence of a tumor, twofurther criteria become significant: The ability of the technology tolocalize the abnormalities within the breast for further examination ortreatment, and the ability of the technology to accurately characterizethe abnormality and help in the decision-making process. An idealimaging technology would accomplish all these goals, and in addition,be inexpensive, practical, harmless and appealing to the patient.Microwave imaging has the potential to meet these goals.
Ultra-wideband (UWB) Radar imaging of the breast is basedon the dielectric contrast between normal and cancerous tissue atmicrowave frequencies. The breast presents a relatively small volume,making it an attractive site for microwave imaging, and since the breastis primarily composed of adipose tissue, it is relatively penetrable toUWB signals. UWB imaging algorithms typically involve illuminatingthe breast with a UWB pulse, and then measuring the backscatteredsignals. The Confocal Microwave Imaging (CMI) approach is used
Progress In Electromagnetics Research, PIER 97, 2009 143
to process these backscattered signals to create a high resolutionbackscattered energy distribution map, where regions of high energysuggest the potential presence of cancerous tissue.
Based on several studies examining the dielectric properties ofnormal and cancerous breast tissue, UWB beamforming algorithmswere developed based on the following set of assumptions:
• There is a significant dielectric contrast between normal andcancerous breast tissue.
• The breast is primarily dielectrically homogeneous.• The dielectric properties of normal tissue is such that constructive
addition of UWB backscattered signals is possible.
However, a much more recent study of the dielectric properties ofadipose, fibroglandular and cancerous breast tissue has highlighted thedielectric heterogeneity of normal breast tissue [2, 3]. The dielectricproperties of adipose tissue was found to be lower than any previouslypublished data for normal tissue. Conversely, the dielectric propertiesof fibroglandular tissue was found to be significantly higher than anypreviously published data for normal breast tissue, and the dielectriccontrast between this tissue and cancerous tissue was found to be aslittle as 10%. This heterogeneity of normal breast tissue had beenconsiderably underestimated by previous studies, and presents a muchdifficult imaging scenario.
The performance and robustness of data-independent beamform-ers in the context of this increased dielectric heterogeneity has not yetbeen comprehensively examined. In this paper, three existing data-independent beamformers are examined and evaluated with respect tothis heterogeneity. The remainder of the paper is organized as fol-lows: Section 2 will examine the recently-established dielectric het-erogeneity of normal breast tissue; Section 3 will describe the threedata-independent beamformers tested; Section 4 will describe the testprocedure and corresponding results; Finally, the conclusions and sug-gestions for future work are detailed in Section 5.
2. DIELECTRIC HETEROGENEITY OF NORMALBREAST TISSUE
The dielectric properties of both normal and cancerous tissue havebeen the subject of many studies over the last thirty years, and thegeneral findings are summarised here. Chaudhary [4], Surowiec [5]and Joines et al. [6] measured the dielectric properties of normal andcancerous breast tissues from 3MHz and 3 GHz, 20 kHz to 100 MHz,and 50MHz to 900MHz respectively. These studies found a significant

144 O’Halloran, Glavin, and Jones
dielectric contrast between normal and cancerous tissue. The measuredpermittivity and conductivity as established by Chaudhary, Surowiecand Joines et al. are shown in Figures 1, 2 and 3.
Campbell and Land [7] measured the complex permittivity offemale breast tissue at 3.2 GHz, and once again noted a significantdielectric contrast between normal (fat tissue and all other breasttissue) and cancerous tissue. However, the study also suggested that
(a) (b)
Figure 1. The variation of (a) the relative permittivity, and (b) theconductivity of tumour tissue, the surrounding tissue, and peripheraltissue across the frequency band of 0.02 MHz and 100 MHz as reportedby Surowiec et al. [5].
(a) (b)
Figure 2. The variation of the relative permittivity (a) andconductivity (b) of normal and malignant tissue between 3 MHz and3GHz as reported by Chaudhary et al. [4].

Progress In Electromagnetics Research, PIER 97, 2009 145
(a) (b)
Figure 3. The variation of (a) the relative permittivity, and (b)the conductivity of normal and malignant tissue between 50 MHz and900MHz as reported by Joines et al. [6].
Table 1. Dielectric properties of female breast tissue at 3.2 GHz asreported by Campbell and Land [7].
Tissue typeRelative
PermittivityConductivity
(S/m)Water
content (%)Fatty tissue 2.8–7.6 0.54–2.9 11–31
Normal tissue 9.8–46 3.7–34 41–76Benign tissue 15–67 7–49 62–84
Malignant tissue 9–59 2–34 66–79
Table 2. Average dielectric properties of female breast tissue at900MHz measured in vivo using an active microwave imaging systemdeveloped by Meaney et al. [8].
Patient Age Average Permittivity Average Conductivity (S/m)1 76 17.22±11.21 0.5892±0.35472 57 31.14±4.35 0.6902±0.36503 52 36.44±6.24 0.6869±0.31564 49 35.43±3.93 0.5943±0.38415 48 30.85±7.22 0.6350±0.3550
the range of dielectric properties of normal tissue was much greaterthan established in previous studies. These results are summarised inTable 1.

146 O’Halloran, Glavin, and Jones
Furthermore, Meaney et al. measured the average permittivityand conductivity of cancer-free breast tissue using a clinical prototypeof a tomographic microwave imaging system, the results of whichare shown in Table 2. Once again, Meaney et al. [8] noted thatthe average permittivity values of normal tissue at 900 MHz weresignificantly higher than those previously published in Joines et al.’sex vivo study [6]. Meaney et al. suggested that a correlation existedbetween the average permittivity values and the radiographic density ofthe tissue, since patients categorised radiographically as having high fatcontent tissue had an average permittivity value of 31, while patientscategorised as having heterogeneously dense tissue had average relativepermittivities between 35 and 36.
Finally, one of the most recent, and arguably most comprehensiveexaminations of the dielectric properties of normal and malignanttissue, was undertaken by Lazebnik et al. [2, 3]. One of the mostsignificant differences between Lazebnik et al.’s first study and previousstudies was the histological categorisation of the samples. Each sampleunder consideration was quantified in terms of the percentage ofadipose, glandular and fibroglandular tissue present in the sample.In order to effectively summarise the data, Lazebnik et al. formed 3groups of tissue:(i) Group 1 contained all samples with 0–30% adipose tissue (99
samples).(ii) Group 2 contained all samples with 31–84% adipose tissue (84
(a) (b)
Figure 4. The relative permittivity (a), and conductivity (b) ofnormal breast tissue as measured by Lazebnik et al. [2] over thefrequency band 0.5 to 20GHz. Group 1 represents 0–30% adiposetissue, group 2 represents 31–84% adipose and group 3 represents 85–100% adipose tissue.
Progress In Electromagnetics Research, PIER 97, 2009 147
samples).(iii) Group 3 contained all samples with 85–100% adipose content (171
samples).
Median permittivity and conductivity curves were created bycalculating the fitted values for each sample in the group at 50 equallyspaced frequency points. Secondly, the median value at a particularfrequency was calculated across all samples within a group. Finally,Cole-Cole equations were used to fit these median values. The Cole-Cole representations for permittivity and conductivity for each tissuegroup are shown in Figure 4. Lazebnik et al. compared the results ofher study with the results of previous studies and her findings were asfollows:
(i) Lazebnik et al.’s median dielectric curves (relative permittivityand conductivity) for group 3 tissue was lower than any previouslypublished data for normal tissue, as shown in Figure 4. This tissueconsists of between 85 and 100% adipose tissue.
(ii) Lazebnik et al.’s median dielectric curves (relative permittivityand conductivity) for group 1 tissue was higher than anypreviously published data for normal tissue. This tissue has a lowadipose content between 0 and 30% (due to the high concentrationof fibroglandular tissue).
(iii) With the exception of data published by Campbell and Land [7],the dielectric properties of breast tissue (both adipose andfibroglandular) spanned a much greater range of values than hadbeen reported in smaller scale studies.
Lazebnik et al. attributed these differences to the large heterogeneityin normal breast tissue, as previously noted by Campbell and Land [7].Lazebnik et al. suggested that the reason that this level of heterogeneitywas not found in previous studies was the location from which samplesof normal tissue were taken. In previous studies, the samples ofnormal tissue were taken from regions distinct from the tumour site,and since tumours typically occur in glandular tissue, these normalsamples were likely to have a higher adipose content compared tothe glandular tissue surrounding the tumour. Therefore, the dielectricheterogeneity of breast tissue was previous underestimated. Lazebniket al. also concluded that the dielectric properties of breast tissue wereprimarily a function of the adipose content of the tissue. The effectof this heterogeneity on data-independent beamformers has yet to becomprehensively examined.

148 O’Halloran, Glavin, and Jones
3. DATA-INDEPENDENT BEAMFORMINGALGORITHMS
In this section, three data-independent breast imaging algorithms aredetailed, the Delay and Sum (DAS), the Improved Delay and Sum(IDAS), and the Delay, Multiply and Sum (DMAS) beamformer.
3.1. Delay and Sum Beamformer
The monostatic Delay and Sum beamformer was originally developedby Hagness et al. [9, 10], and extended to the multistatic case byNilavalan et al. [11]. First, consider a voxel r0 within the breast. Inthe multistatic DAS algorithm, the distance from each transmittingantenna to r0 and back to the receiving antenna is calculated basedon the average speed of propagation, and converted into time delays.These time delays are used to isolate the response from r0 withineach multistatic signal. These responses are summed and squared tocalculate the intensity value associated with the point r0, as shown inEquation (1)
I(r0) =
[M∑
m=1
M∑
n=1
Bm,n(τm,n(r0))
]2
(1)
where Bm,n is the backscattered waveform transmitted from the mthantenna and received at the nth antenna and τm,n(r0) is defined asfollows:
τm,n(r0) =dm,n
s
1f
(2)
where dm,n is the distance from the mth transmitting antenna to thepoint r0 and back to the nth receiving antenna, f is the samplingfrequency, and s is the average speed of propagation in breast tissueand is defined as follows:
s =c√εr
(3)
where εr is the relative permittivity of normal adipose tissue at thecentre frequency of the UWB input signal and c is the speed of light.The synthetic focal point r0 is then scanned throughout the breast andan image of the backscattered energy from within the breast is created.
3.2. Delay Multiply and Sum Beamformer
The Delay, Multiply and Sum algorithm [12] once again involvessynthetically focusing the backscattered signals at a focal pointwithin the breast, and then scanning this focal point throughout the

Progress In Electromagnetics Research, PIER 97, 2009 149
breast. The signals are time-aligned using the procedure describedabove. Following time-alignment, an additional pairing multiplicationprocedure is applied. This procedure involves pair-multiplying eachmultistatic signal with the other multistatic signals which have acommon transmitting antenna. The multiplied signals are thensummed and squared, and the intensity at the point r0 is calculated.
3.3. Improved Delay and Sum Beamformer
The Improved Delay and Sum (IDAS) algorithm was developed byKlemm et al. [13]. The beamformer is based on the weighted Delay andSum beamformer, with the weights compensating for both attenuationand radial spreading of the UWB pulse. The algorithm uses an extraweighting factor, based on the coherence of the backscattered responsesat each synthetic focal point within the breast. For each point r0, aplot of energy collected versus number of multistatic signals is created.This energy curve is normalised by multiplying the curve by 1
1+σe,
where σe is the standard deviation of the energy. Finally, a second-order polynomial is fitted to the normalised energy curve (ax2+bx+c).The coefficient a is a measure of the coherence of the backscatteredsignals at the point r0. The Quality Factor, QF , associated with pointr0 is assigned the value a, and the Improved Delay and Sum algorithmis then defined as follows:
I(r0) = QF (r0) ·[
M∑
m=1
M∑
n=1
w(r0)Bm,n(τm,n(r0))
]2
(4)
where w(r0) is the weighting factor associated with the point r0.
4. TESTING AND RESULTS
In this section, the effects of different distributions of fibroglandulartissue within the breast on the performance of these data-independentbeamformers is evaluated. The beamformers are tested on 2D FiniteDifference Time Domain (FDTD)-generated backscattered signalsfrom three breast phantoms with increasing levels of fibroglandularheterogeneity. Section 4.1 details the FDTD breast models used togenerate the representative backscattered signals and the metrics usedto evaluate the beamformers, while Section 5 describes the testingprocedure and the corresponding results.

150 O’Halloran, Glavin, and Jones
4.1. FDTD Models for Data Acquisition
Three numerical breast phantoms were created using the FDTDmethod, reflecting increasing levels of fibroglandular tissue within thebreast. An accurate FDTD model must incorporate the appropriategeometrical properties of the breast, the heterogeneity and spatialdistribution of the different constituent tissues within the breast,while also reflecting the most recent and most accurate dielectricproperties. The models are that of a naturally flattened breast from apatient lying in the supine position. Therefore, in two dimensions, asagittal slice of breast is considered with a planar conformal antennaarray placed close to the skin. The antenna array consists of 14elements modeled as electric-current sources, and are equally spacedon the surface of the skin along the horizontal span-axis from 1 cm to9 cm. The antenna array is backed by a synthetic material matchingthe dielectric properties of skin. The adipose/fibroglandular tissuedistribution within the breast is established by linearly mapping theregions of adipose and fibroglandular tissue from a high resolutionT2 weighted MR image to the FDTD grid, as previously used byLi et al. [14]. The lighter regions within the breast representedfibroglandular tissue, while the darker regions represented adiposetissue. A simple thresholding algorithm was applied to the MRI scanto differentiate between the different regions of tissue, and then alinear transformation algorithm was used to map the tissue distributionin the MRI scan to the FDTD grid. This method was chosensince it preserved the highly correlated nature of fibroglandular tissuedistribution in the breast, as opposed to the other methods that modelthe variance of dielectric properties as being randomly distributed.
Three FDTD models are created. The first model contains onlyadipose tissue and no fibroglandular tissue. This model acts as an“idea” imaging scenario for the beamformers and is a useful benchmarkin determining the effects of fibroglandular tissue within the breast.The second model is based on an MRI slice taken at a distance fromthe areola and nipple, where the fibroglandular distribution is lesssignificant. In this model, there are significant regions of fibroglandulartissue, but also regions of adipose tissue where no fibroglandulartissue is present. The third model is based on a sagittal slice closeto the areola, where the fibroglandular tissue distribution is muchmore significant and presents a much more difficult imaging scenario.The three models are shown in Figure 5. The dielectric propertiesof adipose and fibroglandular tissue used in the FDTD models arebased on Lazebnik et al.’s recent publications [2, 3]. Lazebnik et al.defined the 25th, 50th, and 75th percentile of the measured dielectricproperties of adipose and fibroglandular as low, medium and high

Progress In Electromagnetics Research, PIER 97, 2009 151
(a) Simple Model (b) Normal Model
(c) Dense Model
Figure 5. FDTD Models of the breast. The first model contains nofibroglandular tissue, the second contains a normal distribution and thethird model is that of a dense breast where the fibroglandular tissuecontent is significant. Note: depth is measured on the vertical axis andspan is measured on the horizontal axis.
values respectively. The dielectric properties used in the FDTDmodels described here are based on the median values. As previouslydescribed, Lazebnik et al. matched the frequency-dependence of thedielectric properties to Cole-Cole models. However, the frequencydependence of the dielectric properties of breast tissue is more readilyincorporated into FDTD simulations using Debye parameters ratherthan Cole-Cole parameters, and therefore Debye parameters whichprovided an excellent fit to the Cole-Cole models across the frequencyrange of interest (100 MHz to 10GHz) were derived empirically (similarDebye models have since been derived by Lazebnik et al. [15]).
The Debye parameters for skin are chosen to fit published data byGabriel et al. [15, 16], while the Debye parameters for malignant tissueare those used by Bond et al. [17]. The Debye parameters for each typeof tissue, along with the permittivity and conductivity at the centrefrequency, are shown in Table 3.
The FDTD grid resolution, dx, is 0.5 mm and the time stepdt is defined as 0.833 ps (dt = dx
2c ). A specific location within theFDTD model is defined as follows: (span, depth). A 10 mm tumouris artificially introduced at two different positions within the model:(4.0, 1.5) and (6.0, 1.5). A scan involves sequentially illuminating the

152 O’Halloran, Glavin, and Jones
breast model with a UWB pulse from each antenna, while recording thebackscattered signal at all antennas. Since there are 14 antenna arrayelements, this results in 196 recorded multistatic signals. Before furtherprocessing, the signals are downsampled from 1200 GHz (the time stepin the FDTD simulation) to 50 GHz. The input signal is a 150-psdifferentiated Gaussian pulse, with a centre frequency of 7.5 GHz anda −3 dB bandwidth of 9 GHz. An idealized artifact removal algorithm,as previously described by Bond et al. [17] is used to remove the inputsignal and the reflection from the skin-breast interface. The artifact tobe removed is established by measuring the backscattered signals fromthe first homogeneous FDTD model with no tumour present. Thesesignals are then subtracted channel-by-channel from the with-tumourresponses. Finally, since the input signal is a differentiated Gaussianpulse with a zero crossing at its centre point, the backscattered signalfrom any dielectric scatterer would also have a zero crossing at itscentre point. In order to overcome this, the signals are integrated toproduce a maximum at the centre point.
4.2. Metrics
Two metrics are used to determine the performance of thebeamformers. The first metric is the Signal to Clutter ratio (S/C)which is defined as the ratio of the peak tumour response to themaximum clutter energy in the breast [19, 20]. The second metricis the Signal to Mean ratio (S/M) which is defined as the ratio of thepeak tumour energy to the mean energy within the breast [12].
5. RESULTS
Six FDTD simulations were completed, with a tumour at two differentlocations across the three distribution models, as shown in Figure 5.
Table 3. Debye parameters for the FDTD model and dielectricproperties of each tissue at the centre frequency of the input pulse.
Tissue εr χ1 σ t0 (ps)Relative
Perm.
Cond.
(S/m)
Skin 15.63 8.2 0.82 12.6 21.65 2.35
Tumor 7 47 0.15 7 49.2 6.1
Adipose
(Medium)3.20 1.65 0.035 16 4.30 0.38
Fibroglandular
(Medium)11.2 38 0.738 12 39.65 7.65
Progress In Electromagnetics Research, PIER 97, 2009 153
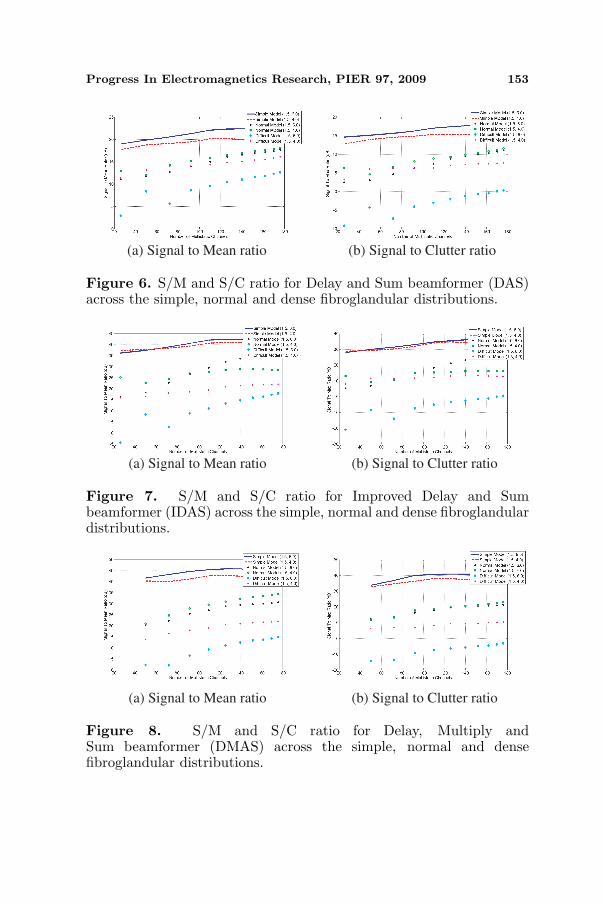
(a) Signal to Mean ratio (b) Signal to Clutter ratio
Figure 6. S/M and S/C ratio for Delay and Sum beamformer (DAS)across the simple, normal and dense fibroglandular distributions.
(a) Signal to Mean ratio (b) Signal to Clutter ratio
Figure 7. S/M and S/C ratio for Improved Delay and Sumbeamformer (IDAS) across the simple, normal and dense fibroglandulardistributions.
(a) Signal to Mean ratio (b) Signal to Clutter ratio
Figure 8. S/M and S/C ratio for Delay, Multiply andSum beamformer (DMAS) across the simple, normal and densefibroglandular distributions.
154 O’Halloran, Glavin, and Jones
The DAS, DMAS and IDAS beamformers were each applied to thebackscattered signals. The S/C and S/M ratios, plotted as a function ofthe number of multistatic channels used, for the simple Delay and Sum,Improved Delay and Sum, and Delay Multiply and Sum beamformersare shown in Figures 6, 7 and 8 respectively. In the simple distribution,the S/C and S/M generally increase with the number of multistaticchannels used. This can be attributed to the accuracy between theassumed and actual propagation channel, allowing for the constructiveaddition of the multistatic signals.
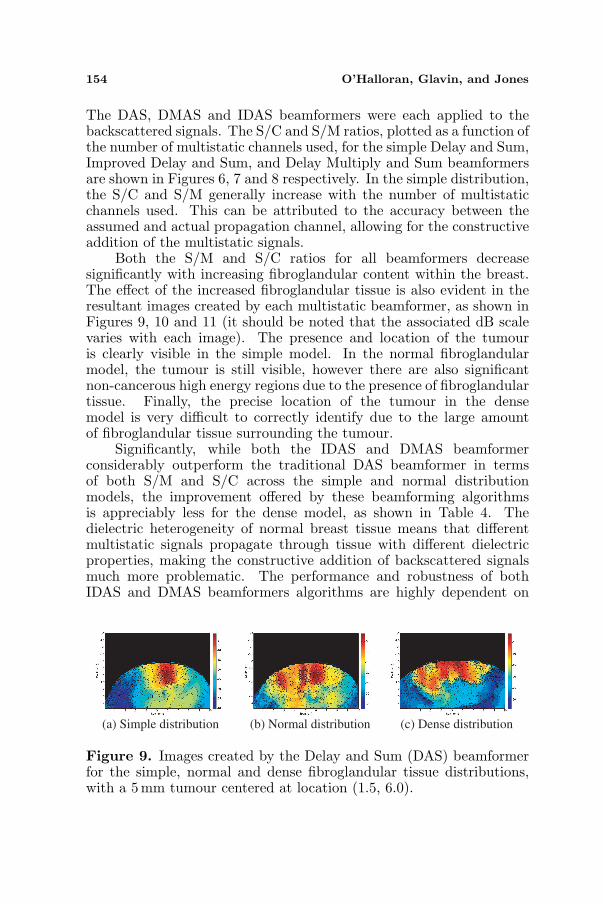
Both the S/M and S/C ratios for all beamformers decreasesignificantly with increasing fibroglandular content within the breast.The effect of the increased fibroglandular tissue is also evident in theresultant images created by each multistatic beamformer, as shown inFigures 9, 10 and 11 (it should be noted that the associated dB scalevaries with each image). The presence and location of the tumouris clearly visible in the simple model. In the normal fibroglandularmodel, the tumour is still visible, however there are also significantnon-cancerous high energy regions due to the presence of fibroglandulartissue. Finally, the precise location of the tumour in the densemodel is very difficult to correctly identify due to the large amountof fibroglandular tissue surrounding the tumour.
Significantly, while both the IDAS and DMAS beamformerconsiderably outperform the traditional DAS beamformer in termsof both S/M and S/C across the simple and normal distributionmodels, the improvement offered by these beamforming algorithmsis appreciably less for the dense model, as shown in Table 4. Thedielectric heterogeneity of normal breast tissue means that differentmultistatic signals propagate through tissue with different dielectricproperties, making the constructive addition of backscattered signalsmuch more problematic. The performance and robustness of bothIDAS and DMAS beamformers algorithms are highly dependent on
(a) Simple distribution (b) Normal distribution (c) Dense distribution
Figure 9. Images created by the Delay and Sum (DAS) beamformerfor the simple, normal and dense fibroglandular tissue distributions,with a 5mm tumour centered at location (1.5, 6.0).

Progress In Electromagnetics Research, PIER 97, 2009 155
(a) Simple distribution (b) Normal distribution (c) Dense distribution
Figure 10. Images created by the Improved Delay and Sum (IDAS)beamformer for the simple, normal and dense fibroglandular tissuedistributions, with a 5 mm tumour centered at location (1.5, 6.0).
(a) Simple distribution (b) Normal distribution (c) Dense distribution
Figure 11. Images created by the Delay, Multiply and Sum (DMAS)beamformer for the simple, normal and dense fibroglandular tissuedistributions, with a 5 mm tumour centered at location (1.5, 6.0).
Table 4. Average S/M and S/C ratios (in dBs) for each beamformeracross the Simple (S), Normal (N) and Dense (D) fibroglandulardistribution.
Beamformer
DAS
IDAS
DMAS
S/M (S) S/M (N) S/M (D) S/C (S) S/C (N) S/C (D)
16.7298
33.6673
38.4475
10.9146
21.2130
21.6646
3.7909
6.4597
3.2395
20.6917
40.0991
43.0505
17.6149
32.0474
32.1205
14.0347
19.5986
18.1061
the coherence of the backscattered signals from the tumour aftertime-alignment, and therefore their effectiveness is markedly reducedwhere there is a significant difference between the assumed homogenouschannel model and the actual heterogeneous breast.
6. CONCLUSION
UWB beamformers for the early detection of breast cancer werebased on several assumptions, including the assumption that breastis primarily dielectrically homogeneous and that the dielectric

156 O’Halloran, Glavin, and Jones
properties of normal tissue is such that constructive addition of UWBbackscattered signals is possible. Based on Lazebnik’s dielectric data,it appears that the dielectric contrast between normal and cancerousbreast tissue had previously been over-estimated, while the dielectricheterogeneity of normal breast tissue had been considerably under-estimated. Both the IDAS and DMAS significantly outperform theDAS beamformer where the breast is mainly composed of adiposetissue and is primarily dielectrically homogeneous. However, inthe more dense model, where fibroglandular tissue contributes toa significant mismatch between the assumed and actual channelpropagation models, the improved performance promised by bothIDAS and DMAS is significantly reduced. Furthermore, in the densemodel the presence and location of the tumour is much more difficultto establish in the images created all beamformers. This promptsthe development of more sophisticated beamformers to compensatefor the more challenging imaging environment of the dielectricallyheterogeneous breast.
ACKNOWLEDGMENT
This work is supported by Science Foundation Ireland under grantnumber 07/RFP/ENEF420.
REFERENCES
1. Nass, S. L., I. C. Henderson, and J. C. Lashof, Mammographyand Beyond: Developing Technologies for the Early Detection ofBreast Cancer, National Academy Press, 2001.
2. Lazebnik, M., L. McCartney, D. Popovic, C. B. Watkins,M. J. Lindstrom, J. Harter, S. Sewall, A. Magliocco, J. H. Booske,M. Okoniewski, and S. C. Hagness, “A large-scale study of theultrawideband microwave dielectric properties of normal breasttissue obtained from reduction surgeries,” Phys. Med. Biol.,Vol. 52, 2637–2656, 2007.
3. Lazebnik, M., D. Popovic, L. McCartney, C. B. Watkins,M. J. Lindstrom, J. Harter, S. Sewall, T. Ogilvie, A. Magliocco,T. M. Breslin, W. Temple, D. Mew, J. H. Booske, M. Okoniewski,and S. C. Hagness, “A large-scale study of the ultrawidebandmicrowave dielectric properties of normal, benign and malignantbreast tissues obtained from cancer surgeries,” Phys. Med. Biol.,Vol. 52, 6093–6115, 2007.
4. Chaudhary, S. S., R. K. Mishra, A. Swarup, and J. M. Thomas,

Progress In Electromagnetics Research, PIER 97, 2009 157
“Dielectric properties of normal and malignant human breasttissue at radiowave and microwave frequencies,” Indian J.Biochem. Biophys., Vol. 21, 76–79, 1994.
5. Surowiec, A. J., S. S. Stuchly, J. R. Barr, and A. Swarup,“Dielectric properties of breast carcinoma and the surroundingtissues,” IEEE Trans. Biomed. Eng., Vol. 35, No. 4, 257–263, 1988.
6. Joines, W., Y. Zhang, C. Li, and R. L. Jirtle, “The measuredelectrical properties of normal and malignant human tissues from50 to 900 MHz,” Med. Phys., Vol. 21, 547–550, 1993.
7. Campbell, A. M. and D. V. Land, “Dielectric properties of femalehuman breast tissue measured in vitro at 3.2 GHz,” Phys. Med.Biol., Vol. 37, 193–210, 1992.
8. Meaney, P. M., M. W. Fanning, D. Li, S. P. Poplack, andK. D. Paulsen, “A clinical prototype for active microwave imagingof the breast,” IEEE Trans. Microwave Theory Tech., Vol. 48,1841–1853, 2000.
9. Hagness, S. C., A. Taove, and J. E. Bridges, “Two-dimensionalFDTD analysis of a pulsed microwave confocal system for breastcancer detection: Fixed focus and antenna array sensors,” IEEETrans. Biomed. Eng., Vol. 45, 1470–1479, 1998.
10. Fear, E. C. and M. A. Stuchly, “Three-dimensional FDTD analysisof a pulsed microwave confocal system for breast cancer detection:Design of an antenna array element,” IEEE Trans. Antennas andPropagat., Vol. 47, 783–791, May 1999.
11. Nilavalan, R., S. C. Hagness, and B. D. V. Veen, “Numericalinvestigation of breast tumour detection using multi-static radar,”IEE Electronic Letters, Vol. 39, No. 25, 1787–1789, Dec. 2003.
12. Lim, H., N. Nhung, E. Li, and N. Thang, “Confocal microwaveimaging for breast cancer detection: Delay-multiply-and-sumimage reconstruction algorithm,” IEEE Trans. Biomed. Eng.,Vol. 55, No. 6, Jun. 2008.
13. Klemm, M., I. J. Craddock, J. A. Leendertz, A. Preece, andR. Benjamin, “Improved delay-and-sum beamforming algorithmfor breast cancer detection,” International Journal of Antennasand Propagation, Vol. 2008, 2008.
14. Liand, X. and S. C. Hagness, “A confocal microwave imagingalgorithm for breast cancer detection,” IEEE Microwave andWireless Components Letters, Vol. 11, 130–132, 2001.
15. Lazebnik, M., M. Okoniewski, J. Booske, and S. Hagness, “Highlyaccurate debye models for normal and malignant breast tissuedielectric properties at microwave frequencies,” IEEE Microwave

158 O’Halloran, Glavin, and Jones
and Wireless Components Letters, Vol. 17, No. 12, 822–824,Dec. 2007.
16. Gabriel, C., S. Gabriel, and E. Corthout, “The dielectricproperties of biological tissues: I. Literature survey,” Phys. Med.Biol., Vol. 41, 2231–2249, 1996.
17. Gabriel, S., R. W. Lau, and C. Gabriel, “The dielectric propertiesof biological tissues: II. Measurements in the frequency range10Hz to 20 GHz,” Phys. Med. Biol., Vol. 41, 2251–2269, 1996.
18. Bond, E. J., X. Li, S. C. Hagness, and B. D. V. Veen, “Microwaveimaging via space-time beamforming for early detection of breastcancer,” IEEE Trans. Antennas and Propagat., 1690–1705, 2003.
19. Fear, E. C. and M. Okoniewski, “Confocal microwave imagingfor breast tumor detection: Application to a hemispherical breastmodel,” 2002 IEEE MTT-S International Microwave SymposiumDigest, Vol. 3, 1759–1763, 2002.
20. Fear, E. C., X. Li, S. C. Hagness, and M. A. Stuchly, “Confocalmicrowave imaging for breast cancer detection: Localization oftumors in three dimensions,” IEEE Trans. Biomed. Eng., Vol. 47,812–812, 2002.