effects of both above and below ground biomass on soil
TRANSCRIPT

ABSTRACT
WEST, ERIC WAYNE. Effects Of Both Above And Below Ground Biomass On Soil Chemical, Physical And Biological Properties On A Coastal Plain Soil In North Carolina. (Under the direction of Ronnie Heiniger.)
The literature has shown the possibility to enhance many of the soil properties that
improve production with additions of plant biomass to the soil in conjunction with long-
term conservation tillage. Since it has been proven that reduced tillage is extremely
beneficial to a soil’s health, the key question is if the incorporation of deep rooted cover
crops and/or large quantities of above ground biomass over a two-year period would
result in extensive improvements on a soil’s natural properties throughout the effective
rooting depth, or is this too short of a time period for any beneficial effects to occur to the
chemical, physical and biological properties of the soil? While SOC additions to the soil
surface through decaying biomass can make measurable improvements to a soil in the
humid, tropical southeastern U. S., the dynamics of total carbon (total SOC), total
nitrogen (TKN), particulate organic matter (POM), potentially mineralizable nitrogen
(PMN), CEC and bulk density (Db) in the 0-5, 5-10, and 10-18 cm depths in a production
system that incorporates deep rooted cover crops and/or additions of organic matter from
cover crops at rates >6 Mg/ha/yr (3 T/ac) are unknown. The objectives of this research
were to determine what effect rye (Scale cereale), barley (Hordeum vulgare), alfalfa
(Medicago sativa), wheat (Triticum aestivum), triticale (Triticale hexaploide Lart.),
annual white sweetclover (Melilotus officinalis), blue lupine (Lupinus angustifolius),
rye/hairy vetch (Scale cereale/Vicia villiosa) and alfalfa/rye (Medicago sativa/Scale
cereale) would have on the following parameters: total SOC, POM, TKN, PMN, CEC,

and Db after two (2) years of seeding. Significant spatial/temporal interactions and main
effects were found in Db, PMN, POM and CEC while significant main effects were found
in total C and total N. Significant treatment interactions were found in Db, total C, PMN,
POM and CEC. Relative to treatment biomass, significant effects were seen between
treatments and treatment*year interaction. Results on Db found spatial variability with
depth but not with season and a minimal treatment effect depending on surface texture.
Total C and total N decreased with depth but were independent spatially and temporally;
however, treatment effect on total C was <5 months. Between Db and total C, the two
parameters were inversely correlated. PMN either fluctuated between sampling times or
declined with time. Notably, rye and rye/hairy vetch effected PMN in the 0-5 cm depth
where other treatments showed no effect. POM declined with time regardless of depth
implying a priming effect was occurring; however, rye/hairy vetch appeared to show an
early reversal trend. As for CEC, there was no consistent trend. Additionally, CEC
exhibited a moderate correlation to POM but not total C. Biomass measurements
indicated no treatment consistently exceeded >6 Mg/ha/yr. Rye and rye/hairy vetch more
often produced the most biomass and lupine achieved the overall maximum yield.
Relationships between biomass and N parameters found a moderate, positive effect from
the biomass inputs that appeared to compound with time. Overall, rye and rye/hairy vetch
were the best cover crop treatments but two years of biomass inputs were not enough to
prevent declines in POM. Conversely, PMN fluxed from applied N, and biomass with
low C:N ratios oxidized quickly resulting in less carbon. Total C, total N and Db were not
responsive to short term management indicating more effort is needed to define and/or
develop a cover crop that will consistently reach the >6 Mg/ha/yr.

Effects Of Both Above And Below Ground Biomass On Soil Chemical, Physical And Biological Properties
On A Coastal Plain Soil In North Carolina
by Eric Wayne West
A dissertation submitted to the Graduate Faculty of North Carolina State University
in partial fulfillment of the requirements for the Degree of
Doctor of Philosophy
Crop Science
Raleigh, North Carolina
2010
APPROVED BY:
_________________________ _________________________ Nancy Creamer Carl Crozier
__________________________ _________________________ Christopher Reberg-Horton Ronnie Heiniger
Chair of Advisory Committee

ii
BIOGRAPHY
Eric Wayne West was born June 27, 1969 in Portsmouth, Virginia. He attended Isle of
Wright Academy in Isle of Wright, Virginia, through the fifth grade and completed his
secondary education at Northeast Academy in Lasker, North Carolina in 1987. Upon
graduation from Northeast Academy, Eric attended North Carolina State University
beginning in Fall 1987. From Fall 1987 through Fall 1991, Eric majored in Animal Science
where a Bachelor of Science degree was received. Beginning in Spring 1992, Eric enrolled in
the Soil Science Department at North Carolina State University to focus on a Master of
Science degree specializing in on-site wastewater disposal systems. The M.S. degree was
conferred to Eric in Fall 1994. Upon the completion of the M.S. degree, Eric began his
professional career in the agriculture industry. This career in the agriculture industry first
focused on crop and animal production. The career has now transitioned to the conservation
side of agriculture where Eric is currently employed by USDA Natural Resources
Conservation Service (NRCS). In conjunction with Eric’s employment he was admitted to
the Soil Science Department at North Carolina State University to work toward a Doctor of
Philosophy degree in Spring 2004. In the Fall 2007, Eric transferred to the Crop Science
Department to complete his Doctor of Philosophy degree while maintaining his employment
with NRCS. Eric is married and has three children.

iii
ACKNOWLEDGEMENTS
I would first like to thank my wife, Denise, for her support and encouragement in the
pursuit of this goal. Without her assistance, the completion of this effort would not have been
attainable. Along with Denise, the support of Tyler, Mackenzie and Lucas, my three children,
has been a blessing. Further, the encouragement through the process received from both my
parents, Wayne and Eddie Lou West, and my wife’s parents, Gene and Dianne Robinson,
helped to keep the goal in mind.
Next I must thank, Daniel Kornegay, Brad Warren and JC Warren the participating
producers who allowed me to utilize their property to conduct my research. Their
contribution was essential.
I would also like to thank Dr. Ronnie Heiniger, my advisory committee chairman, for
agreeing to work with me on this project while I maintained employment with USDA. This
understanding was essential to completing this effort. Also, Dr. Heiniger’s assistance in
acquiring funds for the laboratory assays, establishing the field plots each year of the study
and providing guidance when requested was most appreciated making this pursuit possible.
Thank you is also necessary for the role provided by Cotton Incorporated, Cary, NC,
and the Corn Growers Association of North Carolina, Raleigh, NC. Their financial assistance
toward this project was a tremendous benefit.

iv
Lastly but certainly not least in alphabetical order, I would like to thank the following
people and/or staffs for their assistance provided along the way: Dr. Aziz Amoozegar, Bobby
Brock, Dr. Nancy Creamer, Dr. Carl Crozier, Duplin County Cooperative Extension Service
facilities, Duplin County SWCD staff, Ed Emory, Curtis Fountain, Bill Harrell, Dr. Chris
Reberg-Horton, Lee Mallard, Renee Melvin, Dr. George Naderman, NCDA&CS
Horticultural Crop Research Station staff and facilities, Chris Niewoehner, Dr. Jason
Osborne, James Parsons, David Robertson, Tim Smith, Bill Thomas, Dr. Michael Wagger,
and Melinda White.
The use of commercial products in this study does not imply endorsement by NCSU
Crop Science Department of the products used or criticism of similar one(s) not used in this
study.

v
TABLE OF CONTENTS
LIST OF TABLES ................................................................................................................ vii LISTS OF FIGURES............................................................................................................. ix
UNIT 1: BIOMASS TREATMENT EFFECTS AND/OR SPATIAL/TEMPORAL EFFECTS ON Db, TOTAL C, TOTAL N, POM, PMN, AND CEC.................................. 1
Introduction ........................................................................................................................................ 1 Materials and Methods....................................................................................................................... 7
Sites Utilized.................................................................................................................................. 7 Site Cropping System Management .............................................................................................. 8 Cover Crop Treatments.................................................................................................................. 9 Sampling Procedures ................................................................................................................... 11 Soil Properties Analyzed ............................................................................................................. 12 Other Measurements .................................................................................................................... 15 Statistical Analysis....................................................................................................................... 15
Results and Discussion..................................................................................................................... 17 Biomass........................................................................................................................................ 17 Bulk Density ................................................................................................................................ 20 Total Carbon ................................................................................................................................ 24 Total Nitrogen.............................................................................................................................. 31 Potentially Mineralizable Nitrogen.............................................................................................. 34 Particulate Organic Matter........................................................................................................... 39 CEC.............................................................................................................................................. 44
Conclusions ...................................................................................................................................... 49 REFERENCES................................................................................................................................. 55
UNIT 2: COVER CROP BIOMASS EFFECTS ON SOIL NITROGEN........................ 59 Introduction ...................................................................................................................................... 59 Materials and Methods..................................................................................................................... 64
Sites Utilized................................................................................................................................ 64 Site Cropping System Management ............................................................................................ 65 Cover Crop Treatments................................................................................................................ 66 Sampling Procedures ................................................................................................................... 68 Soil Properties Analyzed ............................................................................................................. 69 Biomass Measurements ............................................................................................................... 70 Statistical Analysis....................................................................................................................... 71
Results and Discussion..................................................................................................................... 73 Biomass........................................................................................................................................ 73 Cover Crop Biomass on Total Soil Nitrogen............................................................................... 76 Biomass on Potentially Mineralizable Nitrogen.......................................................................... 78
Conclusions ...................................................................................................................................... 79 REFERENCES................................................................................................................................. 80
APPENDICES....................................................................................................................... 82 APPENDIX A .................................................................................................................................. 83

vi
APPENDIX B .................................................................................................................................. 87 APPENDIX C .................................................................................................................................. 89 APPENDIX D .................................................................................................................................. 91 APPENDIX E................................................................................................................................... 96

vii
LIST OF TABLES
UNIT 1: BIOMASS TREATMENT EFFECTS AND/OR SPATIAL/TEMPORAL EFFECTS ON Db, TOTAL C, TOTAL N, POM, PMN, AND CEC.................................. 1
Table 1. Soil texture and particle size per site and depth interval...................................................... 8Table 2. N rate, N application month, and N source per crop and year at the coarse-loamy site. ..... 8Table 3. N rate, N application month, and N source per crop and year at the fine-loamy site. ......... 9Table 4. List of treatments, cultivars, percent germination (germ), percent pure seed (PS), and seeding rate for each treatment. ....................................................................................................... 10Table 5. Mean biomass yield (kg/ha) for each treatment, year, and site.......................................... 17Table 6. Estimated soil bulk density (Db) simple effect................................................................... 20means for treatment*depth interaction for the fine-loamy site. ....................................................... 20Table 7. Estimated simple effect means for depth*sampling time interaction on soil bulk density (Db) for both the coarse-loamy and fine-loamy sites. ...................................................................... 22Table 8. Mean main sampling time effect on soil bulk.................................................................... 23density (Db) at each site.................................................................................................................... 23Table 9. Mean main depth effect on soil bulk.................................................................................. 23density (Db) for each site. ................................................................................................................. 23Table 10. Estimated significant total carbon (C) increase simple pairwise comparisons for treatment*depth*sampling time interaction at the fine-loamy site. ................................................. 26Table 11. Estimated total carbon (C) simple effect means .............................................................. 27for the treatment*depth interaction at the fine-loamy site. .............................................................. 27Table 12. Correlation between biomass and total carbon (C). ......................................................... 28Table 13. Main sampling time effect total carbon (C) means.......................................................... 29at each site. ....................................................................................................................................... 29Table 14. Correlation between total C and soil bulk density (Db) ................................................... 30Table 15. Main depth effect on total C at each site.......................................................................... 30Table 16. Estimated simple effect means for depth*sampling time interaction on total nitrogen (N) at the fine-loamy site. ....................................................................................................................... 31Table 18. Main depth effect total nitrogen (N) ................................................................................ 33means for at each site. ...................................................................................................................... 33Table 20. Correlation between total C and total N........................................................................... 34Table 20. Estimated potentially mineralizable nitrogen (PMN) simple effect means for treatment*depth interaction for both the coarse-loamy and fine-loamy site.................................... 35Table 22. Estimated potentially mineralizable nitrogen (PMN) simple effect means for depth*sampling time interaction for both the coarse-loamy and fine-loamy site. ........................... 37Table 23. Correlation between particulate organic matter ............................................................... 39(POM) and potentially mineralizable nitrogen (PMN). ................................................................... 39Table 24. Estimated particulate organic matter (POM) simple effect means for treatment*sampling time interaction for the coarse-loamy site. ....................................................................................... 40Table 25. Correlation between biomass and particulate organic matter (POM).............................. 41Table 26. Estimated particulate organic matter (POM) simple effect means for depth*sampling time interaction for both the coarse-loamy and fine-loamy site. ..................................................... 42Table 27. Main sampling time effect on POM means for each site. ................................................ 43

viii
Table 28. Estimated CEC simple effect means for treatment*sampling time interaction for fine-loamy site. ........................................................................................................................................ 45Table 29. Estimated CEC simple effect means for depth*sampling time interaction for both the coarse-loamy and fine-loamy sites................................................................................................... 46Table 30. Main depth effect CEC means at each site. ..................................................................... 47Table 31. Main sampling time effect CEC means at each site......................................................... 48Table 32. Correlation between particulate organic matter (POM) and CEC ................................... 48
UNIT 2: COVER CROP BIOMASS EFFECTS ON SOIL NITROGEN........................ 59Table 1. Soil texture and particle size per site and depth interval.................................................... 65Table 2. N rate, N application month, and N source per crop and year at the coarse-loamy site. ... 65Table 3. N rate, N application month, and N source per crop and year at the fine-loamy site. ....... 66Table 4. List of treatments, cultivars, percent germination (germ), percent pure seed (PS), and seeding rate for each treatment. ....................................................................................................... 67Table 5. Mean biomass yield (kg/ha) for each treatment, year, and site.......................................... 73
APPENDICES....................................................................................................................... 82Table 1. ANOVA table presenting the degrees of freedom (df) and significant p-values for the RCBSPD utilized for the soil properties analyzed at the coarse-loamy site. ................................... 96Table 2. ANOVA table presenting the degrees of freedom (df) and significant p-values for the RCBSPD utilized for the soil properties analyzed at the fine-loamy site. ....................................... 97Table 3. ANOVA table presenting the degrees of freedom (df) and significant p-values for the PROC MIXED procedure using the RCB model for biomass yield analysis at both sites. ............. 98Table 4. ANOVA table presenting the degrees of freedom (df) and significant p-values............... 98for the PROC GLM procedure using the RCB model for biomass yield analysis at both sites....... 98

ix
LISTS OF FIGURES
UNIT 1: BIOMASS TREATMENT EFFECTS AND/OR SPATIAL/TEMPORAL EFFECTS ON Db, TOTAL C, TOTAL N, POM, PMN, AND CEC.................................. 1
Figure 1. Treatment*sampling time simple effect means for particulate organic matter (POM) at the coarse-loamy site........................................................................................................................ 40Figure 2. Treatment*sampling time simple effect means for CEC at the fine-loamy site............... 45
UNIT 2: COVER CROP BIOMASS EFFECTS ON SOIL NITROGEN........................ 59Figure 1. Relationship between biomass (kg/ha) and total N (g/kg) for Spring and Fall 2007 sampling times.. ............................................................................................................................... 77Figure 2. Relationship between biomass (kg/ha) and total N (g/kg) for Spring 2008 sampling time........................................................................................................................................................... 77

1
1
UNIT 1: BIOMASS TREATMENT EFFECTS AND/OR SPATIAL/TEMPORAL EFFECTS ON Db, TOTAL C, TOTAL N, POM,
PMN, AND CEC
Introduction
The use of conservation tillage cropping systems in the southeastern United States has
increased 94 percent in the past ten years to include 42.5 percent of all cropland (Regional
Synopsis, 2002). This increase in the use of reduced tillage has been made possible as a result
of farm bill requirements, herbicide resistant crops and an understanding of the benefits of
soil organic carbon (SOC). As shown by the literature, it is possible to enhance many of the
soil properties that improve production with additions of plant dry matter to the soil in
conjunction with long-term conservation tillage (Arshad et. al., 1999; da Silva et. al., 2001;
Franzluebbers and Hans, 1996; Soon and Arshad, 2004; Hunt et. al., 1996; Bruce et. al.,
1995). It has also been established that soil quality (i.e. the capacity of a specific kind of soil
to function, within natural or managed ecosystem boundaries, to sustain plant and animal
productivity, maintain or enhance water and air quality, and support human health and
habitation)(Letey et al., 2003) can be improved with the use of proper soil management
practices (Reeves, 1997; Sandor and Eash, 1991). Additionally, the residue that is returned to
the soil surface is considered to be vitally important for biological diversity, as an energy
source, and in substrates that are necessary for many soil functions (Franzluebbers, 2002a;
Wagger and Denton, 1992; Soon and Arshad, 2004; Franzluebbers et. al., 1994b). Since there
is a correlation between residue inputs, reduced tillage and benefits to soil quality, two
questions that arise are: Will the inclusion of deep rooted cover crops and/or large quantities

2
2
of aboveground dry matter in a cropping system result in extensive improvements to a soil’s
managed and inherent properties throughout the effective rooting depth in 1 to 2 years? Or, is
this too short of a time period for any beneficial effects to occur to the chemical, physical and
biological properties in the soil’s effective rooting depth? This lack of a clear response to
these two questions provides an area of soil and crop management that needs further
exploration.
There are few deep rooting winter annual cover crops where the author defines deep
rooting as exceeding the deeper of the soils B-horizon or 60 cm. However, the literature
describes barley (Hordeum vulgare), alfalfa (Medicago sativa), blue lupine (Lupinus
angustifolius) and annual white sweetclover (Melilotus alba var. annua) as having either
deep rooting potential or aggressive taproot growth. When grown as an annual, barley was
reported to develop a deep fibrous root system that can reach as deep as 6.5 ft in USDA plant
hardiness zone 8 or warmer (Sustainable Agriculture Network, 1998). Alfalfa is known to be
deep-rooted and can act as a biological plow (Snapp et al., 2005). Narrow-leaf blue lupines
are known to be the most cold tolerant lupine species and have aggressive taproots capable of
fixing large quantities of N (Sustainable Agriculture Network, 1998). Annual white
sweetclover is known to loosen subsoil compaction although its taproot is shorter and more
slender than its biennial cousins.
As for species with large aboveground dry matter potential, a cover crop used in the
Southeast that yields large quantities of dry matter is rye (Secale cereale). Rye is considered
to be the hardiest winter cereal crop, can provide up to 11.3 Mg/ha (5 t/ac) of dry matter and

3
3
has a quick growing, fibrous root system (Sustainable Agriculture Network, 1998). Similarly,
barley is reported to yield > 11.3 Mg/ha (5 t/ac) of dry matter. In addition to rye and barley,
wheat (Triticum aestivum), a cover crop used locally, and triticale (Triticale hexaploide
Lart.), a cross between wheat and rye, have the potential to produce aboveground dry matter
at rates between 3 Mg/ha (1.5 t/ac) and 11 Mg/ha (5 t/ac) (Brock, 2005; Sustainable
Agriculture Network, 1998).
Combination cover crop species with the potential to produce large amounts of
biomass are rye/hairy vetch (Vicia villiosa). Reeves (1994) described the combination as the
standard in the Southeast for N content, and Brock (2005) suggested the combination can
produce large amounts of dry matter (i.e. 10 Mg/ha). In 1997, Ranells and Wagger reported
rye/hairy vetch aboveground dry matter accumulations of 3-5 Mg/ha following corn on a
Norfolk soil. Another combination that may have potential is rye/alfalfa although the
documentation in the literature is lacking. The dual benefit of large dry matter accumulations
(i.e. rye) plus a deep rooting potential (i.e. alfalfa) appears to offer the best approach for soil
quality benefits.
Although past research has indicated that soil organic matter (SOM) is the central
indicator of soil quality (Reeves, 1997), the level of SOM is not an absolute measure of a
soil’s level of productivity. As indicated by Naderman (2004), crop production can be limited
in a soil that has a high surface soil organic carbon (SOC) level and a high subsurface bulk
density (Db) that limits root penetration. Kay and VandenBygaart (2002) has also observed
increases in Db and a corresponding decrease of porosity in the plow layer with the

4
4
conversion to no-tillage. Additionally, the interrelationship between the two properties is
poorly documented (Kay and VandenBygaart, 2002).
Total SOC as a measure of past and current dry matter inputs, combined with
particulate organic matter (POM), appear to be the best measures of organic C correlations
with crop productivity. Contrary to total SOC, particulate organic matter consists of partially
decomposed plant and animal residues and is the first step in the decay process between crop
residues and stable humified organic matter (Gregorich and Janzen, 1996). Cambardella and
Elliot (1992) define POM as the stabilized fraction of organic matter composed of root
fragments in various stages of decomposition. This root fragment fraction appears to be a
more important contributor to SOC than the surface dry matter fraction. Wander and Bollero
(1999) suggest POM to be important due to its sensitivity as an indicator of soil quality.
The addition of organic matter to the soil surface in a NT system can also have
measurable effects on the soil’s cation exchange capacity (CEC). Cation exchange capacity
is an easily quantifiable measurement for documenting soil management improvements and
understanding the chemistry of the soil. Hussain et al. (1999) found a significant correlation
between CEC and organic C under a NT system in the top 5 cm of soil, and CEC was better
correlated with organic C than with clay content in the same top 5 cm of soil.
Total Kjeldahl N (TKN) and potentially mineralizable nitrogen (PMN) are two
additional soil measurements that have shown a high correlation to additions of SOM
(Franzluebbers et. al., 1994a). Total Kjeldahl N is important since it can show the cumulative
total N stored in the soil while PMN has been shown to increase with decreasing tillage and
characterizes the active pool of soil N available for crop production. Needleman et al. (1999)

5
5
found the concentration of PMN to be highly stratified with the effect of texture and tillage
on PMN being expressed in the 0 to 5 cm depth.
In cold, dry environments (i.e. temperate climates), the relatively slow rate of
decomposition of newly added crop residues in a no-tillage system has been proven to create
large stocks of SOM and to improve soil quality (Arshad et. al., 1999; Franzluebbers, 2002a).
However, in the humid, subtropical environment of the southeastern United States, the more
rapid rate of decomposition generated by the greater moisture and temperature levels make it
difficult to maintain SOC levels, unless at least 12 Mg/ha/yr (5.3 t/ac/yr) of total dry matter
(i.e. crop residues plus cover crop residues) are returned to the soil surface each year (Bruce
et. al., 1995)). Therefore, a reasonable amount of dry matter must be returned to the soil
surface to decompose and become part of the SOC pool. As indicated by the literature
additions of SOC will increase fertility, water holding capacity, structure and porosity of the
soil when compared to a conventional tillage system (Bruce et. al., 1995; Hendrix et. al.,
1998; Langdale et. al., 1990; Hunt et. al., 1996). Additionally, Franzluebbers (2002a)
indicated that conservation tillage systems in areas with low native SOM (i.e. humid,
subtropical environments) might show the greatest improvement in soil quality compared
with conventional tillage.
While SOC additions to the soil through decaying dry matter on the surface and root
matter subsurface can make measurable improvements to a soil in the humid, subtropical
southeastern U.S., the dynamics of total SOC, POM, TKN, PMN, CEC and Db in the 0-5, 5-
10, and 10-18 cm depths in a production system that uses deep rooted cover crops and/or

6
6
additions of organic matter from mature cover crops (i.e. cover crops allowed to reach soft
dough stage for cereals or early bloom for legumes) at rates >6 Mg/ha/yr (3 t/ac) are
unknown. The dry matter value >6 Mg/ha/yr is derived from the average difference between
12 Mg/ha/yr (Bruce et. al., 1995) and either total aboveground biomass at maximum canopy
from southern upland cotton (4 Mg/ha/yr) or corn for grain (7 Mg/ha/yr) (NRCS, 2008).
The objectives of this research are two fold: 1) determine what biomass effects rye,
barley, alfalfa, wheat, triticale, annual white sweetclover, blue lupine, rye/hairy vetch and
rye/alfalfa have on the following parameters: total SOC, POM, TKN, PMN, CEC, and Db
after two (2) years of seeding in a no-till system, and 2) determine which of the following
parameters: total SOC, POM, TKN, PMN, CEC, and Db are controlled by spatial and
temporal effects in a no-till system after being seeded to rye, barley, alfalfa, wheat, triticale,
annual white sweetclover, blue lupine, rye/hairy vetch and rye/alfalfa cover crops for two (2)
years.

7
7
Materials and Methods
Sites Utilized
Two “well drained” sites in the Coastal Plain region of North Carolina that are in the
family particle size class “coarse-loamy” or “fine-loamy” were selected. Site one, hereafter
referred to as the coarse-loamy, has a soil series name of Butters (coarse-loamy, siliceous,
semiactive, thermic Typic Paleudults; 35o 2’ 0.5” N, 78o 1’ 45.5” W). Site two, hereafter
referred to as the fine-loamy site, has a soil series name of Thursa (fine-loamy, kaolinitic,
thermic Typic Kandiudults; 35o 10’ 19.7” N, 78o 9’ 25.5” W). A USDA-NRCS soil scientist
conducted a soils description using the bucket auger observation method to define the soils at
each site. Pedon descriptions for both the Butters and Thursa soil types are in Appendix A.
Particle size analysis was conducted at depth intervals 0-5, 5-10 and 10-18 cm in
addition to the bucker auger observation method at both sites. Samples were collected from a
location near the center of each site and mailed to Waters Agricultural Laboratories, Inc, in
Camilla, GA. for analysis. Soil textures for the three depths at each site are a loamy sand and
sandy loam for the coarse-loamy and fine-loamy sites, respectively (Table 1). Particle size
analysis from the fine-loamy site shows its percent clay to be 2-3.5 times larger than the
coarse-loamy site while the percent silt contents between the two sites were similar.

8
8
Table 1. Soil texture and particle size per site and depth interval Site Depth Texture % Sand % Clay % Silt
0-5 cm Loamy Sand 84.0 2.4 13.6 5-10 cm Loamy Sand 83.6 4.4 12.0
Coarse-loamy
10-18 cm Loamy Sand 85.6 2.4 12.0 0-5 cm Sandy Loam 77.2 8.4 14.4 5-10 cm Sandy Loam 78.8 8.4 12.8
Fine-loamy
10-18 cm Sandy Loam 80.8 6.4 12.8
Site Cropping System Management
The coarse-loamy site was managed under a no-till system from before 2004 through
2008. In years 2004 through 2007, the cropping system was continuous cotton; while for
2008, the crop was switched to full season soybeans. For each year and crop, the N rate, N
application month and N source are found in Table 2.
Table 2. N rate, N application month, and N source per crop and year at the coarse-loamy site. Crop Year N rate1 N application month N source
Cotton 2004-2007 10-17/74 (9-15/66.5) April and June (NH4)2SO4
Soybeans 2008 N/A N/A N/A 1Planting/Layby N rate in kg/ha (lbs/ac)
The fine-loamy site was also managed under a no-till system from before 2004
through 2008. In 2004, the site was ripped using a DMI no-till ripper with berm tuckers.
Continuous cotton was grown in crop years 2004 through 2007, while in 2008 corn was
grown. Each winter, a rye cover crop was seeded after harvest of the cotton crop at a rate of
~1.7 kg/ha (1.5 bu/ac). The cover crop was allowed to reach a Feekes’ growth stage of ~ 9.0

9
9
before termination. Table 3 contains the N rate, N application month and N source for each
year and crop.
Table 3. N rate, N application month, and N source per crop and year at the fine-loamy site. Crop Year N rate1 N application month N source
Cotton 2004-2007 28/73 (25/65) April and June (NH4)2SO4
Corn 2008 28/140 (25/125) April and June (NH4)2SO4 1Planting/Layby N rate in kg/ha (lbs/ac)
Cover Crop Treatments
Both the coarse-loamy and fine-loamy sites were planted to seven different winter
cover crop cultivar treatments and two combination treatments in a randomized complete
block design with three replications per site during calendar years 2006 and 2007. The
following cultivars were planted individually: rye (Secale cereale), barley (Hordeum
vulgare), alfalfa (Medicago sativa), wheat (Triticum aestivum), triticale (Triticale hexaploide
Lart.), annual white sweetclover (Melilotus alba var. annua), and blue lupine (Lupinus
angustifolius). The combination treatments were rye/hairy vetch (Secale cereale/Vicia
villiosa) and alfalfa/rye (Medicago sativa/Secale cereale). The actual cultivars used for each
treatment are listed in Table 4.
Each cultivar was seeded with a Marliss 1412 no-till grain drill equipped with a small
seed box. Seeding of all cover crop treatments were into the previous crop residue directly
after harvest at the rates contained in Table 4.

10
10
Table 4. List of treatments, cultivars, percent germination (germ), percent pure seed (PS), and seeding rate for each treatment. Treatment
Cultivar
% Germ
% PS
Seeding rate-drilled kg/ha (lbs/ac)
Seeding rate-aerial kg/ha (lbs/ac)4
Medicago sativa Forage Queen 80 99.7 11 (10)1
56.1 (50) Hordeum vulgare Price 72 98 108 (96) N/A Lupinus angustifolius Tifblue 85 98 135 (120) N/A Secale cereale Wheeler 90 99.7 126 (112)1 N/A Melilotus alba var. annua Hubam 72 98 17 (15) 56 (50)
Triticale hexaploide Lart Trical 498 85 99 112 (100) N/A Vicia villiosa2 Hairy vetch 85 99.4 28 (25) 56 (50) Triticum aestivum Pioneer 26R15
(SS 520)3 92 99 135 (120) N/A
1Rate when used in combination treatments rye/alfalfa or rye/hairy vetch was 6 (5) or 84 (75), respectively. 2Treatment only used in combination with rye. 3Cultivar was used only at the fine-loamy site in 2007. 4Aerially seed was only done in 2007.
Seeding depths for the small seeded cover crops were in the range of 0.3-0.6 cm
(0.125-0.25 in) and for the large seeded cover crops in the range of 1.3-1.9 cm (0.5-0.75 in).
For the legume cover crop species, an appropriate inoculant was applied to the seed at the
rate recommended by the directions on the bag of inoculant. To ensure seed to inoculant
contact, the seed and the inoculant were thoroughly hand mixed in a bucket before seeding.
Seeding dates for all treatments in calendar year 2006 were 14 November and 7
December for the coarse-loamy and fine-loamy sites, respectively. In calendar year 2007, the
small seeded cover crop treatments (e.g. alfalfa, sweet clover, and hairy vetch) were aerially
seeded with a hand seeder on 3 October 2007 at both sites. The aerial seeding was followed
with the no-till drilling of all treatments on 29 October and 13 November at the fine-loamy
site and coarse-loamy site, respectively. This no-till drill seeding in October and November
11
11
2007 was into both the existing residue and emergent aerially small seeded cover crops from
the 3 October seeding.
In February of 2007 and 2008, each of the plots containing a cereal grain were top
dressed with an inorganic nitrogen source at a rate of ~38 kg N/ha (34 lbs N/ac). A 34% urea
with limestone pellets was used. The urea was applied using a hand broadcast spreader. Two
passes were made for each plot to ensure proper application rates and uniform coverage. Top
dress application dates for both sites were 19 February 2007 and 28 January 2008.
Sampling Procedures
Prior to seeding the 2006 fall cover crop, a pre-cover crop set of soil cores was
collected from row middles on all 27 plots at both sites as a reference point for changes in the
selected assays. Following the collection of the reference set of soil cores, four additional sets
of soil cores were taken over a two-year period. Each year, two sets of cores were collected
from all 27 plots at both sites during the spring prior to planting of the cash crop and at
planting of the cover crop in the fall. Soil cores were collected from depth intervals of 0-5, 5-
10, 10-18 cm (0-2, 2-4, 4-7 in) within all plots at all sites.
Sampling from row middles that were part of the field’s normal traffic pattern was
avoided. Field equipment widths and noticeable patterns were noted to define the trafficked
middles and to determine the initial row middle for sampling. Once the initial row middle had
been determined, subsequent sampling sites within each plot progressed down the same row
middle for each plot.

12
12
For each plot and collection depth, three cores were collected. An undisturbed 7.6 cm
(3 in) diameter soil core from a Uhland sampler (Blake, 1965) and two 9 cm (3.5 in) diameter
soil cores were taken from each depth. All soil cores were carefully extracted using a small
masonry trowel and/or shovel depending on depth. The undisturbed soil core was placed into
a sampling tin while the other two soil cores were extracted, independently placed into a small
plastic bucket, hand mixed, and placed into a cardboard soil sampling box or a 1 L (1 qt)
Ziploc freezer bag, respectively. All samples were taken within a two-week period for a given
site.
The soil cores that were placed into the 1 L (1qt) Ziploc freezer bags were further
subdivided for future analysis. Approximately one 78 ml sub-sample was pulled from each
bag and placed into an individual sampling tin while the remainder of each sample was stored
in a cooler at 5°C until prepared for further analysis.
Soil Properties Analyzed
Bulk density was determined on all undisturbed soil cores by oven drying the samples
plus sampling tin at 105°C for a minimum of 24 hrs. The oven dry samples plus sampling tin
were then weighted and recorded. A random set of sampling tins were previously weighed
while empty and averaged together to quantify the sampling tin mass. The difference
between the oven dry sample plus tin and the averaged sampling tin mass was used to
determine the mass of oven dry soil. This mass of oven dry soil was then divided by the
known volume for each soil core at each respective depth for the final Db value. During each

13
13
sampling interval, random sets of samples were dried for an additional 24 hrs under the same
procedures as a quality control check.
Total SOC and total N were determined by the dry combustion method as described
by Nelson and Sommers (1982) through the use of a Perkin-Elmer 2400 CHN Elemental
Analyzer. This instrument measures C and N using the principles employed in the traditional
Pregl and Dumas procedures. The 78 ml sub-samples pulled from the 1 L (1 qt) Ziploc bags
were used for this analysis. The samples were first oven dried at 105°C for 24 hr. Once dry,
the samples were hand ground using a mortise and pestle, and sieved with a 100-mesh U.S.
Standard Series Sieve. The soil material that passed the 100-mesh sieve was returned to the
sampling tin, capped and delivered to the North Carolina State University Analytical
Services Lab where the dry combustion method was conducted.
Waters Agricultural Laboratories, Inc, in Camilla, GA conducted PMN and POM
analysis on the remaining soil in each of the 1 L (1 qt) Ziploc freezer bags. The PMN
analysis followed a method described by Waring and Bremner (1964) and Keeney (1982)
using anaerobic incubation as adapted by Waters Agricultural Laboratories, Inc, in “Soil
Ammonium Nitrogen KCl Extraction/Exchangeable Ammonium” (Appendix B). A field-
moist sample (6 g) was placed in a 50 mL centrifuge tube, saturated with 10 mL of deionized
water, and incubated at 40°C for 7 d. Then, 25 mL of 2.0 N KCl extraction reagent was
added using a repipette dispenser. A method blank was included at this point. The extraction
vessel(s) were placed on a reciprocating mechanical shaker for 30 min. The extract was then
filtered. If the filtrate was cloudy the extract was re-filtered. The NH4+-N content of the

14
14
extract as well as the method blank and an unknown sample was determined using a FIALab-
2500 flow injection analyzer using the salicylate method for ammonia assay (Appendix C).
The same procedure was also conducted on non-incubated samples. PMN was determined as
the difference between the ammonium recovered between the incubated and non-incubated
samples.
The POM assay isolated POM from 20 g samples of air-dried soils by dispersion in
20 mL of 5% Na-hexametaphosphate. Liberated POM was collected on and dried in 53 µm
opening polycarbonate mesh (Wander and Bollero 1999) to define the percent of POM
material plus fine mineral matter. The dried POM plus fines (mineral soil particles) mass was
then ignited at 360˚C for 2 hrs to determine the loss on ignition percentage. The POM
quantity was calculated from the mass of soil per depth unit times the percent of POM
material plus fine mineral matter less percent solids remaining after ignition
[%POM=(%POM+fines)-%fines after ignition].
CEC was determined using a summation of Ca, Mg, K and exchangeable acidity (Ac)
as described by the NCDA&CS Soil Test laboratory (Hardy, 2008). The Ca, Mg and K were
extracted using a Mehlich 3 extractant (NCDA&CS). The Ac was determined by a Mehlich-
buffer method at pH 6.6 resulting in the Ac component being determined at a pH between the
soil and the buffer pH (NCDA&CS). This CEC methodology incorporates the measurement
of non-exchangeable acidity related to pH dependent charges.

15
15
Other Measurements
Above ground biomass was sampled during the spring of 2007 and 2008 before the
cover crop was terminated and prior to planting the cash crop. The actual collections dates
were 4 May for both sites in 2007 and in 2008, 15 April and 5 May for the fine-loamy and
coarse-loamy sites, respectively. Two 1-ft2 sections of biomass were randomly collected
from within all 27 plots at each site and placed individually into either a large paper lunch
bag or grocery bag depending on the volume of the undried sample. Each sample plus bag
were oven dried at 112°F until the mass stabilized for a 24 hours period (usually 2 to 5 days).
The dried samples plus bag were immediately weighted upon removing from the oven. A
comparable empty bag weight was obtained and the difference between the dried sample plus
bag mass and the bag mass was taken as the dry matter mass for each random subsection.
Dry matter mass was multiplied by 43,560 to get lbs/ac (Peet, 2001) then converted to kg/ha
using a multiplication factor of 1.12.
Statistical Analysis
After collection and analysis, statistical analysis was conducted on the selected soil
properties using a randomized complete block split plot design model (RCBSPD):
Yijkx = µijx + Rx + (SR)ikx + Eijkx
where i denotes level of treatment, j denotes levels of sampling time, k denotes levels of
depth, x denotes block, Rx ~ N(0, σr2) and (SR)ikx ~ N(0, σsr
2). Factors depth and sampling
time were considered repeated measures while block and block*treatment interaction were
treated as random variables. Also, all random errors are mutually independent. The preceding

16
16
model was tested through the PROC GLIMMIX procedure in SAS (SAS, 2003) using the
Satherthwaite adjustment for calculating the denominator degrees of freedom. Appendix E
contains the respective ANOVA tables for each site.
Statistical analysis was conducted on the biomass samples using a randomized
complete block model (RCB):
Yik = µ + αi + Ek(i)
where i denotes level of treatment and Ek(i) ~ N(0, σ2). The PROC GLM procedure in SAS
(SAS, 2003) was used for the RCB model and for pairwise comparisons within a given year.
The RCB model to determine significance between years was tested using the PROC
MIXED procedure in SAS (SAS, 2003) with the Satherthwaite adjustment for calculating the
denominator degrees of freedom. Factors block and block*treatment interaction were treated
as random variables. Appendix E contains the respective ANOVA tables for each site.
Pearson’s correlation coefficients (rxy) were determined on selected assay results
using PROC CORR while regression was determined using PROC REG procedures in SAS
(SAS, 2003). Correlation coefficients were interpreted using the following general scale:
+0.25=weak, +0.5=moderate, +0.75=strong.

17
17
Results and Discussion
Biomass Differences in treatment biomass yield within a site year were highly significant
(Table 5). At the coarse-loamy site the lupine treatment achieved the greatest biomass yield
for both years. In year 2007, lupine was not significantly different than rye or rye/hairy vetch
while in year 2008 lupine was significantly different from all treatments. The rye/hairy vetch
treatment had the next highest biomass yield in 2008, however, it was similar to four other
treatments.
Table 5. Mean biomass yield (kg/ha) for each treatment, year, and site. Coarse-loamy Fine-loamy
Treatment 20071 20081 20071 20081 Alfalfa 377(+407)x d 1364(+548) d 736(+454) abc 1328(+732) b Barley 1521(+413) cd 5616(+1682) bc 736(+185) abc 1489(+315) b Lupine 5613(+2841) a 18481(+4310) a † † Rye 4764(+2138) ab 7841(+3341) bc 1400(+527) a 4324(+1192) a Rye/Alfalfa 2243(+1144) cd 6746(+1289) bc 1220(+383) a 4163(+1210) a Rye/Hairy Vetch 3409(+879) abc 8720(+2075) b 1364(+600) a 4378(+855) a Sweetclover 1041(+876) cd 1130(+619) d 431(+544) bc 700(+418) b Triticale 1920(+640) cd 7410(+2298) bc 1130(+435) ab 4199(+1254) a Wheat 1597(+284) cd 4324(+493) cd 754(152) abc 1023(495) b
1 Means with the same letter per year and site are not significantly different at P<0.05 using the Tukey pairwise comparison method. X Value in the parenthesis is the standard deviation of the mean. † Plots were lost due to wildlife degradation.
At the fine-loamy site, the treatment biomass yields were considerably less than those
of the coarse-loamy site. This difference was due to excessive grazing pressure from a large
whitetail deer (Odocoileus virginianus) population and sampling date, especially in 2008.
Notably, the succulence of lupine made it a prime target of the whitetail deer population so

18
18
much so that all plots for both years were destroyed. As for sampling date in 2008, the
collection of the biomass corresponded with the termination of the cover crops by the
participating producer. This cover termination timing represents a typical field management
plan necessary for seeding of the cash crop; unfortunately, this termination limited the
biomass yield potential for each treatment at the fine-loamy site. Of the remaining treatments
at the fine-loamy site, the rye or rye combinations produced the greatest biomass yields
regardless of the year. The rye or rye combinations were significantly different than
sweetclover in 2007 and wheat, sweetclover, barley, and alfalfa in 2008. In year 2008, the
triticale treatment was also significantly different than wheat, sweetclover, barley, and alfalfa
treatments but in 2007 triticale was not dissimilar to any other treatment.
Overall, the maximum mean biomass yield (i.e. 2008 mean at the coarse-loamy site)
for rye exceeded winter cover crop biomass reported by Brock (2005) (1350-7763 kg/ha)
regardless of planting date; treatments barley, rye/hairy vetch, triticale and wheat were all
less but within a highly variable range, 5382-7031 kg/ha, 2655-9900 kg/ha, 2813-9056 kg/ha,
and 200-6368 kg/ha, respectively. Minimum biomass yields for the same five treatments
exceeded the minimums reported by Brock (2005) for rye and wheat but not for barley,
rye/hairy vetch or triticale. The rye biomass yields measured had a broader range than
reported by Sainju et al. (2007), Ranells and Wagger (1996), or Bauer and Reeves (1999) for
two planting dates; while the rye combination produced a similar maximum but a lower
minimum than the rye blend reported by Sainju et al. (2007). Additionally, wheat biomass
yields overall exceeded the low and the maximum means reported by Bauer and Reeves
(1999).

19
19
Analysis of biomass yield treatment*year interaction for each site was highly
significant (Appendix E). This significance is indicative of the importance of seeding date
and yearly variability to the quantity of biomass produced. For the fine-loamy site, the
average increase in the biomass produced by seeding in October as opposed to December
yielded a 250% mean increase in the biomass volume produced from 2007 to 2008 within a
range of 140 to 370%. At the coarse-loamy site, a 280% mean increase was recorded from
2007 to 2008 with similar planting dates. The range of increase at the coarse-loamy site was
110% to 390%. This increase was a function of the unpredictable yearly variation between
growing seasons. A similar effect was reported by Ranells and Wagger (1996).
Despite the variability between years and sites, the treatment that more often yielded
the most biomass was rye followed closely by rye/hairy vetch although they were not always
significantly different from other treatments. While the biomass in these two treatments did
not consistently exceed the goal of >6 Mg/ha, the yields were within the expected biomass
yield range for rye as presented by the Sustainable Agriculture Network (1998). Treatments
that expressed potential but need more research are lupine. The biomass produced by lupine
was 220% greater than the next highest treatment. This combined with the low mean being in
the range of rye make lupine a desirable cover crop treatment for future research. Lastly, the
interaction within the rye/alfalfa combination appears to be antagonistic. Although
significance was only noted in 2007 at the coarse-loamy site, the rye/alfalfa combination
consistently underperformed the rye or rye/hairy vetch treatments. This apparent decrease in
biomass yield from the combination may be the result of attenuation of nutrients quicker by

20
20
alfalfa than by rye. This observation is based on the alfalfa roots system occupying a much
larger soil volume than rye (Appendix D).
Bulk Density
Treatment fixed effect of significance on Db was the treatment*depth interaction at
the fine-loamy site (Appendix E). All other treatment effects (e.g. treatment*depth*season,
treatment*season, and treatment) were not significant at either site. Simple pairwise
comparison of Db for the fine-loamy site shows only one significant variation between
treatments in the 0-5 cm depth and no variability between treatments in either 5-10 or 10-18
cm depths (Table 6). The lowest Db value in the 0-5 cm depth was achieved by rye/alfalfa at
1.512 Mg/m3; however, it was only significantly different from sweetclover. Notably, the
Table 6. Estimated soil bulk density (Db) simple effect means for treatment*depth interaction for the fine-loamy site.
0-5 cm 5-10 cm 10-18 cm -----------------Mg m-3---------------- Alfalfa 1.589 ab 1.655 a 1.694 a Barley 1.573 ab 1.628 a 1.691 a Lupine 1.552 ab 1.618 a 1.688 a Rye 1.547 ab 1.644 a 1.692 a Rye/Alfalfa 1.512 b 1.610 a 1.684 a Rye/Hairy Vetch 1.580 ab 1.644 a 1.704 a Sweetclover 1.605 a 1.639 a 1.697 a Triticale 1.546 ab 1.634 a 1.681 a Wheat 1.512 b 1.619 a 1.677 a
1Means with the same letter per depth are not significantly different at P<0.05 using the Tukey pair wise comparison method. wheat treatment effect in the 0-5 cm depth was very similar to the rye/alfalfa treatment in the
same depth. The significance of this comparison was not reflected from the levels of biomass
21
21
reported for each treatment, implying the relevance of the comparison is spatial and not
treatment derived.
Variability of Db between cover crop treatments in the 0-5 cm depth was similar to
that found by Sainju et al. (2007) on a fine-loamy soil in Georgia. In this study the rye/alfalfa
treatment had the lowest Db while Sainju et al. (2007) found the lowest Db with a legume
cover crop blend.
The fixed effect depth*sampling time interaction on Db was significant for both the
coarse-loamy and fine-loamy sites. The depth*sampling time interaction is further supported
by the highly significant fixed main effects of depth and sampling time for Db at both sites
(Appendix E). These significant interaction and main effects support Db in the two soil
texture family groups both being strongly temporally and spatially dependent. Cassel (1983)
found a similar highly significant temporal and spatial interaction and main effect on a
geographically similar fine-loamy soil in North Carolina. Conversely, Sainju et al. (2007) did
not find a significant depth or sampling time effect on Db on a fine-loamy soil in Georgia.
The significant effects seen at both sites when compared to Cassel (1983) who did not note a
tillage effect on the spatial and temporal dependence of Db suggests a no-till system would
show equivalent or more spatial dependence. However, as compared to Sainju et al. (2007),
the effects may be related to the sand/clay content. Sainju et at. (2007) reported maximum
sand/clay content of 75/9% compared to an average of 82/5% in this study (Table 1). The 4%
decrease in clay content had a definite effect on the spatial and temporal dependence of Db as
compared to Sainju et al. (2007). The Db differences between each site for each depth clearly
demonstrate this relationship (Table 7).

22
22
Pairwise comparison of Db estimates show the interaction effect at the coarse-loamy
site to be dependent on the 5-10 cm depth while the fine-loamy site expressed its dependence
Table 7. Estimated simple effect means for depth*sampling time interaction on soil bulk density (Db) for both the coarse-loamy and fine-loamy sites.
Coarse-loamy Fine-loamy 0-5 cm 5-10 cm 10-18 cm 0-5 cm 5-10 cm 10-18 cm Sampling
time1 ----------------------------------------Mg m-3--------------------------------------- Fall 2006 1.451 a 1.545 a 1.619 a 1.541 b 1.609 b 1.682 a Spring 2007 1.346 a 1.414 b 1.626 a 1.564 ab 1.620 ab 1.675 a Fall 2007 1.353 a 1.423 b 1.619 a 1.591 a 1.636 ab 1.696 a Spring 2008 1.434 a 1.579 a 1.613 a 1.562 ab 1.651 a 1.696 a Fall 2008 1.431 a 1.577 a 1.610 a 1.534 b 1.647 a 1.700 a
1 Means with the same letter per site and depth are not significantly different at P<0.05 using the Tukey pairwise comparison method. in both the 0-5 and 5-10 cm depth (Table 7). No significant differences were observed
between mean Db values at depth 0-5 cm and 10-18 cm at the coarse-loamy site and depth
10-18 cm at the fine-loamy site.
The significantly lower Db values observed for the 2007 samples at the coarse-loamy
site (Table 7) may be the result of limited rainfall during the year and cover crop water
uptake (Wagger and Denton, 1989). Palmer “Z” index data (i.e. moisture anomaly index) for
the coastal plain of NC shows below average precipitation from January 2006 through
February 2008 (NCDC, 2009) which coincides with the low Db values for 2007. This theory
is somewhat supported by the small variations seen at the fine-loamy site since its soil
moisture status would be greater due to the difference in family class when compared to the
coarse-loamy site with all other variables being equal. At the coarse-loamy site, the main
sampling time effect does not support Wagger and Denton (1989) while the fine-loamy site
had an upward trend with the drought of 2007 (Table 8). For the fine-loamy site, variability

23
23
expressed between sampling times were quite small as can be seen by the honestly significant
difference (HSD).
Table 8. Mean main sampling time effect on soil bulk density (Db) at each site.
Coarse-loamy Fine-loamy Sampling time1 --------------Mg m-3----------- Fall 2006 1.539 a 1.611 c Spring 2007 1.462 a 1.619 bc Fall 2007 1.465 a 1.641 a Spring 2008 1.542 a 1.636 ab Fall 2008 1.540 a 1.627 abc
1 Means with the same letter at the same site are not significantly different at P<0.05 using the Tukey pairwise comparison method.
Mean main depth effect on Db increased with each progressive depth interval at each
site. This was apparent from the interaction effect but is highly significant when examined
using pairwise analysis (Table 9). At both sites, the 0-5 cm depth was significantly lower
than the 5-10 cm depth that was significantly less than the 10-18 cm depth. A similar trend
was shown by Franzluebbers (2002b), Franzluebbers et al. (2002), Yang and Wander (1999),
Franzluebbers et al. (1994a), Villamil et al.(2006) and Cassel (1983). The variation of Db
Table 9. Mean main depth effect on soil bulk density (Db) for each site.
Coarse-loamy Fine-loamy Depth1 -------------Mg m-3------------ 0-5 cm 1.403 a 1.558 a 5-10 cm 1.508 b 1.632 b 10-18 cm 1.617 c 1.690 c
1 Means with the same letter at the same site are not significantly different at P<0.05 using the Tukey pair wise comparison method.

24
24
with depth is most likely related to decreasing C contents within each depth interval (Table
15) and lower percent clay content (Table 1).
Overall, the minimal influence of cover crop treatment on the Db at the coarse-loamy
site and the fine-loamy site was the result of the strong spatial dependence of Db as exhibited
by the strong spatial and temporal interaction (Appendix E), however, there were no
sampling time trends. Conversely, the depth effect did show an increasing trend with depth
implying the depth factor in the depth*sampling time interaction as the dominate effect for
the interaction on Db in the soils in this study. Given the high percent sand content in each
depth interval (Table 1) and the decreasing C contents with depth (Table 15), the Db spatial
variability was correlated with C (Table 14). Here rxy was -0.36 (weakly moderate); which is
smaller than the rxy found by Naderman (2009). This variation between Db and total C
correlation was the result of only loamy sand/sandy loam textured soils under a residue
management system being evaluated in this study. Additionally, the lowest estimated means
for the main effect of sampling time at the fine-loamy site, depth 10-18 cm coarse-loamy site
for the interaction effect, and depths 5-10 and 10-18 cm fine-loamy site for the interaction
effect were all above 1.60 Mg m-3 which has been described as root limiting (Naderman et
al., 2006).
Total Carbon
There were no significant treatment fixed effects on total carbon at the coarse-loamy
site. However, at the fine-loamy site, there was a weak but significant
treatment*depth*sampling time interaction and a significant treatment*depth interaction. All

25
25
other fixed treatment effects were not significant (Appendix E). From Marriott and Wander
(2006) it was stated, in general, total soil organic matter has been found to not be very
responsive to short term management differences. The weak or non-significant treatment
interactions and treatment main effect support this notion.
Pairwise comparisons of simple effects for the interaction treatment*depth*sampling
time on total C at the fine-loamy site are found in Table 10. Notably, at the 5-10 cm depth
interval there were no significant three-way pairwise comparisons. The lack of a three-way
interaction in the 5-10 cm depth implies this depth was not affect by treatments in time while
the 0-5 cm depth fluxed with variable above and below ground inputs and the 10-18 cm
depth was poised for an effect since the depth had not quite reached its total C potential as
compared to depth 5-10 cm (Table 15). Therefore, as additional belowground biomass
reached the 10-18 cm depth, the new organic matter from the rye treatment that produced the
most significant biomass at the site (Table 5) influenced the three-way interaction on total C.
For the 0-5 cm depth, four treatments produced increases in total C (i.e. alfalfa, rye, rye/hairy
vetch and wheat) when compared to the significant paired treatment. Further, rye/alfalfa in
the 0-5 cm depth as compared to wheat appears to show a total C increase when in fact it
does not since its comparison is within the Fall 2006 season. This shows the large amount of
spatial variability between plots. Of the four treatments, rye and rye/hairy vetch had
significantly more total C in Spring 2008 than alfalfa, wheat, and sweetclover in the Fall of
2006. This indicates the rye and rye/hairy vetch treatment had the greatest effect on
increasing total C in the 0-5 cm depth. For alfalfa and wheat, these treatments did improve
total C within their own respective treatments, of which, alfalfa significantly increased total

26
26
C from Fall 2006 to Spring 2008 while wheat was less consistent. In the 10-18 cm depth,
only rye/hairy vetch had significantly
Table 10. Estimated significant total carbon (C) increase simple pairwise comparisons for treatment*depth*sampling time interaction at the fine-loamy site.
Depth Treatment
1 Sampling
time 1 Treatment
2 Sampling
time 2 Total C
increase (g/kg) P-value 0-5 cm Alfalfa Spg ‘08 Alfalfa Fall ‘06 4.20 0.043 0-5 cm Rye Spg ‘08 Alfalfa Fall ‘06 5.13 0.0097 0-5 cm Rye Spg ‘07 Alfalfa Fall ‘06 8.00 0.0287 0-5 cm Rye Spg ‘08 Wheat Fall ‘06 5.83 0.0007 0-5 cm Rye Spg ‘07 Wheat Fall ‘06 5.50 0.0026 0-5 cm Rye Fall ‘06 Wheat Fall ‘06 4.83 0.0259 0-5 cm Rye Spg ‘08 Sweet clover Fall ‘06 4.70 0.0388 0-5 cm Rye Spg ‘08 Wheat Spg ‘07 4.63 0.0473 0-5 cm Rye/Alfalfa Fall ‘06 Wheat Fall ‘06 4.97 0.0169 0-5 cm Rye/Hairy Vetch Spg ‘08 Alfalfa Fall ‘06 4.67 0.0429 0-5 cm Rye/Hairy Vetch Spg ‘08 Wheat Fall ‘06 5.37 0.0043 0-5 cm Wheat Fall ‘06 Alfalfa Spg ‘08 4.90 0.021 0-5 cm Wheat Fall ‘07 Wheat Fall ‘06 4.60 0.0105
10-18 cm Rye/Hairy Vetch Spg ‘08 Alfalfa Fall ‘08 4.93 0.0188 10-18 cm Rye/Hairy Vetch Spg ‘08 Alfalfa Fall ‘07 4.90 0.021 10-18 cm Rye/Hairy Vetch Spg ‘08 Alfalfa Fall ‘06 4.63 0.0473 10-18 cm Rye/Hairy Vetch Spg ‘08 Rye/Hairy Vetch Fall ‘06 4.97 0.0025 10-18 cm Rye/Hairy Vetch Spg ‘08 Rye/Hairy Vetch Fall ‘08 4.43 0.0194 10-18 cm Rye/Hairy Vetch Spg ‘08 Wheat Fall ‘07 4.83 0.0259 10-18 cm Rye/Hairy Vetch Spg ‘08 Triticale Fall ‘07 4.80 0.0287 10-18 cm Rye/Hairy Vetch Spg ‘08 Wheat Spg ‘08 4.67 0.0429 Note: Treatment 1 sampling time 1 means at depth are larger than treatment 2 sampling time 2 means at the same depth.
more total C when compared to other treatments. Rye/hairy vetch consistently increased total
C temporally when compared to alfalfa and also within its own treatment. Rye/hairy vetch
also outperformed wheat and triticale treatments at several sampling periods.
Analysis of the significant treatment*depth interaction on total C for the fine-loamy
site shows no significant pairwise comparisons (Table 11). The lack of significant simple

27
27
pairwise effects within the two-way interaction of treatment*depth implies the significance in
the three-way interaction is rooted in the main sampling time effect since the main treatment
effect was insignificant. The effect from the sampling time is supported by a significant
simple effect increase in total C at the Spring 2008 sampling at the fine-loamy site (Table
13).
Table 11. Estimated total carbon (C) simple effect means for the treatment*depth interaction at the fine-loamy site.
Fine-loamy 0-5 cm 5-10 cm 10-18 cm
Treatment 1 ------------------g/kg------------------- Alfalfa 14.07 a 9.97 a 6.32 a Barley 14.10 a 10.20 a 7.15 a Lupine 14.27 a 10.90 a 7.87 a Rye 15.58 a 10.95 a 7.45 a Rye/Alfalfa 15.01 a 10.36 a 7.10 a Rye/Hairy Vetch 15.15 a 9.83 a 7.67 a Sweet clover 13.49 a 10.31 a 7.33 a Triticale 13.73 a 8.97 a 6.37 a Wheat 13.81 a 9.39 a 6.57 a
1 Means with the same letter per site and depth are not significantly different at P<0.05 using the Tukey pairwise comparison method.
Analysis of the correlation between biomass and total C where both sites and years
were combined but split on season and depth revealed a moderate rxy that was highly
significant for all sampling times and depths (Table 12). Further, the rxy values displayed a
clear modulation of biomass on total C with respect to season. In the spring when the
aboveground biomass and consequently the belowground biomass from the cover crop was
the greatest, the rxy was moderate. Conversely in the fall when all biomass input from the
cover crop would be annually low, the rxy was weak.

28
28
Table 12. Correlation between biomass and total carbon (C). Sampling time Depth cm) # Samples p-value rxy Spring 0-5 108 <0.0001 0.5949 Fall 0-5 108 0.0003 0.3433 Spring 5-10 108 <0.0001 0.5635 Fall 5-10 108 0.0002 0.3477 Spring 10-18 108 <0.0001 0.5137 Fall 10-18 108 <0.0001 0.4092
These rxy results indicate the treatment effect on total C was less than five month on a
loamy sand/sandy loam surface textured soil in the subtropical southeast (Table 12). Another
trend observed from the rxy values is a slight decrease in the correlation with depth. The
decline of correlation with depth is the result of a significant main effect of depth on total C
(Table 15).
Both the coarse-loamy and fine-loamy sites yielded significant fixed main effects for
sampling time and depth on total C. Fixed interaction effects of depth*sampling time for total
C at both sites were not significant (Appendix E). This was consistent with the “within-plot
variability” between depths found by Bird et al. (2002) in a coarse-loamy soil in a semi-arid
range but was contrary to the lack of significance between sampling events reported by
Sainju et al. (2007) on a fine-loamy soil. In this study, sampling time represents within-plot
temporal variability. The significant main effects in the absence of an interaction effect
indicate total C distribution variability was spatial and temporal independent.
Main sampling time pairwise comparisons were variable across season for the coarse-
loamy site and essentially insignificant at the fine-loamy site with the exception of the Spring
2008 sampling time (Table 13). At the coarse-loamy site, Fall 2006 had significantly larger
carbon content than all other sampling periods. The explanation for the significantly larger

29
29
Fall 2006 estimate is not known. Spring 2008 produced the next largest carbon content value
that was larger than either 2007 sampling event and the Fall 2008 sampling time. The trend
between sampling times at the coarse-loamy site was a decrease in the Fall carbon content
Table 13. Main sampling time effect total carbon (C) means at each site.
Coarse-loamy Fine-loamy Sampling time 1 ---------------g/kg------------ Fall 2006 23.3 a 10.2 b Spring 2007 15.4 c 10.6 b Fall 2007 13.6 d 10.5 b Spring 2008 19.8 b 11.3 a Fall 2008 14.2 d 10.1 b
1 Means with the same letter per site and depth are not significantly different at P<0.05 using the Tukey pairwise comparison method. from the preceding Spring. The variability in total C values for the coarse-loamy site may be
due in part to a greater potential oxidation rate in the loamy sand texture. This greater
oxidation potential combined with increased quality substrate input each Spring and residual
fertilizer N from the top dress N application enhanced the soil microbiological communities
causing a rapid decomposition of C.
Correlations between total carbon and Db found a week inverse relationship between
the two factors that increased with depth (Table 14). The inverse relationship found in this
study were similar to those found by Naderman (2009), however, their relative values were
substantially lower than those found by Naderman (2009) in the coastal plain of North
Carolina. This is due to only two sites being compared as opposed to 29 sites.

30
30
Table 14. Correlation between total C and soil bulk density (Db) Depths # Samples p-value rxy r2
All 810 <0.0001 -0.3646 0.1329 0-5 cm 270 0.0047 -0.1715 0.0294 5-10 cm 270 0.0027 -0.1822 0.0332 10-18 cm 270 <0.0001 -0.5442 0.2962
Mean total C values between depths at each site decreased with each progressive
depth interval (Table 15). Sainju et al. (2007), Naderman et al. (2006), Bird et al. (2002),
Franzluebbers (2002a and 2002b), and Franzluebbers et al. (2002) found a similar effect. At
both sites, the 0-5 cm depth was significantly larger than the 5-10 cm depth that was
significantly larger than the 10-18 cm depth. The decreasing C with depth effect is expected
in a natural system where homogenization with depth is absent.
Table 15. Main depth effect on total C at each site. Coarse-loamy Fine-loamy
Depth1 ---------------g/kg-------------- 0-5 cm 19.2 a 14.4 a 5-10 cm 16.9 b 10.1 b 10-18 cm 15.7 c 7.10 c
1 Means with the same letter at the same site are not significantly different at P<0.05 using the Tukey pair wise comparison method.
Overall, total C was influenced by treatment but the effect was only temporal. The
effects of the biomass inputs to the system were less than five months in duration. With
respect to the treatment effect on total C, rye and rye/hairy vetch showed the most benefit
although brief. Further, total C declined significantly with depth indicating the root systems
from the cover crops were having little sustained spatial effect. In combination, these effects
or lack of effects imply total C was unenhanced by short-term management strategies.

31
31
Total Nitrogen
No treatments fixed effects were significant at either site indicating no impact of
treatment on total nitrogen. The fixed effect depth*sampling time interaction on total N was
highly significant at the fine-loamy site only; while the fixed main effects of sampling time
and depth were highly significant for total N at both sites (Appendix E). These highly
significant main and interaction effects are contrary to total N effects reported by Villamil et
al. (2006).
The significance of the fixed effect depth*sampling time interaction at the fine-loamy
site resulted in considerable variability among the pairwise comparisons within a given depth
(Table 16). For depth 0-5 cm, the Spring 2008 sampling time had the largest total N value
that was not significantly different from Fall 2007. For the 5-10 cm depth, Spring 2007
Table 16. Estimated simple effect means for depth*sampling time interaction on total nitrogen (N) at the fine-loamy site.
Fine-loamy 0-5 cm 5-10 cm 10-18 cm Sampling
time1 -------------------g/kg------------------- Fall 2006 1.15 c 0.84 b 0.76 a Spring 2007 1.31 b 0.97 a 0.67 ab Fall 2007 1.32 ab 0.95 ab 0.64 ab Spring 2008 1.44 a 0.96 a 0.66 ab Fall 2008 1.27 b 0.85 b 0.61 b
1 Means with the same letter per site and depth are not significantly different at P<0.05 using the Tukey pairwise comparison method. through Spring 2008 had the largest mean estimates that were not significantly different,
however, Fall 2007 was not significantly different from Fall 2006 or Fall 2008. The mean

32
32
significant total N pairwise comparisons across sampling times for the 10-18 cm depth were
few. Fall 2006 was the largest and significantly different from only Fall 2008.
The Spring 2007 and 2008 total N increase above the previous Fall in the 0-5 and 5-
10 cm depths for the fine-loamy site are believed to be the result of residual top dress
inorganic N not assimilated by the cover crop combined with pre-plant fertilizer applied by
the producer. The cover crops at the fine-loamy site yielded low biomass quantities and were
terminated relatively early leaving unsequestered N in the upper soil depths. Residual N
would also have been present due to drought conditions from January 2006 through February
2008 as indicated by the Palmer Z index (NCDC, 2009), hindering consumption by microbial
decomposition activities and minimal leaching. Conversely, the cover crops at the coarse-
loamy site yielded relatively large biomass quantities and were terminated late, therefore,
assimilating the top dressed inorganic N in the plant biomass. This difference between the
two sites was believed to be reason why the coarse-loamy site did not have an interaction
effect while the fine-loamy site did. The relatively low F-statistic for the interaction effect at
the fine-loamy site when compared to the table value lends support to the lack of an
interaction if residual top dress N was not present. The lack of an interaction effect implies
total N was spatially and temporally independent agreeing with Villamil et al. (2006).
Pairwise comparisons for the main sampling time effect on total N estimated means
for both sites are in Table 17. With the exception of Fall 2006 at the coarse-loamy site, the
total N trend was to decrease in the respective fall sampling time for a given year. For season
2008, the pairwise comparison was significant for both sites, while for 2007 significance was

33
33
only seen at the coarse loamy site. The lower total N value in the Fall of each season was
consistent with the lowest soil N levels occurring around anthesis (Below, 2002).
Table 17. Main sampling time effect on total nitrogen (N) means for each site.
Coarse-loamy Fine-loamy Sampling time1 --------------g/kg-------------- Fall 2006 1.542 a 0.917 bc Spring 2007 1.109 c 0.984 ab Fall 2007 0.978 d 0.972 abc Spring 2008 1.433 b 1.022 a Fall 2008 0.979 d 0.910 c
1 Means with the same letter at the same site are not significantly different at P<0.05 using the Tukey pairwise comparison method
Estimated mean total N depth comparisons for each site were significant for each
progressive depth interval (Table 18). The surface depth having a greater total N
concentration than the underlying depths was consistent with reports by Franzluebbers
(2002a) and Franzluebbers et al. (2002). At both sites, the 0-5 cm depth was significantly
larger than the 5-10 cm depth that was significantly larger than the 10-18 cm depth.
Table 18. Main depth effect total nitrogen (N) means for at each site.
Coarse-loamy Fine-loamy Depth1 ----------------g/kg------------- 0-5 cm 1.391 a 1.300 a 5-10 cm 1.184 b 0.914 b 10-18 cm 1.049 c 0.669 c
1 Means with the same letter at the same site are not significantly different at P<0.05 using the Tukey pair wise comparison method.
Correlation between total C and N per depth interval was very strong (Table 19)
indicating a positive relationship between total C and total N. That is, as total C increased
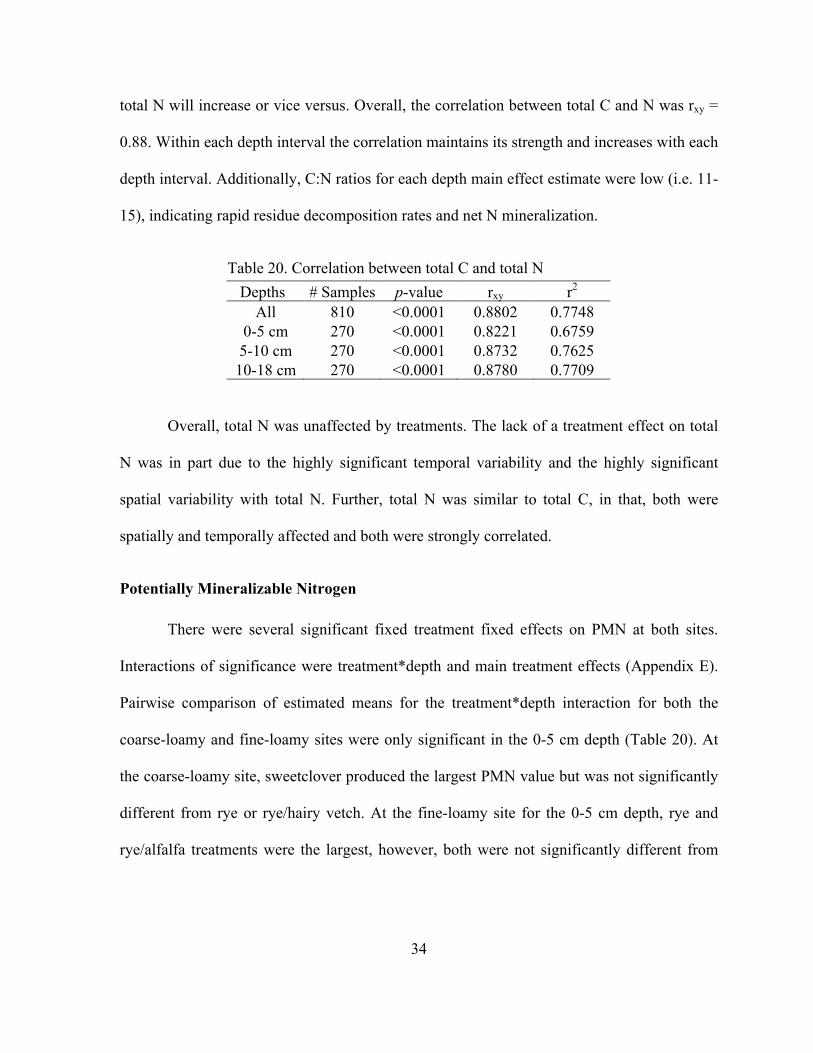
34
34
total N will increase or vice versus. Overall, the correlation between total C and N was rxy =
0.88. Within each depth interval the correlation maintains its strength and increases with each
depth interval. Additionally, C:N ratios for each depth main effect estimate were low (i.e. 11-
15), indicating rapid residue decomposition rates and net N mineralization.
Table 20. Correlation between total C and total N Depths # Samples p-value rxy r2
All 810 <0.0001 0.8802 0.7748 0-5 cm 270 <0.0001 0.8221 0.6759 5-10 cm 270 <0.0001 0.8732 0.7625 10-18 cm 270 <0.0001 0.8780 0.7709
Overall, total N was unaffected by treatments. The lack of a treatment effect on total
N was in part due to the highly significant temporal variability and the highly significant
spatial variability with total N. Further, total N was similar to total C, in that, both were
spatially and temporally affected and both were strongly correlated.
Potentially Mineralizable Nitrogen
There were several significant fixed treatment fixed effects on PMN at both sites.
Interactions of significance were treatment*depth and main treatment effects (Appendix E).
Pairwise comparison of estimated means for the treatment*depth interaction for both the
coarse-loamy and fine-loamy sites were only significant in the 0-5 cm depth (Table 20). At
the coarse-loamy site, sweetclover produced the largest PMN value but was not significantly
different from rye or rye/hairy vetch. At the fine-loamy site for the 0-5 cm depth, rye and
rye/alfalfa treatments were the largest, however, both were not significantly different from

35
35
rye/hairy vetch. The significance of treatments rye and rye/hairy vetch at both sites and
rye/alfalfa at the fine-loamy site on PMN at depth 0-5 cm was a function of the volume of
Table 20. Estimated potentially mineralizable nitrogen (PMN) simple effect means for treatment*depth interaction for both the coarse-loamy and fine-loamy site.
Coarse-loamy Fine-loamy 0-5 cm 5-10 cm 10-18 cm 0-5 cm 5-10 cm 10-18 cm
Treatment1 ------------------------------------------g/kg---------------------------------------- Alfalfa 7.37 c 6.85 a 4.07 a 38.07 bc 9.20 a 6.42 a Barley 6.59 c 2.75 a 5.60 a 34.89 bc 10.92 a 7.08 a Lupine 8.24 c 5.39 a 5.71 a 35.19 bc 6.94 a 3.55 a Rye 37.40 ab 3.11 a 7.62 a 59.92 a 16.04 a 5.58 a Rye/Alfalfa 7.42 c 5.20 a 4.28 a 59.88 a 14.61 a 9.46 a Rye/Hairy Vetch 30.46 abc 4.90 a 4.84 a 53.33 ab 14.81 a 5.81 a Sweetclover 40.63 a 12.00 a 7.50 a 21.69 c 8.58 a 3.40 a Triticale 14.02 bc 11.49 a 5.90 a 27.08 c 9.33 a 4.10 a Wheat 15.32 bc 6.46 a 3.25 a 29.75 c 8.20 a 5.37 a 1 Means with the same letter per site and depth are not significantly different at P<0.05 using the Tukey pair wise comparison method. biomass produced and N assimilated combined with the resistance of the rye biomass to
decomposition as compared to the other residues. From Ranells and Wagger (1997), it was
noted the lowest soil inorganic N levels occurred under a rye cover crop treatment. This
implies the rye was scavenging the most soil N; consequently the rye or rye combinations
will create higher levels of PMN as the biomass decays on the soil surface.
Main treatment effect pairwise comparisons for the coarse-loamy and fine-loamy sites
are listed in Table 12. For the coarse-loamy site, sweetclover had the largest estimated PMN
mean, however, it was not significantly different from rye or rye/hairy vetch. This significant
comparison relationship was identical to that seen in the treatment*depth interaction for the
0-5 cm depth implying the 0-5 cm depth estimates were the main factors in the
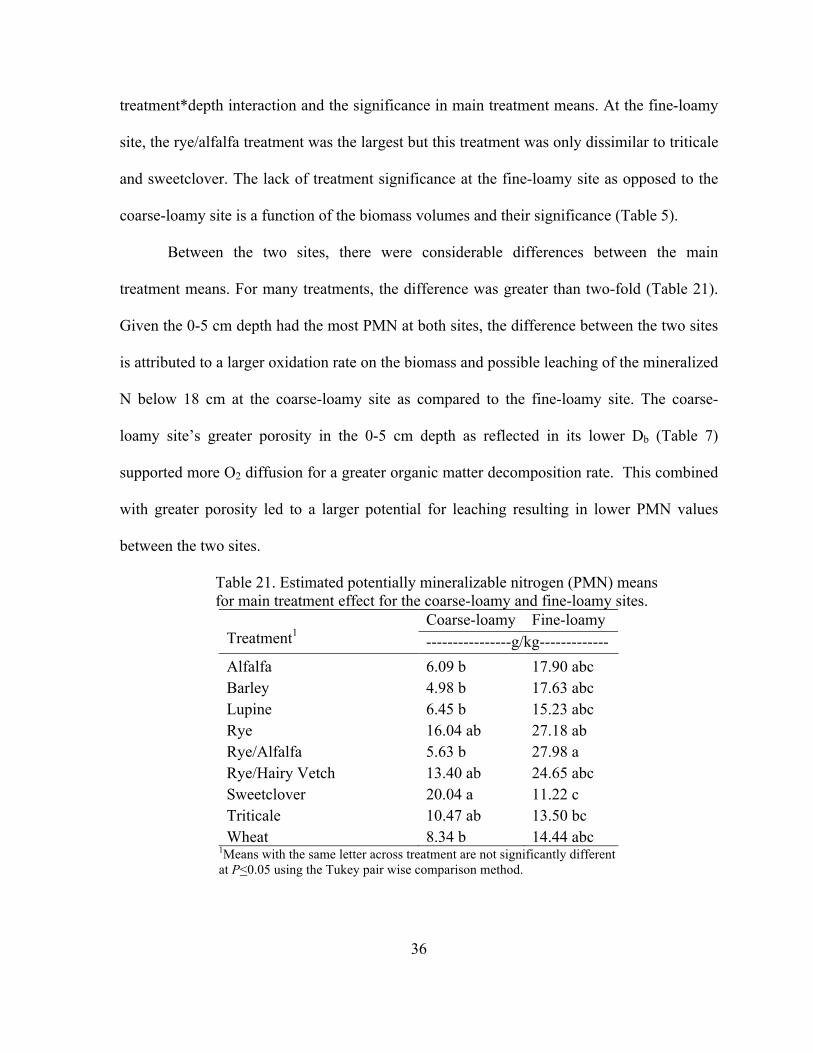
36
36
treatment*depth interaction and the significance in main treatment means. At the fine-loamy
site, the rye/alfalfa treatment was the largest but this treatment was only dissimilar to triticale
and sweetclover. The lack of treatment significance at the fine-loamy site as opposed to the
coarse-loamy site is a function of the biomass volumes and their significance (Table 5).
Between the two sites, there were considerable differences between the main
treatment means. For many treatments, the difference was greater than two-fold (Table 21).
Given the 0-5 cm depth had the most PMN at both sites, the difference between the two sites
is attributed to a larger oxidation rate on the biomass and possible leaching of the mineralized
N below 18 cm at the coarse-loamy site as compared to the fine-loamy site. The coarse-
loamy site’s greater porosity in the 0-5 cm depth as reflected in its lower Db (Table 7)
supported more O2 diffusion for a greater organic matter decomposition rate. This combined
with greater porosity led to a larger potential for leaching resulting in lower PMN values
between the two sites.
Table 21. Estimated potentially mineralizable nitrogen (PMN) means for main treatment effect for the coarse-loamy and fine-loamy sites.
Coarse-loamy Fine-loamy Treatment1 ----------------g/kg------------- Alfalfa 6.09 b 17.90 abc Barley 4.98 b 17.63 abc Lupine 6.45 b 15.23 abc Rye 16.04 ab 27.18 ab Rye/Alfalfa 5.63 b 27.98 a Rye/Hairy Vetch 13.40 ab 24.65 abc Sweetclover 20.04 a 11.22 c Triticale 10.47 ab 13.50 bc Wheat 8.34 b 14.44 abc
1Means with the same letter across treatment are not significantly different at P<0.05 using the Tukey pair wise comparison method.

37
37
The interaction of depth*sampling time on PMN was significant for both sites. Main
effects of significance were sampling time and depth (Appendix E). At the coarse-loamy site,
there was a trend in PMN for the Spring sampling time being significantly larger than the
preceding or post Fall values in the depth 0-5 cm (Table 22). In the 5-10 and 10-18 cm
depths there were no significant differences between seasons. At the fine-loamy site for depth
0-5 cm, the PMN trend was a stepwise decrease through each sampling time of the study
with the exception of Fall 2007 to Spring 2008, which were not significantly different (Table
22). A similar trend, although not as apparent, was seen in the 5-10 cm depth. Comparisons
for the 10-18 cm depth did not yield any significant differences.
Table 22. Estimated potentially mineralizable nitrogen (PMN) simple effect means for depth*sampling time interaction for both the coarse-loamy and fine-loamy site.
Coarse-loamy Fine-loamy 0-5 cm 5-10 cm 10-18 cm 0-5 cm 5-10 cm 10-18 cm
Sampling time1 ---------------------------------------g/kg--------------------------------------- Fall 2006 15.88 b 4.34 a 1.34 a 98.73 a 18.80 a 3.05 a Spring 2007 30.36 a 7.12 a 8.04 a 44.16 b 15.59 ab 9.52 a Fall 2007 11.70 b 12.20 a 11.88 a 23.85 c 13.64 abc 8.58 a Spring 2008 31.96 a 4.45 a 4.02 a 30.30 c 5.38 bc 4.78 a Fall 2008 3.13 b 4.20 a 1.81 a 2.86 d 1.39 c 2.29 a 1 Means with the same letter per site and depth are not significantly different at P<0.05 using the Tukey pairwise comparison method.
Both trends for PMN means with depth clearly show a dependence on the sampling
time and the crop grown. For the 2008 crop year, the crops grown changed from continuous
cotton to soybeans or corn, respectively for the coarse-loamy and fine-loamy sites. The lack
of N applied to the soybean crop and the utilization efficiency of N by corn is clearly seen for
the Fall 2008 season. The season interaction was supported by Franzluebbers (2002a),

38
38
Willson et al. (2001) and Franzluebbers et al. (1994). Franzluebbers et al. (1994) proposed
decreases in PMN from one sampling period to the next to be 1) the result of a net release of
mineral N or 2) a decrease in substrate quality immobilizing N. At both sites, the PMN trend
may be the result of released mineral N. The C:N ratios for estimated main depth or sampling
time (i.e. 11-15) support the N mineralization proposal. In addition to low C:N ratios,
weather conditions for the area during much of the study period had the area under drought
conditions (NCDC, 2009). After the 2007 season, residual inorganic N was assumed to be
present from low rainfall. This combined with added top dress N for the cover crops and the
cash crop would maintain a system netting mineralization.
Willson et al. (2001) found in addition to the season variation of PMN, a strong
correlation between POM and PMN especially in a 70-150 d aerobic incubation. The PMN
incubations in this study were only 7 d and anaerobic, however, a correlation between POM
and PMN did present itself (Table 23). At rxy = 0.55, the correlation was classified as
moderate. Between depth intervals, the POM and PMN correlation substantially decreased
with each successive depth interval. The successive decrease with depth support the spatial
dependence of PMN due to the biomass inputs to the soil surface and the lack of soil mixing
in a no-till cropping system. Contrary to the correlation found here, Wander et al. (2007)
found an inverse relationship between POM and PMN stocks. The difference here being no
manure additions were added to substantially change the C:N ratios.
Pairwise comparison of estimated PMN mean for main depth and sampling time
effects at both sites are similar to that presented in Table 22. This data is not presented since

39
39
it does not further add to the understanding of the PMN flux at the coarse-loamy and fine-
loamy sites.
Table 23. Correlation between particulate organic matter (POM) and potentially mineralizable nitrogen (PMN).
Depths # Samples p-value rxy r2 All 810 <0.0001 0.5589 0.3123
0-5 cm 270 <0.0001 0.5087 0.2588 5-10 cm 270 <0.0001 0.3420 0.1169 10-18 cm 270 0.0042 0.1735 0.0301
Overall, PMN was positively influenced by rye or rye/hairy treatments regardless of
the site in the 0-5 cm depth indicating the assays spatial significance. Additionally, PMN
fluxed temporally as conditioned by the soil mineralization state. Further, PMN was
moderately correlated to POM as would be expected in a no-till system especially in the 0-5
cm depth.
Particulate Organic Matter Fixed effect treatment means for particulate organic matter were only significant for
one interaction at one site. The treatment*season interaction was significant at the coarse-
loamy site (Appendix E). Comparisons of simple effect means for treatment*sampling time
interactions at the coarse-loamy site can be found in Table 24 and Figure 1. The largest POM
value for any treatment occurred in Spring 2007 except for alfalfa and triticale. The POM for
rye/hairy vetch and sweetclover were significantly greater in Spring 2007 compared to any
other sampling time for the respective treatment. Similarly, rye and rye/alfalfa were greater

40
40
Table 24. Estimated particulate organic matter (POM) simple effect means for treatment*sampling time interaction for the coarse-loamy site.
Fall 2006 Spring 2007 Fall 2007 Spring 2008 Fall 2008 Treatment1 ------------------------------------------g/kg-------------------------------------- Alfalfa 0.19 a 0.18 a 0.16 a 0.11 a 0.13 a Barley 0.18 ab 0.25 a 0.17 ab 0.13 b 0.18 ab Lupine 0.22 bc 0.34 a 0.28 ab 0.17 c 0.19 c Rye 0.28 ab 0.37 a 0.19 b 0.20 b 0.19 b Rye/Alfalfa 0.24 ab 0.30 a 0.18 b 0.17 b 0.18 b Rye/Hairy Vetch 0.22 b 0.35 a 0.19 b 0.16 b 0.21 b Sweetclover 0.21 b 0.43 a 0.24 b 0.17 b 0.17 b Triticale 0.20 a 0.22 a 0.22 a 0.15 a 0.13 a Wheat 0.23 ab 0.29 a 0.18 ab 0.14 b 0.14 b 1 Means with the same letter across sampling times are not significantly different at P<0.05 using the Tukey pair wise comparison method.
Figure 1. Treatment*sampling time simple effect means for particulate organic matter (POM) at the coarse-loamy site. in Spring 2007 yielding a significant difference from Fall 2007 and both 2008 sampling times
but not different from Fall 2006. Treatments alfalfa and triticale were not significant between
any sampling time. These POM results displayed a declining trend from the peak in Spring
2007 to a significant low in the Fall 2008 sampling time for treatments lupine, rye,

41
41
rye/alfalfa, rye/hairy vetch (i.e. the higher biomass yielders) and wheat, sweetclover (i.e. the
lower biomass yielders). This decline was believed to be the result of a priming effect from
the addition of biomass. Priming effect was defined as the increased decomposition of a soil
organic matter fraction that results from the addition of fresh organic materials to a soil under
the influence of a much enhanced soil biologic community acting on excess available
nitrogen. As seen in Table 5, the biomass inputs to the system significantly increased over
time, however, the POM means for most treatments clearly decreased from either the Fall
2006 background level or the high in Spring 2007.
Analysis of rxy between biomass and POM reveals an unexpected trend for all depths
and sampling times. As shown in Table 25, a negative rxy was observed. This negative
correlation supports the notion of a priming effect from the increased biomass on POM at all
depths. It is noted the magnitude of the correlation is weak, possibly indicating: 1) either a
longer duration of increased biomass input is required which is beyond the scope of this
study, or 2) a larger volume of biomass in excess of the volume that can be consumed by the
soil biota in order to reverse the declining trend needs to be achieved. Again the goal of
Table 25. Correlation between biomass and particulate organic matter (POM). Sampling time Depth (cm) # Samples p-value rxy Spring 0-5 108 <0.0001 -0.4094 Fall 0-5 108 0.0297 -0.2093 Spring 5-10 108 0.0002 -0.3558 Fall 5-10 108 <0.0001 -0.3693 Spring 10-18 108 0.0006 -0.3234 Fall 10-18 108 0.0006 -0.3256

42
42
supplying >6 Mg/ha was not consistently achieved and may be the critical level for the soils
on these two sites.
Particulate organic matter fixed effects means were significant for depth*sampling
time interaction for both sites. The main effects of season and depth were also significant at
both sites (Appendix E). Pairwise comparison of POM means for the depth*sampling time
interaction for both the coarse-loamy and fine-loamy sites revealed a more variable trend
when all sampling times are included within each depth (Table 26). However when the Fall
2006 values are excluded, a decreasing trend with time is present for each depth at both sites.
It is reasonable to exclude Fall 2006 POM since cover crop inputs were minimal before
Spring 2007.
Table 26. Estimated particulate organic matter (POM) simple effect means for depth*sampling time interaction for both the coarse-loamy and fine-loamy site.
Coarse-loamy Fine-loamy 0-5 cm 5-10 cm 10-18 cm 0-5 cm 5-10 cm 10-18 cm
Sampling time1 ----------------------------------------g/kg--------------------------------------- Fall 2006 0.242 b 0.217 ab 0.196 ab 0.920 b 0.443 b 0.275 ab Spring 2007 0.413 a 0.262 a 0.230 a 1.022 a 0.598 a 0.351 a Fall 2007 0.261 b 0.183 bc 0.155 bc 0.671 cd 0.394 b 0.218 abc Spring 2008 0.211 b 0.132 c 0.124 c 0.726 c 0.328 bc 0.195 bc Fall 2008 0.259 b 0.128 c 0.116 c 0.555 d 0.220 c 0.130 c 1 Means with the same letter per site and depth are not significantly different at P<0.05 using the Tukey pairwise comparison method.
Pairwise comparisons of POM for the main depth and sampling time effect further
enhance the trending decline between increasing depth intervals and sampling times Spring
2007 and Fall 2008 (Table 27).
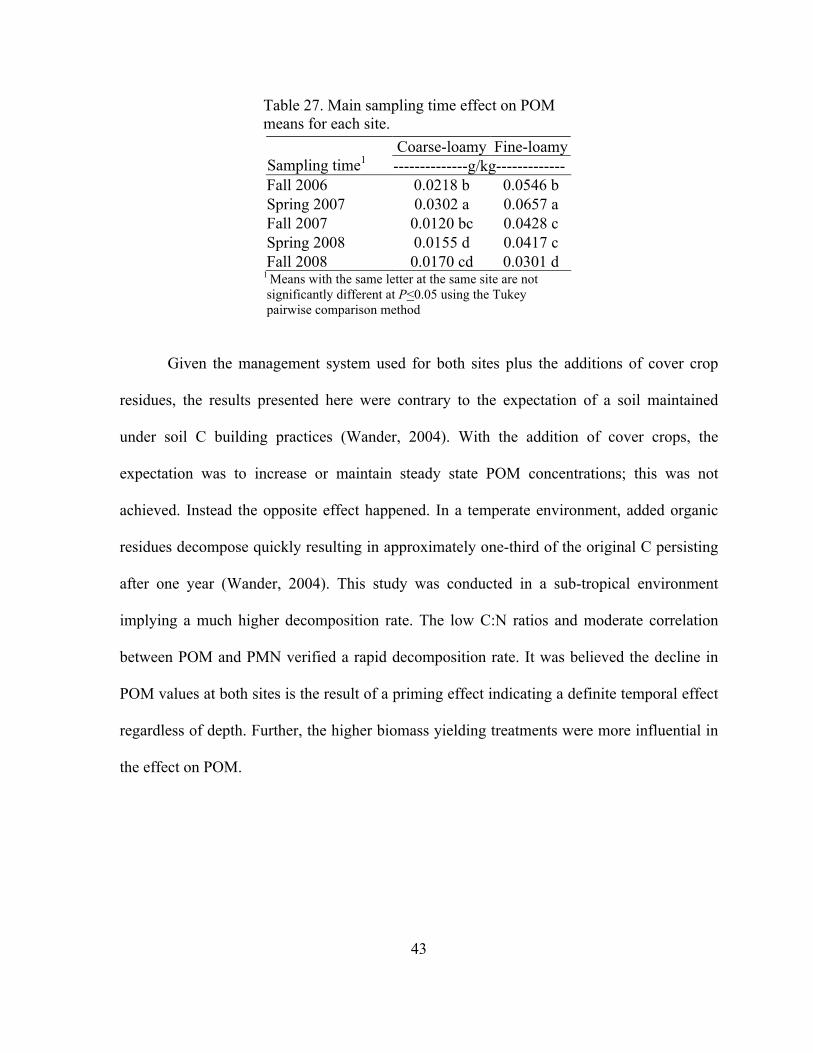
43
43
Table 27. Main sampling time effect on POM means for each site.
Coarse-loamy Fine-loamy Sampling time1 --------------g/kg------------- Fall 2006 0.0218 b 0.0546 b Spring 2007 0.0302 a 0.0657 a Fall 2007 0.0120 bc 0.0428 c Spring 2008 0.0155 d 0.0417 c Fall 2008 0.0170 cd 0.0301 d
1 Means with the same letter at the same site are not significantly different at P<0.05 using the Tukey pairwise comparison method
Given the management system used for both sites plus the additions of cover crop
residues, the results presented here were contrary to the expectation of a soil maintained
under soil C building practices (Wander, 2004). With the addition of cover crops, the
expectation was to increase or maintain steady state POM concentrations; this was not
achieved. Instead the opposite effect happened. In a temperate environment, added organic
residues decompose quickly resulting in approximately one-third of the original C persisting
after one year (Wander, 2004). This study was conducted in a sub-tropical environment
implying a much higher decomposition rate. The low C:N ratios and moderate correlation
between POM and PMN verified a rapid decomposition rate. It was believed the decline in
POM values at both sites is the result of a priming effect indicating a definite temporal effect
regardless of depth. Further, the higher biomass yielding treatments were more influential in
the effect on POM.

44
44
CEC
The fixed interaction effect treatment*sampling time at the fine-loamy site was the
only significant treatment effect found for CEC (Appendix E). Simple effect mean pairwise
comparisons for most treatments exhibited either no significant change with sampling time
(i.e. alfalfa, lupine, sweetclover, triticale or wheat) or small but significant temporal changes
(i.e. barley, rye, rye/alfalfa, or rye/hairy vetch) (Table 28 and Figure 2). Of these four
treatments, the rye treatment decreased the CEC mean 27% between Fall 2006 and Fall 2008.
The remaining treatments with significant changes had reductions of 23, 24 and 20%,
respectively. Notably, all rye or rye combination cover crop treatments exhibited a declining
temporal trend in CEC. Similar to the unanticipated decline in POM means, the CEC means
followed a similar trend. This trend appears to be biomass related in that the treatments
displaying significance were all among the largest biomass producers for the site (Table 5)
with the exception of triticale. To develop a possible explanation for the declines in CEC, pH
data was analyzed anticipating a potential pH dependence effect, however, this analysis
yielded no conclusion. Further, given the majority of the declines observed were in a rye or
rye combination treatment and not triticale, there may be organic acids released during the
decomposition of the various organic compounds (i.e. hemicellulose, cellulose, and lignin)
contained in the non-hybridized biomass produced from the rye treatments effecting the
exchangeable acidity. However, this theory was not supported by the pH data. Analysis of
correlation data between POM and CEC resulted in a strong, moderate correlation of rxy =
0.6933 (r2 = 0.4806) (Table 32). This correlation relationship between POM and CEC
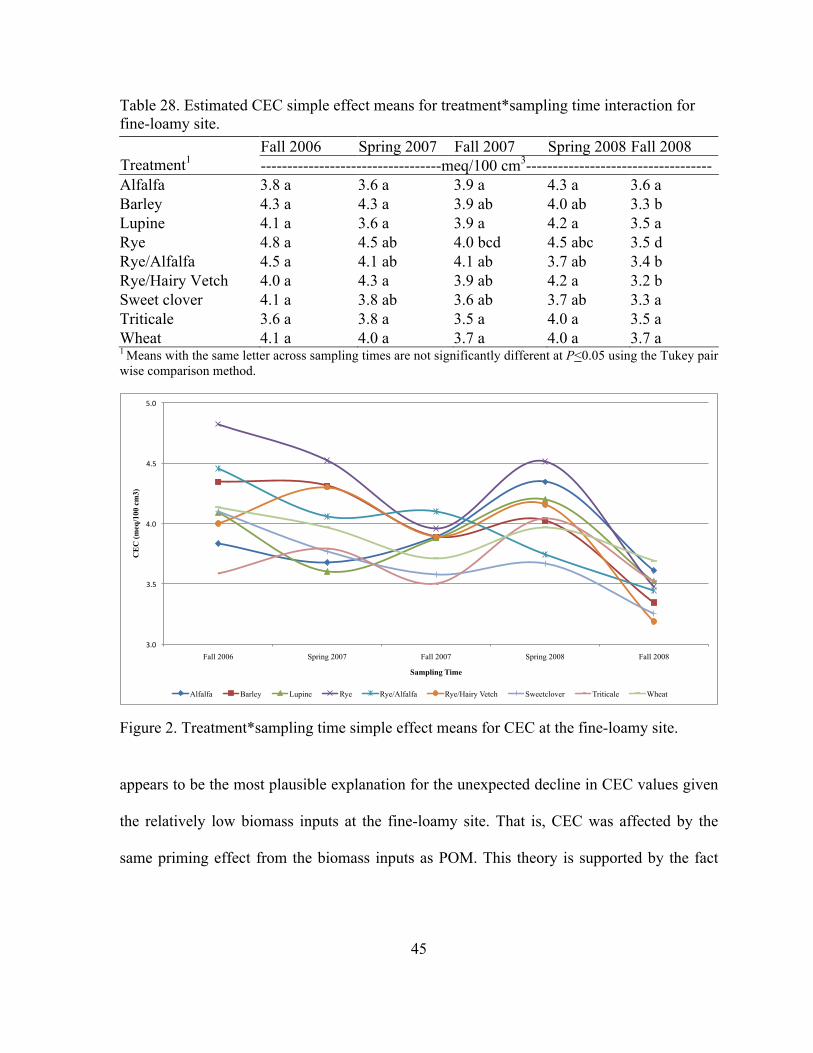
45
45
Table 28. Estimated CEC simple effect means for treatment*sampling time interaction for fine-loamy site.
Fall 2006 Spring 2007 Fall 2007 Spring 2008 Fall 2008 Treatment1 ----------------------------------meq/100 cm3----------------------------------- Alfalfa 3.8 a 3.6 a 3.9 a 4.3 a 3.6 a Barley 4.3 a 4.3 a 3.9 ab 4.0 ab 3.3 b Lupine 4.1 a 3.6 a 3.9 a 4.2 a 3.5 a Rye 4.8 a 4.5 ab 4.0 bcd 4.5 abc 3.5 d Rye/Alfalfa 4.5 a 4.1 ab 4.1 ab 3.7 ab 3.4 b Rye/Hairy Vetch 4.0 a 4.3 a 3.9 ab 4.2 a 3.2 b Sweet clover 4.1 a 3.8 ab 3.6 ab 3.7 ab 3.3 a Triticale 3.6 a 3.8 a 3.5 a 4.0 a 3.5 a Wheat 4.1 a 4.0 a 3.7 a 4.0 a 3.7 a 1 Means with the same letter across sampling times are not significantly different at P<0.05 using the Tukey pair wise comparison method.
Figure 2. Treatment*sampling time simple effect means for CEC at the fine-loamy site.
appears to be the most plausible explanation for the unexpected decline in CEC values given
the relatively low biomass inputs at the fine-loamy site. That is, CEC was affected by the
same priming effect from the biomass inputs as POM. This theory is supported by the fact
!"#$
!"%$
&"#$
&"%$
%"#$
Fall 2006 Spring 2007 Fall 2007 Spring 2008 Fall 2008
CE
C (
meq
/100 c
m3)
Sampling Time
Alfalfa Barley Lupine Rye Rye/Alfalfa Rye/Hairy Vetch Sweetclover Triticale Wheat
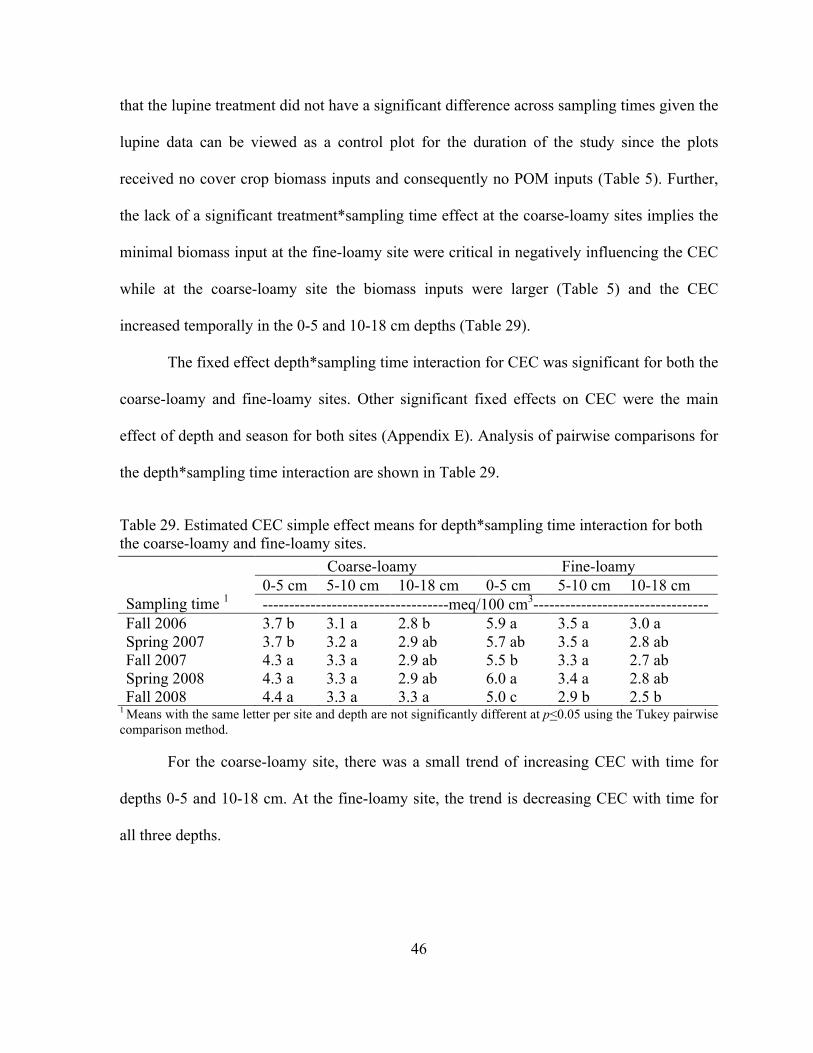
46
46
that the lupine treatment did not have a significant difference across sampling times given the
lupine data can be viewed as a control plot for the duration of the study since the plots
received no cover crop biomass inputs and consequently no POM inputs (Table 5). Further,
the lack of a significant treatment*sampling time effect at the coarse-loamy sites implies the
minimal biomass input at the fine-loamy site were critical in negatively influencing the CEC
while at the coarse-loamy site the biomass inputs were larger (Table 5) and the CEC
increased temporally in the 0-5 and 10-18 cm depths (Table 29).
The fixed effect depth*sampling time interaction for CEC was significant for both the
coarse-loamy and fine-loamy sites. Other significant fixed effects on CEC were the main
effect of depth and season for both sites (Appendix E). Analysis of pairwise comparisons for
the depth*sampling time interaction are shown in Table 29.
Table 29. Estimated CEC simple effect means for depth*sampling time interaction for both the coarse-loamy and fine-loamy sites.
Coarse-loamy Fine-loamy 0-5 cm 5-10 cm 10-18 cm 0-5 cm 5-10 cm 10-18 cm
Sampling time 1 -----------------------------------meq/100 cm3--------------------------------- Fall 2006 3.7 b 3.1 a 2.8 b 5.9 a 3.5 a 3.0 a Spring 2007 3.7 b 3.2 a 2.9 ab 5.7 ab 3.5 a 2.8 ab Fall 2007 4.3 a 3.3 a 2.9 ab 5.5 b 3.3 a 2.7 ab Spring 2008 4.3 a 3.3 a 2.9 ab 6.0 a 3.4 a 2.8 ab Fall 2008 4.4 a 3.3 a 3.3 a 5.0 c 2.9 b 2.5 b
1 Means with the same letter per site and depth are not significantly different at p<0.05 using the Tukey pairwise comparison method.
For the coarse-loamy site, there was a small trend of increasing CEC with time for
depths 0-5 and 10-18 cm. At the fine-loamy site, the trend is decreasing CEC with time for
all three depths.
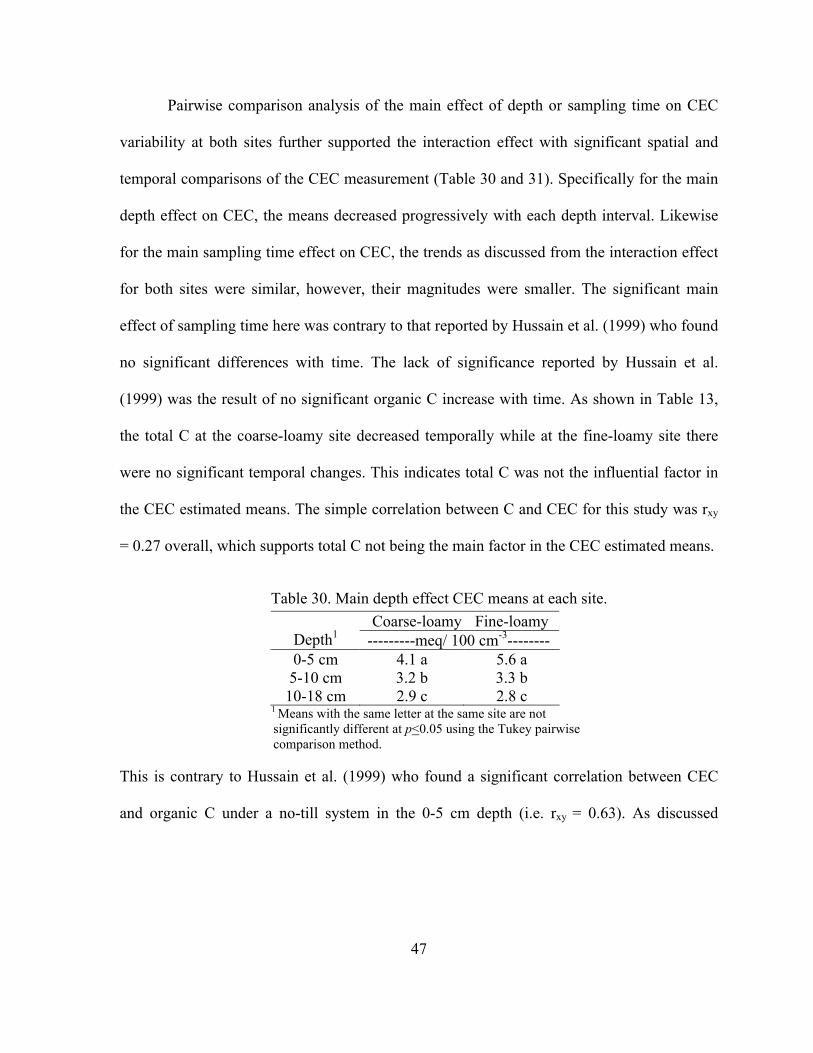
47
47
Pairwise comparison analysis of the main effect of depth or sampling time on CEC
variability at both sites further supported the interaction effect with significant spatial and
temporal comparisons of the CEC measurement (Table 30 and 31). Specifically for the main
depth effect on CEC, the means decreased progressively with each depth interval. Likewise
for the main sampling time effect on CEC, the trends as discussed from the interaction effect
for both sites were similar, however, their magnitudes were smaller. The significant main
effect of sampling time here was contrary to that reported by Hussain et al. (1999) who found
no significant differences with time. The lack of significance reported by Hussain et al.
(1999) was the result of no significant organic C increase with time. As shown in Table 13,
the total C at the coarse-loamy site decreased temporally while at the fine-loamy site there
were no significant temporal changes. This indicates total C was not the influential factor in
the CEC estimated means. The simple correlation between C and CEC for this study was rxy
= 0.27 overall, which supports total C not being the main factor in the CEC estimated means.
Table 30. Main depth effect CEC means at each site. Coarse-loamy Fine-loamy
Depth1 ---------meq/ 100 cm-3-------- 0-5 cm 4.1 a 5.6 a 5-10 cm 3.2 b 3.3 b 10-18 cm 2.9 c 2.8 c
1 Means with the same letter at the same site are not significantly different at p<0.05 using the Tukey pairwise comparison method.
This is contrary to Hussain et al. (1999) who found a significant correlation between CEC
and organic C under a no-till system in the 0-5 cm depth (i.e. rxy = 0.63). As discussed

48
48
previously, analysis of pH data for both sites also does not show any apparent trend to
correlate to a pH dependent CEC trend.
Table 31. Main sampling time effect CEC means at each site. Coarse-loamy Fine-loamy
Sampling time1 ---------meq/ 100 cm-3--------- Fall 2006 3.19 c 4.15 a
Spring 2007 3.26 c 3.99 abc Fall 2007 3.52 a 3.82 c
Spring 2008 3.49 b 4.07 ab Fall 2008 3.65 a 3.45 d
1 Means with the same letter at the same site are not significantly different at P<0.05 using the Tukey pair wise comparison method.
As mentioned previously, the correlation of greater significance was between POM
and CEC (Table 32). Overall the correlation between POM and CEC was rxy = 0.69. When
partitioned by depth interval, a strong moderate correlation of rxy = 0.66 for the 0-5 cm depth
was maintained but decreased to the point of insignificance at the 10-18 cm depth (Table 32).
Table 32. Correlation between particulate organic matter (POM) and CEC Depths # Samples p-value rxy r2
All 810 <0.0001 0.6933 0.4806 0-5 cm 270 <0.0001 0.6633 0.4399 5-10 cm 270 <0.0001 0.3390 0.1149 10-18 cm 270 0.3472 0.0574 0.0033
In total, CEC displayed significant spatial*temporal interaction. However, the effect
driving the interaction appears to be a function of the treatment biomass inputs affecting the
POM levels at the site. The strong moderate correlation between POM and CEC support this
conclusion.

49
49
Conclusions
Overall, the treatments that more often produced the most aboveground biomass were
rye or rye/hairy vetch although they were not always significantly larger than other
treatments. Neither rye nor rye/hairy vetch consistently exceeded the goal of supplying an
additional >6 Mg biomass per acre. Biomass yield was a function of several factors including
seeding date and growing days as well as the extraneous influence of climate and predation.
Of these factors, seeding date was of primary concern where seeding in late October through
early November was best. Secondarily, when the objective was to maximize biomass yield,
delaying termination of a cover crop until May was advantageous. With respect to the lupine
treatment, that produced the maximum biomass yield, its application should be selected
carefully to counter the affects of predation.
Treatment influence on Db was minimal, supporting the strong spatial dependence of
Db. Managing Db in the short term via the use of cover crops was found to only be minimally
effective in the 0-5 cm depth range at the fine-loamy site. Of the significant treatments at the
fine-loamy site for the 0-5 cm depth, rye/alfalfa was the best treatment. The combination of
the fiberous root system from rye and the expansive taproot system of alfalfa allowed it to
positively influence Db in the surface depth. However, neither the rye root system nor the
alfalfa root system affected the 5-10 or 10-18 cm depth. For the coarse-loamy site, none of
the selected treatments affected the Db indicating the difficulty in manipulating this spatially
dependent soil physical property especially in soils with loamy sand surface textures and
coarse-loamy control sections. Further, Db at the coarse-loamy site exhibited essentially no
trend at depth temporally. At the fine-loamy site, a similar insignificant temporal trend at

50
50
depth as displayed at the coarse-loamy site was seen in the 0-5 and 10-18 cm depth.
Conversely, there was a temporal increase in Db in the 5-10 cm depth. Additionally, there
was a spatial trend of increasing Db with depth at both sites. The increasing trends temporally
and spatially were the result of decreasing total C while spatially the increasing trends were
the combined result of decreasing total C with increasing % sand content. Correlation of Db
with total C had an inverse relationship that supports the observation of increasing Db with
depth and decreasing total C with depth. This conclusion indicates that over the duration of
this study, the above and belowground biomass from the cover crops used failed to improve
Db from the Fall 2006 readings at any depth given and further displaying the difficulty in
making short-term improvements to a strong spatial dependent soil property.
Unlike Db that showed resistance to treatment temporal influences, total C was
temporally affected. The effect was primarily seasonal and the duration was <5 months
displaying the short-term difficulty in manipulating this soil chemical property. With respect
to treatments, the fine-loamy site did have some treatment interaction effects on the 0-5 and
10-18 cm depth where rye or rye/hairy vetch exhibited the greatest effect. The correlation
between biomass and total C clearly displayed a decline between Spring and Fall seasons.
This total C flux with a duration of <5 months exhibited the need to supply biomass
quantities >6 Mg/ha to improve total C on loamy sand or sandy loam surface textured soil in
either coarse-loamy or fine-loamy soil families in the sub-tropical Southeast. Further, total C
declined temporally at the coarse-loamy site but not at the fine-loamy site. These declines in
total C at the coarse-loamy site displayed the importance of discovering improved C
management strategies on soils with high oxidation rates in a subtropical environment.
51
51
Similar to the coarse-loamy site, soils at the fine-loamy site can benefit from discovering
improved C management strategies with depth, however, these soil were more consistent at
maintaining total C levels temporally. Between the two sites, the inherent soil differences are
displayed which ultimately affect the obtainable levels of the measured assay.
Relative to total N effects, there were no treatment effects on total N suggesting this
parameter was exclusively spatially and temporally dependent. The highly significant main
effects supported this conclusion. Further, total N interaction between depth and time was not
consistently expressed. The drought conditions of 2007 were thought to have skewed the
interaction effect. With respect to total N temporal trends, total N increased in the Spring and
decreased the following Fall. The seasonal flux of total N impacted POM by lowering the
C:N ratio causing POM to decrease and was consistent with crop uptake. Total N also
displayed a trend of decreasing with depth. This trend was related to a strong spatial
correlation between total C and total N. Given the use of a no-till system in this study, total N
with depth was significantly stratified.
For PMN, several treatments had a positive spatial effect on the parameter in the 0-5
cm depth, however, the parameter also varied temporally. At this depth, the rye and rye/hairy
vetch treatments exhibited the most influence inclusive of both sites. The extra biomass
produced by the rye as compared to the other treatments allowed the rye or rye/hairy vetch
treatments to sequester larger volumes of N for future mineralization. Additionally, the
inclusion of hairy vetch and residual N from the top dress application helped to create a
favorable C:N ratio for quicker mineralization. For PMN, the trend at the fine-loamy site was

52
52
an overall decrease across sampling times in the top two depths. At the coarse-loamy site,
PMN oscillated up and down with sampling time in only the surface depth.
In total for POM, the results were contrary to expectations. Treatment temporal
effects on POM were only significant at the coarse-loamy site and they exhibited a
significant negative correlation for both depth and sampling time. The negative correlation
implied the input from the level of biomass returned to the soil system created a priming
effect on POM in soils with the most potential for organic matter oxidation. The greatest
increase in POM was seen immediately after introduction of the cover crop treatments. Here
after, the overall trend was a decline in POM indicating the critical mass of the ecosystem
had yet to be reached. With continued inputs of volumes of biomass in excess of the 6 Mg/ha
mark it is thought the negative correlation will reverse. The rye/hairy vetch treatment may be
displaying an early trend in this direction. Further, the general declining temporal trend was
in all depths except for the 0-5 cm depth at the coarse-loamy site implying the higher
biomass yielding treatments were beginning to have a positive effect.
The decline of both PMN and POM was the result of a moderate correlation between
the dependent variable PMN and POM where POM was negatively influenced by a priming
effect on the biomass inputs in a sub-tropical environment. This unexpected declining trend
for POM in a no-till system seen at both the coarse-loamy and fine-loamy sites indicates the
need for further study on ways to increase the POM levels.
As for CEC, the treatment effect on the parameter was similar to POM in that the
priming effect on POM also decreased CEC, however, this was only at the fine-loamy site.
The greatest influence was predominately exhibited by rye or a rye combination treatment.

53
53
The decline in CEC at the fine-loamy site was explained by a strong correlation between
CEC and POM. This correlation implies where soils are inherently low in carbon, a
significant portion of the CEC was the result of POM in the system. Given the association
between CEC and POM, this relationship indicated the need to consistently supply the
ecosystem with enough biomass to reach or exceed the system’s critical level, that is
>6Mg/ha beyond cash crop biomass inputs. Notably, there was a temporal increase in CEC at
two depths at the coarse-loamy site that were believed to be the result of more biomass inputs
as compared to the fine-loamy site. The additional biomass was able to transform to a soil
carbon pool that positively influenced CEC. Again it is thought with larger biomass inputs
over a longer period of time the CEC will reverse and begin to build, but the length of time
needed is unknown.
Overall for both the coarse-loamy and fine-loamy soil families with loamy
sand/sandy loam surface texture in a sub-tropical environment under a no-till system, there is
a need to increase total C and POM inputs to both the surface and internal depths of a soil
profile in order to maintain and then build the soil quality for crop production. Increases in
these two measures are necessary to positively enhance the level of the Db, total N, PMN and
CEC. Specific to POM, the parameter is essential to improving CEC, but POM levels are
difficult to sustain without large biomass inputs. Achieving a positive influence in these soils
without quality organic matter inputs, that is organic matter that is more resistant to
decomposition, has been proven to be difficult. This points to the need for additions of
organic matter inputs that have a greater recalcitrant potential; however, this will require

54
54
additional study. Additionally, adopting other management systems may be necessary for soil
quality improvements.

55
55
REFERENCES
Arshad, M.A., A.J. Franzluebbers, and R.H. Azooz. 1999. Components of surface soil structure under conventional and no-tillage in northwestern Canada. Soil & Tillage Research. 53: 41-47. Bauer, P.J. and D.W. Reeves. 1999. A comparison of winter cereal species and planting dates as residue cove for cotton grown and conservation tillage. Crop Sci. 39:1824-1830. Below, F.E. 2002. Nitrogen metabolism and crop productivity. In M. Pessarakli (Eds). Handbook of Plant and Crop Physiology. 2nd ed. (pp. 385-406). Marcel Dekker, New York. Bird, S.B., J.E. Herrick, M.M. Wander and S.F. Wright. 2002. Spatial heterogeneity of aggregate stability and soil carbon in semi-arid rangeland. Environmental Pollution. 116:445-455. Blake, G.R. 1965. Bulk density. In C.A. Black et al. (ed.) Methods of soil analysis, part 1. Agronomy 9:374-390. Am. Soc. Of Agron., Madison, Wis. Brock, W. 2005. Personal conversation. North Carolina NRCS Conservation Agronomist. Bruce, R.R., G.W. Langdale, L.T. West, and W.P. Miller. 1995. Surface soil degradation and soil productivity restoration and maintenance. Soil. Soil Sci. Soc. Am. J. 59: 654-660. Cambardella, C.A. and E.T. Elliott. 1992. Particulate soil organic matter changes across a grassland cultivation sequence. Soil. Soil Sci. Soc. Am. J. 56: 777-783. Cassel, D.K. 1983. Spatial and temporal variability of soil physical properties following tillage of Norfolk loamy sand. Soil Sci. Soc. Am. J. 47:196-201. da Silva, Alvaro Pires, A. Nadler, and B.D. Kay. 2001. Factors contributing to temporal stability in spatial patterns of water content in the tillage zone. Soil & Tillage Research. 58: 207-218. Franzluebbers, A.J. 2002a. Soil organic matter stratification ratio as an indicator of soil quality. Soil & Tillage Research. 66: 95-106. Franzluebbers, A.J. 2002b. Water infiltration and soil structure related to organic matter and its stratification with depth. Soil & Tillage Research. 66:197-205. Franzluebbers, A.J. B. Grose, L.L. Hendrix, P.K. Wilkerson and B.G. Brock. 2002. Surface-soil properties in response to silage intensity under no-tillage management in the Piedmont of North Carolina. IN E. van Santen (ed.) 2002. Making Conservation Tillage Conventional: Building a Future on 25 Years of Research. Proc. Of 25th Annual Southern Conservation Tillage Conference for Sustainable Agriculture. Auburn, Al 24-26 June 2002. Special Report no. 1. Alabama Agric. Expt. Stn. And Auburn University, Al 36849. USA. Franzluebbers, A.J., F.M. Hons, and D.A. Zuberer. 1994a. Long-term changes in soil carbon and nitrogen pools in wheat management systems. Soil. Soil Sci. Soc. Am. J. 58: 1639-1645. Franzluebbers, A.J., F.M. Hons and D.A. Zuberer. 1994b. Seasonal changes in soil microbial biomass and mineralizable C and N in wheat management systems. Soil Biol. Biochem. 26:1469-1475. Franzluebbers, A.J. and F.M. Hons. 1996. Soil-profile distribution of primary and secondary plant-available nutrients under conventional and no tillage. Soil & Tillage Research. 39: 229-239.

56
56
Gregorich, E.G. and H.H. Janzen. 1996. Storage of soil carbon in the light fraction and macroogranic matter. p. 167-190. In M.R. Carter and B.A. Stewart (ed.). Structure and organic matter storage in soils. Lewis Publ., CRC Press, Boca Raton, Fla. Hardy, D. 2008. Personal conversations. Hendrix, P.F., A.J. Franzluebbers, and D.V. McCracken. 1998. Management effects of C accumulation and loss in soils of the southern Appalachian Piedmont of Georgia. Soil & Tillage Research. 47: 245-251. Hunt, P.G., D.L. Karlen, T.A. Matheny, and V.L. Quisenberry. 1996. Changes in carbon content of a Norfolk loamy sand after 14 years of conservation or conventional tillage. J. Soil and Water Cons. 51: 255-258. Hussain, I., K.R. Olson, and S.A. Ebelhar. 1999. Long-term tillage effects on soil chemical properties and organic matter fractions. Soil. Soil Sci. Soc. Am. J. 63: 1335-1341. Kay, B.D. and A.J. VandenBygaart. 2002. Conservation tillage and depth stratification of porosity and soil organic matter. Soil & Tillage Research. 66: 107-118. Keeney, D.R. 1982. Nitrogen-availability indices. In Methods of Soil Analysis, Part 2. Chemical and Microbiological Properties. Agronomy Monograph no. 9. 2nd ed. ASA and SSSA, Madison, WI. Langdale, G.W., R.L. Wilson, Jr., and R.R. Bruce. 1990. Cropping frequencies to sustain long-term conservation tillage systems. Soil. Soil Sci. Soc. Am. J. 54: 193-198. Letey, J., R.E. Sojka, D.R. Upchurch, D.K. Cassel, K.R. Olson, W.A. Payne, S.E. Petrie, G.H. Price, R.J. Renginato, H.D. Scott,, P.J. Smethurst, and G.B. Triplett. 2003. Deficiencies in the soil quality concept and its application. Journal of Soil and Water Conservation. 58(4):180-187. Marriott, E.E. and M.M. Wander. 2006. Total and labile soil organic matter in organic and conventional farming systems. Soil Sci. Soc. Am. J. 70:950-959. Naderman, G. 2009. Personal Conversation. Naderman, G. 2004. Personal communication. Naderman, G., B.G. Brock, G.B. Reddy and C.W. Raczkowski. 2006. Long term no-tillage effects on soil carbon and soil density within the prime crop root zone. Project Report. NCDA&CS. http://www.ncagr.gov. NCDC. 2009. http://www7.ncdc.noaa.gov/CDO/cdodivisionalselect.cmd. Needelman, B.A., M.M. Wander, G.A. Bollero, C.W. Boast, G.K. Sims, and D.G. Bullock. 1999. Interaction of tillage and soil texture: Biologically active soil organic matter in Illinois. Soil. Soil Sci. Soc. Am. J. 63: 1326-1334. Nelson, D.W. and L.E. Sommers. 1982. Total carbon, organic carbon, and organic matter. P. 539-579. In A.L. Page et. al. (ed.) Methods of soil analysis. Part 2. 2nd ed. Agron. Momogr. 9. ASA and SSSA, Madison, WI. NRCS. 2008. RUSLE2 software.

57
57
Peet, Mary. 2001. Sustainable practices for vegetable production in the south-Cover crops and living mulches. Found at website: http://www.cals.ncsu.edu/sustainable/peet/cover/c02cover.html. Ranells, N.N. and M.G. Wagger. 1997. Winter annual grass-legume bicultures for efficient nitrogen management in no-till corn. Agriculture, Ecosystems and Environment. 65:23-32. Ranells, N.N. and M.G. Wagger. 1996. Nitrogen release from grass and legume cover crop monocultures and bicultures. Agron J. 88:777-782. Reeves, D.W. 1997. The role of soil organic matter in maintaining soil quality in continuous cropping systems. Soil & Tillage Research. 43: 131-167. Reeves, D.W. 1994. Cover crop rotations. p. 125-172. In J.L. Hatfield and B.A. Stewart (ed.) Crops residue management. Lewis Publ., Boca Raton, Fl. Regional Synopses. 2002. 2002 National Crop Residue Management Survey. Available from www.ctic.purdue.edu/Core4/CT/ctsurvey/2002/RegionalSynopsis.html. Accessed August 11, 2004. Sandor, J.A. and N.S. Eash. 1991. Significance of ancient agricultural soils for long-term agronomic studies and sustainable agricultural research. Agron. J. 83: 29-37. Sainju, U.M., H.H. Schomberg, B.P. Singh, W.F. Whitehead, P.G. Tillman, and S.L. Lachnicht-Weyers. 2007. Cover crop effect on soil carbon fractions under conservation tillage cotton. Soil & Tillage Research, doi:10.1016/j.still.2007.06.006. SAS Institute. 2003. SAS/STAT. Version 9.1. SAS Institute, Cary, NC. Snapp, S.S., S.M. Swinton, R. Labarta, D. Mutch, J.R. Black, R. Leep, J. Nyiraneza, and K. O’Neil. 2005. Evaluating cover crops for benefits, costs and performance within cropping system niches. Agron. J. 97:322-332. Soon, Y.K. and M.A. Arshad. 2004. Tillage and liming effects on crop and labile soil nitrogen in an acid soil. Soil & Tillage Research. Available at www.sciencedirect.com. Sustainable Agriculture Network. 1998. Managing cover crops profitably. 2nd. Sustainable Agriculture Network National Agricultural Library, Beltsville, MD. Villamil, M.B., G.A. Bollero, R.G. Darmondy, F.W. Simmons and D.G. Bullock. 2006. No-till corn/soybean systems including winter cover crops: effects on soil properties. Soil Sci. Soc. Am. J. 70:1936-1944. Wander, M.M. 2004. Soil organic matter fractions and their relevance to soil function. In:Magdoff F. Weil R. (eds) Advances in agroecology. CRC pp. 67-102. Wander, M.M. and G.A. Bollero. 1999. Soil quality assessment of tillage impacts in Illinois. Soil. Soil Sci. Soc. Am. J. 63: 961-971. Wagger, M.G. and H.P. Denton. 1992. Crop and tillage rotations: Grain yield, residue cover, and soil water. Soil. Soil Sci. Soc. Am. J. 56: 1233-1237.

58
58
Wagger, M.G. and H.P. Denton. 1989. Influence of cover crop and wheel traffic on soil physical properties in continuous no-till corn. Soil Sci. Soc. Am. J. 53:1206-1210. Waring, S.A. and J.M. Bremner. 1964. Ammonium production in soil under waterlogged conditions as an index of nitrogen availability. Nature (London). 201:951-952. Willson, T.C., E.A. Paul and R.R. Harwood. 2001. Biologically active soil organic matter fractions in sustainable cropping systems. Applied Soil Ecology. 16:63-76. Yang, X.M. and M.M. Wander. 1999. Tillage effects on soil organic carbon distribution and storage in a silt loam soil in Illinois. Soil & Tillage Research. 52:1-9.

59
59
UNIT 2: COVER CROP BIOMASS EFFECTS ON SOIL NITROGEN
Introduction
The use of conservation tillage cropping systems in the southeastern United States has
increased 94 percent in the past ten years to include 42.5 percent of all cropland (Regional
Synopsis, 2002). This increase in the use of reduced tillage has been made possible as a result
of farm bill requirements, herbicide resistant crops and an understanding of the benefits of
soil organic carbon (SOC). As shown by the literature, it is possible to enhance many of the
soil properties that improve production with additions of plant dry matter to the soil in
conjunction with long-term conservation tillage (Arshad et. al., 1999; da Silva et. al., 2001;
Franzluebbers and Hans, 1996; Soon and Arshad, 2004; Hunt et. al., 1996; Bruce et. al.,
1995). It has also been established that soil quality (i.e. the capacity of a specific kind of soil
to function, within natural or managed ecosystem boundaries, to sustain plant and animal
productivity, maintain or enhance water and air quality, and support human health and
habitation)(Letey et al., 2003) can be improved with the use of proper soil management
practices (Reeves, 1997; Sandor and Eash, 1991). Additionally, the residue that is returned to
the soil surface is considered to be vitally important for biological diversity, as an energy
source, and in substrates that are necessary for many soil functions (Franzluebbers, 2002a;
Wagger and Denton, 1992; Soon and Arshad, 2004; Franzluebbers et. al., 1994). Since there
is a correlation between residue inputs, reduced tillage and benefits to soil quality, two
questions that arise are: Will the inclusion of deep rooted cover crops and/or large quantities
of aboveground dry matter in a cropping system result in extensive improvements to a soil’s

60
60
managed and inherent properties throughout the effective rooting depth in 1 to 2 years? Or, is
this too short of a time period for any beneficial effects to occur to the chemical, physical and
biological properties in the soil’s effective rooting depth? This lack of a clear response to
these two questions provides an area of soil and crop management that needs further
exploration.
There are few deep rooting winter annual cover crops where the author defines deep
rooting as exceeding the deeper of the soils B-horizon or 60 cm. However, the literature
describes barley (Hordeum vulgare), alfalfa (Medicago sativa), blue lupine (Lupinus
angustifolius) and annual white sweetclover (Melilotus alba var. annua) as having either
deep rooting potential or aggressive taproot growth. When grown as an annual, barley was
reported to develop a deep fibrous root system that can reach as deep as 6.5 ft in USDA plant
hardiness zone 8 or warmer (Sustainable Agriculture Network, 1998). Alfalfa is known to be
deep-rooted and can act as a biological plow (Snapp et al., 2005). Narrow-leaf blue lupines
are known to be the most cold tolerant lupine species and have aggressive taproots capable of
fixing large quantities of N (Sustainable Agriculture Network, 1998). Annual white
sweetclover is known to loosen subsoil compaction although its taproot is shorter and more
slender than its biennial cousins.
As for species with large aboveground dry matter potential, a cover crop used in the
Southeast that yields large quantities of dry matter is rye (Secale cereale). Rye is considered
to be the hardiest winter cereal crop, can provide up to 11 Mg/ha (5 t/ac) of dry matter and
has a quick growing, fibrous root system (Sustainable Agriculture Network, 1998). Similarly,
barley is report to yield > 11 Mg/ha (5 t/ac) of dry matter. In addition to rye and barley,

61
61
wheat (Triticum aestivum), a cover crop used locally, and triticale (Triticale hexaploide
Lart.), a cross between wheat and rye, have potential to produce aboveground dry matter at
rates between 3 Mg/ha (1.5 t/ac) and 11 Mg/ha (5 t/ac) (Brock, 2005; Sustainable Agriculture
Network, 1998).
Combination cover crop species with potential to produce large amounts of biomass
are rye/hairy vetch (Vicia villiosa). Reeves (1994) described the combination as the standard
in the Southeast for N content and Brock (2005) suggested the combination could produce
large amounts of dry matter (i.e. 10 Mg/ha). In 1997, Ranells and Wagger reported rye/hairy
vetch aboveground dry matter accumulations of 3-5 Mg/ha following corn on a Norfolk soil.
Another combination that may have potential is rye/alfalfa although the documentation in the
literature is lacking. The dual benefit of large dry matter accumulations (i.e. rye) plus a deep
rooting potential (i.e. alfalfa) appears to offer the best approach for soil quality benefits.
Total Kjeldahl N (TKN) and potentially mineralizable nitrogen (PMN) are two soil
measurements that have shown a high correlation to additions of SOM (Franzluebbers et. al.,
1994). Total Kjeldahl N is important since it can show the cumulative total N stored in the
soil while PMN has been shown to increase with decreasing tillage and characterizes the
active pool of soil N available for crop production. Needleman et al. (1999) found the
concentration of PMN to be highly stratified with the effect of texture and tillage on PMN
being expressed in the 0 to 5 cm depth.
In cold, dry environments (i.e. temperate climates), the relatively slow rate of
decomposition of newly added crop residues in a no-tillage system has been proven to create
large stocks of SOM and to improve soil quality (Arshad et. al., 1999; Franzluebbers, 2002a).

62
62
However, in the humid, subtropical environment of the southeastern United States, the more
rapid rate of decomposition generated by the greater moisture and temperature levels make it
difficult to maintain SOC levels, unless at least 12 Mg/ha/yr (5 t/ac/yr) of total dry matter
(i.e. crop residues plus cover crop residues) are returned to the soil surface each year (Bruce
et. al., 1995)). Therefore, a reasonable amount of dry matter must be returned to the soil
surface to decompose and become part of the SOC pool. As indicated by the literature,
additions of SOC will increase fertility, water holding capacity, structure and porosity of the
soil when compared to a conventional tillage system (Bruce et. al., 1995; Hendrix et. al.,
1998; Langdale et. al., 1990; Hunt et. al., 1996). Additionally, Franzluebbers (2002a)
indicated that conservation tillage systems in areas with low native SOM (i.e. humid,
subtropical environments) might show the greatest improvement compared with conventional
tillage.
While SOC additions to the soil through decaying dry matter on the surface and root
matter subsurface can make measurable improvements to a soil in the humid, subtropical
southeastern U.S., the dynamics of biomass on total N and PMN in the 0-5, 5-10, and 10-18
cm depths in a production system that uses deep rooted cover crops and/or additions of
organic matter from mature cover crops (i.e. cover crops allowed to reach soft dough stage
for cereals or early bloom for legumes) at rates >6 Mg/ha/yr (3 t/ac) are unknown. The dry
matter value >6 Mg/ha/yr is derived from the average difference between 12 Mg/ha/yr
(Bruce et. al., 1995) and either total aboveground biomass at maximum canopy from
southern upland cotton-4 Mg/ha/yr or corn for grain-7 Mg/ha/yr (NRCS, 2008).

63
63
The objectives of this research will be to determine what effects biomass from rye,
barley, alfalfa, wheat, triticale, annual white sweetclover, blue lupine, rye/hairy vetch and
rye/alfalfa have on the following parameters: total N and PMN after two (2) years of seeding
in a no-till system.

64
64
Materials and Methods
Sites Utilized
Two “well drained” sites in the Coastal Plain region of North Carolina that are in the
family particle size class “coarse-loamy” or “fine-loamy” were selected. Site one, hereafter
referred to as the coarse-loamy, has a soil series name of Butters (coarse-loamy, siliceous,
semiactive, thermic Typic Paleudults; 35o 2’ 0.5” N, 78o 1’ 45.5” W). Site two, hereafter
referred to as the fine-loamy site, has a soil series name of Thursa (fine-loamy, kaolinitic,
thermic Typic Kandiudults; 35o 10’ 19.7” N, 78o 9’ 25.5” W). A USDA-NRCS soil scientist
conducted a soils description using the bucket auger observation method to define the soils at
each site. Pedon descriptions for both the Butters and Thursa soil types are in Appendix A.
Particle size analysis was conducted at depth intervals 0-5, 5-10 and 10-18 cm in
addition to the bucker auger observation method at both sites. Samples were collected from a
location near the center of each site and mailed to Waters Agricultural Laboratories, Inc, in
Camilla, GA. for analysis. Soil textures for the three depths at each site are a loamy sand and
sandy loam for the coarse-loamy and fine-loamy sites, respectively (Table 1). Particle size
analysis from the fine-loamy site shows its percent clay to be 2-3.5 times larger than the
coarse-loamy site while the percent silt contents between the two sites were similar.

65
65
Table 1. Soil texture and particle size per site and depth interval Site Depth Texture % Sand % Clay % Silt
0-5 cm Loamy Sand 84.0 2.4 13.6 5-10 cm Loamy Sand 83.6 4.4 12.0
Coarse-loamy
10-18 cm Loamy Sand 85.6 2.4 12.0 0-5 cm Sandy Loam 77.2 8.4 14.4 5-10 cm Sandy Loam 78.8 8.4 12.8
Fine-loamy
10-18 cm Sandy Loam 80.8 6.4 12.8
Site Cropping System Management
The coarse-loamy site was managed under a no-till system from before 2004 through
2008. In years 2004 through 2007, the cropping system was continuous cotton; while for
2008, the crop was switched to full season soybeans. For each year and crop, the N rate, N
application month and N source are found in Table 2.
Table 2. N rate, N application month, and N source per crop and year at the coarse-loamy site. Crop Year N rate1 N application month N source Cotton ‘04-‘07 10-17/74 (9-15/66.5) April and June (NH4)2SO4
Soybeans ‘08 N/A N/A N/A 1Planting/Layby N rate in kg/ha (lbs/ac)
The fine-loamy site was also managed under a no-till system from before 2004
through 2008. In 2004, the site was ripped using a DMI no-till ripper with berm tuckers.
Continuous cotton was grown in crop years 2004 through 2007, while in 2008 corn was
grown. Each winter, a rye cover crop was seeded after harvest of the cotton crop at a rate of
~1.7 kg/ha (1.5 bu/ac). The cover crop was allowed to reach a Feekes’ growth stage of ~ 9.0

66
66
before termination. Table 3 contains the N rate, N application month and N source for each
year and crop.
Table 3. N rate, N application month, and N source per crop and year at the fine-loamy site. Crop Year N rate1 N application month N source
Cotton ‘04-‘07 28/73 (25/65) April and June (NH4)2SO4
Corn ‘08 28/140 (25/125) April and June (NH4)2SO4 1Planting/Layby N rate in kg/ha (lbs/ac)
Cover Crop Treatments
Both the coarse-loamy and fine-loamy sites were planted to seven different winter
cover crop cultivar treatments and two combination treatments in a randomized complete
block design with three replications per site during calendar years 2006 and 2007. The
following cultivars were planted individually: rye (Secale cereale), barley (Hordeum
vulgare), alfalfa (Medicago sativa), wheat (Triticum aestivum), triticale (Triticale hexaploide
Lart.), annual white sweetclover (Melilotus alba var. annua), and blue lupine (Lupinus
angustifolius). The combination treatments were rye/hairy vetch (Secale cereale/Vicia
villiosa) and alfalfa/rye (Medicago sativa/Secale cereale). The actual cultivars used for each
treatment are listed in Table 4.
Each cultivar was seeded with a Marliss 1412 no-till grain drill equipped with a small
seed box. Seeding of all cover crop treatments were into the previous crop residue directly
after harvest at the rates contained in Table 4.

67
67
Table 4. List of treatments, cultivars, percent germination (germ), percent pure seed (PS), and seeding rate for each treatment. Treatment
Cultivar
% Germ
% PS
Seeding rate-drilled kg/ha (lbs/ac)
Seeding rate-aerial kg/ha (lbs/ac)4
Medicago sativa Forage Queen 80 99.7 11 (10)1
56.1 (50) Hordeum vulgare Price 72 98 108 (96) N/A Lupinus angustifolius Tifblue 85 98 135 (120) N/A Secale cereale Wheeler 90 99.7 126 (112)1 N/A Melilotus alba var. annua Hubam 72 98 17 (15) 56 (50)
Triticale hexaploide Lart Trical 498 85 99 112 (100) N/A Vicia villiosa2 Hairy vetch 85 99.4 28 (25) 56 (50) Triticum aestivum Pioneer 26R15
(SS 520)3 92 99 135 (120) N/A
1Rate when used in combination treatments rye/alfalfa or rye/hairy vetch was 6 (5) or 84 (75), respectively. 2Treatment only used in combination with rye. 3Cultivar was used only at the fine-loamy site in 2007. 4Aerially seed was only done in 2007.
Seeding depths for the small seeded cover crops were in the range of 0.3-0.6 cm
(0.125-0.25 in) and for the large seeded cover crops in the range of 1.3-1.9 cm (0.5-0.75 in).
For the legume cover crop species, an appropriate inoculant was applied to the seed at the
rate recommended by the directions on the bag of inoculants. To ensure seed to inoculants
contact, the seed and the inoculants were thoroughly hand mixed in a bucket before seeding.
Seeding dates for all treatments in calendar year 2006 were 14 November and 7
December for the coarse-loamy and fine-loamy sites, respectively. In calendar year 2007, the
small seeded cover crop treatments (e.g. alfalfa, sweet clover, and hairy vetch) were aerially
seeded with a hand seeder on 3 October 2007 at both sites. The aerial seeding was followed
with the no-till drilling of all treatments on 29 October and 13 November at the fine-loamy
site and coarse-loamy site, respectively. This no-till drill seeding in October and November

68
68
2007 was into both the existing residue and emergent aerially small seeded cover crops from
the 3 October seeding.
In February of 2006 and 2007, each of the plots containing a cereal grain were top
dressed with an inorganic nitrogen source at a rate of ~38 kg N/ha (34 lbs N/ac). A 34% urea
with limestone pellets was used. The urea was applied using a hand broadcast spreader. Two
passes were made for each plot to ensure proper application rates and uniform coverage. Top
dress application dates for both sites were 19 February 2007 and 28 January 2008.
Sampling Procedures
Prior to seeding the 2006 fall cover crop, a pre-cover crop set of soil cores was
collected from row middles on all 27 plots at both sites as a reference point for changes in the
selected assays. Following the collection of the reference set of soil cores, four additional sets
of soil cores were taken over a two-year period. Each year, two sets of cores were collected
from all 27 plots at both sites during the spring prior to planting of the cash crop and at
planting of the cover crop in the fall. Soil cores were collected from depth intervals of 0-5, 5-
10, 10-18 cm (0-2, 2-4, 4-7 in) within all plots at all sites.
Sampling from row middles that were part of the field’s normal traffic pattern was
avoided. Field equipment widths and noticeable patterns were noted to define the trafficked
middles and to determine the initial row middle for sampling. Once the initial row middle
had been determined, subsequent sampling sites within each plot progressed down the same
row middle for each plot.
69
69
For each plot and collection depth, a 9 cm (3.5 in) diameter soil core was taken from
each depth. Each soil cores was carefully extracted using a small masonry trowel and/or
shovel depending on depth. The soil cores were extracted, independently placed into a small
plastic bucket, hand mixed, and placed into a 1 L (1 qt) Ziploc freezer bag. All samples were
taken within a two-week period for a given site.
Soil cores placed into the 1 L (1qt) Ziploc freezer bags were further subdivided for
future analysis. Approximately one 78 ml sub-sample was pulled from each bag and placed
into an individual sampling tin while the remainder of each sample was stored in a cooler at
5°C until prepared for further analysis.
Soil Properties Analyzed
Total N was determined by the dry combustion method as described by Nelson and
Sommers (1982) through the use of a Perkin-Elmer 2400 CHN Elemental Analyzer. This
instrument automatically measures N using the principles employed in the traditional Pregl
and Dumas procedures. The 78 ml sub-samples pulled from the 1 L (1 qt) Ziploc bags were
used for this analysis. The samples were first oven dried at 105°C for 24 hr. Once dry, the
samples were hand ground using a mortise and pestle, and sieved with a 100-mesh U.S.
Standard Series Sieve. The soil material that passed the 100-mesh sieve was returned to the
sampling tin, capped and delivered to the North Carolina State University Analytical
Services Lab where the dry combustion method was conducted.
Waters Agricultural Laboratories, Inc, in Camilla, GA conducted PMN analysis on
the remaining soil in each of the 1 L (1 qt) Ziploc freezer bags. The PMN analysis followed a

70
70
method described by Waring and Bremner (1964) and Keeney (1982) using anaerobic
incubation as adapted by Waters Agricultural Laboratories, Inc, in “Soil Ammonium
Nitrogen KCL Extraction/Exchangeable Ammonium” (Appendix B). A field-moist sample (6
g) was placed in a 50 mL centrifuge tube, saturated with 10 mL of deionized water, and
incubated at 40°C for 7 d. Then, 25 mL of 2.0 N KCl extraction reagent was added using a
repipette dispenser. A method blank was included at this point. The extraction vessel(s) were
placed on a reciprocating mechanical shaker for 30 min. The extract was then filtered. If the
filtrate was cloudy the extract was re-filtered. The NH4+-N content of the extract as well as
the method blank and an unknown sample was determined using a FIALab-2500 flow
injection analyzer using the salicylate method for ammonia assay (Appendix C). The same
procedure was also conducted on non-incubated samples. PMN was determined as the
difference between the ammonium recovered between the incubated and non-incubated
samples.
Biomass Measurements
Above ground biomass was sampled during the spring of 2007 and 2008 before the
cover crop was terminated and prior to planting the cash crop. The actual collections dates
were 4 May for both sites in 2007 and in 2008, 15 April and 5 May for the fine-loamy and
coarse-loamy sites, respectively. Two 1-ft2 sections of biomass were randomly collected
from within all 27 plots at each site and placed individually into either a large paper lunch
bag or grocery bag depending on the volume of the undried sample. Each sample plus bag
were oven dried at 112°F until the mass stabilized for a 24 hours period (usually 2 to 5 days).

71
71
The dried samples plus bag were immediately weighted upon removing from the oven. A
comparable empty bag weight was obtained. The difference between the dried sample plus
bag and the bag was taken as the dry matter mass for each random subsection. Dry matter
mass was multiplied by 43,560 to get lbs/ac (Peet, 2001) then converted to kg/ha using a
multiplication factor of 1.12.
Statistical Analysis
After collection and analysis, statistical analysis was conducted on the selected soil
properties using a randomized complete block split plot design model (RCBSPD):
Yijkx = µijx + Rx + (SR)ikx + Eijkx
where i denotes level of treatment, j denotes levels of sampling time, k denotes levels of
depth, x denotes block, Rx ~ N(0, σr2) and (SR)ikx ~ N(0, σsr
2). Factors depth and sampling
time were considered repeated measures while block and block*treatment interaction were
treated as random variables. Also, all random errors are mutually independent. The preceding
model was tested through the PROC GLIMMIX procedure in SAS (SAS, 2003) using the
Satherthwaite adjustment for calculating the denominator degrees of freedom. Appendix E
contains the respective ANOVA tables for each site.
Statistical analysis was conducted on the biomass samples using a randomized
complete block model (RCB):
Yik = µ + αi + Ek(i)
where i denotes level of treatment and Ek(i) ~ N(0, σ2). The PROC GLM procedure in SAS
(SAS, 2003) was used for the RCB model and for pairwise comparisons within a given year.

72
72
The RCB model to determine significance between years was tested using the PROC
MIXED procedure in SAS (SAS, 2003) with the Satherthwaite adjustment for calculating the
denominator degrees of freedom. Factors block and block*treatment interaction were treated
as random variables. Appendix E contains the respective ANOVA tables for each site.
Pearson’s correlation coefficients (rxy) were determined on selected assay results
using PROC CORR while regression was determined using PROC REG procedures in SAS
(SAS, 2003). Correlation coefficients were interpreted using the following general scale:
+0.25=weak, +0.5=moderate, +0.75=strong.

73
73
Results and Discussion
Biomass Differences in treatment biomass yield within a site year were highly significant
(Table 5). At the coarse-loamy site the lupine treatment achieved the greatest biomass yield
for both years. In year 2007, lupine was not significantly different than rye or rye/hairy vetch
while in year 2008 lupine was significantly different from all treatments. The rye/hairy vetch
treatment had the next highest biomass yield in 2008, however, it was similar to four other
treatments.
Table 5. Mean biomass yield (kg/ha) for each treatment, year, and site. Coarse-loamy Fine-loamy
Treatment 20071 20081 20071 20081 Alfalfa 377(+407)x d 1364(+548) d 736(+454) abc 1328(+732) b Barley 1521(+413) cd 5616(+1682) bc 736(+185) abc 1489(+315) b Lupine 5613(+2841) a 18481(+4310) a † † Rye 4764(+2138) ab 7841(+3341) bc 1400(+527) a 4324(+1192) a Rye/Alfalfa 2243(+1144) cd 6746(+1289) bc 1220(+383) a 4163(+1210) a Rye/Hairy Vetch 3409(+879) abc 8720(+2075) b 1364(+600) a 4378(+855) a Sweetclover 1041(+876) cd 1130(+619) d 431(+544) bc 700(+418) b Triticale 1920(+640) cd 7410(+2298) bc 1130(+435) ab 4199(+1254) a Wheat 1597(+284) cd 4324(+493) cd 754(152) abc 1023(495) b
1 Means with the same letter per year and site are not significantly different at P<0.05 using the Tukey pairwise comparison method. X Value in the parenthesis is the standard deviation of the mean. † Plots were lost due to wildlife degradation.
At the fine-loamy site, the treatment biomass yields were considerably less than those
of the coarse-loamy site. This difference was due to excessive grazing pressure from a large
whitetail deer (Odocoileus virginianus) population and sampling date, especially in 2008.
Notably, the succulence of lupine made it a prime target of the whitetail deer population so

74
74
much so that all plots for both years were destroyed. As for sampling date in 2008, the
collection of the biomass corresponded with the termination of the cover crops by the
participating producer. This cover termination timing represents a typical field management
plan necessary for seeding of the cash crop; unfortunately, this termination limited the
biomass yield potential for each treatment at the fine-loamy site. Of the remaining treatments
at the fine-loamy site, the rye or rye combinations produced the greatest biomass yields
regardless of the year. The rye or rye combinations were significantly different than
sweetclover in 2007 and wheat, sweetclover, barley, and alfalfa in 2008. In year 2008, the
triticale treatment was also significantly different than wheat, sweetclover, barley, and alfalfa
treatments but in 2007 triticale was not dissimilar to any other treatment.
Overall, the maximum mean biomass yield (i.e. 2008 mean at the coarse-loamy site)
for rye exceeded winter cover crop biomass reported by Brock (2005) (1350-7763 kg/ha)
regardless of planting date; treatments barley, rye/hairy vetch, triticale and wheat were all
less but within a highly variable range, 5382-7031 kg/ha, 2655-9900 kg/ha, 2813-9056 kg/ha,
and 200-6368 kg/ha, respectively. Minimum biomass yields for the same five treatments
exceeded the minimums reported by Brock (2005) for rye and wheat but not for barley,
rye/hairy vetch or triticale. The rye biomass yields measured had a broader range than
reported by Sainju et al. (2007), Ranells and Wagger (1996), or Bauer and Reeves (1999) for
two planting dates; while the rye combination produced a similar maximum but a lower
minimum than the rye blend reported by Sainju et al. (2007). Additionally, wheat biomass
yields overall exceeded the low and the maximum means reported by Bauer and Reeves
(1999).

75
75
Analysis of biomass yield treatment*year interaction for each site was highly
significant (Appendix E). This significance is indicative of the importance of seeding date
and yearly variability to the quantity of biomass produced. For the fine-loamy site, the
average increase in the biomass produced by seeding in October as opposed to December
yielded a 250% mean increase in the biomass volume produced from 2007 to 2008 within a
range of 140 to 370%. At the coarse-loamy site, a 280% mean increase was recorded from
2007 to 2008 with similar planting dates. The range of increase at the coarse-loamy site was
110% to 390%. This increase was a function of the unpredictable yearly variation between
growing seasons. A similar effect was reported by Ranells and Wagger (1996).
Despite the variability between years and sites, the treatment that more often yielded
the most biomass was rye followed closely by rye/hairy vetch although they were not always
significantly different from other treatments. While the biomass in these two treatments did
not consistently exceed the goal of >6 Mg/ha, the yields were within the expected biomass
yield range for rye as presented by the Sustainable Agriculture Network (1998). Treatments
that expressed potential but need more research are lupine. The biomass produced by lupine
was 220% greater than the next highest treatment. This combined with the low mean being in
the range of rye make lupine a desirable cover crop treatment for future research. Lastly, the
interaction within the rye/alfalfa combination appears to be antagonistic. Although
significance was only noted in 2007 at the coarse-loamy site, the rye/alfalfa combination
consistently underperformed the rye or rye/hairy vetch treatments. This apparent decrease in
biomass yield from the combination may be the result of attenuation of nutrients quicker by

76
76
alfalfa than by rye. This observation is based on the alfalfa roots system occupying a much
larger soil volume than rye (Appendix D).
Cover Crop Biomass on Total Soil Nitrogen
The relationship between total soil N and biomass resulted in several significant
correlations (Table 6). Overall the rxy indicated a positive relationship between increasing
biomass and increasing total N (Table 6; Figure 1 and 2). Of the significant coefficients, the
level of rxy was moderate at best indicating a large degree of variability between the two
factors. This variability was supported by significant depth and sampling time main effect for
total N (West, 2010). Relative to the rxy data, the 2008 sampling time had greater values and
the range was narrower than the 2007 sampling time. Across depth, the rxy increased with
depth in 2007 while in 2008 the rxy decreased with depth. The variation that occurred during
the transition between sampling times on rxy with depth between 2007 and 2008 was mostly
attributed to the increase in biomass in 2008 (Table 5) combined with the effect of the
drought condition experienced in 2007 (NCDC, 2009) not flushing N from the lower soil
Table 6. Significant correlation coefficients between biomass (kg/ha) and total N (g/kg)
Sampling time Depth (cm) p-value rxy Spring 2007 5-10 0.049 0.2705 Spring 2007 10-18 0.0004 0.4645
Fall 2007 10-18 0.0095 0.3497 Spring 2008 0-5 <0.0001 0.5893 Spring 2008 5-10 <0.0001 0.5061 Spring 2008 10-18 0.0003 0.4756

77
77
Figure 1. Relationship between biomass (kg/ha) and total N (g/kg) for Spring and Fall 2007 sampling times. Note: Spg 72 = Spring 2007, depth 5-10 cm; Spg 73 = Spring 2007, depth 10-18 cm; Fall 73 = Fall 2007, depth 10-18 cm.
Figure 2. Relationship between biomass (kg/ha) and total N (g/kg) for Spring 2008 sampling time. Note: Spg 81 = Spring 2008, depth 0-5 cm; Spg 82 = Spring 2008, depth 5-10 cm; Spg 83 = Spring 2008, depth 10-18 cm.
R² = 0.07319 (Spg 72) R² = 0.21588 (Spg 73) R² = 0.12227 (Fall 73)
0.00
0.50
1.00
1.50
2.00
2.50
0 5000 10000 15000 20000 25000
Tota
l N (g
/kg)
Biomass (kg/ha)
R² = 0.34726 (Spg 81)
R² = 0.25618 (Spg 82)
R² = 0.22617 (Spg 83)
0.00
0.50
1.00
1.50
2.00
2.50
0 5000 10000 15000 20000 25000
Tota
l N (g
/kg)
Biomass (kg/ha)

78
78
depths measured. For the 2007 sampling time, the significant correlations were primarily in
the spring and at depths 5-10 and 10-18 cm. The importance of the spring response is best
viewed as a comparison to the lack of significance of most of the fall samplings. The biomass
in the spring of the year reached its maximum quantity when total soil N was at a higher level
than in the fall of the year as opposed to the fall of the year when much of the biomass has
oxidized, the normal warm-season cropping system was completed, and total soil N levels
are traditionally low. Across both sampling times, there appears to be a compounding effect.
Analysis of depths 5-10 and 10-18 cm for both spring seasons reveal an increase for both
respective depths from the 2007 sampling time to the 2008 sampling time. This increase with
time is mostly attributed to the improved biomass yield in 2008 since there is no evidence of
a carry over effect from the treatment’s biomass from season to season (unpublished data
from West, 2010).
Biomass on Potentially Mineralizable Nitrogen
There were no significant rxy relationships between PMN and biomass for either the
2007 or 2008 sampling times.

79
79
Conclusions
Overall, the treatments that more often produced the most aboveground biomass were
rye or a rye/hairy vetch although they were no always significantly larger than other
treatments. Neither rye nor rye/hairy vetch consistently exceeded the goal of supplying an
additional >6 Mg biomass per acre. Biomass yield was a function of several factors including
seeding date and growing days as well as the extraneous influence of climate and predation.
Of these factors, seeding date was of primary concern where seeding in late October through
early November was best. Secondarily, when the objective is to maximize biomass yield,
delaying termination of a cover crop until May was advantageous. With respect to the lupine
treatment, that produced the maximum biomass yield, its application should be selected
carefully to counter the affects of predation.
Relative to treatment biomass correlation to total N, there was a moderate, positive
relationship between increasing biomass to increasing total N. This relationship was
primarily seen in the depth of 5-10 and 10-18 cm where total C was traditionally lower in a
no-till system and consequently immobilization of N was lower. Further, there was a
compounding effect with time that indicates one of the benefits of continued inputs of
biomass to a no-till ecosystem. In total, the relationship of increasing total N with increasing
biomass support ecosystem benefits from greater quantities of biomass applied on the overall
fertility for sustainable production systems.

80
80
REFERENCES
Arshad, M.A., A.J. Franzluebbers, R.H. Azooz. 1999. Components of surface soil structure under conventional and no-tillage in northwestern Canada. Soil & Tillage Research. 53: 41-47. Bauer, P.J. and D.W. Reeves. 1999. A comparison of winter cereal species and planting dates as residue cove for cotton grown and conservation tillage. Crop Sci. 39:1824-1830. Brock, W. 2005. Personal conversation. North Carolina NRCS Conservation Agronomist. Bruce, R.R., G.W. Langdale, L.T. West, W.P. Miller. 1995. Surface soil degradation and soil productivity restoration and maintenance. Soil. Soil Sci. Soc. Am. J. 59: 654-660. da Silva, Alvaro Pires, A. Nadler, B.D. Kay. 2001. Factors contributing to temporal stability in spatial patterns of water content in the tillage zone. Soil & Tillage Research. 58: 207-218. Franzluebbers, A.J. 2002a. Soil organic matter stratification ratio as an indicator of soil quality. Soil & Tillage Research. 66: 95-106. Franzluebbers, A.J., F.M. Hons, and D.A. Zuberer. 1994. Long-term changes in soil carbon and nitrogen pools in wheat management systems. Soil. Soil Sci. Soc. Am. J. 58: 1639-1645. Franzluebbers, A.J., F.M. Hons. 1996. Soil-profile distribution of primary and secondary plant-available nutrients under conventional and no tillage. Soil & Tillage Research. 39: 229-239. Hendrix, P.F., A.J. Franzluebbers, D.V. McCracken. 1998. Management effects of C accumulation and loss in soils of the southern Appalachian Piedmont of Georgia. Soil & Tillage Research. 47: 245-251. Hunt, P.G., D.L. Karlen, T.A. Matheny, V.L. Quisenberry. 1996. Changes in carbon content of a Norfolk loamy sand after 14 years of conservation or conventional tillage. J. Soil and Water Cons. 51: 255-258. Keeney, D.R. 1982. Nitrogen-availability indices. In Methods of Soil Analysis, Part 2. Chemical and Microbiological Properties. Agronomy Monograph no. 9. 2nd ed. ASA and SSSA, Madison, WI. Langdale, G.W., R.L. Wilson, Jr., R.R. Bruce. 1990. Cropping frequencies to sustain long-term conservation tillage systems. Soil. Soil Sci. Soc. Am. J. 54: 193-198. Letey, J., R.E. Sojka, D.R. Upchurch, D.K. Cassel, K.R. Olson, W.A. Payne, S.E. Petrie, G.H. Price, R.J. Renginato, H.D. Scott,, P.J. Smethurst, and G.B. Triplett. 2003. Deficiencies in the soil quality concept and its application. Journal of Soil and Water Conservation. 58(4):180-187. NCDC. 2009. http://www7.ncdc.noaa.gov/CDO/cdodivisionalselect.cmd. Needelman, B.A., M.M. Wander, G.A. Bollero, C.W. Boast, G.K. Sims, D.G. Bullock. 1999. Interaction of tillage and soil texture: Biologically active soil organic matter in Illinois. Soil. Soil Sci. Soc. Am. J. 63: 1326-1334. Nelson, D.W., L.E. Sommers. 1982. Total carbon, organic carbon, and organic matter. P. 539-579. In A.L. Page et. al. (ed.) Methods of soil analysis. Part 2. 2nd ed. Agron. Momogr. 9. ASA and SSSA, Madison, WI.

81
81
NRCS. 2008. RUSLE2 software. Peet, Mary. 2001. Sustainable practices for vegetable production in the south-Cover crops and living mulches. Found at website: http://www.cals.ncsu.edu/sustainable/peet/cover/c02cover.html. Ranells, N.N. and M.G. Wagger. 1997. Winter annual grass-legume bicultures for efficient nitrogen management in no-till corn. Agriculture, Ecosystems and Environment. 65:23-32. Ranells, N.N. and M.G. Wagger. 1996. Nitrogen release from grass and legume cover crop monocultures and bicultures. Agron J. 88:777-782. Reeves, D.W. 1997. The role of soil organic matter in maintaining soil quality in continuous cropping systems. Soil & Tillage Research. 43: 131-167. Reeves, D.W. 1994. Cover crop rotations. p. 125-172. In J.L. Hatfield and B.A. Stewart (ed.) Crops residue management. Lewis Publ., Boca Raton, Fl. Regional Synopses. 2002. 2002 National Crop Residue Management Survey. Available from www.ctic.purdue.edu/Core4/CT/ctsurvey/2002/RegionalSynopsis.html. Accessed August 11, 2004. Sandor, J.A., N.S. Eash. 1991. Significance of ancient agricultural soils for long-term agronomic studies and sustainable agricultural research. Agron. J. 83: 29-37. Sainju, U.M., H.H. Schomberg, B.P. Singh, W.F. Whitehead, P.G. Tillman, and S.L. Lachnicht-Weyers. 2007. Cover crop effect on soil carbon fractions under conservation tillage cotton. Soil & Tillage Research, doi:10.1016/j.still.2007.06.006. SAS Institute. 2003. SAS/STAT. Version 9.1. SAS Institute, Cary, NC. Snapp, S.S., S.M. Swinton, R. Labarta, D. Mutch, J.R. Black, R. Leep, J. Nyiraneza, and K. O’Neil. 2005. Evaluating cover crops for benefits, costs and performance within cropping system niches. Agron. J. 97:322-332. Soon, Y.K. and M.A. Arshad. 2004. Tillage and liming effects on crop and labile soil nitrogen in an acid soil. Soil & Tillage Research. Available at www.sciencedirect.com. Sustainable Agriculture Network. 1998. Managing cover crops profitably. 2nd. Sustainable Agriculture Network National Agricultural Library, Beltsville, MD. Wagger, M.G., H.P. Denton. 1992. Crop and tillage rotations: Grain yield, residue cover, and soil water. Soil. Soil Sci. Soc. Am. J. 56: 1233-1237. Waring, S.A., J.M. Bremner. 1964. Ammonium production in soil under waterlogged conditions as an index of nitrogen availability. Nature (London). 201:951-952. West, E.W. 2010. Unpublished data.

82
82
APPENDICES

83
83
APPENDIX A
03/12/2008 Rev. 03/13/2008 Butters pedon description (an inclusion in a map unit of 6B-Autryville fine sand, 0-6% slopes) Observation method: bucket auger Latitude/Longitude: 35 degrees, 2 minutes, 0.5 seconds North; 78 degrees, 1 minute, 45.5 seconds West Datum: NAD83 Depth Class: Very deep Drainage Class (Agricultural): Well drained Internal Free Water Occurrence: Deep and very deep, transitory Flooding Frequency and Duration: None Ponding Frequency and Duration: None Index Surface Runoff: Negligible to low Permeability: Moderate or moderately rapid MLRA: 133A-Southern Coastal Plain Landscape: Middle Coastal Plain Landform: Flat Geomorphic Component: Dip Parent Material: loamy Coastal Plain sediments Taxonomic Class: coarse-loamy, siliceous, semiactive, thermic Typic Paleudults Ap=0 to 12 inches (0 to 30.5 cm); grayish brown (10YR 5/2) crushed, loamy sand; weak medium granular structure; very friable, nonsticky, nonplastic; few fine roots throughout and few medium roots throughout; clear boundary. E=12 to 15 inches (30.5 to 38.1 cm ); light yellowish brown (10YR 6/4) crushed, loamy sand; weak medium granular structure; very friable, nonsticky, nonplastic; few fine roots throughout; clear boundary. Bt1=15 to 23 inches (38.1 to 58.4 cm); strong brown (7.5YR 5/6) broken face, sandy clay loam; weak medium subangular blocky structure; friable, slightly sticky, slightly plastic; few very fine roots throughout; common fine irregular pores; 5% faint faint clay films on ped faces; gradual boundary. Bt2=23 to 35 inches (58.4 to 88.9 cm); yellowish brown (10YR 5/8) broken face, sandy loam; weak medium subangular blocky structure; friable, slightly sticky, nonplastic; few very

84
84
fine roots throughout; common fine irregular pores; 5% faint clay bridging between sand grains; clear boundary. E'=35 to 41 inches (88.9 to 104.1 cm); brownish yellow (10YR 6/6) crushed, loamy sand; weak medium granular structure; very friable, nonsticky, nonplastic; many fine interstitial pores; clear boundary. B't=41 to 50 inches (104.1 to 127 cm); yellowish brown (10YR 5/8) broken face, sandy loam; 2% lenses of loamy sand;; moderate medium granular structure; very friable, nonsticky, nonplastic; common fine irregular pores; 5% clay bridging between sand grains; clear boundary. E'’=50 to 56 inches (127 to 142.2 cm); brownish yellow (10YR 6/6) crushed, sand; single grain; loose, nonsticky, nonplastic; many fine interstitial pores; clear boundary. B'’t=56 to 59 inches (142.2 to 149.9 cm); brownish yellow (10YR 6/8) broken face, sandy loam; weak medium subangular blocky structure; friable, nonsticky, nonplastic; common fine irregular pores; 5% clay bridging between sand grains; gradual boundary. Btg=59 tp 63 inches (149.9 to 160.2 cm); light brownish gray(10YR 6/2) broken face, sandy clay loam; weak coarse subangular blocky structure; friable, slightly sticky, slightly plastic; few fine irregular pores; 5% faint clay films on faces of peds; 5% fine prominent brownish yellow (10YR 6/6) and 10% coarse prominent yellowish brown (10YR 5/8) masses of oxidized iron surrounding the matrix.

85
85
03/12/2008 Rev. 03/13/2008 Thursa pedon description (an inclusion in a boundary between map unit of 55B-Lucy sand, 0-6% slopes and 65A- Norfolk-Noboco complex, 0-2% slopes) Observation method: bucket auger Latitude/ Longitude: 35 degrees, 10 minutes, 19.7 seconds North; 78 degree, 9 minutes, 25.5 seconds West NAD 83 Datum Depth Class: Very deep Drainage Class (Agricultural): Well drained Internal Free Water Occurrence: Very deep Flooding Frequency and Duration: None Ponding Frequency and Duration: None Index Surface Runoff: Low Permeability: Moderate (Saturated Hydraulic Conductivity: Moderately high) Shrink-Swell Potential: Low MLRA: 133A Southern Coastal Plain Landscape: Middle Coastal Plain Landform: Flat Geomorphic component: Talf Slope: 0.5 percent Parent material: loamy Coastal Plain sediments Seasonal High Water Table: > 6 feet Taxonomic class: Fine-loamy, kaolinitic, thermic Typic Kandiudults Ap=0 to 10 inches (0 to 25.4 cm); brown (10YR 5/3) crushed, loamy fine sand; moderate medium granular structure; very friable, nonsticky, nonplastic; common fine roots and common medium roots; clear boundary. E=10 to 14 inches (25.4 to 35.6 cm); light yellowish brown (10YR 6/4) crushed, loamy fine sand; weak medium granular structure; very friable, nonsticky, nonplastic; common fine roots and common medium roots; gradual boundary. Bt1=14 to 28 inches (35.6 to 71.1 cm); yellowish red (5YR 4/6) broken face, sandy clay loam; moderate medium subangular blocky structure; friable, moderately sticky, slightly plastic; few fine roots; many fine interstitial and many very fine interstitial pores; 2% faint clay films on faces of peds; gradual boundary. Bt2=28 to 40 inches (71.1 to 101.6 cm); yellowish red (5YR 4/6) broken face, clay loam; moderate medium subangular blocky structure; friable, moderately sticky, moderately

86
86
plastic; many very fine interstitial pores; 5% faint clay films on faces of peds; 5% well rounded prismoidal quartz pea gravel 4 mm in size; gradual boundary. Bt3=40 to 63 inches (101.6 to 160.2 cm); strong brown (7.5YR 5/6) broken face, sandy clay loam; moderate medium subangular blocky structure; friable, moderately sticky, slightly plastic; common very fine interstitial pores; 5% faint clay films on faces of peds.

87
87
APPENDIX B
Soil Ammonium Nitrogen (KCl Extraction/Exchangeable Ammonium) Scope and Application This method involves the semiquantitative extraction of ammonium (NH4-N) from soils using 2.0N KCl. Ammonium is determined by spectrophotometric, diffusion-conductivity instruments or distillation techniques. The method doesn’t quantitatively extract ammonium from mineral structures (i.e. nonexchangeable NH4-N) or bound to organic compounds. The methods is readily adapted to manual or automated techniques. The procedure outlined follows that outlined by Keeney and Nelson (1982) for determining nitrate nitrogen with a modification in which 25 mL of KCl and 5.0 g of soil are used instead of 100 mL and 10 g soil. Care must be taken to avoid contamination from filter paper and operator handling. Soil ammonium concentrations are generally low in mineral soils (<10 mg kg-1). The method detection limit is approximately 0.2 mg kg-1 (on a dry soil basis) and is generally reproducible + 7%. Equipment
1. Analytical balance: 1000 g capacity, resolution +0.01 g. 2. Repipette dispenser, calibrated to 25.0 + 0.2 ml. 3. Reciprocating horizontal mechanical shaker, capable of 180 oscillations per minute
(opm) 4. Extraction vessels and associated filtration vessel. 5. Whatman No. 42 or equivalent highly retentive filter paper 6. Spectrophotometer, or flow injection analyzer (FIA), or distillation instruments.
Reagents
1. Deionized water, ASTM Type I grade. 2. Potassium chloride extracting solution, 2.0 N KCl: Dissolve 150 g of reagent grade
KCl in 500 ml deionized water and dilute to a 100 mL (See comment #1). 3. Standard calibration solutions of NH4-N. Prepare six calibration standards ranging
from 0.1 to 20.0 mg L-1 concentration, diluted to 2.0 N KCl extraction solution prepared from 1000 mg L-1 NO3-N standard solution.
Procedure
1. Weigh 5.0 + 0.05 g of air-dried soil pulverized to pass 10 mesh sieve (<2 mm) into extraction vessel. Add 25.0 mL of 2.0 N KCl extraction reagent using repipette dispenser (See comment #2). Include a method blank.
2. Place extraction vessel(s) on reciprocating mechanical shaker for thirty (30) minutes. 3. Filter extract (See comment #3), refilter if filtrate is cloudy (comment #4). 4. Ammonium-N content of the extract is determined using a spectrophotometer,
diffusion conductivity instruments or distillation techniques using standard calibration solutions (See comment #4 and #5). The ammonium nitrogen content of the digest
88
88
solution can be determined with a rapid flow analyzer (Technicon Method No. 334-74A/A) or a flow injection analyzer (FIA). This determination can also be made using the Kjeldahl distillation method. Adjust and operate instruments in accordance with manufacturer’s instructions. Determine ammonium concentration of a method blank and unknown sample.
5. Calculation 6. NH4-N mg kg-1 in soil = (NH4-N mg L-1 in filtrate –method blank) * 5 7. Report soil ammonium concentration to the nearest 0.1 mg kg-1 (see comment #5)
Comments
1. Soils may be extracted with 2.0 N KCl for the simultaneous determination of nitrate (Method 3.10)
2. Check repipette dispensing volume calibration using an analytical balance. 3. Check filter paper supply for possible contamination of and NH4-N. If contamination
is greater than 0.2 mg L-1 on a solution basis, rinse filter paper with 2.0 N KCl. 4. It is recommended that soils extracted for ammonium be analyzed within two (2)
hours after extraction. 5. Samples having ammonium concentrations exceeding the highest standard will
require dilution and reanalysis. 6. Ammonium-nitrogen (NH4-N) results can be expressed on a volume basis. Assuming
the sample represents a 0-6 inch (0-15 cm) depth of the soil, then: NH4-N mg kg-1 * 2.0 = NH4-N lbs ac-1
Literature Bremmer, J.M. and D.R. Kenney. 1965. Determination and isotopic ratio analysis of different forms of nitrogen in soils. I. Apparatus and procedure for distillation for and determination of ammonium. Soil Sci. Soc. Am. Proc. 29:504-507. Dahnke, W.C. 1990. Testing soils for available nitrogen. p. 120-140. In: R.L. Westerman (ed.) Soil testing and plant analysis. Soil Sci. Soc. Am. Book series 3 ASA Madison WI. Keeney, D.R. and D.W. Nelson. 1982. Nitrogen-inorganic forms. In A.L. Page (eds.) Methods of soil analysis, part 2. Agron. Monogr. 9, 2nd ed. ASA and SSSA, Madison, WI. P. 643-698. Western States Program Ver. 4.10 (2/10/98)

89
89
APPENDIX C
Ammonia (Water Based Samples) FIAlab standard method for the ammonia assay in fresh/salt waters and KCL soil extracts using the FIAlab-2500/2600/2700 system.
Assay Typical Throughput Concentration Range Notes Ammonia (Mid to High) 120 samples/hour 0.5 to 200 mg (N)/L NH3 1 cm flowcell Ammonia (Low) 80 samples/hour 0.01 to 10 mg (N)/L NH3 10 cm flowcell Ammonia (Ultra Low) 40 samples/hour 0.002 to 2 mg (N)/L NH3 50 cm flowcell
Note: For an alternative ultra low method please review the fluorometric OPA approach. Principle: This method was optimized to meet the needs of environmental monitoring, where water samples are tested to conform to the 10mg (N)/L MCL USEPA requirement. Low ammonium levels can be determined in FIA by using the salicylate method. The salicylate method is a variation of the Berthelot-Phenate method but does not require the use and disposal of toxic phenol. The salicylate method involves a three-step reaction sequence. The first reaction step involves the conversion of ammonia to monochloroamine by the addition of chlorine. The monochloroamine then reacts with salicylate to form 5-aminosalicylate. Finally, the 5-aminosalicylate is oxidized in the presence of sodium nitroferricyanide to form a blue-green colored dye that absorbs light at 650nm. Comments: Water Bath Heater should be turned on to 60 C. The flowrate of the pump should be set to 45. The FIA LOV connections B should be bridged by short green tubing. Recommended wavelengths: 650 nm primary and 525 nm reference. 825 nm can also be used as the reference. For most ammonia assays (> 0.5 ppm) make the sample loop from three inches of green tubing (.03” ID). Low Concentration Assays: For low concentrations (below 0.5 ppm) consider using the 10 cm flowcell. Also for lower concentrations (0.01 to 0.2 ppm) use longer sample loop (e.g., 12 inches of .03” ID tubing). For the low end of this range, care must be taken to use clean glassware and extended washouts of tubing on the system to prevent crossover contamination. For ultra low concentrations use a 36" sample loop. Interferences: Sulfide will intensify the blue-green color and should be removed from the sample if possible. Hydrazine and glycine like sulfide can also intensify the color. High sample turbidity will give significant erroneous results and may need to be pre-filtered or run utilizing a different ammonia method. Iron will also interfere with the analysis, but can be eliminated by doping the calibrations samples with the same level of iron present in the sample. To a lesser extent the following ions may also interfere: sulfates (>300 ppm), phosphates (>100 ppm), nitrates (>100 ppm), nitrites (>12 ppm), calcium (>1000 ppm) and magnesium (>6,000 ppm). Reagents: Carrier: The carrier should be matrix matched to the sample, i.e., salt content for seawater samples, and KCL content for soil extracts.
90
90
Reagent 1: Hypochloride Solution. 10-mL of a 6% Sodium hypochloride solution (common household bleach) 5-grams NaOH (s) Balance Degassed DI water (1 L) Place a 10ml solution of bleach into a 1-liter volumetric flask and fill with 700-mL of degassed DI water. Dissolve all other chemicals and fill flask to the 1-liter mark. Reagent 1 degrades with time, should be prepared daily. Note: If bubbles become an issue, sticking in the flowcell and other parts of the manifold then add 1-gram Brij-35 (detergent) to Reagent 1. Reagent 2: Salicylate/Catalyst Solution. 100-grams Sodium Salicylate [160.11 FW] 0.40-grams Sodium Nitroferricyanide (III) dihydrate [297.95 FW] catalyst 5-grams NaOH (s) Balance Degassed DI water(1 L) Place the sodium salicylate into a 1-liter volumetric flask and mix with 700-mL of degassed DI water until dissolved. Add the sodium nitroferricyanide and mix until dissolved. Add NaOH to adjust the pH to the ~12.0 range. Add the Brij 35, mix and fill flask to the mark. Transfer solution into a dark, airtight glass bottle for maximum longevity. Prepare fresh weekly due to limited storage life. Standards: 100ml ICAMU-100 (ammonia standard) Source: 727-524-7732 - www.exaxol.com Please email or phone FIAlab Instruments for additional product information. Email: [email protected], Voice: 425-376-0450 or 1-800-963-1101, Fax: 425-376-0451

91
91
APPENDIX D
Alfalfa (scale=10ths of ft)
Barley (scale=10ths of ft)

92
92
Lupine (scale=10ths of ft)
Rye (scale=10ths of ft)

93
93
Rye/Alfalfa (scale=10ths of ft)
Rye/Hairy Vetch (scale=10ths of ft)

94
94
Sweetclover (scale=10ths of ft)
Triticale (scale=10ths of ft)

95
95
Wheat (scale=10ths of ft)

96
APPENDIX E
Table 1. ANOVA table presenting the degrees of freedom (df) and significant p-values for the RCBSPD utilized for the soil properties analyzed at the coarse-loamy site.
1 p-values gleaned from PROC MIXED procedure in SAS (SAS, 2003) using the same model used for the PROC GLIMMIX procedure. †Wheretheblock*treatmentinteractionwasNS,theSatherthwaiteadjustmentusedinthePROCGLIMMIXprocedureadjustedtheresidualdftermto268. Note: Value in parenthesis is the p-value from the PROC MIXED procedure in SAS (SAS, 2003) where they differed from the values obtained from the PROC GLIMMIX procedure. Note: Db=bulk density, POM=Particulate organic matter, PMN=Potentially mineralizable nitrogen.
Significance level (p-value) for select soil properties measured Source
df Db Total C Total N POM PMN CEC
Treatment 8 NS NS NS NS 0.0049 (0.0094)
NS
Depth 2 <0.0001 <0.0001 <0.0001 <0.0001 <0.0001 <0.0001 Treatment*depth 16 NS NS NS NS 0.0136
(0.0161) NS
Sampling time 4 0.001 <0.0001 <0.0001 <0.0001 0.0016 (0.0018)
<0.0001
Treatment*sampling time 32 NS NS NS 0.0023 NS NS Depth*sampling time 8 0.015
(0.0203) NS NS <0.0001 0.0011
(0.0013) 0.0021
Treatment*depth*sampling time 64 NS NS NS NS NS NS Block1 2 <0.0001 NS NS NS 0.0175 NS Block*treatment1 16 NS <0.0001 <0.0001 <0.0001 NS <0.0001 Residual 252 † ---- ---- ---- ---- ---- ----

97
Table 2. ANOVA table presenting the degrees of freedom (df) and significant p-values for the RCBSPD utilized for the soil properties analyzed at the fine-loamy site.
1 p-values gleaned from PROC MIXED procedure in SAS (SAS, 2003) using the same model used for the PROC GLIMMIX procedure. †Wheretheblock*treatmentinteractionwasNS,theSatherthwaiteadjustmentusedinthePROCGLIMMIXprocedureadjustedtheresidualdftermto268. Note: Value in parenthesis is the p-value from the PROC MIXED procedure in SAS (SAS, 2003) where they differed from the values obtained from the PROC GLIMMIX procedure. Note: NS=not significant, Db=bulk density, POM=Particulate organic matter, PMN=Potentially mineralizable nitrogen.
Significance level (p-value) for select soil properties measured
Source
df Db Total C Total N POM PMN CEC
Treatment 8 NS NS NS NS 0.0043 NS Depth 2 <0.0001 <0.0001 <0.0001 <0.0001 <0.0001 <0.0001 Treatment*depth 16 0.0266 0.0429 NS NS 0.0015 NS Sampling time 4 <0.0001 <0.0001 <0.0001 <0.0001 <0.0001 <0.0001 Treatment*sampling time 32 NS NS NS NS NS 0.0029 Depth*sampling time 8 0.0003 NS <0.0001 0.0047 <0.0001 0.039 Treatment*depth*sampling time 64 NS 0.0541 NS NS NS NS Block1 2 NS 0.0117 NS NS NS NS Block*treatment1 16 <0.0001 <0.0001 0.0162 0.0018 NS <0.0001 Residual 252† ---- ---- ---- ---- ---- ----

98
Table 3. ANOVA table presenting the degrees of freedom (df) and significant p-values for the PROC MIXED procedure using the RCB model for biomass yield analysis at both sites.
Note: NS=not significant
Table 4. ANOVA table presenting the degrees of freedom (df) and significant p-values for the PROC GLM procedure using the RCB model for biomass yield analysis at both sites.
1 For year 2007 the df was 50 due to extra samples being included in the analysis
Significance level (p-value) for biomass yield measured
Coarse-loamy site Fine-loamy site
Source df Biomass df Biomass
Treatment 8 <0.0001 8 <0.0001
Year 1 <0.0001 1 <0.0001 Treatment*year 8 <0.0001 8 <0.0001 Block 2 NS 2 NS Block*treatment 16 NS 16 NS Residual 77 ---- 72 ----
Significance level (p-value) for biomass yield measured
Coarse-loamy site Fine-loamy site
Source df Biomass df Biomass
Treatment 8 <0.0001 8 <0.0001
Residual 451 ---- 45 ----