above ground biomass estimation of mangroves … · above ground biomass estimation of mangroves...
TRANSCRIPT

Tropical Agricultural Research Vol. 27 (2): 137– 146 (2016)
Above Ground Biomass Estimation of Mangroves Located in Negombo -
Muthurajawela Wetland in Sri Lanka using ALOS PALSAR Images
A.R. Gunawardena*, S.P. Nissanka
1, N.D.K. Dayawansa
2 and T.T. Fernando
Postgraduate Institute of Agriculture
University of Peradeniya
Sri Lanka
ABSTRACT: In Sri Lanka, mangrove forests are scattered along the north-western, north
eastern, Jaffna Peninsula and eastern coastal belt. The total estimated extent of mangroves
in the country is about 87 km2. Estimation of Above Ground Biomass (AGB) of mangroves is
a challenging task due to field sampling difficulties. Use of satellite based remote sensing
technologies is becoming popular for estimation of AGB for different vegetation types. To
overcome the limitations during field sampling and to identify the possibility of using SAR
data for AGB estimation, ALOS PALSAR satellite data were used to estimate AGB of
mangroves and associated vegetation in Muthurajawela- Negombo wetland in Sri Lanka.
Diameter at Breast Height (DBH) measurements over 5cm of eighteen (18) sampling plots
(10x10 m) were collected and the relevant allometric equation was used to estimate the AGB.
Backscatter coefficient values of HH and HV polarization of ALOS –PALSAR images were
used to estimate the AGB of mangroves using a previously derived model. Finally, an AGB
map of mangrove associated vegetation was developed for the study area using ALOS
PALSAR data as a method of minimizing field work while saving time and cost.
According to the results, the average AGB is observed as 65t/ha from the field sampling
method (28 -135 t/ha) while it was estimated as 76 t/ha (33-155 t/ha) using PALSAR which
shows an overestimation by 17%. A significant overestimation by the remote sensing method
is occurred when the tree height is more than 5 m. Though it shows an overestimation, the
map developed using this approach is helpful to understand the distribution of AGB within
mangrove associated vegetation systems where field sampling is a challenging task.
Keywords: Remote Sensing, Biomass, Mangroves, Above Ground Biomass
INTRODUCTION
All the living organisms above the soil is referred as the Above Ground Biomass (AGB).
Natural ecosystems like forests store a massive quantity of biomass and the accurate
quantification of it is a challenging task. The most accurate way of estimating forest biomass
is the destructive sampling which consumes time and money. A far more efficient method,
with well-established accuracy is to measure the above ground dimensions of trees to
estimate weights (Brown et al., 1989). The use of remote sensing technology has become a
very effective approach to biomass estimation since it is non destructive and effective in
terms of cost and time.
1 Department of Crop Science, Faculty of Agriculture, University of Peradeniya, Peradeniya, Sri Lanka. 2 Department of Agricultural Engineering, Faculty of Agriculture, University of Peradeniya, Peradeniya, Sri Lanka. * Corresponding author: [email protected]

Gunawardena et al.
138
Traditional inventory of forest parameters based on fieldworks is often difficult, costly and
time consuming to conduct in large areas. Complexity of structure and inaccessible nature of
many mangrove forests limits the feasibility of ground based inventory for biomass
estimation. However, remote sensing is one of the feasible ways to acquire forest stand
parameter information at a reasonable cost with an acceptable accuracy. Advanced new
remote sensing techniques such as multi-sensor data fusion, increased spatial and spectral
resolution and integration possibility with Geographical Information Systems (GIS) have
made the remotely sensed data a primary source for many biomass estimation applications
(Namayanga, 2002).
In Sri Lanka, mangrove forests are scattered mainly along the north-western, north eastern,
Jaffna Peninsula and eastern coasts bordering lagoons and river estuaries. The area extent
covered by the mangrove forests is estimated at only 87 km2. Majority of the mangrove
forest areas have been subjected to human interferences hence undisturbed mangrove forests
are seldom found. In most areas, the mangrove forests are usually restricted to a narrow strip
(Legg and Jewell, 1995).
Mangrove Forest of Sri Lanka
Two major types of mangrove forests, namely, low-saline and high-saline, could be
distinguished by the floristic composition. Three other specialized high saline types, scrub,
over wash, and basin, are also sometimes can be distinguished depending on the flooding
characteristics and topography (Silva and Silva, 1998). Twenty three true mangrove species
of trees and shrubs have been recorded in Sri Lanka, the common species being Rhizophora
mucronata, Avicennia marina, Excoecaria agallocha, Acanthus ilicifolius, Lumnitzera
racemosa, Sonneratia caseolaris, Bruguiera gymnorhiza and Aegiceras corniculatum. The
rare species are Ceriops decandra, Sonnera tiaapetala, Lumnitzera littorea, Scyphiphora
hydrophyllacea and Cynome trairipa, out of them the first three are endangered species in
Sri Lanka (The National Red List of Sri Lanka, 2012).
Biomass estimation using SAR data
The ALOS (Advanced Land Observing Satellite) PALSAR (Phased Array type L-band
Synthetic Aperture Radar) in 2006 has increased the potential of utilizing radar to measure
biomass, as this is the first long-wavelength (L-band, 23-cm wavelength) SAR satellite
sensor to have the capability of collecting single, dual, full and Scan-SAR mode with cross-
polarized (HV, horizontal-transmit, vertical receive) and co-polarized (HH, horizontal-
transmit, horizontal receive; VV, vertical-transmit, vertical receive) data. The HV
polarization is useful because it interacts with trees and produces a strong response (Avtar et
al., 2013). Various studies have analyzed the retrieval of Above Ground Biomass (AGB)
using radar data in tropical regions (Mitchard et al., 2009). These methods are mostly based
on empirical or semi-empirical relationships between radar backscatter and ground based
data.
There are many studies (Ranasinghe, 1998, 2001; Amarasinghe and Liyanage, 1996)
conducted to describe the ecology and biology of mangroves in Sri Lanka. However, there
are no specific studies on biomass estimations of mangroves in the country.
It is not possible to find literature on estimation of AGB using SAR data in Sri Lanka though
some studies have been carried out on the use of optical and infrared data (Gunawardena et
al., 2006; 2009; 2013 and 2014). This study attempted to identify the possibility of using

Above Ground Biomass Estimation of Mangroves using ALOS PALSAR Images
139
SAR data to estimate the AGB of mangrove forest and associated vegetation in Negombo –
Muthurajawela area of Sri Lanka using ALOS PALSAR data.
METHODOLOGY
Study site
The selected mangrove area can be found in Muthurajawela - Negombo Lagoon which is a
large estuarine located in the western coast of Sri Lanka (Figure 1). The lagoon is fed by a
number of small tributaries and major rivers namely; Dandugan Oya and Hamilton Canal.
The estuary is linked to the sea by a narrow channel. The lagoon has extensive mangrove
swamps rich in biodiversity. The three islets which are famous for the mangroves are in
northern end namely; Kakaduwa, Mandagasalamba and Kadolnallala. Fourteen (14)
mangrove species have been found in these islets. Sedimentation has accelerated between the
islets and form mud flats which supports the primary generation of mangroves (Pinto, 1982).
Fig. 1. Study area - Negombo - Muthurajawela wetland of Sri Lanka
Gunawardena et al.
140
Many important aspects have made the Negombo Lagoon and its associated wetland
ecosystem very significant. It provides a source for natural products of peat, timber, flowers,
vegetable, fruit, grasses for livestock, corals, fish, shrimp, sand and shells, reeds for thatch,
salt and clay (CEA, 1994). Fishing and shrimp farming are the main income generation of
the people in the surrounding. According to the studies carried out by Panditharatne (1981)
shrimp farming was spreading at an alarming rate around the lagoon and currently majority
of the farms are abandoned (Wimalasena and De Mel, 2009). Because of the importance of
mangroves in this unique eco system of Negombo Lagoon, this study was carried out to find
out the biomass association which supports the carbon sink of the environment. Brush-pile
fisheries (use of mangrove branches as fish aggregating devices) has been noted in Negombo
lagoon, where mangrove branches are piled in the lagoon to act as fish aggregating devices
which cause to biomass reduction (Amarasinghe et al., 2011)
Data, materials and software
• ALOS PALSAR images of Duel Polarizations (HH, HV) ALOS –PALSAR were
used (LED-ALPSRP125690120-H1.5_UA). Processing level was 1.5 and the Pixel
Spacing was 12.5 m. Date of image acquisition was 03 May, 2008. This image was
originally projected to UTM, WGS 84.
• Landsat 8 OLI (Date of image acquisition 30 August 2014)
• High Resolution imageries (IKONOS and Quick Bird) and Google Earth.
• GPS locations of field sampling plots and different land uses and land cover.
• ERDAS, PolsarPro, Nest, Remote 10 and ArcMap software were used for image
analysis and map generation.
Boundary demarcation of mangroves and associated vegetation
Initial field survey was conducted to collect GPS locations of the study area representing all
land use and land cover types. Collected ground truth data were used to carry out an
unsupervised classification of Landsat 08 OLI (2014) data which ultimately derived the
updated land use/cover map of the area. High resolution IKONOS, Quick Bird and Google
Earth images were used to validate the developed land use/cover map. Mangrove and
associated vegetation were extracted from the land use/cover maps and a separate thematic
layer was created. It was overlaid on PALSAR image to delineate the study area boundary.
Field based biomass estimation
Diameter at Breast Height (DBH) measurements over 5 cm of eighteen (18) sampling plots
(10x10 m) have been collected and allometric equation developed by Ong et al. (2004) was
applied (Equation 1) to estimate AGB. Field measurement collection was conducted during
year 2011 - 2012. Canopy cover percentage was also estimated by visual interpretation of
high resolution satellite imageries.
Log 10 (AGB) = 2.420 * log 10 (DBH) – 1.832 (Equation 1)
(Ong et al.,2004)
Conversion of DN of PALSAR image into backscattering coefficient
In this study, ALOS –PALSAR images with HH and HV duel polarization were used to
calculate the biomass. The DN (Digital Number) of the HH and HV polarized images were
Above Ground Biomass Estimation of Mangroves using ALOS PALSAR Images
141
converted into backscattering coefficient using Equation 2 (Shimada et al., 2009). L-band
microwaves (wavelength approximating 25 cm) emitted by the ALOS PALSAR penetrate
through the foliage and interact primarily with the woody components of vegetation.
Horizontally transmitted waves are either depolarized through volume scattering by branches
in the canopy, with a proportion of vertically polarized microwaves returning to the sensor,
or penetrate through the canopy and interact with the trunks, returning primarily through
double bounce scattering, as a horizontally polarized wave (Lucas et al., 1998).
σ 0 = 10*log10 (DN2)-83.0 (Equation 2)
σ 0 = Backscattering Coefficient
Biomass estimation using backscatter coefficient
Biomass estimation model developed for ALOS PALSAR imageries has been applied to
estimate the carbon in Cambodian mangroves and other ecosystems and has obtained
significant results (Avtar et al., 2013). The same model was used in this study to estimate the
AGB in the mangroves and associated vegetation. The model is presented in Equation 3.
AGB = 752.95 + (44.4* σ 0 HV)-(8.73* σ
0 HH/HV) (Equation 03)
Avtar et al. (2013)
HH = Horizontal – Horizontal Backscattering coefficient of PALSAR
HV = Horizontal – Vertical Backscattering coefficient of PALSAR
The accuracy of estimated AGB was assessed by comparing with field sampled AGB using
statistical analysis by t- test. Finally, the AGB map of mangrove and associated vegetation
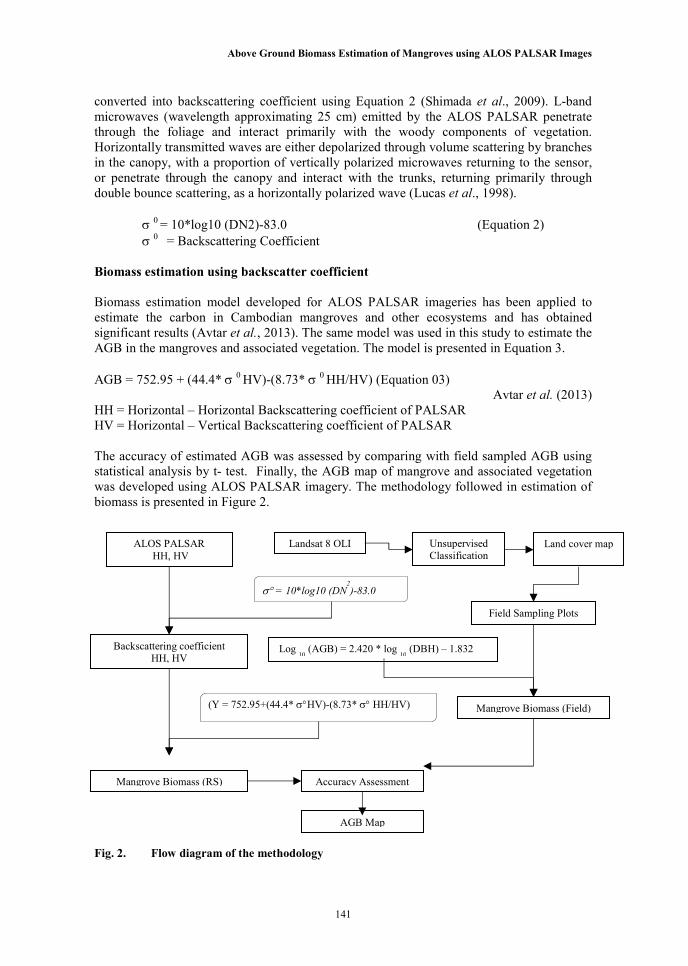
was developed using ALOS PALSAR imagery. The methodology followed in estimation of
biomass is presented in Figure 2.
Fig. 2. Flow diagram of the methodology
ALOS PALSAR
HH, HV
Mangrove Biomass (RS)
AGB Map
Accuracy Assessment
(Y = 752.95+(44.4* σ°HV)-(8.73* σ° HH/HV)
Backscattering coefficient HH, HV
σ° = 10*log10 (DN2
)-83.0
Field Sampling Plots
Mangrove Biomass (Field)
Log 10
(AGB) = 2.420 * log 10
(DBH) – 1.832
Landsat 8 OLI Unsupervised
Classification Land cover map

Gunawardena et al.
142
RESULTS AND DISCUSSION
Demarcation of mangrove and associated vegetation using Landsat OLI
Unsupervised classification of Landsat 8 OLI image (2014) which was used to develop the
land use/cover map with accuracy checking using Google Earth images and GPS based
ground truth information is shown in Figure 3. There are 8 major land use/cover classes
derived for the study area and mangrove with associated vegetation were extracted for field
biomass estimation.
Fig. 3. Land use/cover map of study area derived from Landsat OLI image (2014)
using unsupervised classification
Above Ground Biomass Estimation of Mangroves using ALOS PALSAR Images
143
Comparison of PALSAR estimated AGB with estimations made by field sampling
During field observations, 10 species of mangrove were identified in the study area. Among
the mangrove species, Acrostichum aureum, Barringtonia racemose, Rhizophora apiculata,
Rhizophora mucronata, Excoecaria agallocha, Acanthus ilicifolius, Lumnitzera racemosa,
Sonneratia caseolaris, and Bruguiera gymnorhiza are commonly found in the study area.
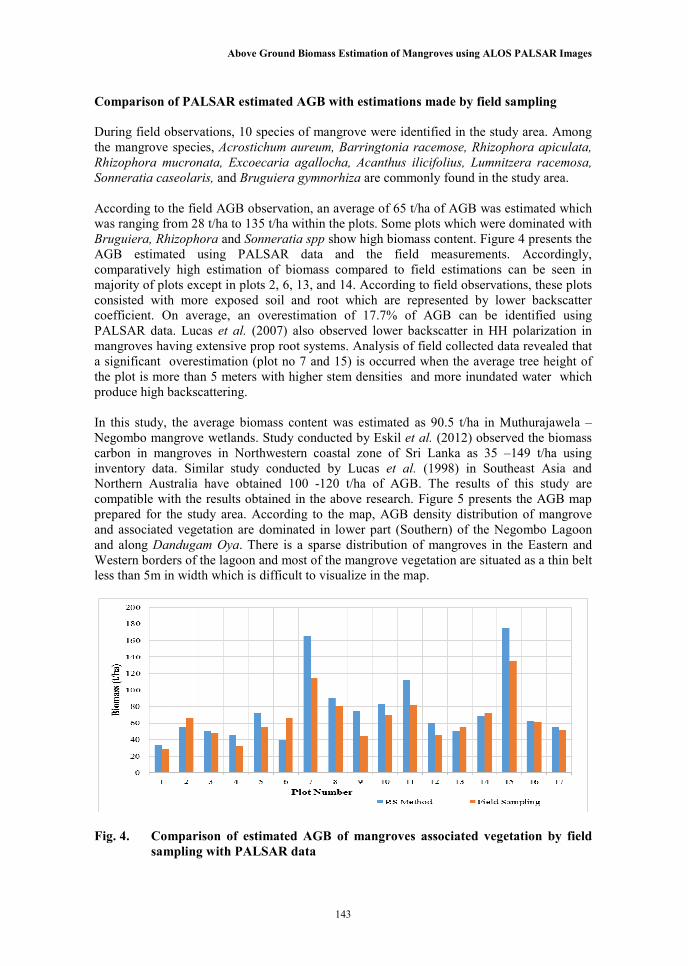
According to the field AGB observation, an average of 65 t/ha of AGB was estimated which
was ranging from 28 t/ha to 135 t/ha within the plots. Some plots which were dominated with
Bruguiera, Rhizophora and Sonneratia spp show high biomass content. Figure 4 presents the
AGB estimated using PALSAR data and the field measurements. Accordingly,
comparatively high estimation of biomass compared to field estimations can be seen in
majority of plots except in plots 2, 6, 13, and 14. According to field observations, these plots
consisted with more exposed soil and root which are represented by lower backscatter
coefficient. On average, an overestimation of 17.7% of AGB can be identified using
PALSAR data. Lucas et al. (2007) also observed lower backscatter in HH polarization in
mangroves having extensive prop root systems. Analysis of field collected data revealed that
a significant overestimation (plot no 7 and 15) is occurred when the average tree height of
the plot is more than 5 meters with higher stem densities and more inundated water which
produce high backscattering.
In this study, the average biomass content was estimated as 90.5 t/ha in Muthurajawela –
Negombo mangrove wetlands. Study conducted by Eskil et al. (2012) observed the biomass
carbon in mangroves in Northwestern coastal zone of Sri Lanka as 35 –149 t/ha using
inventory data. Similar study conducted by Lucas et al. (1998) in Southeast Asia and
Northern Australia have obtained 100 -120 t/ha of AGB. The results of this study are
compatible with the results obtained in the above research. Figure 5 presents the AGB map
prepared for the study area. According to the map, AGB density distribution of mangrove
and associated vegetation are dominated in lower part (Southern) of the Negombo Lagoon
and along Dandugam Oya. There is a sparse distribution of mangroves in the Eastern and
Western borders of the lagoon and most of the mangrove vegetation are situated as a thin belt
less than 5m in width which is difficult to visualize in the map.
Fig. 4. Comparison of estimated AGB of mangroves associated vegetation by field
sampling with PALSAR data

Gunawardena et al.
144
Fig. 5. Estimated AGB map derived from ALOS PALSAR imagery
CONCLUSIONS
The study identified that the AGB estimated using the model developed by Avtar et al. (2013)
using backscattering coefficient derived from HH, and HV polarized PALSAR data
overestimate the AGB of mangroves compared to the field sampled data. On average, this
overestimation is 17.7% for this study.
According to the PALSAR data, the average biomass content of the mangrove forests of the
study area is 90.5 t/ha which gives 17% overestimation than the field sampled estimation.
Many reasons can be attributed to the deviation of estimated AGB. Among them, biophysical
parameters of the mangrove vegetation, inundated water levels, soil exposure levels and
associated plants are directly affected to backscatter coefficient of the PALSAR image. In
addition, the AGB estimation was carried out with a model derived elsewhere hence it is
important to identify its suitability to local mangrove species and their distribution. Further
studies with the same SAR data will be helpful to derive a suitable model for the local
conditions to asses AGB of Sri Lankan mangroves.
Biomass (t/ha)

Above Ground Biomass Estimation of Mangroves using ALOS PALSAR Images
145
REFERENCES
Amarasinghe, M.D. and Liyanage, S. (1996). Contribution of mangrove resources to the
socio-economic status of adjacent human communities along the West and Southern coasts
of Sri Lanka. IUCN-Forest Department, Sri Lanka.
Amarasinghe, O. and Bavinck, J.M. (2011). Social capital and the reduction of vulnerability:
The role of fisheries cooperatives in southern Sri Lanka. In: Poverty mosaics, realities and
prospects in small scale fisheries, ed., Jentoft, S. Arne, Aide.Dordrecht: Springer.
Avtar, R., Suzuki R., Takeuchi, W. and Sawada, H. (2013). PALSAR 50 m Mosaic Data
Based National Level Biomass Estimation in Cambodia for Implementation of REDD+
Mechanism. PLoS ONE. 8(10). e74807. doi:10.1371/journal.pone.0074807.
Brown, S., Gillespie, A.J.R. and Lugo, A.E. (1989). Biomass estimation methods for tropical
forests with applications to forest inventory data. Forest Science. 35, 881 - 902.
CEA/Euroconsult (Netherlands). (1994). Muthurajawela Marsh and Negombo Lagoon
Wetland site report. Central Environmental Authority, Sri Lanka.
Eskil, M., Persson, U.M., Ostwald, M. and Nissanka, S.P. (2012). REDD plus readiness
implications for Sri Lanka in terms of reducing deforestation. Journal of Environmental
Management. 100, 29 - 40.
Gunawardena A.R, Nissanka S.P. and Dayawansa N.D.K. (2006). Relationship between
above Ground Live Biomass and Satellite Image Spectral Responses (Landsat ETM+) of
Pinus caribaea at Lower Hantana Region in Sri Lanka. Tropical Agricultural Research. 18,
334 – 345.
Gunawardena A.R, Nissanka S.P. and Dayawansa N.D.K. (2009). Development of
Merchantable Timber Volume Estimation of Pinus caribaea Plantations using Multi-Spectral
Satellite Images ENGINEER. XXXXI(05), 68 - 73.
Gunawardena, A.R, Nissanka, S.P and Dayawansa, N.D.K. (2013). Estimation of above
ground live biomass of Tectona grandis (teak) plantation in low country dry zone region in
Sri Lanka using IRS LISS III (2008) data. Proceedings of the First Symposium of geo-
informatics. International Water management Institute, Colombo.
Gunawardena, A.R, Nissanka, S.P and Dayawansa, N.D.K. (2014). Assessment of the spatial
distribution and biomass estimation of Prosopis juliflora in Puttlam to Mannar Region of Sri
Lanka Using Multi-Temporal Satellite Images. Tropical Agricultural Research. 25, 228 - 239.
Legg, C. and Jewell, N. (1995). A 1:50 000 scale forest map of Sri Lanka, the basis for the
National Forest Geographic Information System. Special Issue: Remote Sensing Sri Lanka.
Forester. 3, 24.
Lucas, R.M., Curran, P.J., Honzak, M., Foody, G.M., Do Amaral, I. and Amaral, S. (1998).
The contribution of remotely sensed data in the assessment of the floristic composition, total
biomass and structure of Amazonian tropical secondary forests. In: Regenerac¸ao˜ Florestal:
Pesquisasna Amazonia, Gascon, C. and Moutinho, P. (Eds), Manaus, INPA Press. pp. 61 - 82.
Gunawardena et al.
146
Lucas, R.M., Mitchell, A.L., Rosenqvist, A., Proisy, C. and Melius, A. (2007). The potential
of L-band SAR for quantifying mangrove characteristics and change: Case studies from the
tropics. Aquatic Conservation - Marine and Fresh Water Ecosystems. 17, 245 - 264.
Mitchard, E.T.A., Saatchi, S.S., Woodhouse, I.H., Nangendo, G. and Ribeiro, N.S. (2009).
Using satellite radar backscatter to predict above-ground woody biomass: PALSAR Based
Cambodian Forest Biomass. A consistent relationship across four different African
landscapes. Geophysical Research Letters. 36, 1 - 6.
Namayanga, L.N. (2002). Estimating terrestrial carbon sequestered in above ground woody
biomass from remotely sensed data. International Institute for Geo-information Science and
Earth Observation, Netherlands. MSc Thesis. pp. 10 - 12.
Ong, J.E., Gong, W.K. and Wong, C.H. (2004). Allometry and partitioning of the mangrove,
Rhizophora apiculata. J. Forest Ecology Management. 188, 395 - 408. DOI:
10.1016/j.foreco.2003.08.002.
Panditharatne, S. (1981). Impacts of technology and institutional changes on the fishing
community of Negombo 1950 - 1980. NARESA Final Report RGB/81/5/3.
Pinto, M.L. (1982). Distribution and zonation of mangroves in the Northern Part of the
Negombo Lagoon, Sri Lanka. Journal of National Science Council, Sri Lanka. pp. 245 - 255.
Ranasinghe, D.M.S.H.K. (1998). Mangroves of Sri Lanka; a losing resource. In: MPT News
Vol. 7, No. 2, 1998, Multi- Purpose Tree Species Network. Faculty of Agriculture,
University of Peradeniya, Sri Lanka.
Ranasinghe, D.M.S.H.K. (2001). Conservation of mangroves in Muthurajawela Marsh and
Negombo/ Chilaw Lagoon, Proceedings of the workshop on Effective Management for
Biodiversity Conservation in Sri Lanka Coastal Wetlands (ed Farmer, N). Centre for
Economics and Management of Aquatic Resources, University of Portsmouth, U.K.
Shimada, M., Isoguchi, O., Tadono, T. and Isono, K. (2009). PALSAR polarimetric
calibration and geometric calibration. IEEE. Transactions on Geoscience and Remote
Sensing. 47(12), 3915 - 3932.
Silva, D.M. and Silva, P.K. (1998). Status, diversity and conservation of the mangrove
forests of Sri Lanka. J. South Asian nat. Hist. 3(1), 79 - 102. ISSN 1022 - 0828.
The National Red List 2012 of Sri Lanka (2012). Conservation Status of the Fauna and Flora.
Weerakoon, D.K. & S. Wijesundara Eds., Ministry of Environment, Colombo, Sri Lanka.
Wimalasena, H.D. and De Mel, W.D.M. (2009). Shrimp Farming in Sri Lanka: Risks and
Returns. Sri Lankan Journal of Humanities and Social Sciences. 1(2).