above- and below-ground production, biomass … vol. 193: 271-283,2000 marine ecology progress...
TRANSCRIPT

l Vol. 193: 271-283,2000
MARINE ECOLOGY PROGRESS SERIES Mar Ecol Prog Ser
Published February 28
Above- and below-ground production, biomass and reproductive ecology of Thalassia testudinum
(turtle grass) in a subtropical coastal lagoon
James E. Kaldy*, Kenneth H. Dunton
University of Texas at Austin, Marine Science Institute, 750 Channelview Dr., Port Aransas, Texas 78373, USA
ABSTRACT: Above- and below-ground growth, biomass, phenology and reproductive effort in the sea- grass Thalassia testudinum were monitored monthly for 2 yr in the Lower Laguna Madre, Texas. Annual whole plant production (953 i 136 g DW (dry weight) m-2 yr-l) was calculated from monthly measure- ments of leaf and rhizome production made using marking techniques. Leaf growth exhblted a seasonal pattern; monthly production ranged from 8 to 95 g DW m-' mo-', equivalent to 614 * 71 g DW m-' yr-l. Rhlzome growth was seasonal, and area1 below-ground production ranged between 14 and 40 g DW m" mo-', equivalent to 339 2 65 g DW m-' yr-'. On an annual basis, rhizome production accounted for 35% of total plant production. Seasonal leaf and rhizome growth patterns were correlated with underwater irradiance. daylength and temperature. Total biomass ranged between 750 and 1500 g DW with below-ground tissues accounting for 80 to 90 % of the total. There was no seasonal pattern in the below- ground biomass of T. testudinum; variability was a result of environmental heterogeneity. Flowering was variable between years; 13 to 30% of the shoots flowered and about 15% of total above-ground biomass was allocated to reproduction. Flowering phenology was positively correlated with underwater daylength. During 1996, maximum fruit abundance ranged between 20 and 70 fruits m-' and on average each fruit contained 2 seeds. The annual flowering event represents a substantial resource (e.g. carbon and nitrogen) investment, whlch may influence individual plant production. Seasonal fluctuations in environmental parameters are the primary factors controlling seagrass growth rates and production. Determination of total plant productivity must take into account seasonal patterns, reproductive costs and the large fraction of production occurring in the below-ground tissues.
KEY WORDS: Seagrass . Thalassia testudinum . Production. Biomass . Reproduction
INTRODUCTION
In Texas, over 80 % of the seagrass acreage occurs in the Laguna Madre system (Quammen & Onuf 1993), which consistently has the highest recreational and commercial finfish landings in the State (Texas Depart- ment of Water Resources 1982). The Lower Laguna Madre (LLM), part of the hypersaline lagoon system stretching from Corpus Christi to Port Isabel, contains the largest population of Thalassia testudinum on the Texas coast. Preliminary estimates indicate that sea- grass production can account for 95% of the total
'Present address: Texas A&M University, Dept of Oceanogra- phy, College Station, Texas 77843, USA. E-mail: [email protected]
annual gross primary productivity in LLM (Ziegler &
Benner 1999). Seagrass species distribution in LLM is in transition,
opening the Gulf Intracoastal Waterway (GIWW) in- creased water circulation and decreased hypersalinity, permitting the establishment of Syringodium fiiforme and spread of Thalassia testudinum in LLM (Quam- men & Onuf 1993, Onuf 1996). T. testudinum cover in LLM has increased by about 32 km2 during the 40 yr between the initial dredging of the GIWW and sea- grass surveys conducted in 1988 (Quammen & Onuf 1993). Colonization from seed coupled with rhizome expansion may account for the rapid spread of T tes- tudinum in LLM (Quammen & Onuf 1993, Kaldy & Dunton 1999). The shifting dominance of seagrass spe- cies may have a direct impact on the primary and sec-
0 Inter-Research 2000 Resale of full article not permitted
272 Mar Ecol Prog Ser 193: 271-283, 2000
ondary productivity of the Laguna. Unfortunately, there is limited information available on the biology and ecology of T testudinum in Texas (Czerny & Dun- ton 1995, Lee & Dunton 1996, 1997, Herzka & Dunton 1997), particularly regarding the role of sexual repro- duction in meadow expansion (although see Kaldy & D.unton 1999).
The basic biology of the adult Thalassia testudinum shoot has been the primary focus of many ecological and physiological investigations with few observations of reproductive processes. Floral anatomy of T. tes- tudinum has been described in detail (Orpurt & Boral 1964, Tomlinson 1969). Flowering in Florida and Mex- ico has been observed and quantified (Grey & Moffler 1978, Lewis & Phillips 1980, Moffler et al. 198 1, Phillips et al. 1981, Durako & Moffler 1985, 1987, van Tussen- broek 1994). However, area1 seed production, seedling success and reproductive effort have not been quanti- fied for T. testudinuni (except see Grey & Moffler 1978, Kaldy & Dunton 1999). Seagrass reproductive ecology cannot be ignored because the formation of new genets contributes to the persistence of populations.
Thalassia testudinum is one of the most studied sea- grasses; however, there are few long-term (i.e. > l yr) studies of production dynamics. Below-ground pro- duction dynamics are an important aspect of seagrass ecology, because root and rhizome tissues comprise between 80 and 90% of total biomass and serve as resource storage organs (Pirc 1989, Lee & Dunton 1996). Below-ground production is estimated to ac- count for 10 to 30% of total production (Hillman et al. 1989), but these estimates are based on limited empir- ical data. Several productivity models incorporate below-ground production based on biomass allocation patterns (Short 1980, Wetzel & Neckles 1986). Recent numerical modeling, using inverse analysis, explicitly focuses on predicting below-ground growth and plant/sediment interactions (Burd & Eldndge 1997).
Estuarine and coastal systems are highly dynamic and infrequent sampling may not detect the impact of important short-term events (i.e. passage of fronts). Detailed, long-term monitoring allows examination of both long- and short-term patterns. Further, it permits assessment of the cumulative impacts from chronic events, e.g. recurring algal blooms, frequent dredging events.
Production rates are often treated as constant through time by using annual averages that obscure seasonal patterns. Because they take into account sea- sonal changes, numerical summation techniques ap- plied to high resolution data provide a powerful tool for estimating annual production. Additionally, variation between sites is rarely addressed as a result of limited spatial sampling, Site-specific differences in growth rates and biomass are generally regulated by differ-
ences in environmental parameters (Dawes & Tomasko 1988, Dixon & Leverone 1995, Dunton 1996). We hy- pothesize that shallow and deep Thalassia testudinum plants will exhibit site-specific production and repro- ductive characteristics.
The objectives of this study were to examine long- term patterns of above- and below-ground biomass and productivity of Thalassia testudinum in LLM, Texas. Growth and biomass data were examined for seasonal patterns as well as site-specific differences related to underwater light. We also examined the flowering phenology and fruit production of T. tes- tudinum in LLM. Sexual reproductive effort was quan- tified to determine the allocation of resources to this process. Correlation analysis was used to examine relationships between productivity and underwater irradiance, daylength, and temperature. Above- and below-ground growth rates and C:N ratios were used to estimate T. testudinum carbon and nitrogen incorpo- ration rates.
MATERIALS AND METHODS
Study sites. Two monotypic stands of Thalassia tes- tudinum were monitored monthly for biomass and pro- ductivity (Fig. 1) during 1995 and 1996. The Shallow site was located on the eastern side of the GIWW at an average depth of 1.3 m. The Deep site was located to the west of the GIWW behind dredged material place- ment islands at a depth of 1.7 m (Fig. 1). Reproductive parameters were also examined at a third site desig- nated Stn 2 (previously described by Herzka & Dunton 1997), which was located about 2 km south-west of the Shallow site with an average water depth of 1.3 m. At all sites, T testudinum was the dominant species al- though small stands of Halodule wrightii and Syringo- dium fii'iforme occ.urred locally.
Physical and chemical parameters. Continuous measurements of in situ surface and underwater pho- ton flux density (PFD) were made using a Li-Cor data- logger (Dunton 1994) at the Deep site and at Stn 2 . Data from Stn 2 were used to approximate underwater irradiance at the Shallow site because both sites had identical water depth and the same species composi- tion. Measurements were made using Ll-193SA spher- ical quantum sensors (471) positioned at canopy height. A terrestrial sensor (27~) was located about 5 kin from the study sites on a platform IFiq. 1; Fix 1 ) maintained by the Conrad Blucher Institute for Surveying and Sci- ence (CBI) at Texas A&M-Corpus Christi. Average hourly PFD values were integrated to calculate daily PFD; daily values were then averaged over each month. Daylength was calculated from the hourly light data and was defined as the period when average

Kaldy & Dunton: Production, biomass and reproductive ecology in Thalassia testudinum 273
hourly light values were > l pm01 photon m-' S- ' . Con- tinuous measurements of water temperature collected at Fix 1 were obtained by CBI using an H20@ water quality multiprobe (Hydrolab, Austin, TX) that was serviced weekly. Average monthly temperature was calculated from the daily noon-time values.
Dissolved inorganic nitrogen and chlorophyll a (chl a) were measured monthly at both sites from repli- cate (n = 4) water column samples analyzed spec- trophotometrically (Parsons et al. 1984). Replicate (n = 4) sediment core samples were obtained quarterly at both sites using 60 m1 syringe barrels for analysis of porewater NH,' concentration (Parsons et al. 1984). The top 10 cm of sediment was homogenized and bulk porewater was extracted by centrifugation. Sediment composition at both sites was characterized following the wet method analysis of Folk (1964).
Seagrass biomass and phenology. Seagrass bio- mass, density and phenology (i.e. presence or absence of flowers) were determined monthly. Replicate (n = 4) samples were obtained using a 15 cm diameter corer.
Fig. 1. Site map of the Lower Laguna Madre, showing the s a m p h g locations for the seagrass and physical parameters. The approximate dlstnbution of Thalassia testudinum is in light gray. Water temperature and surface photon flux density were measured at Fix 1. Biomass, productivity and reproduc- tive effort were measured at the Shallow and Deep sites, reproductive effort was also examined at Stn 2. (Map adapted
from Brown & Kraus 1997)
Samples were sieved to remove the sediments and plants were separated into above- and below-ground components. Above-ground components were sepa- rated into leaves (including sheath material) and floral parts, while below-ground tissues included roots and all rhizome materials. All above-ground components were counted to determine density. All dead plant material was discarded, while all live tissues were dried to constant weight (60°C), weighed and archived.
Reproductive ecology. Reproductive effort (RE) was determined as the proportion of total shoot biomass allocated to sexual (flower parts) reproduction (Willson 1983, Reekie & Bazzaz 1987). Fruit production was assessed using transects during summer 1996 (June to September). At each site, four 20 m transects were oriented east-to-west. At 2 m intervals along each transect, a 35 X 35 cm quadrat was placed on the seagrass bed and the number of fruits were counted and recorded. The average number of seeds per fruit was assessed by counting the seeds released from individual fruits (n = 12 during 1995, n = 16 during 1996).
Growth. Above-ground leaf growth was determined using a modification of the Zieman leaf marking tech- nique (Zieman 1974). A 35 X 35 cm quadrat was hap- hazardly placed in the grass bed and all shoots were marked for growth using a hypodermic needle. The needle was pushed through the middle of the bundle sheath of each, permanently marking all leaf material. After about 1 mo, marked shoots were collected and the amount of new leaf material (all tissues between the scar on bundle sheath and scars on the standing leaves) was measured on 10 to 15 shoots. Leaf growth and production were calculated using the equations presented by Dennison (1990a).
A new rhizome marking technique was developed because the architecture of Thalassia testudinum does not lend itself to traditional rhizome tagging methods (Dennison 1990b). By fanning away the sediments, rlu- zome meristems were located along the edge of bare patches. An insect pin (stainless steel, 00 gauge) was inserted about 1.5 cm behind the meristem to avoid damaging the sensitive tissues. A plastic surveyors flag was then inserted in the sediment directly adjacent to the needle marking the exact location of the rhizome. The rhizome was then re-buried with the dislodged sediments. After about 1 mo, the marked rhizome seg- ments were retrieved and returned on ice to the lab for processing. The original needle mark was located; tis- sue >1.5 cm forward of that mark represented new growth formed after the rhizome was marked. Length, weight and number of new nodes (equivalent to new scale leaves) initiated were measured and recorded. Estimates of new growth were calculated per individ- ual rhizome meristem on a daily basis. Annual esti-
Mar Ecol Prog Ser 193: 271-283, 2000
mates were made using numerical summation de- scribed below. Values were converted to a per m2 basis using rhizome meristem densities obtained from bio- mass cores. Average rhizome meristem density was 248 m-2 at the Shallow site and l00 m-2 at the Deep site.
To validate estimates of rhizome growth determined from the marking method, we used a boundary mark- ing method. In a naturally formed bare area, a row of plastic poles (n = 4 to 6 poles) was deployed perpen- dicular to the growing edge of the seagrass bed. The plastic poles were driven into the sediments until the top of the pole was 1 cm above the water-sediment interface. A surveyor's flag was used to mark the loca- tion of the plastic poles. The distance between the cen- ter of each plastic pole and the nearest seagrass shoot was measured and recorded on an underwater slate. After a period of about 1 yr, the measurements were repeated and the annual elongation rate calculated.
Production calculations. Annual production esti- mates were calculated using numerical summation techniques. Daily leaf and rhizome production rates, calculated from marking plants, were multiplied by the number of days in the month. Monthly values were summed for the period January to December 1996 to derive annual estimates reflective of seasonal changes over the year. Gaps in the production data-set were filled by interpolating between existing data points assuming a linear response.
Calculation of carbon and nitrogen incorporation. Annual carbon and nitrogen incorporation in Thalassia testudinum was derived from leaf and rhizome growth and C:N ratios. For the purposes of this study, 'incorpo- ration' was strictly defined as the amount of carbon and nitrogen allocated to new tissues and should not be confused with metabolic requirements. Carbon and nitrogen content of leaf and rhizome tissues from Stn 2 during 1996 were analyzed using an elemental ana- lyzer (Carlo-Erba EA 1108). Monthly production rates were multiplied by the %C and N content to obtain estimates of C and N incorporation into newly formed tissues. Monthly estimates were summed as described above.
Statistical analyses. Statistical analyses were per- formed using SigmaStat (Jandel Scientific, San Rafael, CA) . Differences In daily .underwater PFD, water col- umn nitrate + nitrite, ammonium, chl a , and sediment NH4+ as well as Thalassia testudinum biomass, growth, and reproductive effort were analyzed using 2-way ANOVA with main effects of site and month. Calcula- tion of the percent change between sites or months was based on ANOVA means. Reproductive effort data were arc-sine transformed prior to analysis. Assump- tions of normality and homogeneity of variance were tested and when assumptions were not satisfied, analyses were performed on transformed data. How-
ever, the results of analyses on transformed and untransformed data were identical in all cases, so only untransformed analyses are presented. Statistical significance was set at the alpha ~ 0 . 0 5 level and Student-Newman-Keuls multiple comparisons test was used to further examine significant differences. Cor- relation analysis was used to examine relationships between plant growth and temperature, underwater PFD and daylength.
RESULTS
Physical and chemical parameters
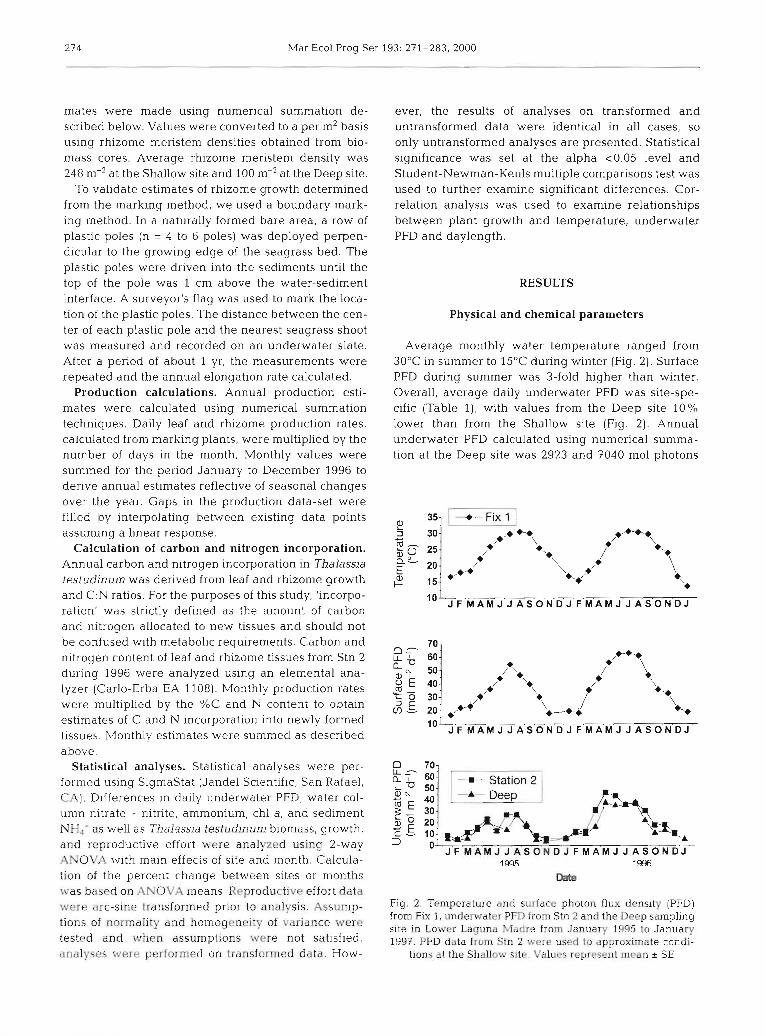
Average monthly water temperature ranged from 30°C in summer to 15OC during winter (Fig. 2). Surface PFD during summer was 3-fold higher than winter. Overall, average daily underwater PFD was site-spe- cific (Table l), with values from the Deep site 10% lower than from the Shallow site (Fig. 2). Annual underwater PFD calculated using numerical summa- tion at the Deep site was 2923 and 7040 m01 photons
70- f? 7 60:
so- /*., 8: 40- /+ + \ 'tm % 30- ,+X* *-. ; .L 20- ,F+
\ *Y
D 70- L L - 60.
3 0- J F M A M J J A S O N D J F M A M J J A S O N D J
Fig. 2. Temperature and surface photon flux density (PFD) from FIX 1, underwater PFD from Stn 2 and the Deep sampling site in Lower Laguna Madre from January 1995 to January 1997. PFD data from Stn 2 were used to approximate condi-
tions at the Shallow site. Values represent mean * SE
Kaldy & Dunton: Production, biomass and reproductive ecology in h a l a s s i a testudinum 275
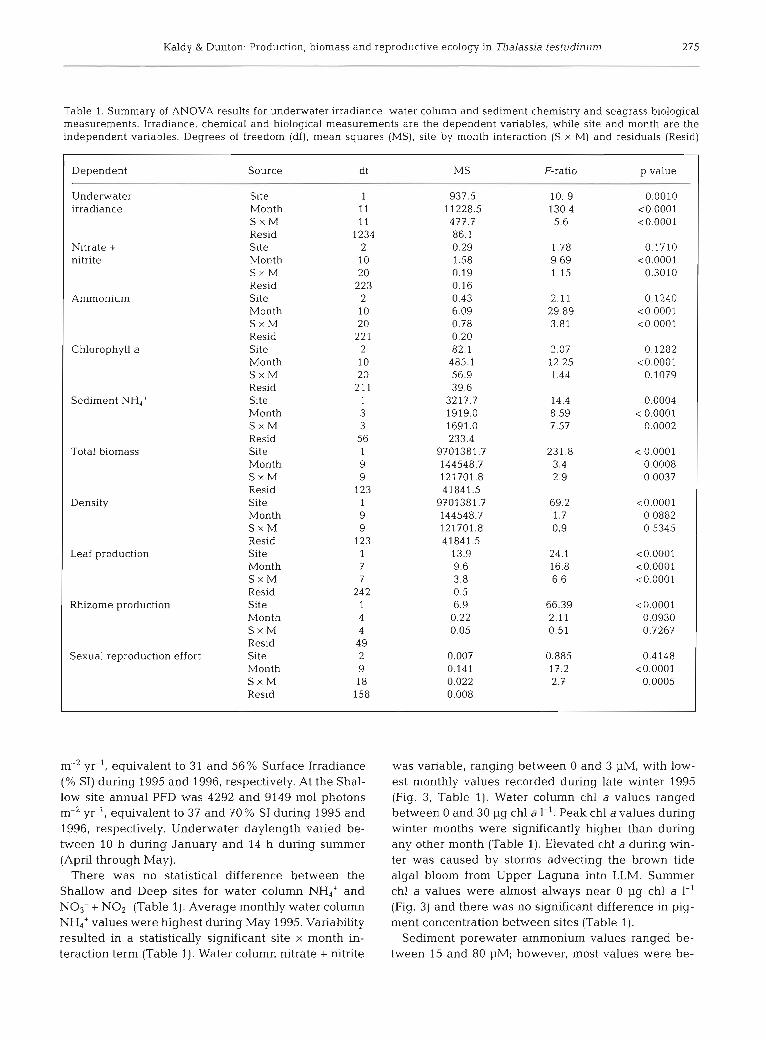
Table 1. Summary of ANOVA results for underwater irradiance, water column and sediment chemistry and seagrass biological measurements. Irradiance, chemical and biological measurements are the dependent variables, while site and month are the independent variables. Degrees of freedom (df), mean squares (MS), site by month interaction (S X M) and residuals (Resid)
Dependent
Underwater irradiance
Nitrate + nitrite
Ammonium
Chlorophyll a
Sediment NH,'
Total biomass
Density
Leaf production
Rhizome production
Sexual reproduction effort
Source
Site Month S x M Resid Site Month S X M Resid Site Month S x M Resid Site Month S x M Resid Site Month S x M Resid Site Month S x M Resid Site Month S X M Resid Site Month S X M Resid Site Month S x M Resid Site Month S x M Resid
F-ratio p value
10. 9 0.0010 130.4 <0.0001 5.6 <0.0001
m-2 yr-l, equivalent to 31 and 56% Surface Irradiance (% SI) during 1995 and 1996, respectively. At the Shal- low site annual PFD was 4292 and 9149 m01 photons m-2 yr-l, equivalent to 37 and 70 % S1 during 1995 and 1996, respectively. Underwater daylength varied be- tween 10 h during January and 14 h during summer (April through May).
There was no statistical difference between the Shallow and Deep sites for water column NH,' and NO3- + NO2- (Table 1). Average monthly water column NH4' values were highest during May 1995. Variability resulted in a statistically significant site X month in- teraction term (Table 1). Water column nitrate + nitrite
was variable, ranging between 0 and 3 pM, with low- est monthly values recorded during late winter 1995 (Fig. 3, Table 1). Water column chl a values ranged between 0 and 30 pg chl a 1-'. Peak chl a values during winter months were significantly higher than during any other month (Table 1). Elevated chl a during win- ter was caused by storms advecting the brown tide algal bloom from Upper Laguna into LLM. Summer chl a values were almost always near 0 pg chl a 1-' (Fig. 3) and there was no significant difference in pig- ment concentration between sites (Table 1).
Sediment porewater ammonium values ranged be- tween 15 and 80 pM; however, most values were be-
276 Mar Ecol Prog Ser 193: 271-283, 2000
J F M A M J J A S O N D J F M A M J J A S O N D J
Date
Fig. 3. Water column ammonium, nitrate + nitrite and chloro- phyll a values from the Shallow and Deep sampling sites mea- sured monthly between February 1995 and January 1997
Values represent mean 2 SE, n = 4
500 J FMAMJ J ASOND J FMAMJ J ASONDJ
1995 1996 Date
, loo-
0- . . . - . . . . . . . . . . . . . . - . . . - . J FMAMJ JASONDJ FMAMJ JASONDJ
1995 1996
Date
Fig. 4. Sediment porewater ammonium from the Shallow and Deep sampling sites measured quarterly between February 1995 and November 1996. Values represent mean r SE, n = 4
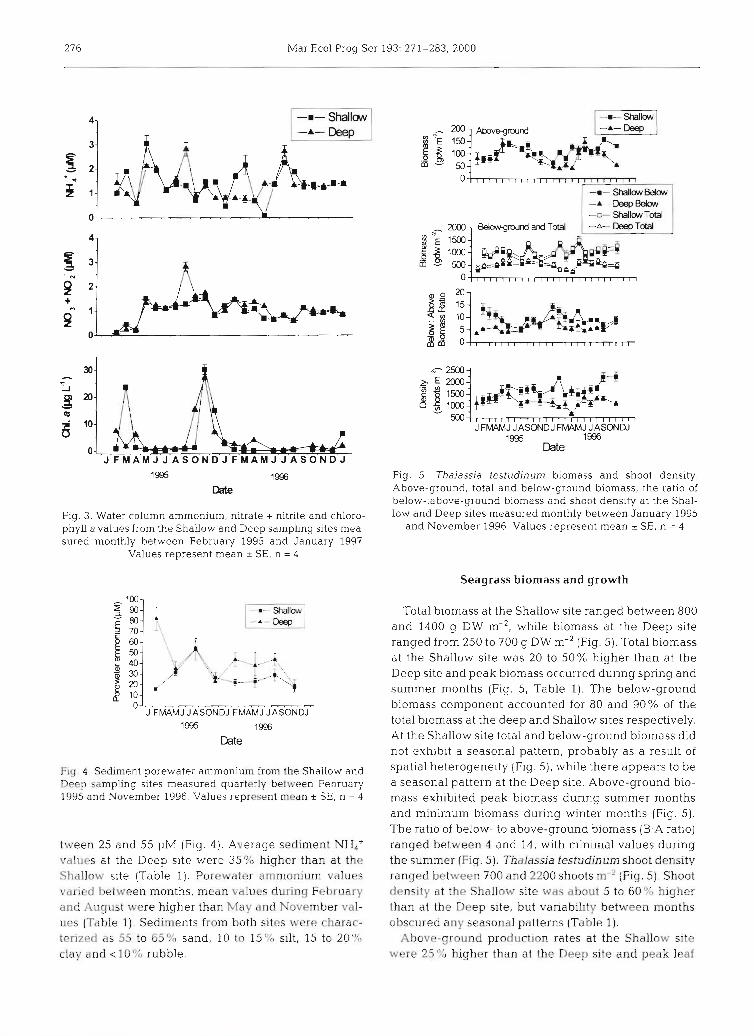
tween 25 and 55 pM (Fig. 4 ) Average sediment NH4+ values at the Deep site were 35% higher than at the Shallow slte (Table 1). Porewater amrnon~um values varied between months, mean vaIues during February and August were higher than May and November val- ues (Table 1) Sedirnents from both sites were charac- terized as 55 to 65% sand, 10 to 15% s~l t , 15 to 20%) clay and <10% rubble.
Fig. 5 . Thalassia testudinum biomass and shoot density. Above-ground, total and below-ground biomass, the ratio of below-:above-ground biomass and shoot density at the Shal- low and Deep sites measured monthly between January 1995
and November 1996. Values represent mean * SE, n = 4
Seagrass biomass and growth
Total biomass at the Shallow site ranged between 800 and 1400 g DW m-', while biomass at the Deep site ranged from 250 to 700 g DW m-2 (Fig. 5). Total biomass at the Shallow site was 20 to 50% higher than at the Deep site and peak biomass occurred during spring and summer months (Fig. 5, Table 1). The below-ground biomass component accounted for 80 and 90% of the total biomass at the deep and Shallow sites respectively. At the Shallow site total and below-ground biomass did not exhibit a seasonal pattern, probably as a result of spatial heterogeneity (Fig. S ) , while there appears to be a seasonal pattern at the Deep site. Above-ground bio- mass exhibited peak biomass during summer months and minimum biomass during winter months (Fig. 5). The ratio of below- to above-ground biomass (B:A ratio) ranged between 4 and 14, with minimal values during the summer (Fig. 5). Thalassia testudinum shoot density ranged between 700 and 2200 shoots m-' (Fig. 5). Shoot density at the Shallow site was about 5 to 60% higher than at the Deep site, but variability between months obscured any seasonal patterns (Table l).
Above-ground production rates at the Shallow site were 25% higher than at the Deep site and peak leaf

Kaldy & Dunton: Product~on, biomass and reproductive ecology in Thalassia testudinum 277
0 . 0 1 , , , , , , , , , , , , , , , , , , , , , , , , , 1 JFMAMJ JASONDJ FMAMJ JASONDJ
1995 1996
0 5 0 0
JFMAMJ JASONDJ FMAMJ JASONDJ
Fig. 6. Thalassia testudinum above- and below-ground area1 product~on rates at the Shallow and Deep sites measured monthly between February 1995 and December 1996 (above- ground) and January 1997 (below-ground). Values represent
mean * SE, n = 4
production rates (3.5 g DW m-2 d-') occurred during late summer with minimum production (0.4 g DW m-2 d-l) during the winter (Fig. 6). Differences between the Shallow and Deep sites and sampling dates were statis- tically significant (Table 1) . Below-ground production values exhibited similar patterns with values ranging between 0.1 and 1.7 g DW m-' d-' (Fig. 6). Rhizome production rates at the Shallow site were 50% higher than at the Deep site and although highest growth rates occurred in September the differences among all months were not statistically significant (Table 1). The annual rhizome elongation rate was estimated as 55 * 6 cm plant-' yr-' using rhizome marking and about 50 to 60 cm plant-1 yr-' using the boundary marking method.
Calculated production and C:N ratios
At the Shallow site leaf production during 1995 was 491 ~t 46 g DW m-2 yr-' and 614 _t 71 g DW m-' yr-' in 1996, a 20% difference between years. The rhizome growth rate during 1996 was 338 * 65 g DW m-' yr-l, which was 50% lower than leaf growth rates. Addi- tionally, there was a strong relationship between above- and below-ground growth (r = 0.79, n = 13). Leaves had peak carbon content during September and highest nitrogen during March (Table 2). Leaf C:N ratios were 21 to 25 during summer and about 14.6 during spring. Rhizome C:N ratios varied between 45 and 62, with lowest values during winter and spring (Table 2) .
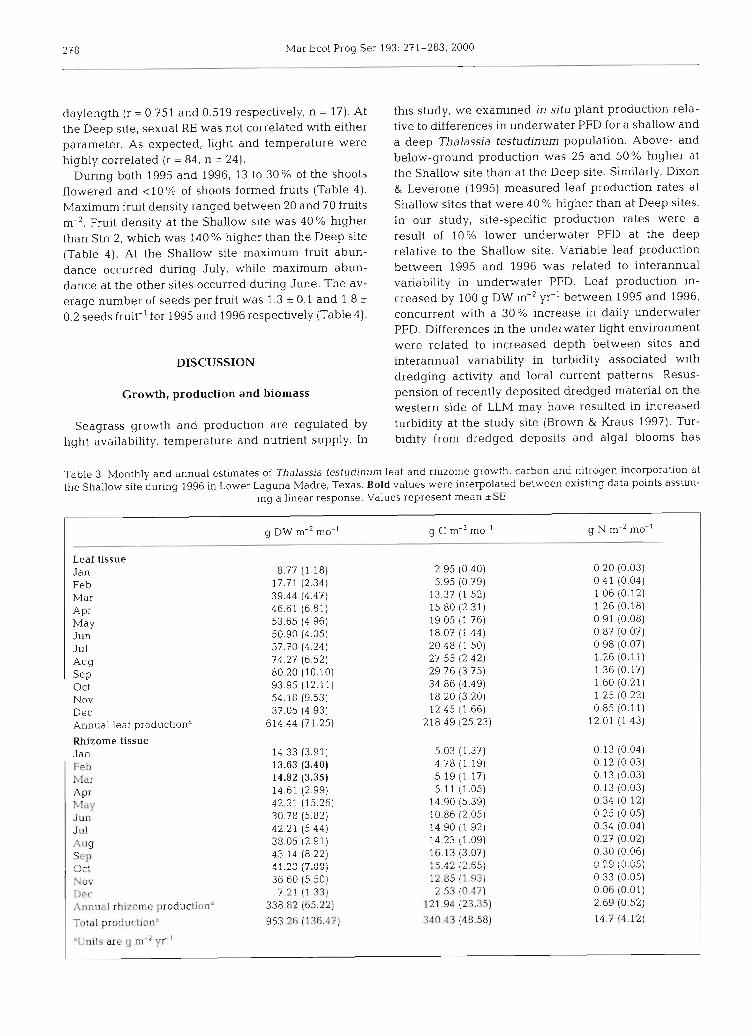
A detailed growth, carbon and nitrogen budget was developed for Thalassia testudinum in LLM during 1996 (Table 3). Annual production calculated using a numer- ical summation method on monthly estimates of above- and below-ground growth was 953 g DW m-' yr-' (Table 3). Monthly rates of leaf growth were estimated to range between 8 and 93 g DW m-' yr-l, with rhizome growth ranging between 13 and 42 g DW m-' yr-' (Table 3). Using the measured C:N, we calculated that T testudinum in LLM incorporates 340 g C m-' yr-l and 14.7 g N m-' yr-' into all of its tissues. In leaf tissue, C in- corporation ranged between 2.9 and 34.8 g C m-' mo-', while in rhizomes values ranged between 4.7 and 16.1 g C m-' mo-'. Nitrogen incorporation in leaf tissue varied between 0.2 and 1.6 g N m-' mo-l, while in rhizomes values fell between 0.6 and 0.3 g N m-' mo-' (Table 3).
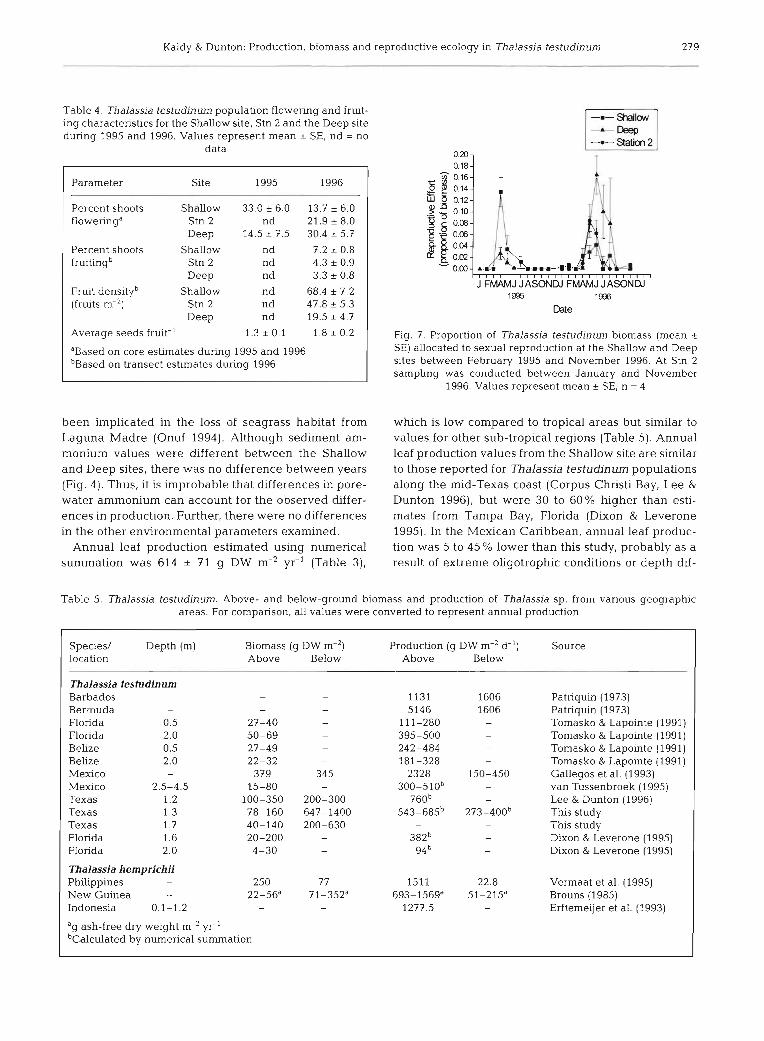
Reproductive ecology
Sexual reproductive effort (RE) ranged between 0 and 16% of above-ground biomass (Fig. 7). Statistical analysis of sexual RE indicated no significant differ- ences between the shallow and Deep sites, but sexual RE was higher during April, May and June than during any other month (Fig. 7, Table 1) . Sexual RE at the Shallow site was correlated with underwater PFD and
Table 2. Percent carbon, nitrogen and calculated C:N ratio for Thalassia testudinum leaf and rhizome tissues from Stn 2 in Lower Laguna Madre, Texas. Values are mean t SE, n = 4
Date Leaf Rhizome Leaf Rhizome Leaf Rhizome % C % C % N % N C:N C:N
Sep 1995 36.1 (0.3) 35.2 (0.5) 2.0 (0.0) 0.8 (0.1) 21.1 (0.1) 51.3 (5.7) Jan 1996 33.6 (0.4) 35.1 (0.2) 2.3 (0.0) 0.9 (0.1) 17.0 (0.2) 45.5 (3.9) Mar 1996 33.9 (0.4) 35.0 (0.5) 2.7 (0.1) 0.9 (0.1) 14.6 (0.3) 45.2 (6.5) Jun 1996 35.5 (0.8) 35.3 (0.3) l.? (0.1) 0.8 (0.1) 25.4 (0.5) 51.4 (3.1) Sep 1996 37.1 (0.7) 37.4 (0.2) l.? (0.1) 0.7 (0.1) 25.4 (1.0) 62.3 (5.7)
278 Mar Ecol Prog Ser 193: 271-283, 2000
daylength (r = 0.751 and 0.519 respectively. n = l ? ) . At the Deep site, sexual RE was not correlated with either parameter. As expected, light and temperature were highly correlated (r = 84, n = 24).
During both 1995 and 1996, 13 to 30% of the shoots flowered and ~ 1 0 % of shoots formed fruits (Table 4). Maximum fruit density ranged between 20 and 70 fruits m-2. Fruit density at the Shallow site was 40% higher than Stn 2, which was 140% higher than the Deep site (Table 4). At the Shallow site maximum fruit abun- dance occurred during July, while maximum abun- dance at the other sites occurred during June. The av- erage number of seeds per fruit was 1.3 ? 0.1 and 1.8 t 0.2 seeds fruit-' for 1995 and 1996 respectively (Table 4).
DISCUSSION
Growth, production and biomass
Seagrass growth and production are regulated by light availability, temperature and nutrient supply. In
this study, we examined in situ plant production rela- tive to differences in underwater PFD for a shallow and a deep Thalassia testudinum population. Above- and below-ground production was 25 and 50% higher at the Shallow site than a t the Deep site. Similarly, Dixon & Leverone (1995) measured leaf production rates at Shallow sites that were 40 % higher than at Deep sites. In our study, site-specific production rates were a result of 10% lower underwater PFD at the deep relative to the Shallow site. Variable leaf production between 1995 and 1996 was related to interannual variability in underwater PFD. Leaf production in- creased by 100 g DW m-* yr-' between 1995 and 1996, concurrent with a 30% increase in daily underwater PFD. Differences in the underwater light environment were related to increased depth between sites and interannual variability in turbidity associated with dredging activity and local current patterns. Resus- pension of recently deposited dredged material on the western side of LLM may have resulted in increased turbidity at the study site (Brown & Kraus 1997). Tur- bidity from dredged deposits and algal blooms has
Table 3. Monthly and annual estimates of Thalassia testudinum leaf and rh~zome growth, carbon and nitrogen incorporation at the Shallow site during 1996 in Lower Laguna Madre. Texas. Bold values were interpolated between existing data points assum-
ing a linear response. Values represent mean k SE
g DW m-' mo-' g C m-2 mo-' g N m-' mo-'
Leaf tissue Jan 8.77 (1.18) 2.95 (0.40) 0.20 (0.03) Feb 17.7 l (2.34) 5.95 (0.79) 0.41 (0.04) Mar 39.44 (4.47) 13.37 (1.52) 1.06 (0.12) A P ~ 46.61 (6.81) 15.80 (2.31) 1.26 (0.18) May 53.65 (4.96) 19.05 (1.76) 0.91 (0.08) Jun 50.90 (4.05) 18.07 (1.44) 0.87 (0.07) Jul 57.70 (4.24) 20.48 (1.50) 0.98 (0.07) *ug 74.27 (6.52) 27.55 (2.42) 1.26 (0.11)
S ~ P 80.20 (10.10) 29.76 (3.75) 1.36 (0.17) Oct 93.95 (12.11) 34.86 (4.49) 1.60 (0.21) Nov 54.18 (9.53) 18.20 (3.20) 1.25 (0.22) Dec 37.05 (4.93) 12.45 (1.66) 0.85 (0.11) Annual leaf productiona 614.44 (71.25) 218.49 (25.23) 12.01 (1.43)
Rhizome tissue Jan 14 33 (3 91) 5.03 (1.37) 0.13 (0.04) Feb 13.63 (3.40) 4.78 (1.19) 0.12 (0.03) h1 d r 14.82 (3.35) 5.19 (1.17) 0.13 (0.03) A P ~ 14.61 (2 99) 5.11 (1.05) 0.13 (0.03) hlay 42.21 (15.26) 14.90 (5.39) 0.34 (0.12) Jun 30.78 (5.82) 10.86 (2.05) 0.25 (0.05) Jul 42.21 (5 44) 14.90 (1.92) 0.34 (0.04) Aug 38.05 (2.91) 14.23 (1 09) 0.27 (0.02) Scp 43.14 (8 22) 16 13 (3.07) 0.30 (0.06) n -a "L L
A , 7 9 17 nnr " ' h 0 , '""1
< C A - I ? C C , ',,.',L ,L.".,)
n qn rn nc, V.&; , ( V . U d ,
Sov 36.60 (5.50) 12.85 (1.93) 0.33 (0.05) DOC 7 21 (1.33) 2 53 (0.47) 0.06 (0.01) Annual rhizome production" 338.82 (65.22) 121.94 (23.35) 2.69 (0.52)
Total production" 953.26 1136.47) 340.43 (48.58) 14.7 (4.12)
"Units are g m-"r '
Kaldy & Dunton: Production, biomass and reproductive ecology in Thalassia testudinum 279
Table 4. Thalassia testudinum population flowering and fruit- ing characteristics for the Shallow site, Stn 2 and the Deep site during 1995 and 1996. Values represent mean + SE, nd = no
data
Parameter Site 1995 1996
Percent shoots Shallow 33.0 i 6.0 13.7 + 6.0 floweringa Stn 2 nd 21.9 + 8.0
Deep 14.5 + 7.5 30.4 + 5.7
Percent shoots Shallow nd 7.2 + 0.8 fruitingb Stn 2 nd 4.3 + 0.9
Deep nd 3.3 + 0.8
Fruit densityb Shallow nd 68.4 + 7.2 (frults m-2) Stn 2 nd 47.8 + 5.3
Deep nd 19.5 + 4.7
Average seeds fruit-' 1.3 i 0.1 1.8 + 0.2
'Based on core estimates during 1995 and 1996 bBased on transect estimates during 1996
been implicated in the loss of seagrass habitat from Laguna Madre (Onuf 1994). Although sediment am- monium values were different between the Shallow and Deep sites, there was no difference between years (Fig. 4 ) . Thus, it is improbable that differences in pore- water ammonium can account for the observed differ- ences in production. Further, there were no differences in the other environmental parameters examined.
Annual leaf production estimated using numerical summation was 614 * 71 g DW m-2 yr-' (Table 3),
J FM4MJ JASONDJ FMAMJ JASONDJ 1995 1996
Date
Fig. 7. Proportion of Thalassia testudinum biomass (mean r SE) allocated to sexual reproduction at the Shallow and Deep sites between February 1995 and November 1996. At Stn 2 sampling was conducted between January and November
1996 Values represent mean ? SE, n = 4
which is low compared to tropical areas but similar to values for other sub-tropical regions (Table 5). Annual leaf production values from the Shallow site are similar to those reported for i"ha1assia testudinum populations along the mid-Texas coast (Corpus Christi Bay, Lee & Dunton 1996), but were 30 to 60% h g h e r than esti- mates from Tampa Bay, Florida (Dixon & Leverone 1995). In the Mexican Caribbean, annual leaf produc- tion was 5 to 4 5 % lower than this study, probably as a result of extreme oligotrophic conditions or depth dif-
Table 5. Thalassia testudinum. Above- and below-ground biomass and production of Thalassia sp. from various geographic areas. For comparison, all values were converted to represent annual production
Species/ Depth (m) Biomass (g DW m-2) Production (g DW m-2 d-') Source location Above Below Above Below
Thalassia testudinum Barbados - - 1131 1606 Patriquin (1973) Bermuda - - - 5146 1606 Patriquin (1973) Florida 0.5 27-40 111-280 Tomasko & Lapointe (1991) Florida 2.0 50-69 395-500 Tomasko & Lapointe (1991) Belize 0.5 27-49 - 242-484 - Tomasko & Lapointe (1991) Belize 2.0 22-32 181-328 - Tomasko & Lapointe (1991) Mexico - 379 345 2328 150-450 Gallegos et al. (1993) Mexico 2.5-4.5 15-80 300-510b van Tussenbroek (1995) Texas 1.2 100-350 200-300 760b Lee & Dunton (1996) Texas 1.3 78-160 647-1400 543-685b 273-400b This study Texas 1.7 40-140 200-630 This study Florida 1.6 20-200 382b Dixon & Leverone (1995) Florida 2.0 4-30 - 94 Dixon & Leverone (1995)
Thalassia hemprichii Philippines - 250 77 1511 22.8 Vermaat et al. (1995) New Guinea - 22-56a 71-352a 693-156ga 51-215a Brouns (1985) Indonesia 0.1-1.2 - - 1277.5 - Erftemeijer et al. (1993)
ag ash-free dry weight m-2 yr-l bCalculated by numerical summation

280 Mar Ecol Prog Ser 193: 271-283, 2000
Species Biomass Production Source ("/.l ("/.l
Thalassia - 10-13 Patriquin (1973) testudinum 48 10 Gallegos et al. (1993)
80-90 25-35 Thls study Thalassia - 5-15 Erftemeijer et al. (1993) hernprichii 24 1.5 Vermaat et al. (1995)
ferences (Table 5; van Tussenbroek 1995). Seagrass growth and production from LLM were within the range of literature values reported and were site-spe- cific over relatively small spatial scales (e.g. several km). Additionally, growth patterns were correlated with local environmental conditions.
Annual rhizome product~on based on long-term in situ measurements was calculated as 121 + 23 g C m-2 yr-', with monthly values ranging between 2.5 and 16.1 g C m-2 mo-' (Table 3). In the LLM Thalassia tes- tudinum rhizome growth accounted for 25 to 35% of total production and 80 to 90% of the total biomass. Additionally, rhizome production was tightly coupled to leaf production (r = 0.79, n = 13). In comparison, sev- eral researchers estimate that below-ground tissues account for 10 to 15% of whole plant production, with some estimates as low as 1 . 5 % (Table 6) Below- ground production estimates from this study are sub- stantially higher than previous reports for T testudi- n u m and are near the upper end of the range reported for seagrasses in general (Hillman et al. 1989). Conse- quently, studies that focus exclus~vely on leaf produc- tion underestimate total plant production by ignoring the contribution of the below-ground component.
Both rhizome and boundary marking methods pro- vided comparable estimates of annual rhizome elonga- tion (ca 60 cm yr-l). In contrast, Duarte (1991a) using allometric inethods estimated horizontal rhizome elon- gation in Thalassia testudinum at 150 cm yr-l, while experimental work in Mexlco (Gallegos et a1 1993) predicted rhizome elongation at 20 to 35 cm yr-' Future studies of seagrass production ecology require innovative methods for assessing root and vertical rhi- zome production. Caution must be used when inter- preting rhizome growth rates, because rates at the edge of bare patches may not reflect rhizome growth within the meadow.
Total annudl production, calculated for the Shallow site (340 g C m-' yr.") was low relative to earlier pub- lished estimates (McRoy & McMillan 1977, Zieman & Wetzel 1980). However, annual production can be overestimated when short-term studies of seagrass productivity conducted during periods of high produc-
Table 6 . Contribution of below-ground tissues to total biomass tion and favorable weather (i.e. summer) are extrapo- and production on a percentage basis lated to a year. Data from this study indicate that sum-
mer leaf production rates can be 90 % higher than win- ter production (Table 3). Thus, seasonal changes must be incorporated into annual estimates of seagrass pro- duction. Summation methods provide accurate pro- duction estimates (Herzka & Dunton 1998) As a conse- quence of interannual variability, long-term studies encompassing more than 1 annual cycle are required to adequately estimate annual production. Area1 pro- duction calculated from average shoot production (g DW shoot-' d-') and shoot density (shoots m-2) is sensitive to inaccuracies in density estimates. Prelimi- nary work indicates that because of spatial hetero- geneity at least ten 15 cm diameter core samples are required to obtain reasonable estimates of Thalassia testudinum shoot density (Kaldy unpubl. data).
Biomass values ranging between 200 and 1400 g DW m-2 are consistent with previous reports for Thalassia testudinum from around the world (Table 5). The reduced biomass at the Deep site is also consistent with other studies that examined differences in depth (Table 5). Seagrass biomass often decreases near the deep edge of beds; however, site-specific character reversal has also been documented (Dawes & Tomasko 1988, Duarte 1991b, Tomasko & Lapointe 1991). At the Shallow site variability between samples obscured any seasonal biomass pattern that may have been present. Seasonal patterns of total biomass at the Deep site were a direct result of seasonal patterns in both the above- and below-ground tissues. In contrast, seasonal patterns in total T. testudinum biomass from the mid- Texas coast (Corpus Christi Bay [CCB]) were the result of seasonal changes in leaf biomass (Lee & Dunton 1996). Local environmental conditions, particularly temperature, underwater PFD and nutrient availabil- ity, probably regulate observed differences in biomass patterns between northern (CCB) and southern (LLM) T testudinum populations.
Reproductive ecology
The phenology of flowering and fruiting Thalassia testudinum beds in Texas was similar to the patterns described for Florida populations (Durako & Moffler 1987). Flowering was distinctly seasonal, with 13 to 30% of the shoots flowering during April and May. Detailed examination of leaf and floral peduncle scars found that 28 to 38% of T. testudinum short shoots flower at least once during their life-span (Kaldy et al. 1999). Comparable flowering intensity has been re- ported from Florida and the Caribbean (Grey & Moffler 1978, Moffler et al. 1981, Durako & Moffler 1985, 1987, Gallegos et al. 1992). Flower fertilization probably
Kaldy & Dunton: Production, biomass and reproductive ecology in 73alass1a testudnurn 281
occurred during late May and early June, since fruit development was noted in mid-June. Fruits matured and ripened during June and July and all fruit had dehisced by the end of August (Kaldy 1997). Floral pri- mordia were present in a few samples taken during winter, indicating that floral development can occur during other times of the year (Durako & Moffler 1987), which contradicts the findings of van Tussenbroek (1994) working in Mexico. But only a few shoots in LLM exhibited flower primordia during winter, sug- gesting that these shoots were precocious.
Sexual RE provides a method of quantifying alloca- tion of biomass to sexual reproduction and may be a useful measure in future work, because it provides a first approximation of energy investment (Willson 1983, Reekie & Bazzaz 1987). Thalassia testudinum flowers and fruits accounted for up to 16 % of the total above-ground biomass, similar to estimates of terres- trial grass (Reekie & Bazzaz 1987). Clonal growth is probably less of an energy investment than sexual re- production, because young clonal shoots probably be- come photosynthetically self-sufficient quickly, where- as parental shoots provide stored reserves which seedlings may use for up to 2 mo before becoming pho- tosynthetically self-sufficient (Kaldy & Dunton 1999).
Flowering is energetically expensive (Hickman & Pitelka 1975, Reekie & Bazzaz 1987, Antos & M e n 1994) and a wide variety of plants exhibit reduced growth rates during fruit and seed production (Brock 1983, Willson 1983, Lee 1988). Leaf production data plotted to represent leaf formation rates exhibit a 60 to 80 % increase subsequent to fruit dehiscence (Kaldy et al. 1999). Additionally, carbon and nitrogen allocation patterns change during sexual reproduction (Haig & Westoby 1988, Spencer et al. 1994, Saulnier & Reekie 1995). Physiological studies have found that photosyn- thesis in reproductive structures can supply up to 50% of the carbon required for fruit production (Bazzaz & Carlson 1979, Bazzaz et al. 1979, Williams et al. 1985). As a result, estimates of seagrass reproductive effort based on biomass allocation probably represent mini- mum estimates of energy investment. Critical evalua- tion of reproductive energy balance will require mea- sures of biomass allocation, whole plant respiration and reproductive photosynthesis (Reekie & Bazzaz 1987).
Daylength and temperature are important factors regulating endogenous rhythms including reproduc- tion (Gwinner 1986, Liining 1993, Liining & Kadel 1993). Several studies have concluded that temperature is the primary control of seagrass flowering (McMillan 1976, 1980, 1982, Phillips et al. 1981). Lee & Dunton (1996) reported that the interaction between water tem- perature and underwater PFD was important in regu- lating seasonal leaf elongation in Thalassia testudinum. In this study, leaf growth was correlated with tempera-
ture, underwater PFD and daylength (r = 0.71, 0.58 and 0.54 respectively, n = 22) at the Shallow site and with temperature and daylength (r = 0.83 and 0.86 respec- tively, n = 10) at the Deep site. Rhizome growth at the Shallow site was correlated with temperature and underwater PFD (r = 0.58 and 0.54, n = 13), but not daylength. Sexual RE exhibited a positive correlation with underwater PFD and with daylength (r = 0.75 and 0.52, n = 17). Peak sexual RE occurred during April and May, subsequent to average daylength increasing from 12 to 14 h d-l. Thus, changes in temperature, daylength and light levels appear to influence growth and flower- ing in T. testudinum; however, determining which fac- tor controls seagrass growth and reproduction will be a complicated task. The auto-correlation between light and temperature ( r = 0.84, n = 24) prevents accurate assessment of the relationship between reproduction and the environment. Rigorous experimental work, involving controlled culture conditions will be required to determine which factors regulate seasonal patterns of seagrass growth and reproduction.
Carbon and nitrogen incorporation
Using measured tissue growth rates and C:N ratios, we estimated the amount of carbon and nitrogen incor- porated into new tissues. As a preliminary estimate, Thalassia testudinum incorporated 340 g C m-2 yr-I and 15 g N m-2 yr-' into plant tissues (Table 3), which is equivalent to 1.1 X 10' kg C yr-' and 4.8 X 10⁵ kg N yr-l for all the Thalassia in LLM. However, these estimates do not reflect the plants, metabolic requirements, which are probably much higher. Lee & Dunton (1999) estimated annual N acquisition to be 53 g N m-2 yr-l in LLM using whole-plant N uptake experiments and sug- gested that >50% of N uptake was not incorporated into biomass. Monthly values of carbon incorporation are comparable to rates calculated from photosynthetic work (Herzka & Dunton 1998); however, little work has been done on nitrogen assimilation in T testudinum. We estimate that in LLM, the production of new tissues requires about 10 to 60 mg N m-' d-l, with minimum re- quirements during winter. In comparison, Moriarity &
Boon (1989) suggest that daily nitrogen requirements of most seagrasses range between 10 and 450 mg N m-2 d-' (1 1 and 70 mg N m-2 d-l for Thalassia sp.).
SUMMARY AND CONCLUSIONS
Long-term monitoring of seagrass biomass, produc- tion and reproductive ecology concurrent with envi- ronmental parameters indicates that seasonal fluctua- tions are the dominant controls on seagrass growth
282 Mar Ecol Prog Ser 193: 271-283, 2000
and production. Local environmental conditions, par- ticularly temperature, underwater PFD and nutrient availability, probably regulate observed differences in biomass patterns between Thalassia testudinum popu- la t ion~. Assessment of total plant productivity must incorporate seasonal patterns, reproductive costs and the large fraction of production occurring in the below- ground tissues. Failure to adequately estimate rhizome growth dramatically underestimates seagrass produc- tion. The phenology of flowering and fruiting of T. tes- tudinum beds in Texas was distinctly seasonal, with 13 to 30 % of the shoots flowering during April and May. The annual flowering event represents a substantial resource (e.g. carbon and nitrogen) investment, which may influence individual plant production.
Acknowledgements. This work was completed in partial ful- fillrnent of the PhD requirements from the University of Texas at Austin. Marine Science Department by J.E.K. C. Chiscano, S. Herzka and K. S. Lee provided valuable comments and assisted in the field. K. Jackson, K. Major, H. Miller, S. Schonberg and C. Weilhoffer provided comments and provided assistance. N. Fowler, E. Ingall, P. Montagna and C. Onuf provided valuable comments and discussion. D. Hockaday at UT-Pan American Coastal studies lab provided laboratory space. C. Brown, for- merly at Conrad Blucher Institute, kindly provided terrestrial irradiance and temperature data. Four anonymous reviewers prov~ded valuable comments which improved the manuscript. This work was supported by grants to K.H.D. from the Texas Higher Education Coordinating Board Advanced Research Program (Grant no. 003658-419) and the EPA Gulf of Mexico Program (Grant no. MX994713-95-2). Salary support was pro- vided in part by the UTMSI Lund Fellowship awarded to J.E.K. This is contribution no. 1090 from UTMSI.
LITERATURE CITED
Antos JA, Allen GA (1994) Biomass allocation among repro- ductive structures in the dioecious shrub Oemleria cerasi- formis-a functional interpretation. J Ecol 82.21-29
Bazzaz FA, Carlson RW (1979) Photosynthetic contribution of flowers and seeds to reproductive effort of an annual colo- nizer. New Phytol 82:223-232
Bazzaz FA, Carlson RMr, Harper JL (1979) Contribution to reproductive effort by photosynthesis of flowers and fruits. Nature 279:554-555
Brock MA (1983) Reproductive allocation in annual and perennial species of the submerged aquatic halophyte Ruppia. J Ecol71:811-818
Brouns JWM (1985) A comparison of the annual production and biomass in three monospecific stands of the seagrass Tha- lassia hemprichii (Ehrenb.) Aschers. Aquat Bot 23:149-175
Brown CA, Kraus NC (1997) Environmental monitoring of dredging and processes in Lower Laguna Madre. Texas. Eina1 Donnrt 1JS Aymy Cfirpg ~f E ~ ~ ~ F . P P ~ F : r ) i ~ t r l ~ t , a --*U- -'-r -- h
Galveston, Cialveston, TX, TAMU-CC-CBI-96-01 Burd AB, Eldridge PM 11997) Modeling the effects of incident
light and sediment geochemistry on seagrass production. Abstract 14th Estuarine Research Federation Conference. Providence, R I Estuarine Research Federation, Port RP- public, MD
Czerny AB, Dunton KH (1995) n e effects of in situ irradiance
reduct~on on the growth of two subtropical seagrasses, Thalassia testudinwn and Halodule wnghtii. Estuaries 18: 418-427
Dawes CJ, Tomasko DA (1988) Depth distribution of Thalas- sia testudinum in two meadows on the west coast of Florida; a difference in effect of light availability. PSZN I: Mar Ecol9:123-130
Dennison WC (1990a) Leaf production. In: Phillips RC, McRoy CP (eds) Seagrass research methods. UNESCO, Paris, p 77-80
Dennison WC (1990b) Rhizome/root production. In: PhiIlips RC, McRoy CP (eds) Seagrass research methods. UNESCO, Paris, p 81-82
Dixon LK. Leverone JR (1995) Irradiance requirements of Thalassia testudinurn in Tampa Bay, Florida. Final Report to Surface Water Improvement and Management Pro- gram, Southwest Florida Water Management District, Tampa, FL. Mote Marine Laboratory Tech Rep 45
Duarte CM (1991a) Allometric scaling of seagrass form and productivity. Mar Ecol Prog Ser 7?:289-300
Duarte CM (1991b) Seagrass depth limits. Aquat Bot 40. 363-377
Dunton KH (1994) Seasonal growth and biomass of the sub- tropical seagrass Halodule wright~i in relation to continu- ous measurements of underwater irradiance. Mar Biol 120:4?9-489
Dunton KH (1996) Photosynthetic production and biomass of the subtropical seagrass Halodule wnghtii along an estu- arine gradient. Estuaries 19:436-447
Durako MJ, Moffler MD (1985) Observations on the repro- ductive ecology of Thalassia testudinum (Hydrochari- taceae). 111 Spatial and temporal variations within a sea- grass bed. Aquat Bot 22:265-276
Durako MJ, Moffler MD (1987) Factors affecting the repro- ductive ecology of Thalassia testudinum (Hydrochari- taceae). Aquat Bot 27:?9-95
Erftemeijer PLA, Osinga R, Mars AE (1993) Primary production of seagrass beds in South Sulawesi (Indonesia): a compari- son of habitats, methods and species. Aquat Bot 4657-90
Folk RL (1964) Petrology of sedimentary rocks. Hemphill's Press, Austin, TX
Gallegos ME, Merino M, Marba N, Duarte CM (1992) Flower- ing of Thalassia testudinurn Banks ex Konig in the Mexi- can Caribbean: age-dependence and interannual variabll- ity. Aquat Bot 43-249-255
Gallegos ME, Merino M, Marba N, Duarte CM (1993) Bio- mass and dynamics of Thalassia testudinum in the Mexi- can Caribbean: elucidating rhizome growth. Mar Ecol Prog Ser 95:185-192
Grey WF, Moffler MD (1978) Flowenng of the seagrass Tha- lassia testudinum (Hydrocharitdceae) in the Tampa Bay, Florida area. Aquat Bot 5:251-259
Gwinner E (1986) Circannual rhythms. Springer-Verlag, Berlin Haig D, Westoby M (1.988) Inclusive fitness, seed resources
and maternal care. In: Lovett-Doust J, Lovett-Doust L (eds) Plant reproductive ecology. Oxford University Press, Ox- ford, p 60-79
Herzka SZ, Dunton KH (1997) Seasonal photosynthetic pat- terns of the seagrass Thalassia testudinum in the western Gi~lf nf Mmirn Mar Ern1 Pro5 Ser 152:10.3-l17
Herzka SZ, Dunton KH (1998) Light and carbon balance in the seagrass Thalassia testudinum: evaluation of current production models. Mar Biol 132:711-721
Hickman JC, Pltelka LF (1975) Dry weight indicates energy allocation in ecological strategy analysis of plants. Oecolo- gia 21:117-121
HiYlman K, Walker DI. Larkum AWD, McCornb AJ (1989) Pro-

Kaldy & Dunton: Productlon, b~omass and reproduct~ve ecology In Thalassla testudinum 283
duct~vity and nutnent l~mitation In. Larkum AWD. McComb AJ, Shepard SA (eds) B~ology of seagrasses. Elsevier, Amsterdam p 635-685
Kaldy JE (1997) Productlon dynamics, reproductlve ecology and demography of Thalassia testudinum (turtle grass) from the Lower Laguna Madre, Texas. Doctoral dlsserta- tlon, University of Texas at Austin, Austin, TX
Kaldy JE, Dunton KH (1999) Ontogenet~c photosynthet~c changes, dispersal and surv~val of Thalassla testudlnunl (turtle grass) seedllngs in a sub-troplcal lagoon J Exp Mar Blol Ecol 240.193-212
Kaldy JE, Fowler N, Dunton KH (1999) Critlcal assessment of Thalassia testudinum (turtle grass) aging techniques- lm- plicatlons for demographic inference Mar Ecol Prog Ser 181 279-288
Lee KS, Dunton KH (1996) Production and carbon reserve dynamlcs of the seagrass Thalassja testudinum In Corpus C h n s t ~ Bay, Texas, USA. Mar Ecol Prog Ser 143.201-210
Lee KS, Dunton KH (1997) Effects of in situ light reduction on the maintenance, glob\-th and part~tloning of carbon resources In Thalassla testudjnum Banks ex Konig J Exp Mar Biol Ecol 210 53-73
Lee KS, Dunton KH (1999) Inorganic nitrogen acqu~s~ t ion in the seagrass Thalassia testudinum: development of a whole- plant nltrogen budget. Limnol Oceanogr 44: 1204-1 215
Lee TD (1988) Patterns of frult and seed production. In. Lovett-Doust J , Lovett-Doust L (eds) Pldnt reproductive ecology. Oxford University Press, Oxford, p 179-202
Lewis RR, Phll l~ps RC (1980) Occurrencc of seeds and seedllngs of Thalassia testudlnum Banks ex Konig in the Florida Keys (USA). Aquat Rot 9.377-380
Liining K (1993) Environmental and Internal control of sea- sonal growth In seaweeds. Hydrobiologla 260/261 1-14
Liining K, Kadel P (1993) Daylength range for circannual rhythmlclty ln Pterygophora californlca (Alanaceae, Phaeo- phyta) and synchronizat~on of seasonal growth by d a y length cycles in several other brown algae Phycologia 32. 379-387
McMillan C (1976) Experimental s t u d ~ e s on flowering and reproduct~on in seagrasses Aquat Bot 2:87-92
McMlllan C (1980) Flowering under controlled c o n d ~ t ~ o n s by Cymodocea serrulata, Walophila stjpulacea, Syr-lngodium isoetifol~um, Zoslera capensis and Thalassia hemprichlf from Kenya. Aquat Bot 8:323-336
McMdlan C (1982) R e p r o d ~ ~ c t ~ v e physiology of troplcal sea- grasses. Aquat Bot 14 245-258
McRoy CP, McMillan C (1977) Production ecology and physi- ology of seagrasses. In. h4cRoy CP, Helfferich C (eds) Sea- grass ecosystems: a s c ~ e n t ~ f ~ c perspectlve. Marcel Dekker, Inc, New York, p 53-87
Moffler MD, Durako MJ, Grey WF (1981) Observat~ons on the reproductive ecology of Thalassia testudinum (Hydro- charitacede). Aquat Bot 10.183-187
Monarty DJW, Boon PI (1989) Interactions of seagrasses w ~ t h sedlment and water In Larkum AllVD, McComb AJ, Shep- ard SA (eds) Biology of seagrasses. Elsevier, Amsterdam, p 500-535
Onuf CP (1994) Seagrasses, dredging and light In Laguna Madre, Texas, USA. Estuar Coast Shelf Sci 39.75-91
Onuf CP (1.996) Biomass patterns In seagrass meadows of the Laguna Madre, Texas. Bull Mar Sci 58.404-420
Orpurt PA, Boral LL (1964) The flowers, fruits and seeds of Thalassla testudinum Koen~g . Bull Mar Sci Gulf Carlbb 14: 296-302
Parsons TR, Malta Y, Lalli CM (1984) A manual of chemlcal and biological methods for seawater analysis. Pergamon Press, New York
Editonal responsibility: Otto Kinne (Editor), Oldendorf/L~lhe, Germany
Patnquln D (1973) Est~mation of groxvth rate, product~on and age of the manne anglosperm Thalasaa testudlnum Konlg Canbb J Scl 13 111-123
Phill~ps RC McM~llan C, Brldges KW (1981) Phenology and reproduct~vc phys~ology of Thalassla testudinum from the western trop~cal Atlant~c Aquat Bot l 1 263-277
Plrc H (1989) Seasonal changes In soluble carbohydrates, starch and energy content In Mediterranean seagrasses PSZN I Mar Ecol 10 97-105
Quammen ML, Onuf CP (1993) Laguna Madre seagrass changes contlnue decades after sal~nlty reduct~on Estuar- les 16 302-310
R e e k ~ e EG, Bazzaz FA (1987) Reproductive effort In plants I Carbon allocation to reproduct~on Am Nat 129 876-896
Saulnler TP Reekle EG (1995) Effect of reproduct~on on n~ t ro - gen allocation and carbon galn In Oenothera blennls J Ecol83 23-29
Short FT (1980) A s ~ m u l a t ~ o n model of the seagrass produc- tlon system In Philllps RC McRoy CP (eds) Handbook of seagrass blology an ecosystem perspectlve Garland STPM Press, Ncxv York p 277-295
Spencer D Anderson L, Ksander G , Klalne S, Balley F (19C)4) Vegetative propagule product~on and allocat~on of carbon and n~ t rogen by monoeclous Hydnlla vertlcullata (Lf) Royle grown at two photopenods Aquat Rot 48 121-132
Texas Department of Water Resources (1982) The lnfluencc of freshwater Inflows upon the malor bays and estuarlr 5 of the Texas Gulf coast V01 8 Execut~ve summary (2nd edn) Texas Department of Wdter Resources, Austln, TX
Tornasko DA, Lapolnte BE (1991) Productlv~ty and blomass of Thalassia testudinum as related to water column nutr~c nt avallabll~ty and e p ~ p h v t e levels f~eld obser~at lons and experimental s t u d ~ e s Mar Ecol Prog Ser 75 9-17
Tomllnson PB (1969) On the morphology and anatom\ of TLII tle grass, Thalassla Lestudlnum (Hydrochar~taceat.) Ill Flolal morphology and anatomy Bull Mar Sci 19 286 305
Val~ela l (1995) Marlne ecolog~cal processes Spnnger New York
van Tussenbroek B1 (1994) Aspects of the reproductlve ecol- ogy of Thalassla tesludlnum In Puerto Morelos Reef Lagoon, Mex~co Bot Mar 37 413-419
van Tussenbroek B1 (1995) Thalassza testudlnum leaf dynam- ~ c s In a Mex~can Car~bbean coral reef lagoon Mar Blol 122 33-40
Vermaat JE, Agawln NSR, Duarte CM, Fortes MD, Marba N, Un JS (1995) Meadow maintenance growth and produc- t lv~ty of a m ~ x e d Phill~plne seagrass bed lMar Ecol Prog Ser 124 215-225
Wetzel RL, Neckles HA (1986) A model of Zostera mannd L photosynthes~s and growth simulated effects of selected phys~cal-chem~cal variables and b~o log~ca l lnteractlons Aquat Bot 26 307-323
Wlll~ams K Koch GW Mooney HA (1985) The carbon balance of flowers of Diplacus aurantlacus (Scrophulariaceae) Oecologla 66 530-535
Wlllson MF (1983) Plant reproduct~ve ecology John Wlley & Sons, New York
Z~egler S, Benner R (1999) Ecosystem metabol~sm In a sub- tropical, seagrass-dom~nated lagoon Mar Ecol Prog Ser 180 149-160
Z ~ e m a n J C (1974) methods for the study of the growth and productlon of turtle grass, Thalassla testudlnum Konlg Aquaculture 4 139-143
Zleman J C Wetzel RG (1980) Productlv~ty In seagrasses methods and rates In Phdllps RC McRoy CP (eds) Hand- book of seagrass b~ology an ecosystem perspectlve Gar- land STPM Press, New York, p 87-116
Submitted. September 17, 1998; Accepted. August 25, 1999 Proofs recelved from author(s). February 8, 2000