effective: january 2019 - alpha technologiesfig. 1-1, alpha xd system architecture - typical hfc...
TRANSCRIPT

Alpha XDUser Manual
Effective: January 2019

Safety NotesAlpha considers customer safety and satisfaction its most important priority. To reduce the risk of injury or death and to ensure continual safe operation of this product, certain information is presented differently in this manual. Alpha tries to adhere to ANSI Z535 and encourages special attention and care to information presented in the following manner:
There may be multiple warnings associated with the call out. Example:
ATTENTION provides specific regulatory/code requirements that may affect the placement of equip-ment and /or installation procedures.
ATTENTION:
NOTICE provides additional information to help complete a specific task or procedure. NOTICE:
ELECTRICAL HAZARD WARNING provides electrical safety information to PREVENT INJURY OR DEATH to the technician or user.
WARNING! ELECTRICAL HAZARD
FUMES HAZARD WARNING provides fumes safety information to PREVENT INJURY OR DEATH to the technician or user.
WARNING! FUMES HAZARD
FIRE HAZARD WARNING provides flammability safety information to PREVENT INJURY OR DEATH to the technician or user.
WARNING! FIRE HAZARD
This WARNING provides safety information for both Electrical AND Fire Hazards.
WARNING! ELECTRICAL & FIRE HAZARD
CAUTION provides safety information intended to PREVENT DAMAGE to material or equipment.
CAUTION!
GENERAL HAZARD WARNING provides safety information to PREVENT INJURY OR DEATH to the technician or user.
WARNING! GENERAL HAZARD

3035-512-B0-001, Rev. A6 (01/2019)
Alpha XDUser Manual035-512-B0-001, Rev. A6
Effective Date: January 2019© 2019 by Alpha Technologies Services, Inc.
DisclaimerImages contained in this manual are for illustrative purposes only. These images may not match your installation.
Operator is cautioned to review the drawings and illustrations contained in this manual before proceeding. If there are questions regarding the proper operation of this software, please contact Alpha Technologies Services, Inc. or your nearest Alpha representative.
Alpha shall not be held liable for any damage or injury involving its enclosures, power supplies, generators, batteries, other hardware, or software if used or operated in any manner or subject to any condition not consistent with its intended purpose or is installed or operated in an unapproved manner or improperly maintained.
Contact InformationSales information and customer service in USA(7AM to 5PM, Pacific Time): 360 392 2217
Complete technical support in USA(7AM to 5PM, Pacific Time or 24/7 emergency support): 800 863 3364
Website: www.alpha.com

4 035-512-B0-001, Rev. A6 (01/2019)
Table of Contents1.0 Introduction. . . . . . . . . . . . . . . . . . . . . . . . . . . . . . . . . . . . . . . . . . . . . . . . . . 7
1.1 Alpha XD Features . . . . . . . . . . . . . . . . . . . . . . . . . . . . . . . . . . . . . . . . . . . . 71.2 Alpha XD System Architecture . . . . . . . . . . . . . . . . . . . . . . . . . . . . . . . . . . . . . . 81.3 Alpha XD Components . . . . . . . . . . . . . . . . . . . . . . . . . . . . . . . . . . . . . . . . . . 91.4 Alpha XD System Deployment . . . . . . . . . . . . . . . . . . . . . . . . . . . . . . . . . . . . . . 9
2.0 Getting Started . . . . . . . . . . . . . . . . . . . . . . . . . . . . . . . . . . . . . . . . . . . . . . . 102.1 Log In to Alpha XD . . . . . . . . . . . . . . . . . . . . . . . . . . . . . . . . . . . . . . . . . . . 102.2 Alpha XD Tab. . . . . . . . . . . . . . . . . . . . . . . . . . . . . . . . . . . . . . . . . . . . . . 102.3 Basic Account Actions . . . . . . . . . . . . . . . . . . . . . . . . . . . . . . . . . . . . . . . . . 11
Changing the Account Password. . . . . . . . . . . . . . . . . . . . . . . . . . . . . . . . . . 11Log Out of Alpha XD . . . . . . . . . . . . . . . . . . . . . . . . . . . . . . . . . . . . . . . . 11
3.0 Provisioning Devices . . . . . . . . . . . . . . . . . . . . . . . . . . . . . . . . . . . . . . . . . . . . 123.1 Configuring and Using Templates . . . . . . . . . . . . . . . . . . . . . . . . . . . . . . . . . . . 123.2 Template Administration . . . . . . . . . . . . . . . . . . . . . . . . . . . . . . . . . . . . . . . . 12
Viewing Templates . . . . . . . . . . . . . . . . . . . . . . . . . . . . . . . . . . . . . . . . . 13Modifying Templates . . . . . . . . . . . . . . . . . . . . . . . . . . . . . . . . . . . . . . . . 13Cloning Templates . . . . . . . . . . . . . . . . . . . . . . . . . . . . . . . . . . . . . . . . . 14Applying Templates. . . . . . . . . . . . . . . . . . . . . . . . . . . . . . . . . . . . . . . . . 14
3.3 Configurable Parameters. . . . . . . . . . . . . . . . . . . . . . . . . . . . . . . . . . . . . . . . 16Information Tab . . . . . . . . . . . . . . . . . . . . . . . . . . . . . . . . . . . . . . . . . . . 16Property Tab . . . . . . . . . . . . . . . . . . . . . . . . . . . . . . . . . . . . . . . . . . . . 17Analog Tab . . . . . . . . . . . . . . . . . . . . . . . . . . . . . . . . . . . . . . . . . . . . . 17Non-Alarmable Analog Tab . . . . . . . . . . . . . . . . . . . . . . . . . . . . . . . . . . . . . 18Multi Tab . . . . . . . . . . . . . . . . . . . . . . . . . . . . . . . . . . . . . . . . . . . . . . 18Misc Tab . . . . . . . . . . . . . . . . . . . . . . . . . . . . . . . . . . . . . . . . . . . . . . 18All Attributes Tab . . . . . . . . . . . . . . . . . . . . . . . . . . . . . . . . . . . . . . . . . . 18
3.4 Configuring an Individual Device . . . . . . . . . . . . . . . . . . . . . . . . . . . . . . . . . . . . 194.0 Alpha XD Tabs . . . . . . . . . . . . . . . . . . . . . . . . . . . . . . . . . . . . . . . . . . . . . . . 20
4.1 Alpha XD . . . . . . . . . . . . . . . . . . . . . . . . . . . . . . . . . . . . . . . . . . . . . . . . 20AlphaGateway Summary Screen. . . . . . . . . . . . . . . . . . . . . . . . . . . . . . . . . . 25Using the Editing Tree . . . . . . . . . . . . . . . . . . . . . . . . . . . . . . . . . . . . . . . 26Device Pages. . . . . . . . . . . . . . . . . . . . . . . . . . . . . . . . . . . . . . . . . . . . 27
4.2 Tools . . . . . . . . . . . . . . . . . . . . . . . . . . . . . . . . . . . . . . . . . . . . . . . . . . 33FCC Scheduler . . . . . . . . . . . . . . . . . . . . . . . . . . . . . . . . . . . . . . . . . . . 33XM3 Apps . . . . . . . . . . . . . . . . . . . . . . . . . . . . . . . . . . . . . . . . . . . . . 34Battery Backup . . . . . . . . . . . . . . . . . . . . . . . . . . . . . . . . . . . . . . . . . . . 34Utility Power Events . . . . . . . . . . . . . . . . . . . . . . . . . . . . . . . . . . . . . . . . 35ScoreCard . . . . . . . . . . . . . . . . . . . . . . . . . . . . . . . . . . . . . . . . . . . . . 36Signal Analyst . . . . . . . . . . . . . . . . . . . . . . . . . . . . . . . . . . . . . . . . . . . 37Signal Analyst Designer . . . . . . . . . . . . . . . . . . . . . . . . . . . . . . . . . . . . . . 38
4.3 Reports . . . . . . . . . . . . . . . . . . . . . . . . . . . . . . . . . . . . . . . . . . . . . . . . . 40Reports . . . . . . . . . . . . . . . . . . . . . . . . . . . . . . . . . . . . . . . . . . . . . . . 42Scheduling . . . . . . . . . . . . . . . . . . . . . . . . . . . . . . . . . . . . . . . . . . . . . 43Scheduler Reports . . . . . . . . . . . . . . . . . . . . . . . . . . . . . . . . . . . . . . . . . 44
4.4 Faults. . . . . . . . . . . . . . . . . . . . . . . . . . . . . . . . . . . . . . . . . . . . . . . . . . 45Notifier . . . . . . . . . . . . . . . . . . . . . . . . . . . . . . . . . . . . . . . . . . . . . . . 45Power Outage . . . . . . . . . . . . . . . . . . . . . . . . . . . . . . . . . . . . . . . . . . . 46Portable DC Generator Monitoring . . . . . . . . . . . . . . . . . . . . . . . . . . . . . . . . . 47POM Dashboard . . . . . . . . . . . . . . . . . . . . . . . . . . . . . . . . . . . . . . . . . . 48
4.5 Network Inventory . . . . . . . . . . . . . . . . . . . . . . . . . . . . . . . . . . . . . . . . . . . 514.6 Administration — XM360 Configuration . . . . . . . . . . . . . . . . . . . . . . . . . . . . . . . . 524.7 Help . . . . . . . . . . . . . . . . . . . . . . . . . . . . . . . . . . . . . . . . . . . . . . . . . . 53

5035-512-B0-001, Rev. A6 (01/2019)
FiguresFig. 1-1, Alpha XD System Architecture - Typical HFC Installation . . . . . . . . . . . . . . . . . . . . . . . . . . . . . 8Fig. 2-1, Alpha XD Login Page . . . . . . . . . . . . . . . . . . . . . . . . . . . . . . . . . . . . . . . . . . . . . . . 10Fig. 2-2, Alpha XD Page and Alpha XD Mobile Pages . . . . . . . . . . . . . . . . . . . . . . . . . . . . . . . . . . . 10Fig. 2-3, Basic Account Actions . . . . . . . . . . . . . . . . . . . . . . . . . . . . . . . . . . . . . . . . . . . . . . 11Fig. 3-1, Template Configuration . . . . . . . . . . . . . . . . . . . . . . . . . . . . . . . . . . . . . . . . . . . . . . 13Fig. 3-2, Template Configuration - Editing Parameters. . . . . . . . . . . . . . . . . . . . . . . . . . . . . . . . . . . 13Fig. 3-3, Device Configuration . . . . . . . . . . . . . . . . . . . . . . . . . . . . . . . . . . . . . . . . . . . . . . . 15Fig. 3-4, Download Alert Profile . . . . . . . . . . . . . . . . . . . . . . . . . . . . . . . . . . . . . . . . . . . . . . 15Fig. 3-5, Device Configuration Page Menu. . . . . . . . . . . . . . . . . . . . . . . . . . . . . . . . . . . . . . . . . 16Fig. 4-1, Alpha XD Tab . . . . . . . . . . . . . . . . . . . . . . . . . . . . . . . . . . . . . . . . . . . . . . . . . . . 20Fig. 4-2, Alpha XD Tab - Tree View . . . . . . . . . . . . . . . . . . . . . . . . . . . . . . . . . . . . . . . . . . . . 21Fig. 4-3, Sample Local Context Menu . . . . . . . . . . . . . . . . . . . . . . . . . . . . . . . . . . . . . . . . . . . 22Fig. 4-4, Alpha XD Tab - Middle and Right Column . . . . . . . . . . . . . . . . . . . . . . . . . . . . . . . . . . . . 24Fig. 4-5, AlphaGateway Summary Screen . . . . . . . . . . . . . . . . . . . . . . . . . . . . . . . . . . . . . . . . . 25Fig. 4-6, Editing Tree Panel . . . . . . . . . . . . . . . . . . . . . . . . . . . . . . . . . . . . . . . . . . . . . . . . 26Fig. 4-7, Power Supply Device Page. . . . . . . . . . . . . . . . . . . . . . . . . . . . . . . . . . . . . . . . . . . . 27Fig. 4-8, Fiber Node Device Page . . . . . . . . . . . . . . . . . . . . . . . . . . . . . . . . . . . . . . . . . . . . . 28Fig. 4-9, Network Tracker Device Page . . . . . . . . . . . . . . . . . . . . . . . . . . . . . . . . . . . . . . . . . . 29Fig. 4-10, GX2 Chassis Device Page . . . . . . . . . . . . . . . . . . . . . . . . . . . . . . . . . . . . . . . . . . . 30Fig. 4-11, Prisma Chassis Device Page . . . . . . . . . . . . . . . . . . . . . . . . . . . . . . . . . . . . . . . . . . 30Fig. 4-12, AlphaGateway Device Page. . . . . . . . . . . . . . . . . . . . . . . . . . . . . . . . . . . . . . . . . . . 31Fig. 4-13, Search options Screen page . . . . . . . . . . . . . . . . . . . . . . . . . . . . . . . . . . . . . . . . . . 32Fig. 4-14, Device Selection Screen . . . . . . . . . . . . . . . . . . . . . . . . . . . . . . . . . . . . . . . . . . . . 32Fig. 4-15, Modify Transponder Screen . . . . . . . . . . . . . . . . . . . . . . . . . . . . . . . . . . . . . . . . . . . 32Fig. 4-16, FCC Scheduler . . . . . . . . . . . . . . . . . . . . . . . . . . . . . . . . . . . . . . . . . . . . . . . . . 33Fig. 4-17, XM3 Apps - Battery Backup Pages . . . . . . . . . . . . . . . . . . . . . . . . . . . . . . . . . . . . . . . 34Fig. 4-18, XM3 Apps - Utility Power Events Pages. . . . . . . . . . . . . . . . . . . . . . . . . . . . . . . . . . . . . 35Fig. 4-19, KPI ScoreCard . . . . . . . . . . . . . . . . . . . . . . . . . . . . . . . . . . . . . . . . . . . . . . . . . 36Fig. 4-20, Signal Analyst . . . . . . . . . . . . . . . . . . . . . . . . . . . . . . . . . . . . . . . . . . . . . . . . . . 37Fig. 4-21, Signal Analyst Designer . . . . . . . . . . . . . . . . . . . . . . . . . . . . . . . . . . . . . . . . . . . . . 38Fig. 4-22, Reports Page . . . . . . . . . . . . . . . . . . . . . . . . . . . . . . . . . . . . . . . . . . . . . . . . . . 42Fig. 4-23, XM360 Certifications Reports . . . . . . . . . . . . . . . . . . . . . . . . . . . . . . . . . . . . . . . . . . 42Fig. 4-24, Scheduler Reports Management . . . . . . . . . . . . . . . . . . . . . . . . . . . . . . . . . . . . . . . . 44Fig. 4-25, Create Scheduler Report . . . . . . . . . . . . . . . . . . . . . . . . . . . . . . . . . . . . . . . . . . . . 44Fig. 4-26, Fault Notifier Page. . . . . . . . . . . . . . . . . . . . . . . . . . . . . . . . . . . . . . . . . . . . . . . . 45Fig. 4-27, Tree View with Flagged Device . . . . . . . . . . . . . . . . . . . . . . . . . . . . . . . . . . . . . . . . . 47Fig. 4-28, “Generator Attached” in POM . . . . . . . . . . . . . . . . . . . . . . . . . . . . . . . . . . . . . . . . . . 47Fig. 4-29, Access POM Dashboard . . . . . . . . . . . . . . . . . . . . . . . . . . . . . . . . . . . . . . . . . . . . 48Fig. 4-30, POM Dashboard. . . . . . . . . . . . . . . . . . . . . . . . . . . . . . . . . . . . . . . . . . . . . . . . . 49Fig. 4-31, Power Outage Events Chart. . . . . . . . . . . . . . . . . . . . . . . . . . . . . . . . . . . . . . . . . . . 50Fig. 4-32, Runtime Remaining Chart . . . . . . . . . . . . . . . . . . . . . . . . . . . . . . . . . . . . . . . . . . . . 50Fig. 4-33, Pie Chart . . . . . . . . . . . . . . . . . . . . . . . . . . . . . . . . . . . . . . . . . . . . . . . . . . . . 50Fig. 4-34, Network Inventory Page. . . . . . . . . . . . . . . . . . . . . . . . . . . . . . . . . . . . . . . . . . . . . 51Fig. 4-35, Location of XM360 Configuration via Administration Button . . . . . . . . . . . . . . . . . . . . . . . . . . 52Fig. 4-36, XM360 Configuration Window. . . . . . . . . . . . . . . . . . . . . . . . . . . . . . . . . . . . . . . . . . 52
TablesTable 3-1, Template Status . . . . . . . . . . . . . . . . . . . . . . . . . . . . . . . . . . . . . . . . . . . . . . . . . 12Table 3-2, Template and Device Configuration Actions . . . . . . . . . . . . . . . . . . . . . . . . . . . . . . . . . . 19Table 4-1, Local Context Menu Actions . . . . . . . . . . . . . . . . . . . . . . . . . . . . . . . . . . . . . . . . . . 23Table 4-2, XM3 Apps - Battery Status . . . . . . . . . . . . . . . . . . . . . . . . . . . . . . . . . . . . . . . . . . . 34Table 4-3, XM3 Apps - Utility Power Events . . . . . . . . . . . . . . . . . . . . . . . . . . . . . . . . . . . . . . . . 35Table 4-4, Signal Analyst Icons. . . . . . . . . . . . . . . . . . . . . . . . . . . . . . . . . . . . . . . . . . . . . . . 37Table 4-5, Signal Analyst Designer Icons . . . . . . . . . . . . . . . . . . . . . . . . . . . . . . . . . . . . . . . . . 38Table 4-6, Report Types and Outputs . . . . . . . . . . . . . . . . . . . . . . . . . . . . . . . . . . . . . . . . . . . 40Table 4-7, Device Report Descriptions . . . . . . . . . . . . . . . . . . . . . . . . . . . . . . . . . . . . . . . . . . . 40Table 4-8, Fault Report Descriptions . . . . . . . . . . . . . . . . . . . . . . . . . . . . . . . . . . . . . . . . . . . . 41Table 4-9, Performance Report Descriptions. . . . . . . . . . . . . . . . . . . . . . . . . . . . . . . . . . . . . . . . 41Table 4-10, XM360 Certification report Descriptions . . . . . . . . . . . . . . . . . . . . . . . . . . . . . . . . . . . . 41Table 4-11, Color-Coded Alarm Indicators . . . . . . . . . . . . . . . . . . . . . . . . . . . . . . . . . . . . . . . . . 45

6 035-512-B0-001, Rev. A6 (01/2019)
Alpha XD™ 6.5Alpha XD™ is a trademark of Alpha Technologies Services, Inc.
DOCSIS® is a registered trademark of Cable Television Laboratories, Inc.
Oracle® is a registered trademark of Oracle Corporation and/or its affiliates.
All other trademarks and registered trademarks are the property of their respective owners.
The copyright and trade secret laws of the United States and other countries protect this material. It may not be reproduced, distributed, or altered in any fashion by any entity without the expressed written consent of Alpha Technologies Services, Inc.
This document contains proprietary information that shall be distributed or routed only within Alpha Technologies Services, Inc. and to its authorized clients, except with written permission from Alpha. Information contained within this document is subject to change without notice. The appearance of some of the graphics in the examples presented in this manual may vary slightly to the actual GUI in the software application.
©2019 Alpha Technologies Services, Inc. All Rights Reserved. Propietary - Alpha Technologies Services, Inc. and Authorized Clients Only
Alpha XD Related Documentation:
• Alpha XD Administrator’s Manual (Alpha p/n 035-511-B0)• Alpha XD User’s Manual (Alpha p/n 035-512-B0)• Alpha XD Installation Manual (Alpha p/n 035-513-C0)
7035-512-B0-001, Rev. A6 (01/2019)
1.0 IntroductionAlpha XD™ Multi-Layered Network Assurance Software is a software suite with a complete set of applications for delivering element/network management system (EMS/NMS) solutions. The system is accessible through standard up-to-date Web browsers Google ChromeTM and Mozilla Firefox® on Windows and Solaris machines.
Alpha XD monitors, manages, and tests Hybrid Management Sub-layer (HMS), Data Over Cable Service Interface Specification (DOCSIS®), and legacy devices in Broadband Hybrid Fiber/Coax (HFC) distribution systems. Using embedded and external HMS and DOCSIS® transponders communicating with headend controllers or Cable Modem Termination Systems (CMTS), Alpha XD monitors and tests network devices such as:
• Nodes• Generators• Amplifiers• Power Supplies• End-of-Line (EL) devices• Headend Optical Equipment• AlphaGateways
Alpha XD also provides up-to-date status information, such as:
• On-demand testing• Call Scheduler
1.1 Alpha XD FeaturesAlpha XD offers the following features:
• An industrial database utilizing Oracle® version 12cR1• Scalability from dozens to thousands of monitored devices• An easy-to-use and intuitive graphical interface• Customizable user accounts with multiple levels of accessibility and privileges• Auto-Discovery of transponders added to the network (IPv4 and IPv6)• The ability to create groups for and manage the organization of all network elements• Support of HMS, Alpha and other vendor’s MIBs for enhanced alarm processing• Battery analysis that reveals battery trends and enables targeted maintenance repairs• Integration of CheetahLight, DOCSIS and CheetahNet systems• Keyboard localization• Power outage monitoring• POM Dashboard• Trap and alarm forwarding northbound to other systems• Internationalized and currently available in English and Spanish• Support for secure (HTTPS) web pages. Additional configuration required. Contact Alpha Support for assistance.

1.0 Introduction, continued
8 035-512-B0-001, Rev. A6 (01/2019)
1.2 Alpha XD System ArchitectureThe Alpha XD system design is based on a distributed architecture intended to reduce communications traffic. The distributed architecture and reduced traffic allows for additional speed, reliability, and scalability of the system.
Alpha transponders retain, in flash memory, all information (alarm limits) needed to determine whether a power supply is operating within normal ranges. Detailed alarm information is reported to Alpha XD via Simple Network Management Protocol (SNMP) traps in cases where alarms exist. Since SNMP traps do not guarantee delivery, Alpha XD uses a background synchronization process that continuously checks for lost traps and, if needed, takes remedial action.
Messages sent to Alpha XD are error messages or responses to an operator’s request to view an individual transponder element. All messages sent between the Alpha XD software and managed elements are SNMP messages.
Since the transponders send only alarm messages or data requested by an operator, the amount of traffic on the network connecting the transponders and Alpha XD is greatly reduced. This limited traffic allows for a faster and more robust platform. Alpha XD can manage over 20,000 elements in the network via the latest Windows and Solaris platforms.
Since all communications between the Alpha XD software and transponders are SNMP messages, the architecture is open and standardized. This communications scheme makes all of the plant status and alarm information available for integration into a higher-level Operations Support System (OSS).
Fig. 1-1, Alpha XD System Architecture - Typical HFC Installation
XM3-HP
Power Supply
AlphaGateway
DOCSIS/HMS Transponder
Fiber Node
OpticalShelf
Splitter/Combiner
ProgrammingContent
CMTS ManagedIP Network
Alpha XD XM360
PublicInternet
Coax
Fiber
Copper
Network Tracker
SMG

1.0 Introduction, continued
9035-512-B0-001, Rev. A6 (01/2019)
1.3 Alpha XD ComponentsAlpha XD consists of the following five components:
• Oracle® Software• Oracle® Database• Alpha XD Database• Alpha XD Application• PCs running a Web browser
These components work together to allow the user to manage the cable system. They provide notification of problems reported by transponders, headend controllers, and inside plant equipment.
Database tables store the following information:
• Configuration data – Contains network element (NE) data, alarm limits and the current status of specified devices.• Alarm data – Lists current alarms of all or selected devices and provides a historical listing of all alarms.• Audit data – Tracks changes to parameters and user activity.• Security system data – Establishes user name, password, and privilege data for all users.
1.4 Alpha XD System DeploymentA system could be viewed as a single software server accessed by Web browsers on multiple PCs, with the software monitoring devices deployed throughout the physical network. Each Alpha XD server allows up to 25 simultaneous client connections. The only limiting factor is whether the capacity of the database will enable the total number of elements to be supported. While there is no hard limit on this, performance slowly decreases as database size increases. Server database capacity has been tested and performed well with up to 20,000 transponders. Alpha XD also supports up to 25 network trackers. For networks that have the potential to grow much larger than this, multiple separate systems should be considered. Alpha XD servers communicate using standard protocols such as Simple Network Management Protocol (SNMP), and Transmission Control Protocol/Internet Protocol (TCP/IP). This provides a flexible architecture for deployment.

10 035-512-B0-001, Rev. A6 (01/2019)
2.0 Getting Started2.1 Log In to Alpha XDOpen a supported Web browser (Chrome or Firefox) and enter http://AlphaXD:9090 (Server Name) or http://172.16.0.1:9090 (IP Address).
On the Alpha XD Login page, enter a user name and password and click Login (Default Username: root) (Default Password: public).
Fig. 2-1, Alpha XD Login Page
2.2 Alpha XD TabAfter logging in for the first time, Alpha XD will display the Faults page by default. Subsequent logins will display the last page where the user logged out. The Alpha XD page (accessed by the Alpha XD tab, see Fig. 2-2) provides an overview of the network, its elements and the overall status of the elements. This page is seen whenever an upper level container is selected in the tree such as, the root node of the tree, regions and groups. Selecting Alpha XD Mobile from this tab will open a dialog box to select a search option for Power supplies, Transponder MAC addresses or Nodes.
Fig. 2-2, Alpha XD and Alpha XD Mobile Pages
2.0 Getting Started, continued
11035-512-B0-001, Rev. A6 (01/2019)
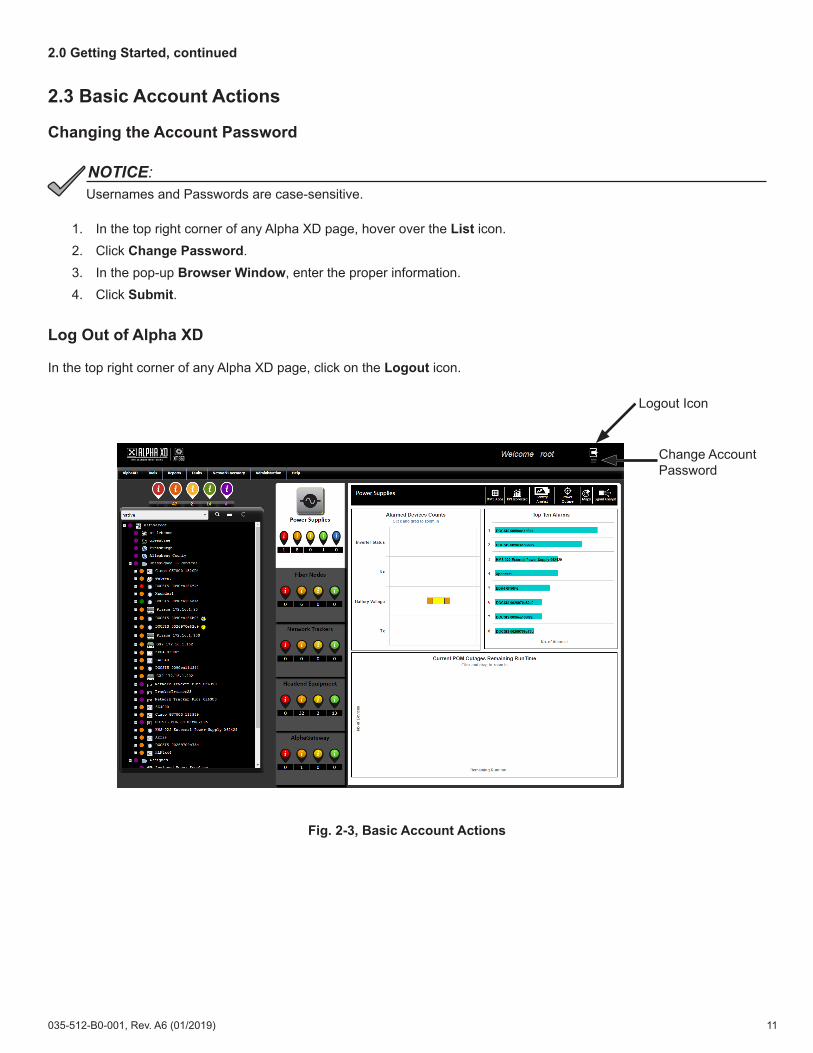
2.3 Basic Account Actions
Changing the Account Password
1. In the top right corner of any Alpha XD page, hover over the List icon.2. Click Change Password.3. In the pop-up Browser Window, enter the proper information.4. Click Submit.
Log Out of Alpha XD
In the top right corner of any Alpha XD page, click on the Logout icon.
Fig. 2-3, Basic Account Actions
Logout Icon
Change Account Password
Usernames and Passwords are case-sensitive.NOTICE:

12 035-512-B0-001, Rev. A6 (01/2019)
3.0 Provisioning DevicesAlpha XD interacts with devices by using defined parameters. These parameters include:
• Device types• Alarm limits• If the device is testable (for power supplies)• If Alpha XD should poll the device for alarm states and how often.
These parameters are applied during discovery of the device, and are downloaded to the device in the form of a template. Templates include collections of default configurations for each type of device.
Default configurations specify general information such as communications information (device IP and MAC address) and alarm limits, all of which is stored on the Alpha XD database.
A device is considered provisioned when the parameters have been downloaded to the device. For information on finding the provisioning status of devices, see the section titled Network Inventory.
A device can become provisioned (individually or in bulk) in one of three ways:
• By Alpha XD when the device is auto-discovered. (if Automatic Download is enabled; Automatic Download is disabled by default. See the Alpha XD Administrators Manual for further information, Alpha p/n 035-511-B0-001)
• When a user manually downloads an appropriate template to the device.• When the user sets the parameters for the device in the Device Configuration module, and downloads the
appropriate parameters to it.
3.1 Configuring and Using TemplatesA template is a named set of device-specific configuration parameters that can be automatically or manually associated with a device in the Alpha XD database. The template must also be downloaded to the device to complete provisioning. A default template (which exists for each device type) is automatically assigned to any newly added or discovered device.
The configuration parameters available in templates are the same as those available in the Device Configuration module, which is used to manually configure individual devices. A template is a device configuration that has been named and saved to be used again. Alpha XD contains default configuration templates for all of the expected device types that can be used in a typical network.
After associating a template with a device and downloading it to the device, the device can still be further configured using the Device Configuration module.
3.2 Template AdministrationBecause templates can be modified, devices that are provisioned can become out-of-sync and their templates no longer match the parameters of the templates in the database. To identify this, AlphaXD’s Template Administration tab and Network Inventory tab includes colored icons and flags to display the template status of network elements.
Table 3-1, Template Status
Template StatusColor StatusRed Not ProvisionedBlue Requires Download
Yellow Profile MismatchGreen Synchronized

3.0 Provisioning Devices, continued
13035-512-B0-001, Rev. A6 (01/2019)
Viewing Templates
1. Click the Administration tab in Alpha XD.2. In the Alpha XD Administration section of the Administration tab, click Template Admin (Template Admin can
also be selected by hovering over the Administration tab, then hovering over Alpha XD Admin, and selecting Template Admin).
3. Scroll through the list to view the template.
Modifying Templates
1. In the template viewer, right click a template and select Template Configuration from the menu.
Fig. 3-1, Template Configuration
2. Select one of the header tabs (Information, Property, Analog, Non-Alarmable Analog, Multi, and All Attributes) and click the Plus (+) icon to the left of the template name to expand and view the parameters.
3. Edit the parameters as desired and click Save when finished.
Fig. 3-2, Template Configuration - Editing Parameters
The template viewer display can be changed by clicking Layout Configuration; select the checkboxes next to the desired options to filter what is shown in the template viewer.
NOTICE:
Changes made to the Template Administration pages exist in server memory only. If the server is restarted, the pages will revert back to the default layout.
NOTICE:
For detailed information on configurable parameters in the different header tabs (Information, Property, Analog, Non-Alarmable Analog, Multi, and All Attributes) refer to the section titled “Configurable Parameters”.
NOTICE:
Parameter Tabs
Editable Parameters

3.0 Provisioning Devices, continued
14 035-512-B0-001, Rev. A6 (01/2019)
Cloning Templates
1. Navigate to the template in the template viewer.2. Right-click the desired template, and click Clone.
3. Type a name for the new template (spaces are not allowed in the clone name).4. Click OK. The template list will reload and display the newly-cloned template (if the Reload After Clone checkbox
is selected).
Applying Templates
Provisioning a device using a template consists of the following:
• Associating the template with the device in the Alpha XD database• Downloading the template to the device
When Alpha XD auto-discovers a device, it automatically associates the appropriate template with it and records it in the database. Templates can also be manually associated with devices. User-created templates and cloned templates must be manually applied to devices.
A template can be associated to a single child device, or a top-level or gateway parent device for association with all child devices simultaneously.
• Only the transponder and chassis category can be cloned.• This only creates a copy of the template from which it was cloned. To modify the newly-cloned template,
use the Template Configuration function.
NOTICE:
To automatically reload the page and immediately display the new template, check the Reload After Clone checkbox.
NOTICE:

3.0 Provisioning Devices, continued
15035-512-B0-001, Rev. A6 (01/2019)
To associate the default template with a device through Device Configuration:
1. Display the device in any tree view.2. Right-click on a device in the tree and select Device Configuration.3. Click the Use Template and Save button.
Fig. 3-3, Device Configuration
4. Click the Save and Download button to download the saved template parameters to the device. (This will fully provision the device.
To manually associate a template with a device:
1. Display the device in any tree.2. Right-click on an element in the tree and select Download, then select Alert Profile. (This can be done for
multiple devices by selecting the tree icon or selecting multiple elements).3. Select a template by clicking on the Radio Button to the left of the template name.
Fig. 3-4, Download Alert Profile
4. Click Download Limits.5. The download task should appear in the Active Bulk Tasks section of the window unless the task was completed
before the window opened, in which case the task will be displayed in the Completed Bulk Tasks section of the window.
6. Details of the task can be viewed by clicking on the button to the left of the task ID number.

3.0 Provisioning Devices, continued
16 035-512-B0-001, Rev. A6 (01/2019)
3.3 Configurable ParametersUp to seven tab options will display when Device Configuration is selected from a device’s local context menu or Template Configuration from the Template Administration page. Since device parameters vary from one type of a device to another, the type of device selected determines which tabs are displayed. The Information and Property tabs are always displayed, regardless of device type.
Fig. 3-5, Device Configuration Page Menu
From the Device Configuration’s main page, select a tab and then click on the button to the left of the device to be configured.
Information Tab
• Name - Source name• Type - Device type• Status Poll Off Timer Remaining (mins) - Indicates number of minutes left for the Status Polling off timer.• Last Status Update Time - Time and date stamp indicating when the last status update occurred• Last Status Change Time - Time and date stamp indicating when the last status change occurred• Failure Count - Number of times attempts to communicate with the device failed• Device Communications Handler - Displays the internal class definition of the device• CTTopoObject Type - Displays the internal device type definition• Discover State - Indicates the discovery state (incomplete or complete) of the device• Is Top Level Container - Indicates if the device is a parent• Is Schedulable - Indicates if schedules can be created for and applied to the device• Top Level Parent - Indicates if the device acts as a parent for other network elements• Gateway Parent - Indicates if the device acts as a communications point for other devices• Last Update Time - Time and date stamp indicating when the last update occurred• Last Download Time - Time and date stamp indicating when the last download occurred• MAC Address - MAC address of the device• Device Type - Category of the device• Category - Displays the general classification of device type• Template Type - Type of template used to configure the device• Modifier - Displays the Alpha personality ID• Group Name - Displays the internal grouping nomenclature• Application - Displays the default domain name in which the device exists• Active Template - Displays the name of the template/alert profile associated with this device

3.0 Provisioning Devices, continued
17035-512-B0-001, Rev. A6 (01/2019)
Property Tab
The editable Property tab is the location to specify if the device is to be managed by Alpha XD (included in AlphaXD’s status monitoring function), and to establish the device’s polling parameters (if and how often Alpha XD polls the device for alarm states).
The Property tab also includes the five user-definable fields that can include additional information about the device such as manufacturing or installation information or other notes and comments about the device. For information on using these fields, see the section titled User-Defined Configuration Fields.
• Display Name - Device display name• Managed - Determines if the device will be managed by Alpha XD• IP Address - The IP address of the device• Netmask - The netmask value used to determine a subnet for the device• Status Polling Enabled - Determines if Alpha XD will poll the device for status information• Failure Threshold - Internal value indicating the number of attempts made before determining a communications
failure• Status Polling Interval - The frequency, in seconds, at which Alpha XD polls the device for status information. This
applies only when Status Polling is enabled• User Name - A user-defined name for the device• User Comment - A user-defined descriptive comment assigned to the device• Protocol Specific Data - Data pertinent to a particular protocol used by the device• Location - A user-defined description of the device’s physical (non-network) location• User Field 1-5 - Areas for additional user-defined information• Community - The name of the network community to which the device belongs• Write Community - The name of the network write community to which the device belongs• SNMP Port - The Alpha XD server port number assigned for SNMP communications• Hub Container - Hub assignment for power supply transponders so they are seen in the POM Dashboard. (To be
seen on the POM Dashboard map the location must also be set).
Analog Tab
The Analog tab displays the values of a device’s analog attributes. Most values can be edited by the user. Each row lists an attribute name, the units its value represents (i.e., current, voltage, etc.) and four alarm limits (i.e., LoLo, Lo, Hi, and HiHi). The values of these attributes are expected to stay within a predetermined range. When properly configured, alarms are generated any time the values exceed one or more of these ranges.
• Units - Unit value for the parameter (i.e. Voltage, Amps, etc.)• Alarm Limit (LoLo, Lo, Hi, or HiHi) - A setpoint or limit value specified by the user that is used for generating
alarms when the parameter’s actual value exceeds the limit• Enabled - Enables/disables alarming• Priority - Assigns a priority level to each alarm, with a level of 1 being the highest or most important priority• Deadband - A user-defined value used to create a deadband for values returning from an alarm condition
These values are included in the default Alpha XD templates for applicable devices. These values can be modified for individual devices, or for all of the devices of the same type at one time. Individual devices should be modified using the Device Configuration module. Use the Template Admin page to modify the template for a specific device type, and then apply the change to all of the devices of that type.

3.0 Provisioning Devices, continued
18 035-512-B0-001, Rev. A6 (01/2019)
Non-Alarmable Analog Tab
This editable page displays the value of attributes that are required to operate within a predetermined range, but do not generate an alarm when the value is out of range. This page also displays a checkmark in the Requires Download column when the value displayed for an attribute does not match the value for that attribute in the database. When this occurs, the template for that device should be downloaded, or the device should be configured using the Device Configuration module. If the Device Configuration module is used to edit the attribute, be certain to save the change to the database and download the value.
• Nominal - The nominal value for the parameter• Units - Unit value for the parameter (i.e. Voltage, Amps, etc.)
Multi Tab
This editable tab displays multi-valued device parameters. Each value can be independently configured to be either in a disabled or alarm state. An enumerated parameter generates an alarm if its current value is configured to be an alarm condition. If the value changes to another value that is also configured to be an alarm, another alarm is generated. A return occurs when the value changes to a state or value that is configured with the alarm parameter disabled.
• Value - A value associated with a particular parameter state• Description - A text description associated with a particular parameter state• Enabled - Enables/disables alarming• Severity - Indicates the level of severity associated with each alarm• Priority - Assigns a priority level to each alarm with a level of 1 being the highest or most important priority• Nominal - The nominal value for the parameter• Units - Unit value for the parameter (i.e. Voltage, Amps, etc.)
Misc Tab
• Nominal - The nominal value for the parameter• Units - Unit value for the parameter (i.e. Voltage, Amps, etc.)
All Attributes Tab
Displays the device’s total configuration parameters in one scrollable page. This page also displays a checkmark in the Requires Download column when the value displayed for an attribute does not match the value for that attribute in the database. When this occurs, the template for that device should be downloaded, or the device should be configured using the Device Configuration module. If the Device Configuration module is used to edit the attribute, be certain to save the change to the database and download the value. Of the different table headings (display, alarmable, configurable, controllable, and requires download), only display can checked or unchecked. All other headings are for information only.
• Display - This parameter can be checked or unchecked to be visible in data display.• Alarmable - Indicates whether or not this parameter generates alarms.• Configurable - Indicates if values can be configured in Device Configuration or Template Admin.• Controllable - Indicates if a parameter can be configured remotely (i.e. placing a power supply into standby).• Requires Download - Indicates that a change has been made but the change has not yet been downloaded on
the device.
The display for XM3 Apps parameters is turned off by default. This can be enabled in the All Attributes tab for XM3 power supplies.
NOTICE:

3.0 Provisioning Devices, continued
19035-512-B0-001, Rev. A6 (01/2019)
After modifying a template or device configuration, the following buttons at the bottom of the pages perform the following actions:
Table 3-2, Template and Device Configuration Actions
3.4 Configuring an Individual DeviceUse AlphaXD’s Device Configuration module to change one or more parameters of an individual device.
To Display the Device Configuration Module:
1. Display the device in any tree view.2. Right-click the device and select Device Configuration.3. Click the various tabs (see the section titled “Device Configuration Parameters”) and modify the fields as desired.
Template and Device Configuration Actions
Menu Option Action
Save and Download Click this button to save the changes to the template or device configuration in the database, and download it to the device.
Reload Click this button to abandon changes made, and restore the template or configuration to the last saved parameters.
Required Download AllTo apply a checkmark in the Requires Download field for all displayed devices. Alpha XD uses the checkmark in the Requires Download field to determine which elements to include in a Bulk Download operation.
Use Template and Save Click this button to apply the template to the selected device, and save the template changes in the database.
Edit Template Click this button to make changes to the selected template.

20 035-512-B0-001, Rev. A6 (01/2019)
4.0 Alpha XD TabsAlpha XD and its functions are divided into seven tabs at the top of the Web page (from left to right):
• Alpha XD• Tools• Reports• Faults• Network Inventory• Administration• Help
Refer to the following sections on utilizing the features available in each tab. 4.1 Alpha XDThe Alpha XD tab provides an overview of the network, its elements, and the overall status of the elements divided into 3 columns across the page. Data in the middle column refreshes once per minute. Tree status icons refresh every 30 seconds.
Fig. 4-1, Alpha XD Tab
The Information icons throughout the Alpha XD page are color-coded alarm statuses:
• Red (Critical)• Orange (Major)• Yellow (Minor)• Green (OK)• Blue (Standby due to AC Power Fail - Power Supply Devices Only)• Purple (Status polling is turned off for this device)
The Administrator’s tab (along with other administrator-related functions) is covered in detail in the Alpha XD Administrators Manual (Alpha p/n 035-511-B0-001).
NOTICE:
Left Column Right Column
Middle Column
4.0 Alpha XD Tabs, continued
21035-512-B0-001, Rev. A6 (01/2019)
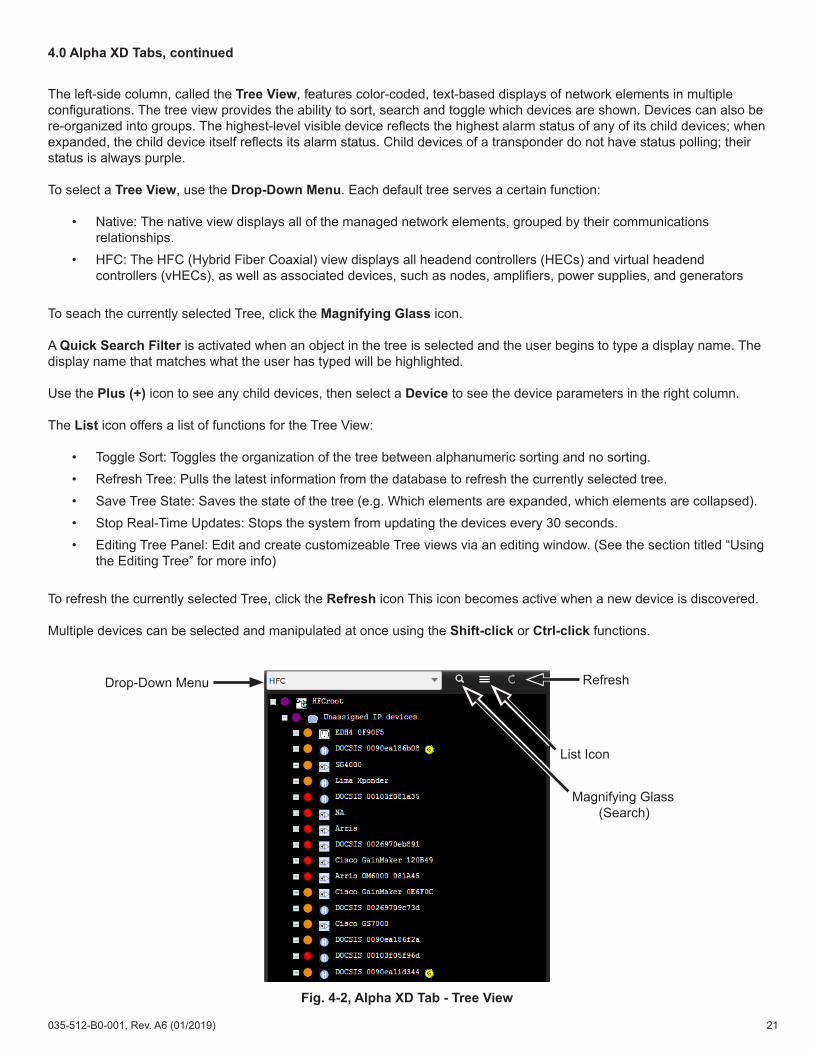
The left-side column, called the Tree View, features color-coded, text-based displays of network elements in multiple configurations. The tree view provides the ability to sort, search and toggle which devices are shown. Devices can also be re-organized into groups. The highest-level visible device reflects the highest alarm status of any of its child devices; when expanded, the child device itself reflects its alarm status. Child devices of a transponder do not have status polling; their status is always purple.
To select a Tree View, use the Drop-Down Menu. Each default tree serves a certain function:
• Native: The native view displays all of the managed network elements, grouped by their communications relationships.
• HFC: The HFC (Hybrid Fiber Coaxial) view displays all headend controllers (HECs) and virtual headend controllers (vHECs), as well as associated devices, such as nodes, amplifiers, power supplies, and generators
To seach the currently selected Tree, click the Magnifying Glass icon.
A Quick Search Filter is activated when an object in the tree is selected and the user begins to type a display name. The display name that matches what the user has typed will be highlighted.
Use the Plus (+) icon to see any child devices, then select a Device to see the device parameters in the right column.
The List icon offers a list of functions for the Tree View:
• Toggle Sort: Toggles the organization of the tree between alphanumeric sorting and no sorting.• Refresh Tree: Pulls the latest information from the database to refresh the currently selected tree.• Save Tree State: Saves the state of the tree (e.g. Which elements are expanded, which elements are collapsed).• Stop Real-Time Updates: Stops the system from updating the devices every 30 seconds.• Editing Tree Panel: Edit and create customizeable Tree views via an editing window. (See the section titled “Using
the Editing Tree” for more info)
To refresh the currently selected Tree, click the Refresh icon This icon becomes active when a new device is discovered.
Multiple devices can be selected and manipulated at once using the Shift-click or Ctrl-click functions.
Fig. 4-2, Alpha XD Tab - Tree View
Magnifying Glass(Search)
List Icon
Drop-Down Menu Refresh

4.0 Alpha XD Tabs, continued
22 035-512-B0-001, Rev. A6 (01/2019)
The information icons above the tree view are clickable hyperlinks. The number below the colored information icon details how many devices in the currently selected tree have the corresponding status. Click on the Colored Information Icon to open a new tab that displays details on each of the devices related to the selected status.The Tree View also provides a local context menu for each network element. Different elements display different options on their local menus. Refer to the following page for detail on the each action of the local context menu.Right-click a network element to display its local context menu:
• Tree• Navigation• Device Configuration• Bulk property Upsate• Data Display• Battery Analyst• Battery Tests• Reports• Battery Analyst Reports• Current XM360 Report• Historical XM360 Reports
Fig. 4-3, Sample Local Context Menu
Colored Information Icon
Local Context Menu
When available in the Local Context Menu, selecting either Current or Historical XM360 Reports will open the respective windows with a link to view the XM360 reports for that device.
4.0 Alpha XD Tabs, continued
23035-512-B0-001, Rev. A6 (01/2019)
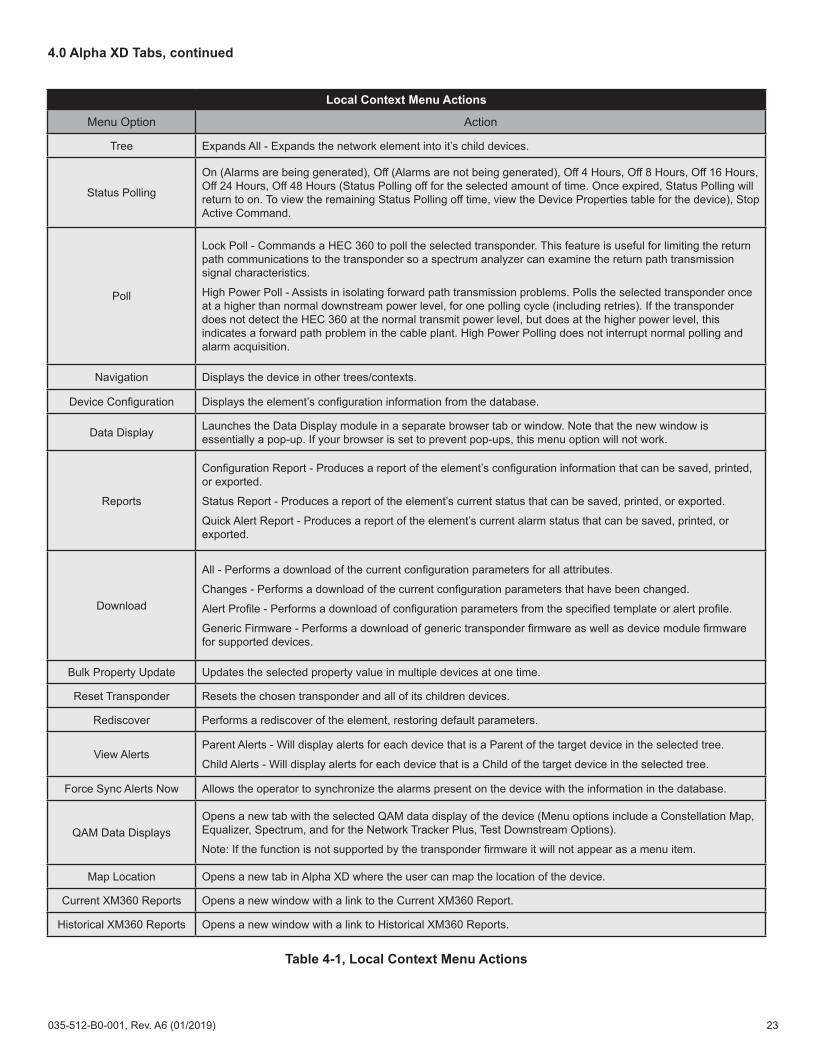
Local Context Menu Actions
Menu Option Action
Tree Expands All - Expands the network element into it’s child devices.
Status Polling
On (Alarms are being generated), Off (Alarms are not being generated), Off 4 Hours, Off 8 Hours, Off 16 Hours, Off 24 Hours, Off 48 Hours (Status Polling off for the selected amount of time. Once expired, Status Polling will return to on. To view the remaining Status Polling off time, view the Device Properties table for the device), Stop Active Command.
Poll
Lock Poll - Commands a HEC 360 to poll the selected transponder. This feature is useful for limiting the return path communications to the transponder so a spectrum analyzer can examine the return path transmission signal characteristics.
High Power Poll - Assists in isolating forward path transmission problems. Polls the selected transponder once at a higher than normal downstream power level, for one polling cycle (including retries). If the transponder does not detect the HEC 360 at the normal transmit power level, but does at the higher power level, this indicates a forward path problem in the cable plant. High Power Polling does not interrupt normal polling and alarm acquisition.
Navigation Displays the device in other trees/contexts.
Device Configuration Displays the element’s configuration information from the database.
Data Display Launches the Data Display module in a separate browser tab or window. Note that the new window is essentially a pop-up. If your browser is set to prevent pop-ups, this menu option will not work.
Reports
Configuration Report - Produces a report of the element’s configuration information that can be saved, printed, or exported.
Status Report - Produces a report of the element’s current status that can be saved, printed, or exported.
Quick Alert Report - Produces a report of the element’s current alarm status that can be saved, printed, or exported.
Download
All - Performs a download of the current configuration parameters for all attributes.
Changes - Performs a download of the current configuration parameters that have been changed.
Alert Profile - Performs a download of configuration parameters from the specified template or alert profile.
Generic Firmware - Performs a download of generic transponder firmware as well as device module firmware for supported devices.
Bulk Property Update Updates the selected property value in multiple devices at one time.
Reset Transponder Resets the chosen transponder and all of its children devices.
Rediscover Performs a rediscover of the element, restoring default parameters.
View AlertsParent Alerts - Will display alerts for each device that is a Parent of the target device in the selected tree.
Child Alerts - Will display alerts for each device that is a Child of the target device in the selected tree.
Force Sync Alerts Now Allows the operator to synchronize the alarms present on the device with the information in the database.
QAM Data DisplaysOpens a new tab with the selected QAM data display of the device (Menu options include a Constellation Map, Equalizer, Spectrum, and for the Network Tracker Plus, Test Downstream Options).
Note: If the function is not supported by the transponder firmware it will not appear as a menu item.
Map Location Opens a new tab in Alpha XD where the user can map the location of the device.
Current XM360 Reports Opens a new window with a link to the Current XM360 Report.
Historical XM360 Reports Opens a new window with a link to Historical XM360 Reports.
Table 4-1, Local Context Menu Actions

4.0 Alpha XD Tabs, continued
24 035-512-B0-001, Rev. A6 (01/2019)
The middle column gives a visual overview of the different categories of devices. The information icons display the current status and number of alarms. The devices are separated into five categories (from top to bottom):
• Power Supplies• Fiber Nodes• Network Trackers• Headend Equipment• AlphaGateway
Clicking on each individual box changes the display on the right column. The right column provides specific data about the selected device category in the middle column. Clicking on a colored information icon will open a new tab containing details about the associated devices. In this tab, the devices can be mapped and the device details can be exported to a CSV file. The alarm icons and graphs can be hovered over or clicked for detailed information. The toolbar above the graphs provide additional utilities for the selected devices. Some of these options may be unavailable on device type.
Fig. 4-4, Alpha XD Tab - Middle and Right Column
4.0 Alpha XD Tabs, continued
25035-512-B0-001, Rev. A6 (01/2019)
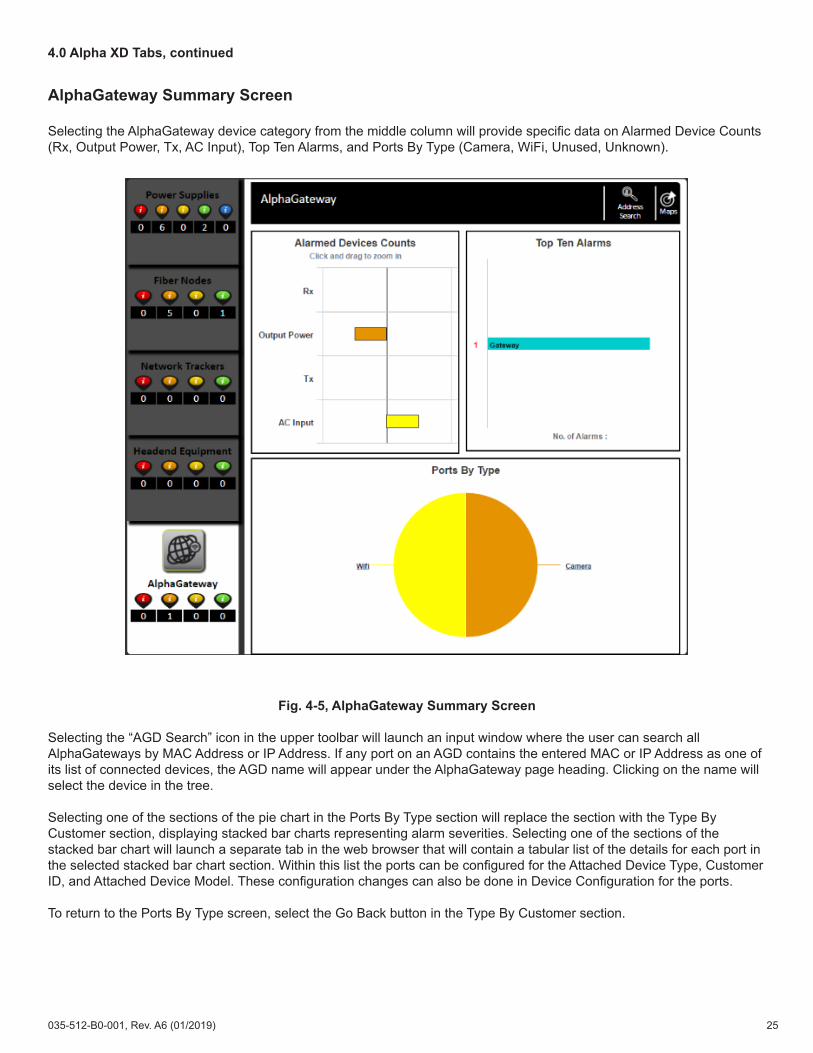
AlphaGateway Summary Screen
Selecting the AlphaGateway device category from the middle column will provide specific data on Alarmed Device Counts (Rx, Output Power, Tx, AC Input), Top Ten Alarms, and Ports By Type (Camera, WiFi, Unused, Unknown).
Fig. 4-5, AlphaGateway Summary Screen
Selecting the “AGD Search” icon in the upper toolbar will launch an input window where the user can search all AlphaGateways by MAC Address or IP Address. If any port on an AGD contains the entered MAC or IP Address as one of its list of connected devices, the AGD name will appear under the AlphaGateway page heading. Clicking on the name will select the device in the tree.
Selecting one of the sections of the pie chart in the Ports By Type section will replace the section with the Type By Customer section, displaying stacked bar charts representing alarm severities. Selecting one of the sections of the stacked bar chart will launch a separate tab in the web browser that will contain a tabular list of the details for each port in the selected stacked bar chart section. Within this list the ports can be configured for the Attached Device Type, Customer ID, and Attached Device Model. These configuration changes can also be done in Device Configuration for the ports.
To return to the Ports By Type screen, select the Go Back button in the Type By Customer section.

4.0 Alpha XD Tabs, continued
26 035-512-B0-001, Rev. A6 (01/2019)
Using the Editing Tree
Clicking Editing Tree Panel in the Alpha XD tab will load the currently selected tree into the Editing Tree tool in the left panel. In the right panel, the user can select a tree for editing. Elements from the tree in the left panel can be copied over to the right panel. This tool is best used to create groups of elements in a tree that are easy to sort through.
Fig. 4-6, Editing Tree Panel
The list icon in the right panel provides the user with editing tools:
• Refresh Tree: Refreshes the currently selected tree in the panel. • Save Tree State: Save the current visible state of the tree (which elements are expanded and collapsed).• Edit Tree: Opens a form field to edit the Name, Description, and Owner of the currently selected tree.• Delete Tree: Opens a dialog box to confirm deletion of the currently selected tree.• Add New Element: Adds a new elements to the currently selected tree.• Delete Element: Deletes the selected element from the tree.• Add Tree: Opens a form field to add a new tree with a Name, Description, and Owner.• Move Node: Moves the selected element.• Paste: Pastes the node into the right panel that was copied from the tree in the left panel.
The list icon in the left panel also provides the user a few editing tools:
• Copy Node Alone: Copies the node without any child elements. (Click Paste in the right panel’s list icon to paste the copied node)
• Copy Node with Children: Copies the node with all of its child elements. (Click Paste in the right panel’s list icon to paste the copied node)
• Swap Views: Swap the left and right trees to the opposite panel.

4.0 Alpha XD Tabs, continued
27035-512-B0-001, Rev. A6 (01/2019)
Device Pages
Whenever a device is selected in the tree view of the Alpha XD tab, a device is shown in the right column. Device pages contain information unique to the type of device that was selected (power supply, fiber node, network tracker, GX2 chassis, Prisma chassis, or AlphaGateway Device). On every device page, the ten most recent device alarms (as well as the severity) are detailed in the Device Alarms section. Hovering over an alarm in the device’s alarm section provides additional details. The device picture can also be hovered over to display additional device information/details. A generic device image will be shown if the device was not integrated into Alpha XD.
Power Supply Device Page
Fig. 4-7, Power Supply Device Page
If polling is disabled for a device, Alpha XD will display a message stating “Sorry! Data is currently unavailable for this device”.
NOTICE:
• The Alpha Apps section of the Power Supply Device Page is only available with an XM3 that has an Apps card installed.
• DM3.0 Transponders will have links to Constellation, Equalizer, and Spectrum tools under the Transponder section.
• On-demand Major/Minor Alarm Analysis is available for DM3, DSM3, IDH4, and IDH3 tranpsonders monitoring XM2s and XM3s.
NOTICE:
Device Picture
Device Alarms and Device Specific Data
Battery Runtime Information
Power Statistics
Battery Charging Information
Transponder Details
4.0 Alpha XD Tabs, continued
28 035-512-B0-001, Rev. A6 (01/2019)
Fiber Node Device Page
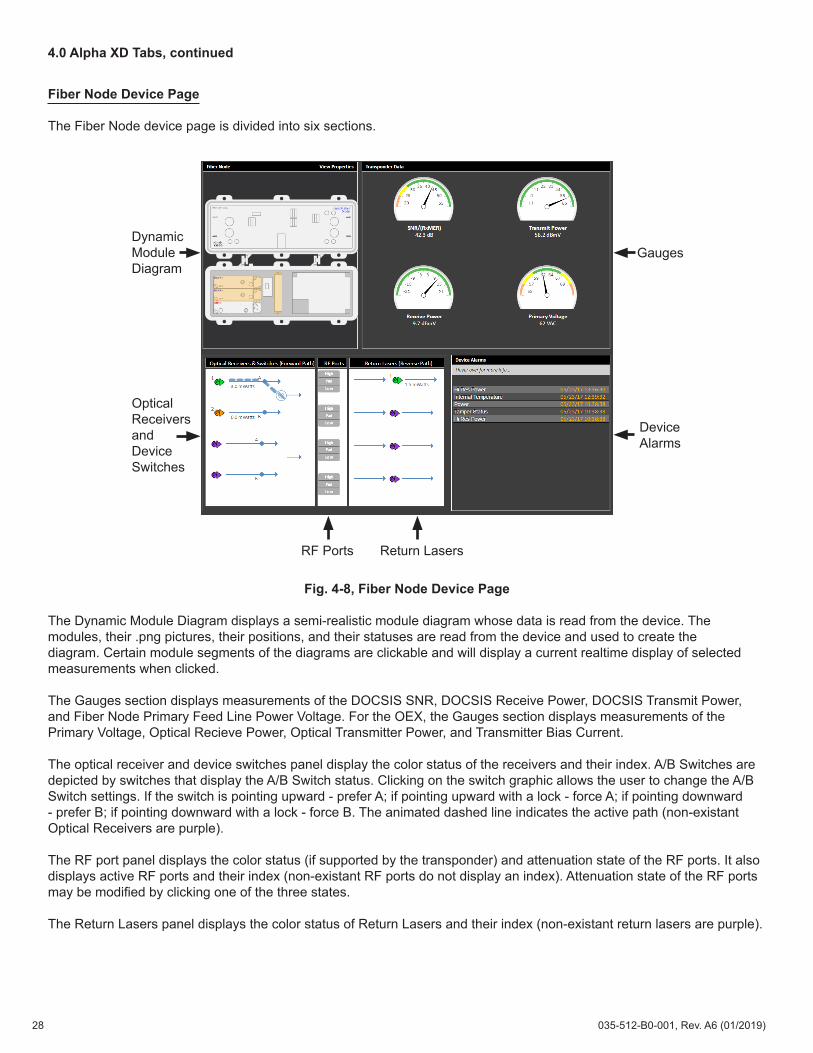
The Fiber Node device page is divided into six sections.
Fig. 4-8, Fiber Node Device Page
The Dynamic Module Diagram displays a semi-realistic module diagram whose data is read from the device. The modules, their .png pictures, their positions, and their statuses are read from the device and used to create the diagram. Certain module segments of the diagrams are clickable and will display a current realtime display of selected measurements when clicked.
The Gauges section displays measurements of the DOCSIS SNR, DOCSIS Receive Power, DOCSIS Transmit Power, and Fiber Node Primary Feed Line Power Voltage. For the OEX, the Gauges section displays measurements of the Primary Voltage, Optical Recieve Power, Optical Transmitter Power, and Transmitter Bias Current.
The optical receiver and device switches panel display the color status of the receivers and their index. A/B Switches are depicted by switches that display the A/B Switch status. Clicking on the switch graphic allows the user to change the A/B Switch settings. If the switch is pointing upward - prefer A; if pointing upward with a lock - force A; if pointing downward - prefer B; if pointing downward with a lock - force B. The animated dashed line indicates the active path (non-existant Optical Receivers are purple).
The RF port panel displays the color status (if supported by the transponder) and attenuation state of the RF ports. It also displays active RF ports and their index (non-existant RF ports do not display an index). Attenuation state of the RF ports may be modified by clicking one of the three states.
The Return Lasers panel displays the color status of Return Lasers and their index (non-existant return lasers are purple).
DynamicModule Diagram
Optical Receivers and Device Switches
RF Ports
Gauges
Device Alarms
Return Lasers

4.0 Alpha XD Tabs, continued
29035-512-B0-001, Rev. A6 (01/2019)
Network Tracker Device Page
The Network Tracker device page is divided into three sections.
Fig. 4-9, Network Tracker Device Page
The Channel Levels section displays the measured power level (in dBmV) by channel frequency (MHz). Hover over the channel level bars to view the Frequency, Channel Number, and Power Level.
Device Picture
Device Alarms
Channel Levels
4.0 Alpha XD Tabs, continued
30 035-512-B0-001, Rev. A6 (01/2019)
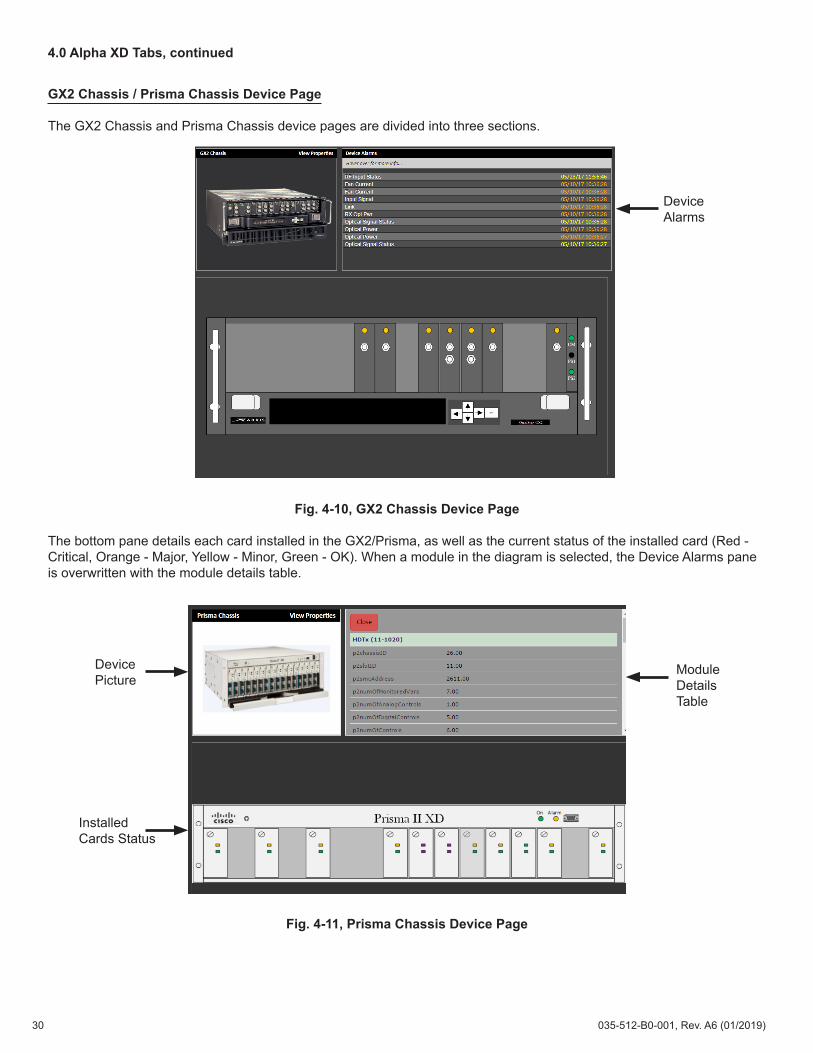
GX2 Chassis / Prisma Chassis Device Page
The GX2 Chassis and Prisma Chassis device pages are divided into three sections.
Fig. 4-10, GX2 Chassis Device Page
The bottom pane details each card installed in the GX2/Prisma, as well as the current status of the installed card (Red - Critical, Orange - Major, Yellow - Minor, Green - OK). When a module in the diagram is selected, the Device Alarms pane is overwritten with the module details table.
Fig. 4-11, Prisma Chassis Device Page
Device Picture
Installed Cards Status
Module Details Table
Device Alarms

4.0 Alpha XD Tabs, continued
31035-512-B0-001, Rev. A6 (01/2019)
AlphaGateway Device Page
The AlphaGateway device page is divided into three sections.
Fig. 4-12, AlphaGateway Device Page
The AlphaGateway Items section displays realtime data for the SMG-01PE-21. It contains the Model, Transmit Power, Receive Power, SNR/(RxMER), IP Address, MAC Address.Clicking on the right port arrows allows the user to either turn on, turn off, or reset the ports.The Connected Devices drop down menus display the MAC address and IP address of connected devices to that port. Up to date information on Data Rate In, Data Rate Out, Link Status, Output Power, Device Type, Device Model, and Customer is displayed in the port tables.
Device Picture
Device Alarms
AlphaGateway Items
4.0 Alpha XD Tabs, continued
32 035-512-B0-001, Rev. A6 (01/2019)
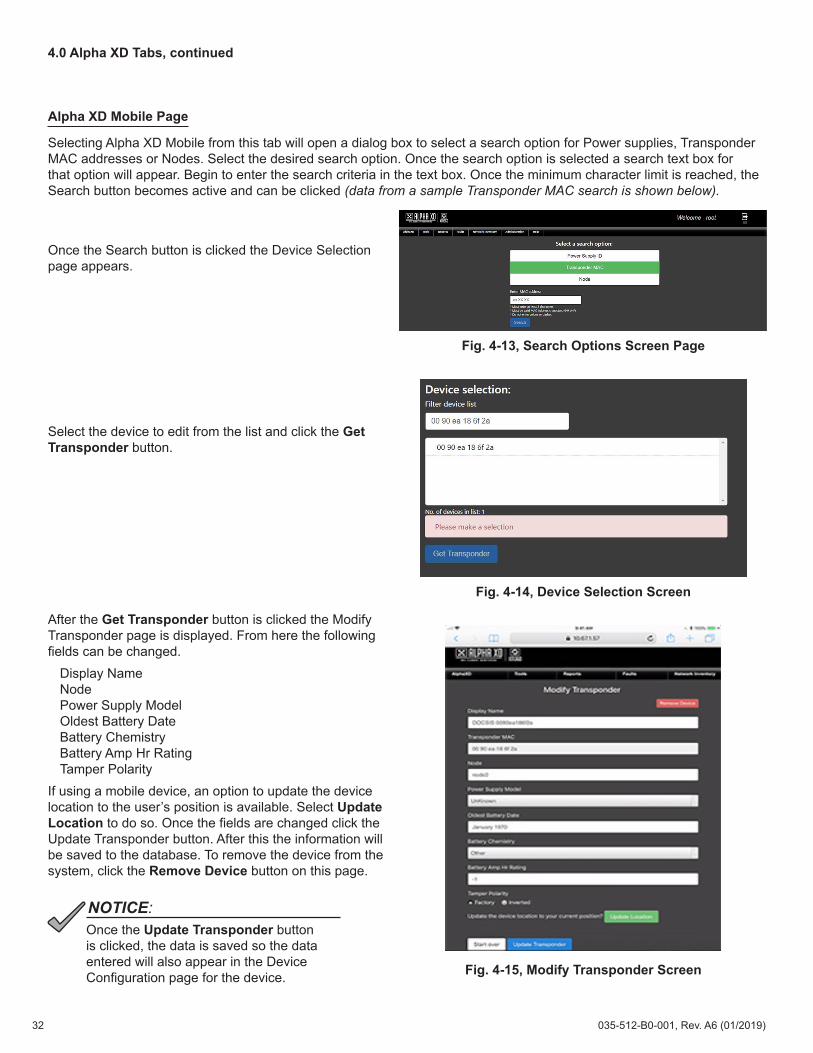
Selecting Alpha XD Mobile from this tab will open a dialog box to select a search option for Power supplies, Transponder MAC addresses or Nodes. Select the desired search option. Once the search option is selected a search text box for that option will appear. Begin to enter the search criteria in the text box. Once the minimum character limit is reached, the Search button becomes active and can be clicked (data from a sample Transponder MAC search is shown below).
Alpha XD Mobile Page
After the Get Transponder button is clicked the Modify Transponder page is displayed. From here the following fields can be changed.
Display NameNodePower Supply ModelOldest Battery DateBattery ChemistryBattery Amp Hr RatingTamper Polarity
If using a mobile device, an option to update the device location to the user’s position is available. Select Update Location to do so. Once the fields are changed click the Update Transponder button. After this the information will be saved to the database. To remove the device from the system, click the Remove Device button on this page.
Once the Search button is clicked the Device Selection page appears.
Select the device to edit from the list and click the Get Transponder button.
Once the Update Transponder button is clicked, the data is saved so the data entered will also appear in the Device Configuration page for the device.
NOTICE:
Fig. 4-13, Search Options Screen Page
Fig. 4-14, Device Selection Screen
Fig. 4-15, Modify Transponder Screen

4.0 Alpha XD Tabs, continued
33035-512-B0-001, Rev. A6 (01/2019)
4.2 Tools
FCC Scheduler
The FCC Scheduler is a specialized tool used to quickly and easily create a 24-Hour Test as required by the FCC. The scheduled test will collect Visual Power, Aural Power, and Visual/Aural Separation data levels on each analog channel defined in the device channel plan. Each data point is measured once every 6 hours over a 24-hour period and is stored in the database for use in creating an FCC 24-Hour Report.
To add a schedule:
1. Enter a unique schedule name (this cannot match any names made previously for the FCC Scheduler) and click the Arrow icon.
2. Choose a device from the list that appears and click the Arrow icon.3. Choose a month, day and year for the starting date in the calendar window that opens.4. Enter a starting hour (numerical value between 0 and 23; 0 = midnight, 23 = 11p.m.) and click the Arrow icon.5. Click Submit Schedule.
Fig. 4-16, FCC Scheduler
The new schedule can be viewed and managed in the Reports tab under Scheduling. The user can view the schedule, view the results, edit the schedule (only if it hasn’t yet taken place), remove the schedule, disable the schedule, and add to the schedule.

4.0 Alpha XD Tabs, continued
34 035-512-B0-001, Rev. A6 (01/2019)
XM3 Apps
The XM3 Apps page contains 3 tabs that detail battery information and utility power events: Battery Backup, Utility Power Events (Monthly), and Utility Power Events (Lifetime).
Battery Backup
The Battery Backup page shows a Tree Level overview of the state of the batteries in each system. There are two pie charts for each tree:
• Battery Backup: The amount of backup power (measured in hours) that the batteries can provide.• Battery Life: The remaining service life (measured in years) that the batteries can provide.
The key on the left of the page describes the colors associated with the state of the batteries.
Table 4-2, XM3 Apps - Battery Status
Clicking on a particular tree will show a Region Level overview of the state of the batteries. Clicking on a section of the pie chart in the Region Level overview will open a tab with detailed statistics on the state of the batteries.
Fig. 4-17, XM3 Apps - Battery Backup Pages
Battery BackupColor StatusBlue Calculating
Dark Green >3 HoursLight Green 2 - 3 Hours
Orange 1 - 2 HoursRed <1 Hour
Battery LifeColor Status
Dark Green >5 YearsLight Green 3 - 5 Years
Yellow 2 - 3 YearsOrange <2 Years
Red Now
XM3 Daily and XM3 Monthly Schedules must be enabled for this tool to function properly. See the sub-section titled “Scheduling” for details on enabling this feature.
NOTICE:

4.0 Alpha XD Tabs, continued
35035-512-B0-001, Rev. A6 (01/2019)
Utility Power Events
The Utility Power Events tabs show a Tree Level overview of the utility power events that have occured in each system over a given period of time:
• Utility Power Events (Monthly): The numbers of events that have occured, measured on a monthly basis.• Utility Power Events (Lifetime): The number of events that have occured, measured over the course of the service
life.
The key on the left of the page describes the colors associated with the number of utility power events that have occured in the system within the given time frame.
Table 4-3, XM3 Apps - Utility Power Events
Clicking on a particular tree will show a Region Level overview of the utility power events. Clicking on a section of the pie chart in the Region Level overview will open a tab with detailed statistics on the events. The Export to CSV button allows the user to generate a CSV file for data. The Back button takes the user to the previous level.
Fig. 4-18, XM3 Apps - Utility Power Events Pages
Utility Power EventsColor Status
Dark Green <3 EventsLight Green 4 - 9 Events
Orange >9 Events

4.0 Alpha XD Tabs, continued
36 035-512-B0-001, Rev. A6 (01/2019)
ScoreCard
The Key Performance Indicator (KPI) ScoreCard page shows a series of informational graphs that depict ongoing system metrics. Data to populate the graphs is sent daily in the form of SNMP traps from the transponder(s) (if supported) to all configured trap destinations.
To view data on the KPI ScoreCard:
1. Define the data parameters by: • Selecting the Power or Optical radio button.• Selecting the range from the Select Range Drop-Down Menu.• Selecting the metric from the Select Metric Drop-Down Menu.• Selecting the device from the Select Device Drop-Down Menu.
2. Click Get Data to populate the page with data and graphs.
To change the Tree, click on the Change Tree icon in the top right corner of the KPI ScoreCard window.
Once the data is displayed, it can be saved locally by clicking Export to CSV. Changing any of the data parameters will grey out the graphs and the data must be reset by clicking Reset All.
Hovering over any of the graphs or plotted coordinates will reveal additional details.
Fig. 4-19, KPI ScoreCard
To prevent unwanted traps, this feature is disabled in the transponder by default. This feature is enabled by setting the Enable Tracking Traps nominal value to 2 on either the Device Configuration or Template Admin page of the desired transponder.
NOTICE:
Range Select DeviceSelect Metric
Change Tree
4.0 Alpha XD Tabs, continued
37035-512-B0-001, Rev. A6 (01/2019)
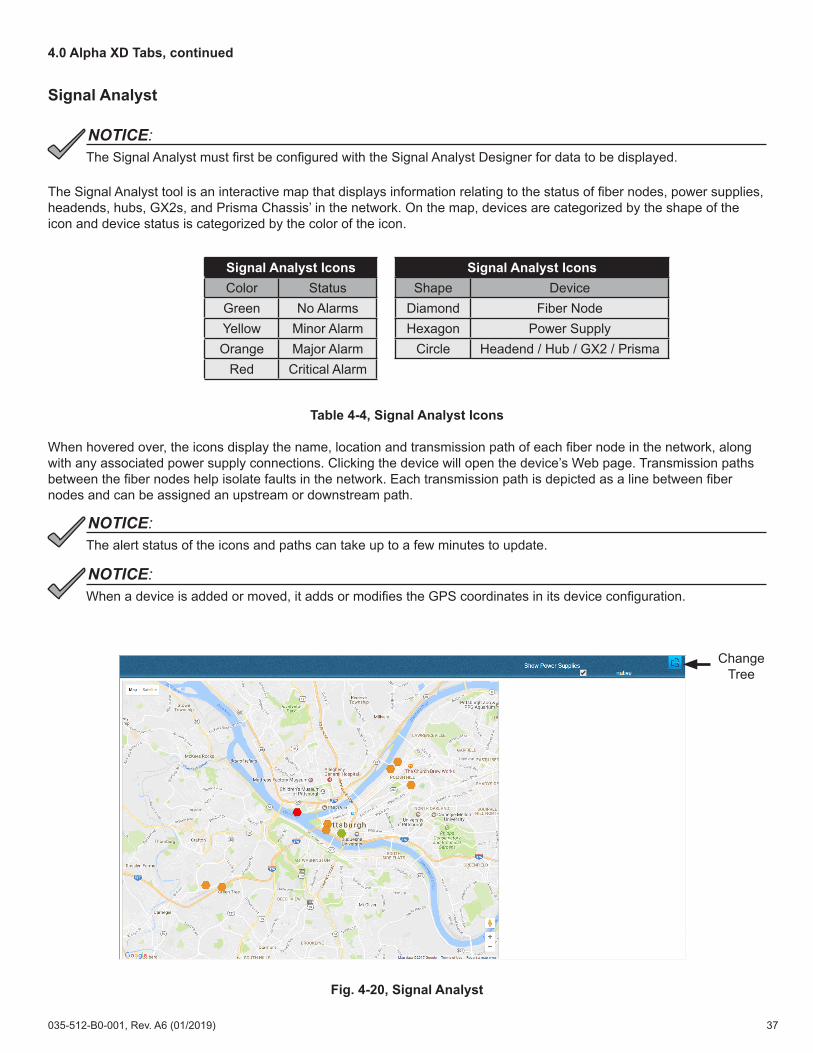
Signal Analyst
The Signal Analyst tool is an interactive map that displays information relating to the status of fiber nodes, power supplies, headends, hubs, GX2s, and Prisma Chassis’ in the network. On the map, devices are categorized by the shape of the icon and device status is categorized by the color of the icon.
Table 4-4, Signal Analyst Icons
When hovered over, the icons display the name, location and transmission path of each fiber node in the network, along with any associated power supply connections. Clicking the device will open the device’s Web page. Transmission paths between the fiber nodes help isolate faults in the network. Each transmission path is depicted as a line between fiber nodes and can be assigned an upstream or downstream path.
Fig. 4-20, Signal Analyst
Signal Analyst IconsShape Device
Diamond Fiber NodeHexagon Power Supply
Circle Headend / Hub / GX2 / Prisma
Signal Analyst IconsColor StatusGreen No AlarmsYellow Minor AlarmOrange Major Alarm
Red Critical Alarm
The alert status of the icons and paths can take up to a few minutes to update.NOTICE:
When a device is added or moved, it adds or modifies the GPS coordinates in its device configuration.NOTICE:
The Signal Analyst must first be configured with the Signal Analyst Designer for data to be displayed.NOTICE:
Change Tree
4.0 Alpha XD Tabs, continued
38 035-512-B0-001, Rev. A6 (01/2019)
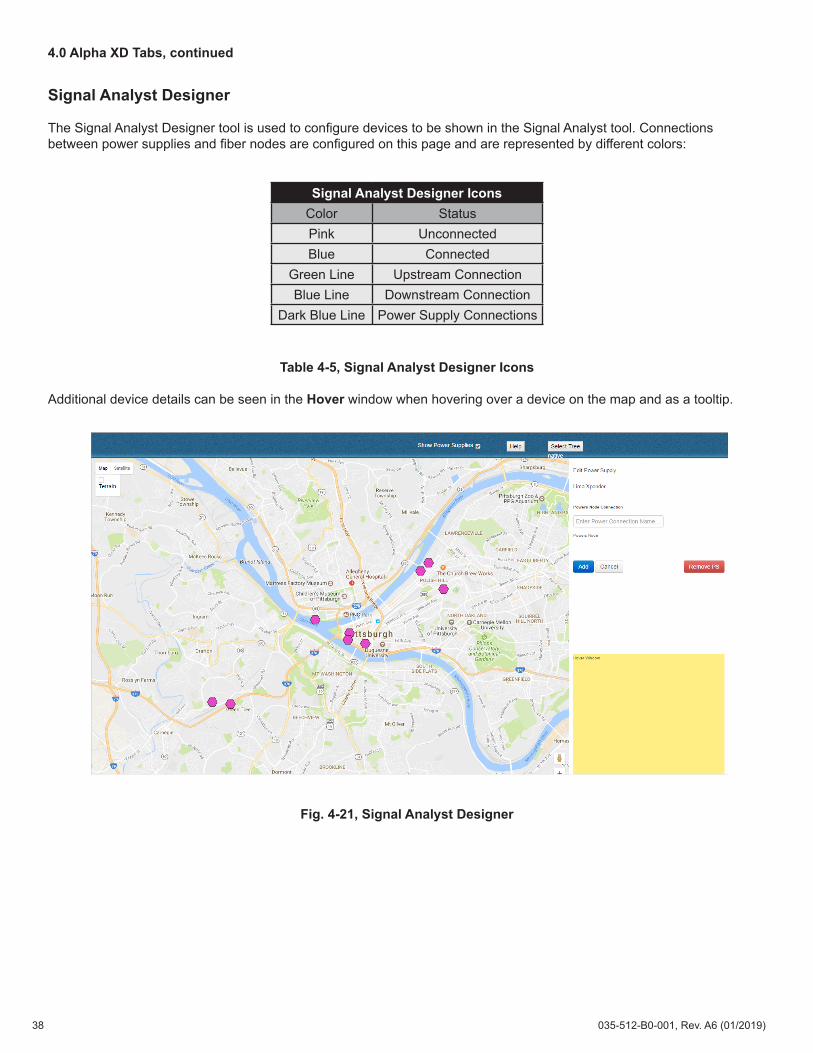
Signal Analyst Designer
The Signal Analyst Designer tool is used to configure devices to be shown in the Signal Analyst tool. Connections between power supplies and fiber nodes are configured on this page and are represented by different colors:
Table 4-5, Signal Analyst Designer Icons
Additional device details can be seen in the Hover window when hovering over a device on the map and as a tooltip.
Fig. 4-21, Signal Analyst Designer
Signal Analyst Designer IconsColor StatusPink UnconnectedBlue Connected
Green Line Upstream ConnectionBlue Line Downstream Connection
Dark Blue Line Power Supply Connections

4.0 Alpha XD Tabs, continued
39035-512-B0-001, Rev. A6 (01/2019)
To add a device to the Signal Analyst Designer:
1. Ensure that the proper tree is selected.2. Navigate to the desired location on the map for the new device.3. On the desired location, click the map.4. In the Add Device panel, expand or collapse the devices (if adding a power supply, the Show Power Supplies
checkbox must be checked).5. Select the Radio button for the desired device.6. Click Add.
Relocate a device by dragging and dropping its icon to a new place on the map. This will alter the GPS coordinates in the device’s configuration.
To remove a device, select an existing device, and click Remove Node or Remove PS in the Edit panel.
To add a fiber span connection between two devices:
1. On the map, select a downstream Fiber Node.2. In the edit panel, enter a Span Name for the connection.3. In the edit panel, select the Radio button for the desired upstream connecting device.4. For the Fiber Span Type, select Upstream To or Downstream From.5. Click Next.
• If the “Upstream To” relationship type is selected, the Edit Node panel will display any unassigned Return Laser endpoints contained within the “downstream” fiber node that are available to be assigned as origination endpoints in the “upstream” Fiber Span.
• If the “Downstream From” relationship type is selected, the Edit Node panel will display any Optical Receiver endpoints contained within the “downstream” fiber node that are available to be assigned as termination endpoints in the “downstream” Fiber Span.
6. Select the Checkbox(es) of the Return Laser(s) or Optical Receiver(s) endpoints.7. Click Save.
To add a power connection between a node and power supply:
1. On the map, select a Power Supply.2. In the edit panel, enter the Power Connection Name.3. Select the Radio button for the fiber node that is powered by the selected power supply.4. Click Add.
To edit an existing fiber span or power node connection, click on an existing device to open the edit panel and repeat the steps used to add a fiber span or power node connection.
To remove an existing connection between two nodes, select the line connecting the two nodes and click Delete.
Even when a device is deleted from the map, the device’s location is still saved in the database and will reappear if the map is redrawn.
NOTICE:

4.0 Alpha XD Tabs, continued
40 035-512-B0-001, Rev. A6 (01/2019)
4.3 ReportsAlpha XD offers the following types of reports:
Table 4-6, Report Types and Outputs
To generate any of the following reports, select the desired report and follow the onscreen instructions and filters.
Report Types and OutputsReport Type Output
Device ReportsDevice Configuration Report PDF
Device Status Report PDFDevice Inventory by Type PDF, CSV
Provisioned Transponders Report PDF, CSVTransponder Firmware Report PDF, CSV
Fault ReportsAlert Report by Category PDF, CSV
Alert Listing Report PDF, CSVActive Alert Status Report by Device PDF, CSV
Device Dead Report PDF, CSVAlert Analysis Report PDF, CSV
Power Supply Alert Report PDF, CSVPower Outage Summary Report CSV
Power Outage Detail Report CSVPerformance Reports
Battery Analyst Report PDF, CSVBattery Summary Report HTML, CSV
Scheduler Report PDF, CSVPage Alert On-Call Report PDF, CSV
Power Supply Test Status Report PDF, CSVCurrent XM360 Reports PDFHistorical XM360 reports PDF
Device Report DescriptionsDevice Reports
Device Configuration Report The Device Configuration Report contains the configuration information stored in the database for a selected device.
Device Status Report The Device Status Report displays the current data for all measured attributes of the device.
Device Inventory by Type The Device Inventory by Type report displays all monitored devices, grouped by device type.
Provisioned Transponders Report The Provisioned Transponders Report displays the display name, MAC address, IP address, last download date/time, last update date/time, the contents of user field 1-5, and the location.
Transponder Firmware Report
The Transponder Firmware Report is used to view device firmware versions in the Alpha XD system. Firmware versions are gathered from the following OIDS: docsDevSWCurrentVers (3348 and 3349 DOCSIS®), commonVendor (Non DOCSIS® HMS), and firmwareVersion (CL Legacy devices). The report displays the display name, IP address, MAC address, device modifier, and the firmware version.
Table 4-7, Device Report Descriptions

4.0 Alpha XD Tabs, continued
41035-512-B0-001, Rev. A6 (01/2019)
Table 4-8, Fault Report Descriptions
Table 4-9, Performance Report Descriptions
Fault Report DescriptionsFault Reports
Alert Report by CategoryThe Alert Report by Category contains detailed alert information for the selected device types (categories) and severities, grouped by categories (e.g., all fiber nodes, all power supplies, etc.) for a specified data range.
Alert Listing Report The Alert Listing Report lists the alert information for the selected categories and severities, grouped by severity.
Active Alert Status Report by DeviceThe Active Alert Status Report by Device lists the currently active alerts for the selected categories and severities. This report is analogous to the alarms displayed in real-time in the Notifier.
Device Dead Report The Device Dead report lists devices that are either not communicating or are not present in the network.
Alert Analysis ReportThe Alert Analysis Report displays selected devices having the most numerous repeat alarms. This is a diagnostic tool that allows users to identify those devices most often generating repeat alarms.
Power Supply Alert Report The Power Supply Alert Report contains multiple filters that allow analysis of the alerts that were generated on specific power supplies during a designated time period.
Power Outage Summary Report The Power Outage Report contains multiple filters that allow analysis of the Pass/Fail Thresholds on power supplies during a specified time period.
Power Outage Detail Report The Power Outage Detail Report contains multiple detailed filters that allow analysis of the monitor Pass/Fail Thresholds on power supplies during a specified time period.
Performance Report DescriptionsPerformance Reports
Battery Analyst ReportThe Battery Analyst Report contains the results from automatic (background) and/or manual (on-demand) power supply tests. Results can be filtered for the report by specifying either devices or schedule names.
Battery Summary Report
The Battery Summary Report provides the ability to display power supply test result summaries in two different formats. The first format, the All Tests, Single Power Supply format, provides all of the test results for one power supply. The Latest Test, Multiple Power Supplies format provides one test result (the most recent result) for each power supply in the list.
Scheduler Report The Scheduler Report can contain information regarding either details or results of selected schedules.
Page Alert On-Call Report The Page Alert On-Call Report produces a listing of the technician on-call schedules.
Power Supply Test Status Report
The Power Supply Testable Report (PDF) contains information regarding the selected power supply’s last test time and if testing is disabled/enabled. The CSV version of the data contains the additional information of Battery Test Groups associated with a device and if a Power Supply is testable or not.
XM360 Certification Report DescriptionsReports
Current XM360 Certification Reports Provides current information with regard to Power Supply, Battery and Transponder reports. Also, enclosure location and Plant Loading Reports are displayed.
Historical XM360 Certification Reports Provides historical information with regard to Power Supply, Battery and Transponder reports. Also, enclosure location and Plant Loading Reports are displayed.
Table 4-10, XM360 Certification Report Descriptions

4.0 Alpha XD Tabs, continued
42 035-512-B0-001, Rev. A6 (01/2019)
Reports
Hovering over Reports on the Tabs Bar opens a window allowing the operator to select Reports/Scheduling/Scheduler Reports. Selecting reports opens the page shown below.
Viewing XM360 Certification Reports (Polling, Unknown) will open the following screens (sample data shown):
Fig. 4-22, Reports Page
Fig. 4-23, XM360 Certifications Reports
4.0 Alpha XD Tabs, continued
43035-512-B0-001, Rev. A6 (01/2019)
Scheduling
The scheduler allows for collecting data on a set of user-specified devices or template attributes. Data can be collected on-demand or continuously, on a user-specified schedule. Multiple schedules can run simultaneously.
A Template-Based schedule performs data collection on all managed devices using the templates selected for the schedule. Selecting templates is similar to selecting devices for a Device-Instance-Based schedule, except after selecting the devices for the schedule, the Schedule Manager displays the templates used by the devices, and executes data collection on all managed devices using those templates.
To Create a Template-Based or Device-Instance-Based Schedule:
1. Click Add New.2. On the following page select a Template-Based schedule (based on a template the devices are using) or a
Device-Instance-Based schedule (based on a specific device).3. Enter a Schedule Name. (This name cannot begin with a number and must not contain spaces or special
characters.)4. Click Continue.5. Use the Search Criteria Properties to generate lists of devices to include in the schedule.6. Click Search to obtain a list of devices that match the filter criteria.7. To include a device in the schedule, select the Checkbox next to the device (multiple devices can be selected).8. Click Add. (For a template-based schedule, the search results list changes from listing the devices to listing the
templates associated with the devices.)9. Select the Attributes tab.10. Select the Checkboxes to collect data for the desired attributes.11. Click Search.12. To include an attribute in the schedule, select the Checkbox next to the device (multiple devices can be selected).13. Click Add.14. Select the Timing tab.15. Select the One Time, Weekly, or Monthly tab and fill out the form fields.16. Before leaving the Timing tab, it is important to click Commit Timing Changes, otherwise the selected timing
parameters will not take effect.17. Click Add Schedule.
To Clone a Schedule:
1. On the Scheduling page, scroll to the desired schedule.2. At the right end of the desired schedule, click Add From.3. Enter a Schedule Name (This name cannot begin with a number and must not contain spaces or special
characters.)4. Click Continue.5. Make any desired changes to the cloned schedule and click Add Schedule.
To filter the schedules for easier management, click the Schedule Name Drop-Down Menu and select the desired criteria. Enter a value into the form field and click Apply Filter.
To view a schedule’s results, navigate to the Schedule Management page by hovering over the Reports tab and clicking Scheduling. Find the desired schedule and click View Results.

4.0 Alpha XD Tabs, continued
44 035-512-B0-001, Rev. A6 (01/2019)
Scheduler Reports
The Scheduler Reports is a licensed feature that allows the user to setup Alpha XD to generate scheduled reports from the Schedules in Schedule Management. These reports can be generated on a daily or weekly basis and can be setup to be e-mailed automatically. These generated reports are stored on the Alpha XD server in the following path: \Alpha XD\webclient\reporting\schedulerReports.
To purchase the license for the Scheduler Reports option contact your Alpha sales representative.
Any Schedule in Schedule Management can be setup in Scheduler Reports. Once one of the Schedules in ScheduleManagement is setup in Scheduler Reports, it cannot be selected again (it is removed from the Schedules dropdown on the Create Scheduler Reports page).
Fig. 4-24, Scheduler Reports Management
To add a Scheduler Report, click Add Scheduler Report. This will open the Create Scheduler Reports page.
Fig. 4-25, Create Scheduler Report
In the Create Scheduler Report page click the Schedules drop down box to select one of the Schedules from Schedule Management. If there are no Schedules setup in Schedule Management nothing will appear in this drop down box. Also, the Schedule in Schedule Management needs to be Enabled and had run at least once for there to be data in the Scheduler Report.Select the Interval in which it is desired to generate the report, Daily or Weekly. A Weekly report will retrieve one week’s worth of data and a Daily report will retrieve 24 hours’ worth of data.Select the Hour to Repeat, 0:00 - 23:00.Select the Status of the Report Generation. This needs to be Enabled for the report to be generated.If it is desired to have the report e-mailed when generated enter an e-mail address in the Emails to include text box and then click the Add button. Additional e-mail addresses can be added after each click of the Add button. Click the Submit button to save the settings for the Scheduler Report.Once a Scheduler Report is created it can be deleted or edited by clicking the Edit button for the item.

4.0 Alpha XD Tabs, continued
45035-512-B0-001, Rev. A6 (01/2019)
4.4 Faults
Notifier
Alarms are generated when a fault or failure is detected in a network device. The Alpha XD Faults page displays current alarms (Alerts tab) and historical events (Events tab) for discovered and provisioned devices in the HFC domains using AlphaXD’s Notifier application. The Dashboard tab is a visual display of the Faults Notifier data. Alarm displays are color-coded to provide a quick indication of alarm severity:
• In order to view events, a filter must first be applied (typically a filter with a date range).• The default filter can be altered and applied but it cannot be saved.
NOTICE:
Color-Coded Alarm Indicators
Color StatusRed Critical
Orange MajorYellow MinorBlue WarningWhite InfoGreen ClearGray Unknown
List Icon
Tabs Fields (Editable with Field Selection)
Table 4-11, Color-Coded Alarm Indicators
Fig. 4-26, Fault Notifier Page
The Fault Notifier layout is completely customizable to allow the user to see the most relevant and desirable information first.
To customize the view in the Fault Notifier:
• Hover over the List Icon and click Field Selection. Select/de-select the desired fields to be shown on the bottom half of the page, then click Update.
• Hover over the List Icon and click Filter Selection, and select/de-select the desired fields from the drop-down menus. The filter can then be saved after changing the Name property. • Assigning the filter will apply the filter to the currently selected Alerts or Events tab.
• Click the Plus Icon to add another tab (customize the tab with the Field Selection and Filter Selection options).• Hover the List Icon and click Layout Selection. From here, the user can either save the current layout displayed
on the screen, or select an already configured layout profile.
PDF and CSV reports of the data can be generated by hovering over the List Icon and clicking CSV or PDF.
The Dashboard tab contains detailed illustrated graphs relating to the various alarms.

4.0 Alpha XD Tabs, continued
46 035-512-B0-001, Rev. A6 (01/2019)
Power Outage
The power outage monitoring (POM) of Alpha XD actively tracks power supplies affected by a commercial power outage. The module closely monitors the condition of the effected power supply’s batteries to provide a clear picture of the situation in the field in order to prioritize truck routes and avoid network outages. The organization and functionality of the page is nearly identical to the Notifier page.
The power outage monitoring module combines information from a power supply’s configuration data with real-time data received from power supply transponders, combined with user-customized parameters, to determine when a power supply triggers an alert that will be monitored by the power outage monitoring application.
Two available options for customizing the view in POM are Field Selection and Layout Selection. The Field Selection option allows the user to select the fields desired for display. The Layout Selection option allows the user to save the current layout to the database and/or select a layout from the database to be applied to the display.
Two Alpha XD services (in addition to the device-configuration information) provide the information to the power outage monitoring application.
The Battery Administration service and the CTPowerOutageMonitoringProcess service perform the required processing of input voltage alarms, dynamic determination of duration values and aggregation of alert information. From this information, displayed alerts are created, updated, and/or deleted. Consolidating the alert processing within these services allows the power outage application to update in virtually synchronous fashion.
Specifically, the two services provide the following information:
• Static device information concerning power supply characteristics (i.e., battery string configurations)• Device measurement information concerning total string voltage• An algorithm to determine duration of standby remaining• An algorithm to determine potential truck dispatch time• Processing of input voltage drop alarms (the threshold drop is externally parameterized)• Aggregation of input voltage alarm information into a new critical alarm with a predetermined attribute
Additionally, the CTPowerOutageMonitoringProcess:
• Traps power supply input voltage drop alerts• Checks for an active critical alert with a predetermined attribute• If one exists, updates outage occurrence count and interval data• If one does not exist, creates new critical alert with associated default values (for example, 24-hour
occurrence count, alarm status, standby status)• Updates active alerts on a periodic cycle
• The interval values, current status, and alarm status of each active alert are updated at a pre-determined interval
• Purges severity alerts after a specified “time to live” interval has expired (specified in pomMessageTimeToLiveInHours, described later in this chapter)• Power supplies that have active Power Outage Monitoring alerts are checked after the specified interval for
their status (standby or normal)• If the power supply is not in standby and input voltage has returned to normal, its alert will be purged
from the active alert list when the normal status duration exceeds the “time to live” interval (specified in pomMessageTimeToLiveInHours, described later in this chapter).

4.0 Alpha XD Tabs, continued
47035-512-B0-001, Rev. A6 (01/2019)
Portable DC Generator Monitoring
Alpha XD can identify when a portable generator is attached to a Power Supply during a commercial power outage. POM will check the average battery voltage each monitoring cycle, (every 3 minutes), and identify if the device is still in standby but the average battery voltage has exceeded the “Generator Thresholds”. If so, the Standby Remaining column will be changed to read “Generator Attached” in lieu of the calculated Estimated Standby Remaining time and the POM calculation will cease calculations as long as the average battery voltage remains above the threshold. If the average battery voltage dips back down below the threshold and the device remains in standby, the Standby Remaining calculation will resume from where it had stopped before.
When a generator is sensed Alpha XD will:• Flag a device in the Tree Viewer with an indicator that a generator is attached.
Fig. 4-27, Tree View with Flagged Device
• Indicate “Generator Attached” in the Standby Remaining column of POM when the POM senses a generator has been attached.
Fig. 4-28, “Generator Attached” in POM
• Display the Gen Status in a new column in POM. This column will display one of the following values:• Running• Stopped at mm/dd/yyyy hh:mm:ss - Service?• Removed at mm/dd/yyyy hh:mm:ss• Power Restored at mm/dd/yyyy hh:mm:ss
• Display the Gen Onsite Time in a new column in POM. This will display the clock time at which the generator was attached to the device.
• Display the Gen Elapsed Runtime in a new column in POM. This will display the total elapsed runtime of the attached generator.
• Display the Gen Model in a new column in POM. This will display the model of the attached generator.

4.0 Alpha XD Tabs, continued
48 035-512-B0-001, Rev. A6 (01/2019)
If a stationary generator is being monitored by the transponder and Alpha XD senses the Stationary generator is running, Alpha XD will automatically populate the Gen Model field as Stationary in POM.
NOTICE:
• Allow the user to manually reset the Gen Elapsed Runtime by right clicking on the event and selecting “Refuel Generator.”
• Allow the user to manually set the Gen Model of the attached generator by right clicking on the event and selecting the generator type. Possible types are DCX2000, DCX3000, Stationary, Other, and Unknown.
• Allow the user to manually indicate a Generator has been removed by right clicking on the event and selecting “Remove Generator” (The Generator removal can also be set from right clicking the device in the tree and selecting “Remove Generator”).
• Display the Gen Remaining in a new column in POM. This will display an estimated runtime remaining for the attached generator.
POM Dashboard
The POM Dashboard allows the user to view live and historic power supply/transponder statuses displayed on a map and in the form of charts.
To access the POM Dashboard, select Faults and then POM Dashboard from the menu bar.
Fig. 4-29, Access POM Dashboard
Overview
The POM Dashboard allows the user to view live and historic power supply/transponder statuses displayed on a map and in the form of charts. This information can be filtered by preconfigured Regions, Areas, and Hubs. See the Alpha XD Administrator’s Manual (P/N: 035-511-B0-001) for instruction of how to configure the regions, areas, and hubs and how to assign devices.
The Gen Model must be set to either a DCX2000 or DCX3000 before the Gen Remaining field indicate an estimated time. Until the Gen Model is set to one of the two types the field will indicate Unknown.
NOTICE:

4.0 Alpha XD Tabs, continued
49035-512-B0-001, Rev. A6 (01/2019)
To view the mapped and charted data select the desired location filters on the right of the page and then click the Map Live Button. Information for all devices associated with the selected filter will be displayed.
Fig. 4-30, POM DashboardTo Clear the Map click the Clear Map button.
Page Information
Color Codes:When “Live” Data is viewed, the color codes are as follows:Green - Normal: Devices that do not have an outage.Blue - Not Reporting: Devices that do not have an outage but are not reporting.Yellow - Inverter On: Devices that currently have an outage and are running on batteries.Red - Service Outage: Devices that had an outage and now have a service outage.
When “Historical” Data is viewed, the color codes are as follows:Green - Normal: Devices without an outage in the selected time span.Yellow - Inverter On: Devices that had an outage and were running on batteries in the selected time span.Orange - Service Outage/Pass: Devices that had an outage and had a service outage during the selected time span but the batteries lasted longer than expected (the set threshold in the PowerOutageMonitoring_Parameters.xml file).Red - Service Outage/Fail: Devices that had an outage and had a service outage during the selected time span and the batteries did not last as long as expected (the set threshold in the PowerOutageMonitoring_Parameters.xml file).
If there are devices associated to the filter but do not have a location they will not appear on the map but will be included in the charts. Also, there will be a message below the location filters stating there are devices that cannot be displayed because they are missing coordinates.
NOTICE:

4.0 Alpha XD Tabs, continued
50 035-512-B0-001, Rev. A6 (01/2019)
MapThe map displays the locations of the devices associated to the location filter and the status of each device. Depending on the level of zoom, devices in close proximity of each other will be clustered on the map. The clusters will only contain devices with the same status. The number of devices in the cluster will appear under the cluster circle. To zoom in on the map and see the individual devices in the cluster click on the desired cluster. Hovering the mouse pointer over an individual device will display a tooltip with the device display name. Clicking on an individual device will display the Display Name, IP Address, MAC Address, Status, Number of Outages, and Standby Time Remaining.
Power Outage Events ChartThis chart displays the total number of devices associated to each condition. Hovering the mouse pointer over a bar makes a tooltip appear that displays the number of devices associated to the condition. Click on a bar to open the “POM Event Details” page to view information about the devices associated to the selected bar. From the “POM Event Details” page the displayed data can be exported to a CSV report.
Fig. 4-31, Power Outage Events ChartRuntime Remaining ChartThis chart displays the number of devices that fall under the displayed time estimates for the remaining runtime of the devices with a power outage. There is also a category to displays the number of devices that are running on a generator. Hovering the mouse pointer over a bar makes a tooltip appear that displays the number of devices associated to the condition. Click on a bar to open the “PS Outage Details” page to view information about the devices associated to the selected bar. From the “PS Outage Details” page the displayed data can be exported to a CSV report or routes can be mapped to the device(s).
Fig. 4-32, Runtime Remaining ChartPie ChartsThese charts display the percentage of devices in the different statuses. The pie charts shown depend on what location filter is set. If filtered on a Region, the Area pie chart is displayed. If filtered on an Area, the Hub pie charts are displayed. If filtered on a Hub, the specified Hub pie chart is displayed. Hovering the mouse pointer over a pie chart slice makes a tooltip appear that displays the number of devices associated to the condition. Click on a pie chart slice to open the “POM Event Details” page to view information about the devices associated to the selected bar. From the “POM Event Details” page the displayed data can be exported to a CSV report. The name buttons below the pie charts are clickable and will automatically export the Outage Details to a CSV file.
Fig. 4-33, Pie Chart
Only outage details will be exported from the pie chart, Normal and Not Reporting devices will not be included in the CSV report.
NOTICE:

4.0 Alpha XD Tabs, continued
51035-512-B0-001, Rev. A6 (01/2019)
4.5 Network InventoryAlphaXD’s Network Inventory page offers the ability to manage the configuration of network devices from a single location. The Network Inventory page provides a summary, as well as detailed information, about the configuration status of the devices in the network.
The page is divided into two sections:
• The top half of the page summarizes the configuration status of devices in the chosen network, grouped by device type.
• The bottom half of the page displays individual information for the device or devices selected in the top section.
To View and Manage Devices in the Network:
1. Choose a tree view to display by selecting a tree from the View Name Drop-Down Menu. (Selecting native will display all managed elements in the network.)
2. In the Configuration Status Summary pane, clicking a table cell with a number will display all of the devices in that category on the bottom half of the screen.
3. Select one or several devices and right-click to display the local context menu and configure the device as normal.
Selecting the right-hand drop-down menu reveals 2 options, CSV and Field Selection. The CSV option allows the currently displayed bottom half of the Network Inventory screen to be exported to a CSV report. The bottom half shows all devices that match the selected Tree and upper-half cell. Only columns that are currently displayed will be exported. The Field Selection option allows the user to select multiple fields for display, or to be hidden.
Fig. 4-34, Network Inventory Page
Configuration Status
SummaryCSV and
Field Selection
Individual Device
Information
For more information on configuring devices or templates, see the section titled “Provisioning Devices”.NOTICE:

4.0 Alpha XD Tabs, continued
52 035-512-B0-001, Rev. A6 (01/2019)
4.6 Administration — XM360 ConfigurationTo Configure the XM360 Integration, select the Administration button on the XD Tab bar. From the drop down window, select Alpha XD Admin. From the next window, select XM360 Configuration. The Configure XM360 Integration page will appear allowing the operator to enable the configuration, log in, name and set a start time and date for the polling run. Additionally, the operator may force a polling run from this window. This page also displays the last time the polling ran and when the next poll is scheduled to run.
Fig. 4-35, Location of XM360 Configuration via Administration Button
Fig. 4-36, XM360 Configuration Window

4.0 Alpha XD Tabs, continued
53035-512-B0-001, Rev. A6 (01/2019)
4.7 HelpTechnical Support information can be found in the Help tab along with links to the latest Alpha XD documentation.
The latest Alpha XD Version is listed at the top of the page.
Click View the Alpha XD User Guide from the Alpha website to load the User Manual PDF.
Click View the Alpha XD Administrator Guide from the Alpha website to load the Administrator Manual PDF.

Alpha Technologies Services, Inc Alpha reserves the right to change specifications without notice.Alpha is a registered trademark of Alpha Technologies.
For more information visit www.alpha.com
© 2019 Alpha Technologies Inc. All Rights Reserved.
035-512-B0-001, Rev. A6 (01/2019)
Worldwide Corporate Offices
North AmericaTel: +1 360 647 2360Fax: +1 360 671 4936
EuropeTel: +49 9122 79889 0Fax: +49 9122 79889 21
Latin AmericaTel: +561 792.9651Fax: +561 792.7157
Asia PacificTel: +852 2736.8663Fax: +852 2199.7988