effective discharge for suspended sediment transport...
TRANSCRIPT
Geomorphology 227 (2014) 18–30
Contents lists available at ScienceDirect
Geomorphology
j ourna l homepage: www.e lsev ie r .com/ locate /geomorph
Effective discharge for suspended sediment transport of the Ganga Riverand its geomorphic implication
N.G. Roy, R. Sinha ⁎Department of Earth Sciences, Indian Institute of Technology Kanpur, Kanpur 208016, India
⁎ Corresponding author. Tel.: +91 512 6797317; fax: +E-mail address: [email protected] (R. Sinha).
http://dx.doi.org/10.1016/j.geomorph.2014.04.0290169-555X/© 2014 Elsevier B.V. All rights reserved.
a b s t r a c t
a r t i c l e i n f oArticle history:Received 15 June 2013Received in revised form 22 March 2014Accepted 25 April 2014Available online 5 May 2014
Keywords:Effective dischargeSediment transportGeomorphic effectivenessWestern Ganga alluvial plains
Effective discharge (Qe) for suspended sediment transport in the alluvial reaches of the Ganga River in the west-ern Ganga plains (WGP) has been computed using ‘analytical’ and an alternative ‘magnitude–frequency’approach. Thirty years ofmeanmonthly discharge data from various sites of the Ganga River have been assessed,and the abundance of discharge occurrence has been determined. Our analysis shows that less than 40% of theflow causes effective sediment transport in the Ganga, and this can be considered as the effective discharge forsuspended sediment transport. Alternatively, 50% of the sediment load for all studied sites is moved by a dis-charge varying between 14 and 40% of the total discharge. Effective discharges calculated over the period of re-cord are well below the bankfull discharges (Qb). A few events are close to the bankfull level, but with a highreturn period (RI N 40 years), and therefore, not effective to transport most of the available sediments. Our com-putation shows that themean annual discharge (RI = 2.33 yrs) can transport only 0 to 10% of the total availablesediments. The computation of effective discharge also provided important insights to understand the linkage be-tween hydrology and channel morphology. Sediment storage and removal processes, which are reflected in sed-iment budget, cause changes in cross-sectional area/channel bathymetry at various sites but the channelmarginsare not affected. A high ratio of bankfull to effective discharge (Qb/Qe) forces the flow lines to be concentrated tothe thalweg position and channels are incised. Our study also implies that incision and aggradation of the rivervalley during a relatively long period are caused by changes in effective discharge. We argue that the valley inci-sion and filling episodes in the western Ganga plains at Late Quaternary timescales in response to monsoonalfluctuations were primarily affected by changes in the effective discharges of the rivers.
© 2014 Elsevier B.V. All rights reserved.
1. Introduction
Alluvial channels are generally impacted by high streampower lead-ing to erosion along the thalweg and channel banks and are impaired bylow transport capacity leading to channel aggradation. Stability of ariver channel is essentially dependent on its ability to convey sedimentssupplied to the river without net erosion or aggradation of riverbed andbanks. Such ability of the river channel is measured by the effective dis-charge, defined as the discharge at which maximum geomorphic workis performed in a river channel (Wolman and Miller, 1960). Under-standing of the effective discharge has been used for the assessmentand monitoring of minimum stream flow requirements for the stabilityof channel (Wahl et al., 1995; Hester et al., 2006), engineering construc-tion, environmental enhancement and ecological restoration of riversall of which require maintaining of adequate water discharge over along period (Shields et al., 2003). Alluvial rivers generally have uncon-fined (not well-channelized) flow of water and sediment supplied
91 512 679260.
from the drainage basin (Gomez et al., 2007) that can cause numerouseffects, especially in the long term, including changes in flowmagnitude(volume) and frequency (Esmaeili and Mahdav, 2002). Maintaining ef-fective discharge through a channel is required to mobilize sedimentsand to maintain the channel form. Any change in water to sedimentratio through the channel alters the channel morphology significantly,and the channel finally adjusts to a new set of discharge values. Sedi-ment accumulation in the riverbed during low flow condition impactsthe ecological habitat and channel maintenance. For instance, the fishhabitat in the Upper Colorado River was reported to be endangereddue to low flow (Pitlick and Van Steeter, 1998). Hudson and Mossa(1997) suggested that flow magnitude and frequency provide a usefulframework for understanding the timing and flux of sediments fromrivers draining a range of geologic and climatic change aswell as for an-alyzing the transfer of fluvial sediment-associated pollutants to the nearshore environments. Orndorff and Whiting (1999) found effective dis-charge to be a useful index for river restoration and maintenance pro-jects. Doyle and Shields (2008) defined an ecologically effectivedischarge as the discharge that drives the transport of organic matter,algal growth, nutrient retention, macro-invertebrate disturbance, andhabitat availability.
19N.G. Roy, R. Sinha / Geomorphology 227 (2014) 18–30
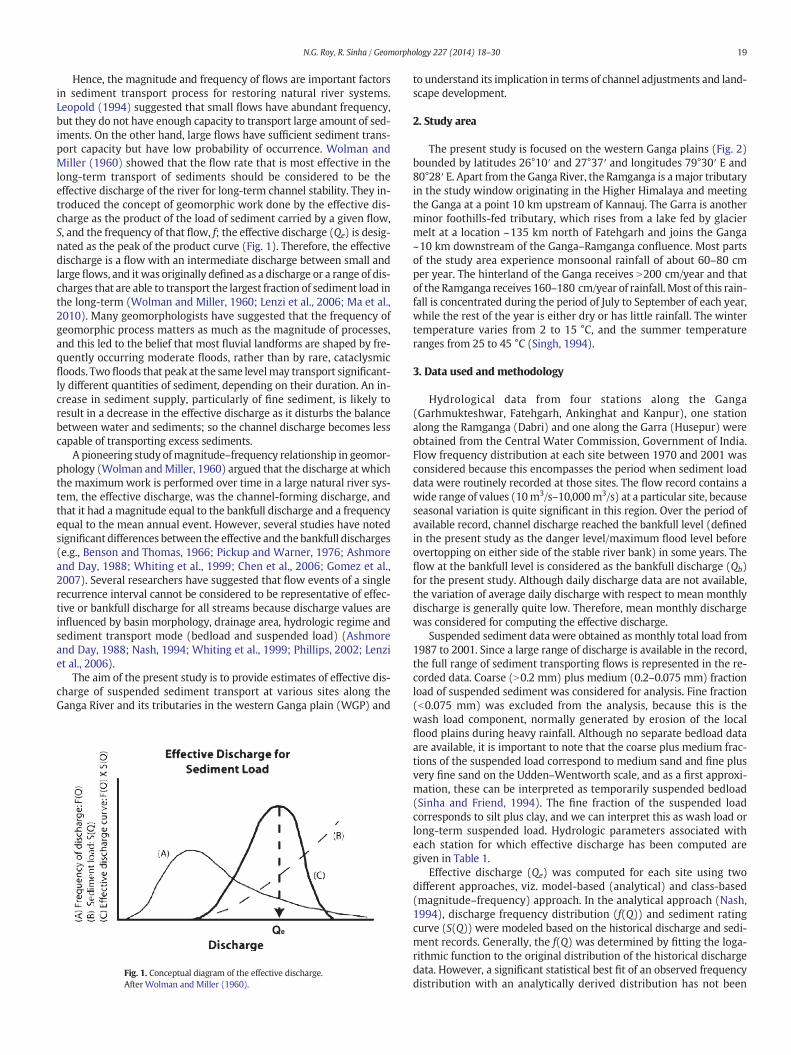
Hence, the magnitude and frequency of flows are important factorsin sediment transport process for restoring natural river systems.Leopold (1994) suggested that small flows have abundant frequency,but they do not have enough capacity to transport large amount of sed-iments. On the other hand, large flows have sufficient sediment trans-port capacity but have low probability of occurrence. Wolman andMiller (1960) showed that the flow rate that is most effective in thelong-term transport of sediments should be considered to be theeffective discharge of the river for long-term channel stability. They in-troduced the concept of geomorphic work done by the effective dis-charge as the product of the load of sediment carried by a given flow,S, and the frequency of that flow, f; the effective discharge (Qe) is desig-nated as the peak of the product curve (Fig. 1). Therefore, the effectivedischarge is a flow with an intermediate discharge between small andlarge flows, and it was originally defined as a discharge or a range of dis-charges that are able to transport the largest fraction of sediment load inthe long-term (Wolman and Miller, 1960; Lenzi et al., 2006; Ma et al.,2010). Many geomorphologists have suggested that the frequency ofgeomorphic process matters as much as the magnitude of processes,and this led to the belief that most fluvial landforms are shaped by fre-quently occurring moderate floods, rather than by rare, cataclysmicfloods. Two floods that peak at the same levelmay transport significant-ly different quantities of sediment, depending on their duration. An in-crease in sediment supply, particularly of fine sediment, is likely toresult in a decrease in the effective discharge as it disturbs the balancebetween water and sediments; so the channel discharge becomes lesscapable of transporting excess sediments.
A pioneering study ofmagnitude–frequency relationship in geomor-phology (Wolman andMiller, 1960) argued that the discharge at whichthe maximumwork is performed over time in a large natural river sys-tem, the effective discharge, was the channel-forming discharge, andthat it had a magnitude equal to the bankfull discharge and a frequencyequal to the mean annual event. However, several studies have notedsignificant differences between the effective and the bankfull discharges(e.g., Benson and Thomas, 1966; Pickup and Warner, 1976; Ashmoreand Day, 1988; Whiting et al., 1999; Chen et al., 2006; Gomez et al.,2007). Several researchers have suggested that flow events of a singlerecurrence interval cannot be considered to be representative of effec-tive or bankfull discharge for all streams because discharge values areinfluenced by basin morphology, drainage area, hydrologic regime andsediment transport mode (bedload and suspended load) (Ashmoreand Day, 1988; Nash, 1994; Whiting et al., 1999; Phillips, 2002; Lenziet al., 2006).
The aim of the present study is to provide estimates of effective dis-charge of suspended sediment transport at various sites along theGanga River and its tributaries in the western Ganga plain (WGP) and
Qe
Fig. 1. Conceptual diagram of the effective discharge.After Wolman and Miller (1960).
to understand its implication in terms of channel adjustments and land-scape development.
2. Study area
The present study is focused on the western Ganga plains (Fig. 2)bounded by latitudes 26°10′ and 27°37′ and longitudes 79°30′ E and80°28′ E. Apart from the Ganga River, the Ramganga is amajor tributaryin the study window originating in the Higher Himalaya and meetingthe Ganga at a point 10 km upstream of Kannauj. The Garra is anotherminor foothills-fed tributary, which rises from a lake fed by glaciermelt at a location ~135 km north of Fatehgarh and joins the Ganga~10 km downstream of the Ganga–Ramganga confluence. Most partsof the study area experience monsoonal rainfall of about 60–80 cmper year. The hinterland of the Ganga receives N200 cm/year and thatof the Ramganga receives 160–180 cm/year of rainfall. Most of this rain-fall is concentrated during the period of July to September of each year,while the rest of the year is either dry or has little rainfall. The wintertemperature varies from 2 to 15 °C, and the summer temperatureranges from 25 to 45 °C (Singh, 1994).
3. Data used and methodology
Hydrological data from four stations along the Ganga(Garhmukteshwar, Fatehgarh, Ankinghat and Kanpur), one stationalong the Ramganga (Dabri) and one along the Garra (Husepur) wereobtained from the Central Water Commission, Government of India.Flow frequency distribution at each site between 1970 and 2001 wasconsidered because this encompasses the period when sediment loaddata were routinely recorded at those sites. The flow record contains awide range of values (10m3/s–10,000m3/s) at a particular site, becauseseasonal variation is quite significant in this region. Over the period ofavailable record, channel discharge reached the bankfull level (definedin the present study as the danger level/maximum flood level beforeovertopping on either side of the stable river bank) in some years. Theflow at the bankfull level is considered as the bankfull discharge (Qb)for the present study. Although daily discharge data are not available,the variation of average daily discharge with respect to mean monthlydischarge is generally quite low. Therefore, mean monthly dischargewas considered for computing the effective discharge.
Suspended sediment data were obtained as monthly total load from1987 to 2001. Since a large range of discharge is available in the record,the full range of sediment transporting flows is represented in the re-corded data. Coarse (N0.2 mm) plus medium (0.2–0.075 mm) fractionload of suspended sediment was considered for analysis. Fine fraction(b0.075 mm) was excluded from the analysis, because this is thewash load component, normally generated by erosion of the localflood plains during heavy rainfall. Although no separate bedload dataare available, it is important to note that the coarse plus medium frac-tions of the suspended load correspond to medium sand and fine plusvery fine sand on the Udden–Wentworth scale, and as a first approxi-mation, these can be interpreted as temporarily suspended bedload(Sinha and Friend, 1994). The fine fraction of the suspended loadcorresponds to silt plus clay, and we can interpret this as wash load orlong-term suspended load. Hydrologic parameters associated witheach station for which effective discharge has been computed aregiven in Table 1.
Effective discharge (Qe) was computed for each site using twodifferent approaches, viz. model-based (analytical) and class-based(magnitude–frequency) approach. In the analytical approach (Nash,1994), discharge frequency distribution (f(Q)) and sediment ratingcurve (S(Q)) were modeled based on the historical discharge and sedi-ment records. Generally, the f(Q) was determined by fitting the loga-rithmic function to the original distribution of the historical dischargedata. However, a significant statistical best fit of an observed frequencydistribution with an analytically derived distribution has not been
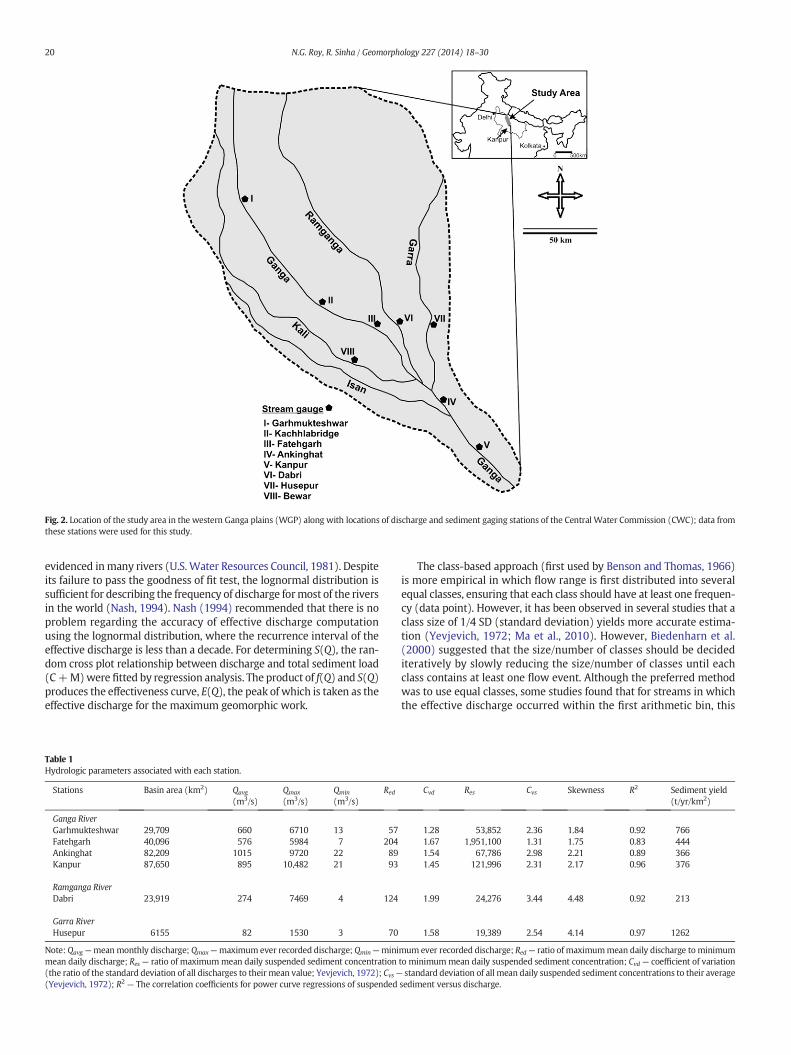
Fig. 2. Location of the study area in the western Ganga plains (WGP) along with locations of discharge and sediment gaging stations of the Central Water Commission (CWC); data fromthese stations were used for this study.
20 N.G. Roy, R. Sinha / Geomorphology 227 (2014) 18–30
evidenced inmany rivers (U.S. Water Resources Council, 1981). Despiteits failure to pass the goodness of fit test, the lognormal distribution issufficient for describing the frequency of discharge formost of the riversin the world (Nash, 1994). Nash (1994) recommended that there is noproblem regarding the accuracy of effective discharge computationusing the lognormal distribution, where the recurrence interval of theeffective discharge is less than a decade. For determining S(Q), the ran-dom cross plot relationship between discharge and total sediment load(C+M)were fitted by regression analysis. The product of f(Q) and S(Q)produces the effectiveness curve, E(Q), the peak of which is taken as theeffective discharge for the maximum geomorphic work.
Table 1Hydrologic parameters associated with each station.
Stations Basin area (km2) Qavg
(m3/s)Qmax
(m3/s)Qmin
(m3/s)Red
Ganga RiverGarhmukteshwar 29,709 660 6710 13 57Fatehgarh 40,096 576 5984 7 204Ankinghat 82,209 1015 9720 22 89Kanpur 87,650 895 10,482 21 93
Ramganga RiverDabri 23,919 274 7469 4 124
Garra RiverHusepur 6155 82 1530 3 70
Note: Qavg —meanmonthly discharge; Qmax—maximum ever recorded discharge; Qmin—minimean daily discharge; Res — ratio of maximummean daily suspended sediment concentration(the ratio of the standard deviation of all discharges to their mean value; Yevjevich, 1972); Cvs—(Yevjevich, 1972); R2 — The correlation coefficients for power curve regressions of suspended
The class-based approach (first used by Benson and Thomas, 1966)is more empirical in which flow range is first distributed into severalequal classes, ensuring that each class should have at least one frequen-cy (data point). However, it has been observed in several studies that aclass size of 1/4 SD (standard deviation) yields more accurate estima-tion (Yevjevich, 1972; Ma et al., 2010). However, Biedenharn et al.(2000) suggested that the size/number of classes should be decidediteratively by slowly reducing the size/number of classes until eachclass contains at least one flow event. Although the preferred methodwas to use equal classes, some studies found that for streams in whichthe effective discharge occurred within the first arithmetic bin, this
Cvd Res Cvs Skewness R2 Sediment yield(t/yr/km2)
1.28 53,852 2.36 1.84 0.92 7661.67 1,951,100 1.31 1.75 0.83 4441.54 67,786 2.98 2.21 0.89 3661.45 121,996 2.31 2.17 0.96 376
1.99 24,276 3.44 4.48 0.92 213
1.58 19,389 2.54 4.14 0.97 1262
mum ever recorded discharge; Red— ratio of maximummean daily discharge to minimumto minimummean daily suspended sediment concentration; Cvd — coefficient of variationstandard deviation of all mean daily suspended sediment concentrations to their average
sediment versus discharge.
21N.G. Roy, R. Sinha / Geomorphology 227 (2014) 18–30
may underestimate effective discharge estimation [cf. Hotopha Creek,Mississippi river;Watson et al. (1997)], and therefore, the flowdistribu-tion would be better represented if logarithmic class divisions wereused (Biedenharn et al., 2000; Johnson, 2002). For simplicity, the repre-sentative discharge of each class is considered to be themidpoint of thecorresponding interval. Then, the total suspended bedload (C + M)transported by flow discharge in each class interval is calculated bysumming the suspended sediment load of all sample points thatfall within the corresponding class interval. This integrative approachcan be considered equivalent to the approach described by Crowderand Knapp (2005) and Ma et al. (2010). Wolman and Miller (1960)once pointed out that the effective dischargewould be an event of inter-mediate frequency of the flow distribution, at least for fine grainedalluvial sand-bed rivers (low sediment entrainment threshold) with ahumid/sub-humid temperate climate and well-vegetated catchments(Werritty, 1997). Later, it was observed that the estimated effective dis-charge by magnitude–frequency approach is an intermediate eventfor rivers from different hydrological regimes (monsoonal, tropicaldry–wet) as well as from a variety of geological and topographic set-tings (Thorne et al., 1993; Amsler et al., 2005). Accordingly, thesuspended sediment load in all corresponding classes was calculatedand plotted in a histogram against the representative discharge(discussed later). Flow discharge corresponding to the peak ofsuspended load in the histogram was then determined to be the effec-tive discharge.
4. Results and analysis
4.1. Discharge distribution and sediment rating analysis
Discharge distribution of each sitewas best fitted to lognormal prob-ability distribution function. Although testing statistical goodness of fit(χ2 test) of these discharge distributions does not show a statisticallysignificant (p = 5%) result except for the distribution of Husepur siteon the Garra. Table 1 shows the ratio of the maximum mean daily dis-charge to minimum mean daily discharge (Red) and the coefficient ofvariation (Cvd) (the ratio of the standard deviation of all discharges totheir mean value; Yevjevich, 1972; Ma et al., 2010) for each site. Valuesof Cvd indicate that theflowvariability is notably larger at the sites of thetributaries. This reflects that relatively higher magnitude of extremeflow events occurs at these sites.
Suspended sediment transport at each site for the period of studywas calculated using the rating curves. Relationship between river dis-charge and sediment load is best expressed by a power equation andthe correlation coefficients of power curve fitting for each site includingequation parameters are listed in Table 2. The correlation coefficients
Table 2Effective discharge and associated parameters using deterministic and analytical approaches.
Stations Results of deterministic approach Results of an
Qe RI Duration Lognormaldistribution
(m3/s) Year (%) Days/yr μ
Ganga RiverGarhmukteshwar 2702 1.14 0.50 2 5.57Fatehgarh 2404 1.06 0.87 3 4.60Ankinghat 3876 1.07 2.53 9 5.65Kanpur 3505 1.06 2.20 8 5.65
Ramganga RiverDabri 3190 2.65 0.15 1 4.69
Garra RiverHusepur 1053 5.12 0.01 0 3.44
Note: Qe — effective discharge; RI = recurrence interval; μ — mean; σ — standard deviation.
(R2) for power curve regressions of suspended sediment versus dis-charge at these sites ranged from 0.83 to 0.97 with an average of 0.90.
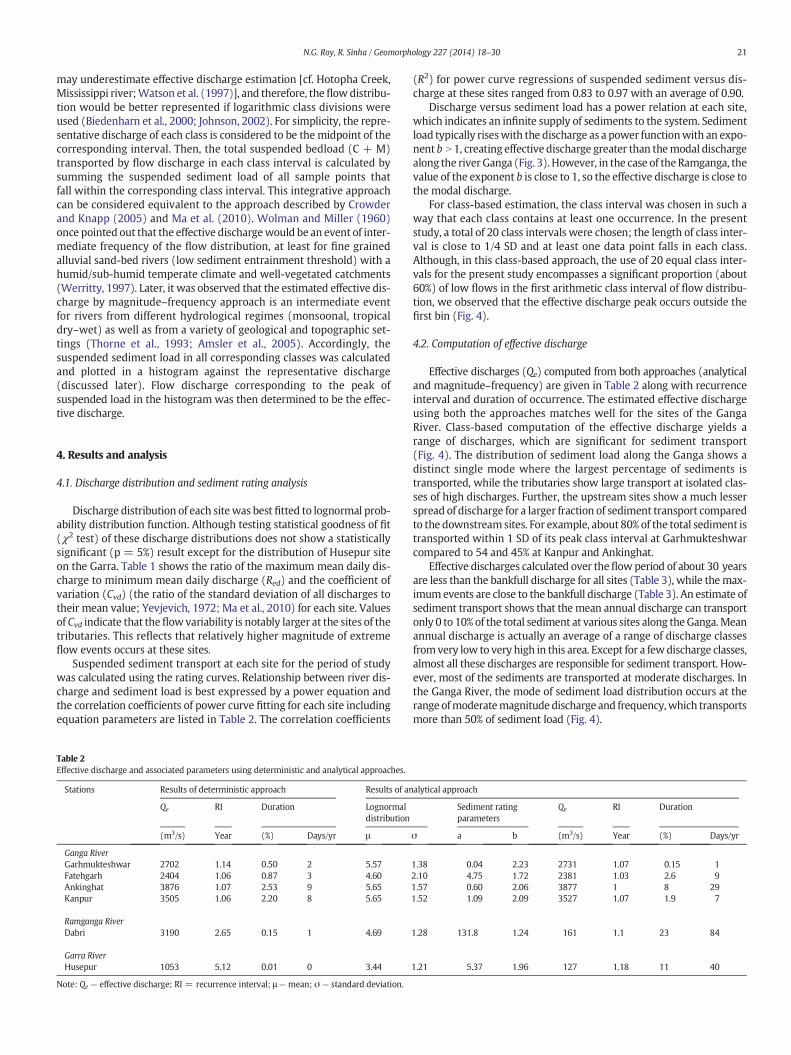
Discharge versus sediment load has a power relation at each site,which indicates an infinite supply of sediments to the system. Sedimentload typically riseswith the discharge as a power functionwith an expo-nent b N 1, creating effective discharge greater than themodal dischargealong the river Ganga (Fig. 3). However, in the case of the Ramganga, thevalue of the exponent b is close to 1, so the effective discharge is close tothe modal discharge.
For class-based estimation, the class interval was chosen in such away that each class contains at least one occurrence. In the presentstudy, a total of 20 class intervals were chosen; the length of class inter-val is close to 1/4 SD and at least one data point falls in each class.Although, in this class-based approach, the use of 20 equal class inter-vals for the present study encompasses a significant proportion (about60%) of low flows in the first arithmetic class interval of flow distribu-tion, we observed that the effective discharge peak occurs outside thefirst bin (Fig. 4).
4.2. Computation of effective discharge
Effective discharges (Qe) computed from both approaches (analyticaland magnitude–frequency) are given in Table 2 along with recurrenceinterval and duration of occurrence. The estimated effective dischargeusing both the approaches matches well for the sites of the GangaRiver. Class-based computation of the effective discharge yields arange of discharges, which are significant for sediment transport(Fig. 4). The distribution of sediment load along the Ganga shows adistinct single mode where the largest percentage of sediments istransported, while the tributaries show large transport at isolated clas-ses of high discharges. Further, the upstream sites show a much lesserspread of discharge for a larger fraction of sediment transport comparedto the downstream sites. For example, about 80% of the total sediment istransported within 1 SD of its peak class interval at Garhmukteshwarcompared to 54 and 45% at Kanpur and Ankinghat.
Effective discharges calculated over theflowperiod of about 30 yearsare less than the bankfull discharge for all sites (Table 3), while themax-imumevents are close to the bankfull discharge (Table 3). An estimate ofsediment transport shows that themean annual discharge can transportonly 0 to 10% of the total sediment at various sites along theGanga.Meanannual discharge is actually an average of a range of discharge classesfromvery low to very high in this area. Except for a fewdischarge classes,almost all these discharges are responsible for sediment transport. How-ever, most of the sediments are transported at moderate discharges. Inthe Ganga River, the mode of sediment load distribution occurs at therange ofmoderatemagnitude discharge and frequency,which transportsmore than 50% of sediment load (Fig. 4).
alytical approach
Sediment ratingparameters
Qe RI Duration
σ a b (m3/s) Year (%) Days/yr
1.38 0.04 2.23 2731 1.07 0.15 12.10 4.75 1.72 2381 1.03 2.6 91.57 0.60 2.06 3877 1 8 291.52 1.09 2.09 3527 1.07 1.9 7
1.28 131.8 1.24 161 1.1 23 84
1.21 5.37 1.96 127 1.18 11 40
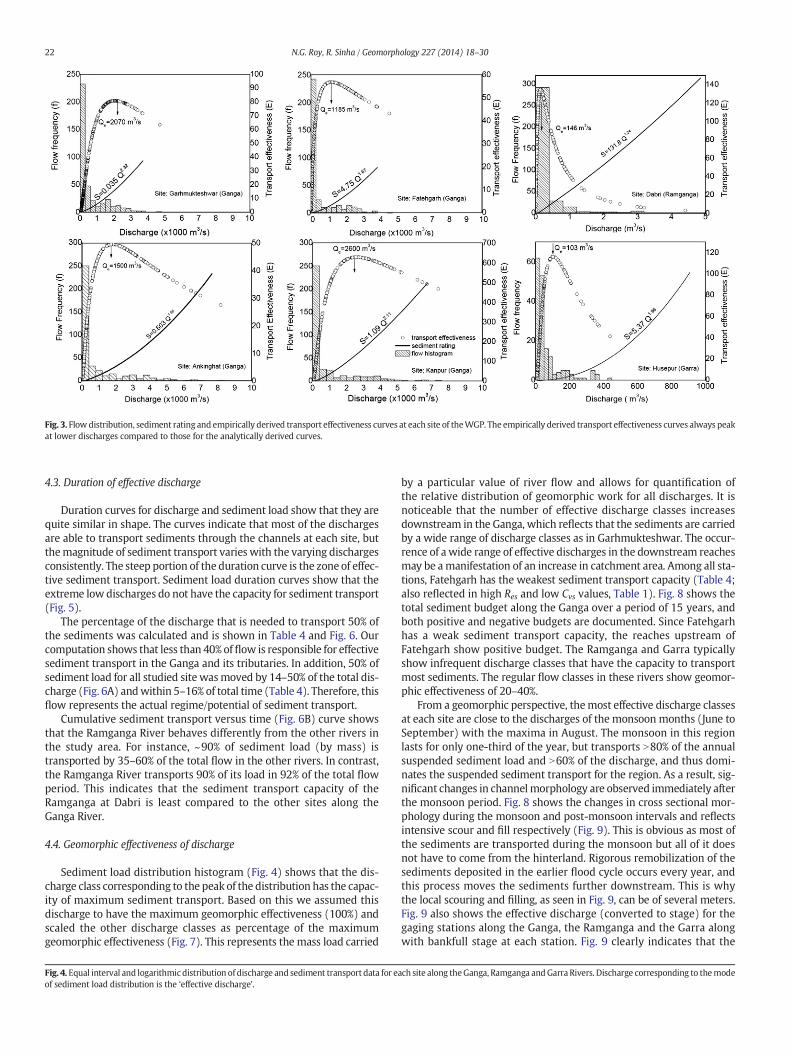
Fig. 3. Flowdistribution, sediment rating and empirically derived transport effectiveness curves at each site of theWGP. The empirically derived transport effectiveness curves always peakat lower discharges compared to those for the analytically derived curves.
22 N.G. Roy, R. Sinha / Geomorphology 227 (2014) 18–30
4.3. Duration of effective discharge
Duration curves for discharge and sediment load show that they arequite similar in shape. The curves indicate that most of the dischargesare able to transport sediments through the channels at each site, butthemagnitude of sediment transport varies with the varying dischargesconsistently. The steep portion of the duration curve is the zone of effec-tive sediment transport. Sediment load duration curves show that theextreme low discharges do not have the capacity for sediment transport(Fig. 5).
The percentage of the discharge that is needed to transport 50% ofthe sediments was calculated and is shown in Table 4 and Fig. 6. Ourcomputation shows that less than 40%offlow is responsible for effectivesediment transport in the Ganga and its tributaries. In addition, 50% ofsediment load for all studied site wasmoved by 14–50% of the total dis-charge (Fig. 6A) andwithin 5–16% of total time (Table 4). Therefore, thisflow represents the actual regime/potential of sediment transport.
Cumulative sediment transport versus time (Fig. 6B) curve showsthat the Ramganga River behaves differently from the other rivers inthe study area. For instance, ~90% of sediment load (by mass) istransported by 35–60% of the total flow in the other rivers. In contrast,the Ramganga River transports 90% of its load in 92% of the total flowperiod. This indicates that the sediment transport capacity of theRamganga at Dabri is least compared to the other sites along theGanga River.
4.4. Geomorphic effectiveness of discharge
Sediment load distribution histogram (Fig. 4) shows that the dis-charge class corresponding to the peak of the distribution has the capac-ity of maximum sediment transport. Based on this we assumed thisdischarge to have the maximum geomorphic effectiveness (100%) andscaled the other discharge classes as percentage of the maximumgeomorphic effectiveness (Fig. 7). This represents the mass load carried
Fig. 4. Equal interval and logarithmic distribution of discharge and sediment transport data for eof sediment load distribution is the ‘effective discharge’.
by a particular value of river flow and allows for quantification ofthe relative distribution of geomorphic work for all discharges. It isnoticeable that the number of effective discharge classes increasesdownstream in the Ganga, which reflects that the sediments are carriedby a wide range of discharge classes as in Garhmukteshwar. The occur-rence of a wide range of effective discharges in the downstream reachesmay be amanifestation of an increase in catchment area. Among all sta-tions, Fatehgarh has the weakest sediment transport capacity (Table 4;also reflected in high Res and low Cvs values, Table 1). Fig. 8 shows thetotal sediment budget along the Ganga over a period of 15 years, andboth positive and negative budgets are documented. Since Fatehgarhhas a weak sediment transport capacity, the reaches upstream ofFatehgarh show positive budget. The Ramganga and Garra typicallyshow infrequent discharge classes that have the capacity to transportmost sediments. The regular flow classes in these rivers show geomor-phic effectiveness of 20–40%.
From a geomorphic perspective, themost effective discharge classesat each site are close to the discharges of the monsoon months (June toSeptember) with the maxima in August. The monsoon in this regionlasts for only one-third of the year, but transports N80% of the annualsuspended sediment load and N60% of the discharge, and thus domi-nates the suspended sediment transport for the region. As a result, sig-nificant changes in channelmorphology are observed immediately afterthe monsoon period. Fig. 8 shows the changes in cross sectional mor-phology during the monsoon and post-monsoon intervals and reflectsintensive scour and fill respectively (Fig. 9). This is obvious as most ofthe sediments are transported during the monsoon but all of it doesnot have to come from the hinterland. Rigorous remobilization of thesediments deposited in the earlier flood cycle occurs every year, andthis process moves the sediments further downstream. This is whythe local scouring and filling, as seen in Fig. 9, can be of several meters.Fig. 9 also shows the effective discharge (converted to stage) for thegaging stations along the Ganga, the Ramganga and the Garra alongwith bankfull stage at each station. Fig. 9 clearly indicates that the
ach site along theGanga, Ramganga andGarra Rivers. Discharge corresponding to themode
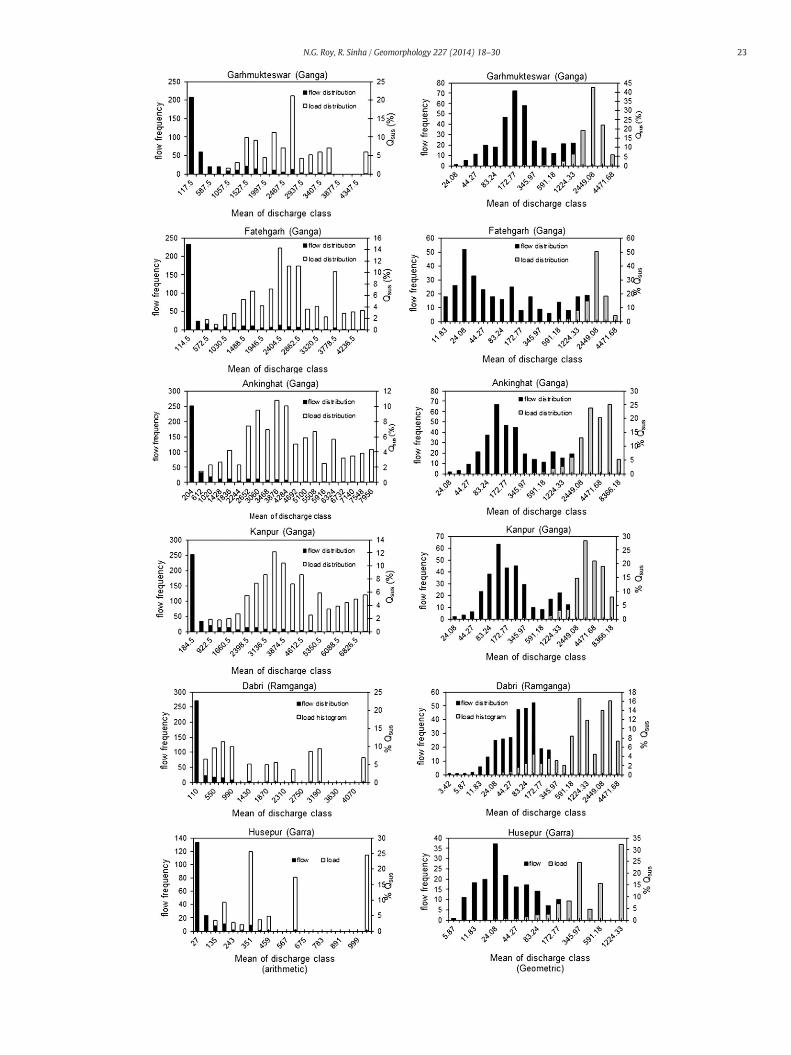
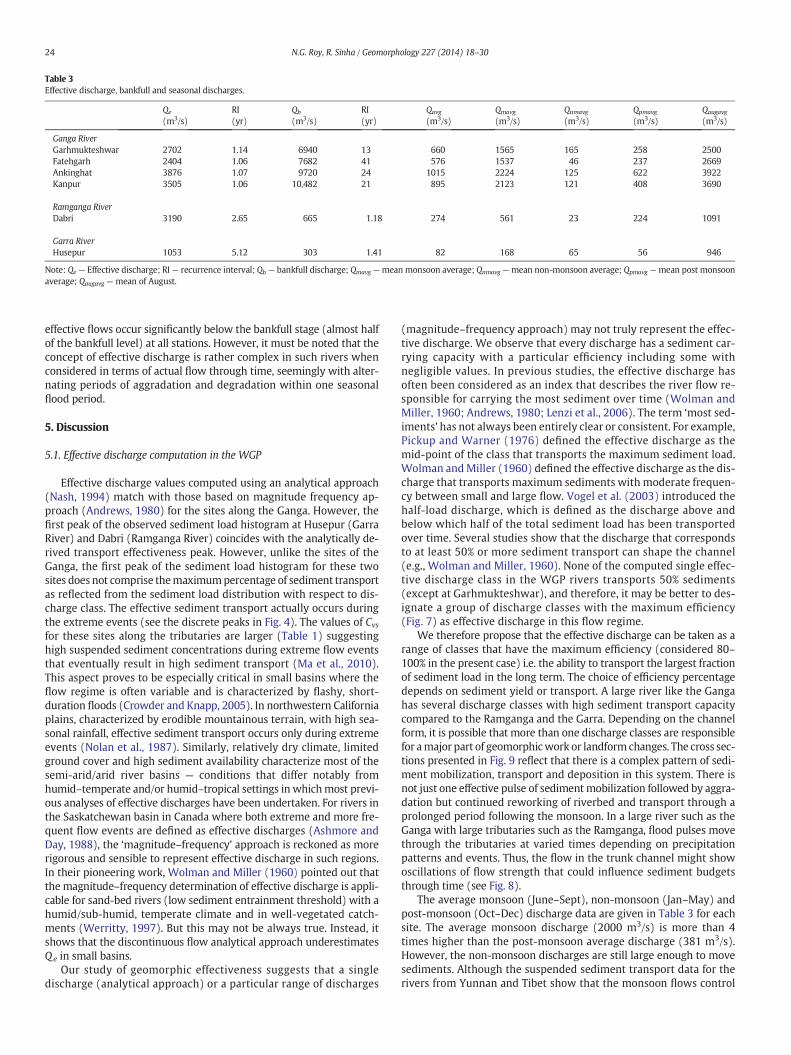
Table 3Effective discharge, bankfull and seasonal discharges.
Qe
(m3/s)RI(yr)
Qb
(m3/s)RI(yr)
Qavg
(m3/s)Qmavg
(m3/s)Qnmavg
(m3/s)Qpmavg
(m3/s)Qaugavg
(m3/s)
Ganga RiverGarhmukteshwar 2702 1.14 6940 13 660 1565 165 258 2500Fatehgarh 2404 1.06 7682 41 576 1537 46 237 2669Ankinghat 3876 1.07 9720 24 1015 2224 125 622 3922Kanpur 3505 1.06 10,482 21 895 2123 121 408 3690
Ramganga RiverDabri 3190 2.65 665 1.18 274 561 23 224 1091
Garra RiverHusepur 1053 5.12 303 1.41 82 168 65 56 946
Note: Qe — Effective discharge; RI— recurrence interval; Qb — bankfull discharge; Qmavg —mean monsoon average; Qnmavg —mean non-monsoon average; Qpmavg —mean post monsoonaverage; Qaugavg — mean of August.
24 N.G. Roy, R. Sinha / Geomorphology 227 (2014) 18–30
effective flows occur significantly below the bankfull stage (almost halfof the bankfull level) at all stations. However, it must be noted that theconcept of effective discharge is rather complex in such rivers whenconsidered in terms of actual flow through time, seemingly with alter-nating periods of aggradation and degradation within one seasonalflood period.
5. Discussion
5.1. Effective discharge computation in the WGP
Effective discharge values computed using an analytical approach(Nash, 1994) match with those based on magnitude frequency ap-proach (Andrews, 1980) for the sites along the Ganga. However, thefirst peak of the observed sediment load histogram at Husepur (GarraRiver) and Dabri (Ramganga River) coincides with the analytically de-rived transport effectiveness peak. However, unlike the sites of theGanga, the first peak of the sediment load histogram for these twosites does not comprise themaximumpercentage of sediment transportas reflected from the sediment load distribution with respect to dis-charge class. The effective sediment transport actually occurs duringthe extreme events (see the discrete peaks in Fig. 4). The values of Cvsfor these sites along the tributaries are larger (Table 1) suggestinghigh suspended sediment concentrations during extreme flow eventsthat eventually result in high sediment transport (Ma et al., 2010).This aspect proves to be especially critical in small basins where theflow regime is often variable and is characterized by flashy, short-duration floods (Crowder and Knapp, 2005). In northwestern Californiaplains, characterized by erodible mountainous terrain, with high sea-sonal rainfall, effective sediment transport occurs only during extremeevents (Nolan et al., 1987). Similarly, relatively dry climate, limitedground cover and high sediment availability characterize most of thesemi-arid/arid river basins — conditions that differ notably fromhumid–temperate and/or humid–tropical settings in whichmost previ-ous analyses of effective discharges have been undertaken. For rivers inthe Saskatchewan basin in Canada where both extreme and more fre-quent flow events are defined as effective discharges (Ashmore andDay, 1988), the ‘magnitude–frequency’ approach is reckoned as morerigorous and sensible to represent effective discharge in such regions.In their pioneering work, Wolman and Miller (1960) pointed out thatthe magnitude–frequency determination of effective discharge is appli-cable for sand-bed rivers (low sediment entrainment threshold) with ahumid/sub-humid, temperate climate and in well-vegetated catch-ments (Werritty, 1997). But this may not be always true. Instead, itshows that the discontinuous flow analytical approach underestimatesQe in small basins.
Our study of geomorphic effectiveness suggests that a singledischarge (analytical approach) or a particular range of discharges
(magnitude–frequency approach) may not truly represent the effec-tive discharge. We observe that every discharge has a sediment car-rying capacity with a particular efficiency including some withnegligible values. In previous studies, the effective discharge hasoften been considered as an index that describes the river flow re-sponsible for carrying the most sediment over time (Wolman andMiller, 1960; Andrews, 1980; Lenzi et al., 2006). The term ‘most sed-iments’ has not always been entirely clear or consistent. For example,Pickup and Warner (1976) defined the effective discharge as themid-point of the class that transports the maximum sediment load.Wolman andMiller (1960) defined the effective discharge as the dis-charge that transports maximum sediments with moderate frequen-cy between small and large flow. Vogel et al. (2003) introduced thehalf-load discharge, which is defined as the discharge above andbelow which half of the total sediment load has been transportedover time. Several studies show that the discharge that correspondsto at least 50% or more sediment transport can shape the channel(e.g., Wolman and Miller, 1960). None of the computed single effec-tive discharge class in the WGP rivers transports 50% sediments(except at Garhmukteshwar), and therefore, it may be better to des-ignate a group of discharge classes with the maximum efficiency(Fig. 7) as effective discharge in this flow regime.
We therefore propose that the effective discharge can be taken as arange of classes that have the maximum efficiency (considered 80–100% in the present case) i.e. the ability to transport the largest fractionof sediment load in the long term. The choice of efficiency percentagedepends on sediment yield or transport. A large river like the Gangahas several discharge classes with high sediment transport capacitycompared to the Ramganga and the Garra. Depending on the channelform, it is possible that more than one discharge classes are responsiblefor amajor part of geomorphicwork or landform changes. The cross sec-tions presented in Fig. 9 reflect that there is a complex pattern of sedi-ment mobilization, transport and deposition in this system. There isnot just one effective pulse of sediment mobilization followed by aggra-dation but continued reworking of riverbed and transport through aprolonged period following the monsoon. In a large river such as theGanga with large tributaries such as the Ramganga, flood pulses movethrough the tributaries at varied times depending on precipitationpatterns and events. Thus, the flow in the trunk channel might showoscillations of flow strength that could influence sediment budgetsthrough time (see Fig. 8).
The average monsoon (June–Sept), non-monsoon (Jan–May) andpost-monsoon (Oct–Dec) discharge data are given in Table 3 for eachsite. The average monsoon discharge (2000 m3/s) is more than 4times higher than the post-monsoon average discharge (381 m3/s).However, the non-monsoon discharges are still large enough to movesediments. Although the suspended sediment transport data for therivers from Yunnan and Tibet show that the monsoon flows control
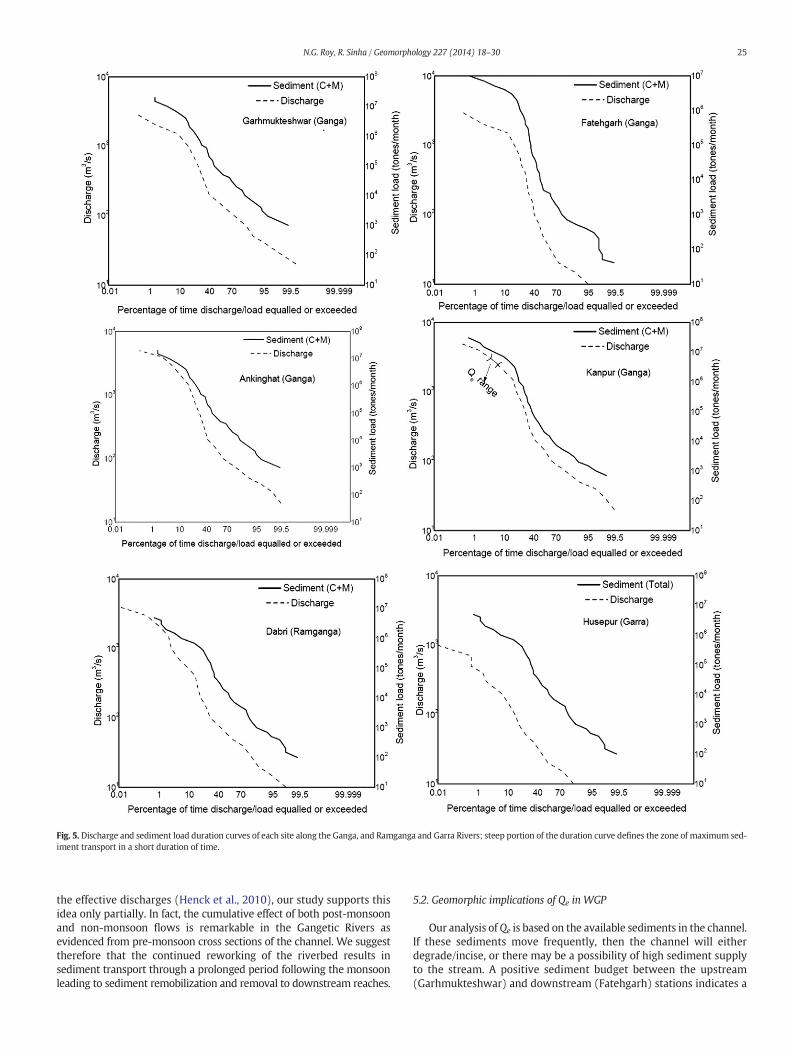
Fig. 5. Discharge and sediment load duration curves of each site along the Ganga, and Ramganga and Garra Rivers; steep portion of the duration curve defines the zone of maximum sed-iment transport in a short duration of time.
25N.G. Roy, R. Sinha / Geomorphology 227 (2014) 18–30
the effective discharges (Henck et al., 2010), our study supports thisidea only partially. In fact, the cumulative effect of both post-monsoonand non-monsoon flows is remarkable in the Gangetic Rivers asevidenced from pre-monsoon cross sections of the channel. We suggesttherefore that the continued reworking of the riverbed results insediment transport through a prolonged period following the monsoonleading to sediment remobilization and removal to downstream reaches.
5.2. Geomorphic implications of Qe in WGP
Our analysis of Qe is based on the available sediments in the channel.If these sediments move frequently, then the channel will eitherdegrade/incise, or there may be a possibility of high sediment supplyto the stream. A positive sediment budget between the upstream(Garhmukteshwar) and downstream (Fatehgarh) stations indicates a
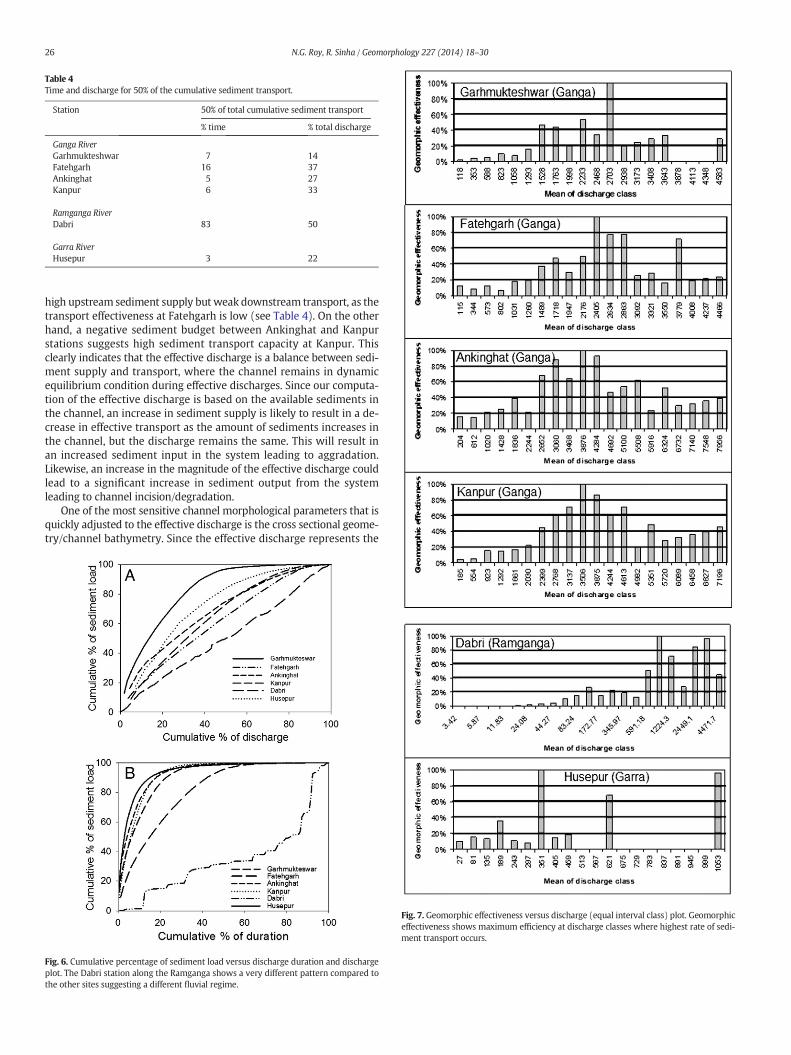
Table 4Time and discharge for 50% of the cumulative sediment transport.
Station 50% of total cumulative sediment transport
% time % total discharge
Ganga RiverGarhmukteshwar 7 14Fatehgarh 16 37Ankinghat 5 27Kanpur 6 33
Ramganga RiverDabri 83 50
Garra RiverHusepur 3 22
26 N.G. Roy, R. Sinha / Geomorphology 227 (2014) 18–30
high upstream sediment supply but weak downstream transport, as thetransport effectiveness at Fatehgarh is low (see Table 4). On the otherhand, a negative sediment budget between Ankinghat and Kanpurstations suggests high sediment transport capacity at Kanpur. Thisclearly indicates that the effective discharge is a balance between sedi-ment supply and transport, where the channel remains in dynamicequilibrium condition during effective discharges. Since our computa-tion of the effective discharge is based on the available sediments inthe channel, an increase in sediment supply is likely to result in a de-crease in effective transport as the amount of sediments increases inthe channel, but the discharge remains the same. This will result inan increased sediment input in the system leading to aggradation.Likewise, an increase in the magnitude of the effective discharge couldlead to a significant increase in sediment output from the systemleading to channel incision/degradation.
One of the most sensitive channel morphological parameters that isquickly adjusted to the effective discharge is the cross sectional geome-try/channel bathymetry. Since the effective discharge represents the
Fig. 6. Cumulative percentage of sediment load versus discharge duration and dischargeplot. The Dabri station along the Ramganga shows a very different pattern compared tothe other sites suggesting a different fluvial regime.
Fig. 7. Geomorphic effectiveness versus discharge (equal interval class) plot. Geomorphiceffectiveness shows maximum efficiency at discharge classes where highest rate of sedi-ment transport occurs.
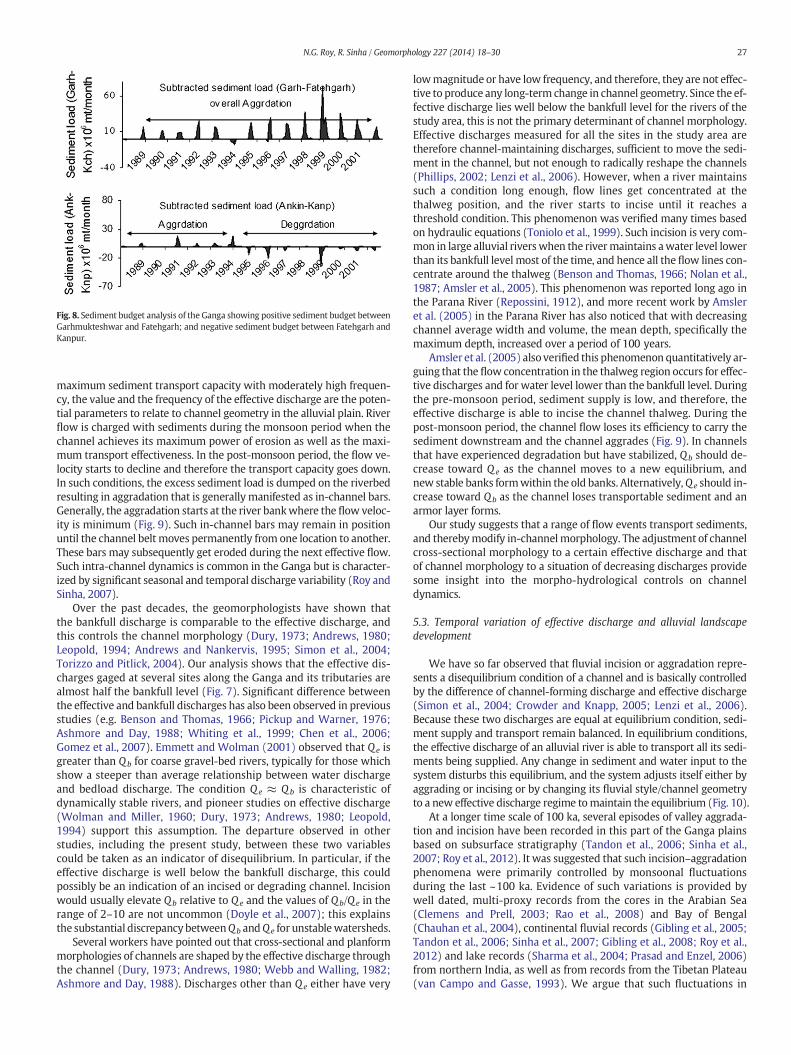
Fig. 8. Sediment budget analysis of the Ganga showing positive sediment budget betweenGarhmukteshwar and Fatehgarh; and negative sediment budget between Fatehgarh andKanpur.
27N.G. Roy, R. Sinha / Geomorphology 227 (2014) 18–30
maximum sediment transport capacity with moderately high frequen-cy, the value and the frequency of the effective discharge are the poten-tial parameters to relate to channel geometry in the alluvial plain. Riverflow is charged with sediments during the monsoon period when thechannel achieves its maximum power of erosion as well as the maxi-mum transport effectiveness. In the post-monsoon period, the flow ve-locity starts to decline and therefore the transport capacity goes down.In such conditions, the excess sediment load is dumped on the riverbedresulting in aggradation that is generally manifested as in-channel bars.Generally, the aggradation starts at the river bankwhere the flow veloc-ity is minimum (Fig. 9). Such in-channel bars may remain in positionuntil the channel belt moves permanently from one location to another.These bars may subsequently get eroded during the next effective flow.Such intra-channel dynamics is common in the Ganga but is character-ized by significant seasonal and temporal discharge variability (Roy andSinha, 2007).
Over the past decades, the geomorphologists have shown thatthe bankfull discharge is comparable to the effective discharge, andthis controls the channel morphology (Dury, 1973; Andrews, 1980;Leopold, 1994; Andrews and Nankervis, 1995; Simon et al., 2004;Torizzo and Pitlick, 2004). Our analysis shows that the effective dis-charges gaged at several sites along the Ganga and its tributaries arealmost half the bankfull level (Fig. 7). Significant difference betweenthe effective and bankfull discharges has also been observed in previousstudies (e.g. Benson and Thomas, 1966; Pickup and Warner, 1976;Ashmore and Day, 1988; Whiting et al., 1999; Chen et al., 2006;Gomez et al., 2007). Emmett and Wolman (2001) observed that Qe isgreater than Qb for coarse gravel-bed rivers, typically for those whichshow a steeper than average relationship between water dischargeand bedload discharge. The condition Qe ≈ Qb is characteristic ofdynamically stable rivers, and pioneer studies on effective discharge(Wolman and Miller, 1960; Dury, 1973; Andrews, 1980; Leopold,1994) support this assumption. The departure observed in otherstudies, including the present study, between these two variablescould be taken as an indicator of disequilibrium. In particular, if theeffective discharge is well below the bankfull discharge, this couldpossibly be an indication of an incised or degrading channel. Incisionwould usually elevate Qb relative to Qe and the values of Qb/Qe in therange of 2–10 are not uncommon (Doyle et al., 2007); this explainsthe substantial discrepancybetweenQb andQe for unstablewatersheds.
Several workers have pointed out that cross-sectional and planformmorphologies of channels are shaped by the effective discharge throughthe channel (Dury, 1973; Andrews, 1980; Webb and Walling, 1982;Ashmore and Day, 1988). Discharges other than Qe either have very
lowmagnitude or have low frequency, and therefore, they are not effec-tive to produce any long-term change in channel geometry. Since the ef-fective discharge lies well below the bankfull level for the rivers of thestudy area, this is not the primary determinant of channel morphology.Effective discharges measured for all the sites in the study area aretherefore channel-maintaining discharges, sufficient to move the sedi-ment in the channel, but not enough to radically reshape the channels(Phillips, 2002; Lenzi et al., 2006). However, when a river maintainssuch a condition long enough, flow lines get concentrated at thethalweg position, and the river starts to incise until it reaches athreshold condition. This phenomenon was verified many times basedon hydraulic equations (Toniolo et al., 1999). Such incision is very com-mon in large alluvial riverswhen the rivermaintains awater level lowerthan its bankfull level most of the time, and hence all the flow lines con-centrate around the thalweg (Benson and Thomas, 1966; Nolan et al.,1987; Amsler et al., 2005). This phenomenon was reported long ago inthe Parana River (Repossini, 1912), and more recent work by Amsleret al. (2005) in the Parana River has also noticed that with decreasingchannel average width and volume, the mean depth, specifically themaximum depth, increased over a period of 100 years.
Amsler et al. (2005) also verified this phenomenon quantitatively ar-guing that the flow concentration in the thalweg region occurs for effec-tive discharges and for water level lower than the bankfull level. Duringthe pre-monsoon period, sediment supply is low, and therefore, theeffective discharge is able to incise the channel thalweg. During thepost-monsoon period, the channel flow loses its efficiency to carry thesediment downstream and the channel aggrades (Fig. 9). In channelsthat have experienced degradation but have stabilized, Qb should de-crease toward Qe as the channel moves to a new equilibrium, andnew stable banks formwithin the old banks. Alternatively,Qe should in-crease toward Qb as the channel loses transportable sediment and anarmor layer forms.
Our study suggests that a range of flow events transport sediments,and therebymodify in-channelmorphology. The adjustment of channelcross-sectional morphology to a certain effective discharge and thatof channel morphology to a situation of decreasing discharges providesome insight into the morpho-hydrological controls on channeldynamics.
5.3. Temporal variation of effective discharge and alluvial landscapedevelopment
We have so far observed that fluvial incision or aggradation repre-sents a disequilibrium condition of a channel and is basically controlledby the difference of channel-forming discharge and effective discharge(Simon et al., 2004; Crowder and Knapp, 2005; Lenzi et al., 2006).Because these two discharges are equal at equilibrium condition, sedi-ment supply and transport remain balanced. In equilibrium conditions,the effective discharge of an alluvial river is able to transport all its sedi-ments being supplied. Any change in sediment and water input to thesystem disturbs this equilibrium, and the system adjusts itself either byaggrading or incising or by changing its fluvial style/channel geometryto a new effective discharge regime tomaintain the equilibrium (Fig. 10).
At a longer time scale of 100 ka, several episodes of valley aggrada-tion and incision have been recorded in this part of the Ganga plainsbased on subsurface stratigraphy (Tandon et al., 2006; Sinha et al.,2007; Roy et al., 2012). It was suggested that such incision–aggradationphenomena were primarily controlled by monsoonal fluctuationsduring the last ~100 ka. Evidence of such variations is provided bywell dated, multi-proxy records from the cores in the Arabian Sea(Clemens and Prell, 2003; Rao et al., 2008) and Bay of Bengal(Chauhan et al., 2004), continental fluvial records (Gibling et al., 2005;Tandon et al., 2006; Sinha et al., 2007; Gibling et al., 2008; Roy et al.,2012) and lake records (Sharma et al., 2004; Prasad and Enzel, 2006)from northern India, as well as from records from the Tibetan Plateau(van Campo and Gasse, 1993). We argue that such fluctuations in
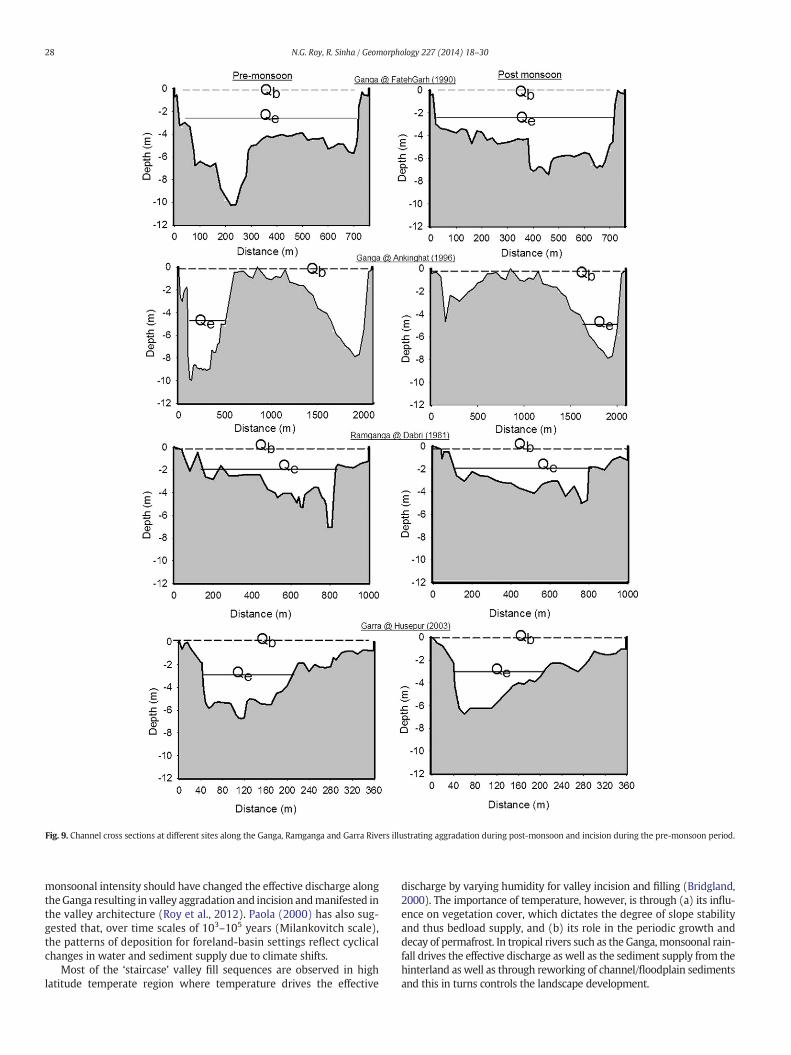
Fig. 9. Channel cross sections at different sites along the Ganga, Ramganga and Garra Rivers illustrating aggradation during post-monsoon and incision during the pre-monsoon period.
28 N.G. Roy, R. Sinha / Geomorphology 227 (2014) 18–30
monsoonal intensity should have changed the effective discharge alongtheGanga resulting in valley aggradation and incision andmanifested inthe valley architecture (Roy et al., 2012). Paola (2000) has also sug-gested that, over time scales of 103–105 years (Milankovitch scale),the patterns of deposition for foreland-basin settings reflect cyclicalchanges in water and sediment supply due to climate shifts.
Most of the ‘staircase’ valley fill sequences are observed in highlatitude temperate region where temperature drives the effective
discharge by varying humidity for valley incision and filling (Bridgland,2000). The importance of temperature, however, is through (a) its influ-ence on vegetation cover, which dictates the degree of slope stabilityand thus bedload supply, and (b) its role in the periodic growth anddecay of permafrost. In tropical rivers such as the Ganga,monsoonal rain-fall drives the effective discharge as well as the sediment supply from thehinterland as well as through reworking of channel/floodplain sedimentsand this in turns controls the landscape development.

Fig. 10. Schematic representation of observed flow distribution (Q), sediment ratingcurves (S1, S2 and S3), and effective discharge curves (Qe1,Qe2, andQe3).Qe2 is the effectivedischarge curve for the sediment rating curve S2 at a given time. If sediment supply in-creases from S2 to S3, the system needs more effective discharge to maintain the channel,and therefore, the effective transport curvewill shift to the right, leading to channel aggra-dation. On the other hand, if sediment rating changes from S2 to S1 due to low sedimentsupply to the fluvial system, the system needs less effective discharge for maintainingthe channel, and the effective transport curve will shift to the left, leading to channelincision.
29N.G. Roy, R. Sinha / Geomorphology 227 (2014) 18–30
6. Conclusions
We have estimated the effective discharge for suspended sedimenttransport in western Ganga plain using sediment rating curve and flowdischarge relationship. Themajor conclusions of this study are as follows:
1. The effective discharge at a given site in a river can be best defined asa range of discharges that are able to transport the largest fraction ofsediment load in the long-term.
2. The effective discharges at different sites along the Ganga River havethe recurrence interval of 1–2 years and are well below the bankfulldischarges. Therefore, the effective discharges are not channelforming discharges but channel-maintaining discharges.
3. The effective discharge represents a balance between sediment sup-ply and transport and influences the channel morphology in a majorway; an increase in sediment supply is likely to result in a decrease ineffective transport and hence aggradation and vice versa.
4. Long-term landscape development and valley filling episodes in theGanga plains may have been primarily influenced by changes in theeffective discharge driven by monsoonal fluctuations during theLate Quaternary.
Acknowledgments
Thiswork is a part of the PhD thesis of thefirst author (N.G. Roy) andwe thank the Indian Institute of Technology Kanpur for all institutionalandfinancial support.We are grateful to the CentralWater Commission,New Delhi for providing the necessary hydrological data for this study.We thank both the reviewers for their comments and suggestionsthat improved the paper greatly. This is a contribution to IGCP 582 onTropical Rivers.
References
Amsler, M.L., Carlos, G.R., Horacio, A.T., 2005. Morphologic changes in the Parana Riverchannel (Argentina) in the light of the climate variability during the 20th Century.Geomorphology 70, 1–22.
Andrews, E.D., 1980. Effective and bankfull discharge of streams in the Yampa River basin,Colorado and Wyoming. J. Hydrol. 46, 311–330.
Andrews, E.D., Nankervis, J.M., 1995. Effective Discharge and the Design of ChannelMaintenance Flows for Gravel Bed Rivers. In: Costa, J.E., Miller, A.J., Potter, K.W.,Wilcock, P.R. (Eds.), American Geophysical Union, pp. 151–164.
Ashmore, P.E., Day, T.J., 1988. Effective discharge for suspended sediment transport instreams of the Saskatchewan River basin. Water Resour. Res. 24, 864–870.
Benson, M.A., Thomas, D.M., 1966. A definition of dominant discharge. Bull. Int. Assoc. Sci.Hydrol. 11, 76–80.
Biedenharn, D.S., Copeland, R.R., Thorne, C.T., Soar, P.J., Hey, R.D., Watson, C.C., 2000.Effective discharge calculation: a practical guide. Technical Report. U.S. ArmyEngineer Research and Development Center, Vicksburg MS, pp. 1–48.
Bridgland, D.R., 2000. River terrace systems in North-west Europe; an archive of en-vironmental change, uplift and early human occupation. Quat. Sci. Rev. 19,1293–1303.
Chauhan, M.S., Sharma, C., Singh, I.B., Sharma, S., 2004. Proxy records of late Holocenevegetation and climate changes from Basaha Jheel, central Ganga plain. J. Palaeontol.Soc. Ind. 49, 27–34.
Chen, J.G., Hu, C.H., Dong, Z.D., Liu, D.B., 2006. Change of bankfull and bed-forming dis-charges in the Lower Yellow River. J. Sediment. Res. 5, 10–16.
Clemens, S.C., Prell, W.L., 2003. A 350,000 year summer-monsoonmulti-proxy stack fromthe Owen Ridge, Northern Arabian Sea. Mar. Geol. 201, 35–51.
Crowder, D.W., Knapp, H.V., 2005. Effective discharge recurrence intervals of Illinoisstreams. Geomorphology 64, 167–184.
Doyle, W.M., Shields, C.A., 2008. An alternative measure of discharge effectiveness. EarthSurf. Process. Landf. 33, 308–316.
Doyle, W.M., Doug, S., Karin, F.B., Skidmore, P.B., 2007. Channel-forming discharge selec-tion in river restoration design. J. Hydraul. Eng. 133, 831–837.
Dury, G.H., 1973. Magnitude–frequency analysis and channel morphology. In: Morisawa,M. (Ed.), Fluvial Geomorphology. SUNY, Binghamton, pp. 91–121.
Emmett, W.W.,Wolman, M.G., 2001. Effective discharge and gravel-bed rivers. Earth Surf.Process. Landf. 26, 1369–1380.
Esmaeili, N., Mahdav, M., 2002. The study of effective discharge for suspended sedi-ment transport in streams of the Zayandeh-rood Dam Basin. Iran. J. Nat. Res. 55,295–305.
Gibling, M.R., Tandon, S.K., Sinha, R., Jain, M., 2005. Discontinuity-bounded alluvialsequences of the southern Gangetic plains, India; aggradation and degradation inresponse to monsoonal strength. J. Sediment. Res. 75, 369–385.
Gibling, M.R., Sinha, R., Roy, N.G., Tandon, S.K., Jain, M., 2008. Quaternary fluvial andEolian deposits on the Belan River, India: paleoclimatic setting of Paleolithic to Neo-lithic archeological sites over the past 85,000 years. Quat. Sci. Rev. 27, 392–411.
Gomez, B., Coleman, S.E., Sy, V.W.K., Peacock, D.H., Kent, M., 2007. Channel change,bankfull and effective discharges on a vertically accreting, meandering, gravel bedriver. Earth Surf. Process. Landf. 32, 1–5.
Henck, A.C., Montgomery, D.R., Katharine, H.W., Liang, C., 2010. Monsoon control of effec-tive discharge, Yunnan and Tibet. Geology 38, 975–978.
Hester, G., Carsell, K., Ford, D., 2006. Benefits of USGS Stream Gauging Program—Usersand Uses of USGS Stream Flow Data. National Hydrologic Warning Council (17 pp.).
Hudson, P.F., Mossa, J., 1997. Suspended sediment transport effectiveness of three, largeimpounded rivers, U.S. Gulf Coastal Plain. Environ. Geol. 32, 263–273.
Johnson, P.A., 2002. Incorporating road crossings in stream restoration projects. Ecol.Restor. 20, 270–277.
Lenzi, M.A., Mao, L., Comiti, F., 2006. Effective discharge for sediment transport in amoun-tain river: computational approaches and geomorphic effectiveness. J. Hydrol. 326,257–276.
Leopold, L.B., 1994. A View of the River. Harvard University Press, Cambridge, Massachu-setts (298 pp.).
Ma, Y., Hung, H.G., Xu, J., Brierley, G.J., Yao, Z., 2010. Variability of effective discharge forsuspended sediment transport in a large semi-arid river basin. J. Hydrol. 388,357–369.
Nash, D.B., 1994. Effective sediment-transporting discharge from magnitude–frequencyanalysis. J. Geol. 102, 79–95.
Nolan, K.M., Lisle, T.E., Kelsey, H.M., 1987. Bankfull discharge and sediment transport innorthwestern California. Erosion and sedimentation in the Pacific Rim. IAHS Publ.165, 439–449.
Orndorff, R.L., Whiting, P.J., 1999. Computing effective discharge with S-Plus. Comput.Geosci. 25, 559–565.
Paola, C., 2000. Quantitative models of sedimentary basin filling. Sedimentology 47,121–178.
Phillips, J.D., 2002. Geomorphic impacts of flash flooding in a forested headwater basin. J.Hydrol. 269, 236–250.
Pickup, G., Warner, R.F., 1976. Effects of hydrologic regime on magnitude and frequencyof dominant discharge. J. Hydrol. 29, 51–75.
Pitlick, J., Van Steeter, M.M., 1998. Geomorphology and endangered fish habitats of theupper Colorado River — linking sediment transport to habitat maintenance. WaterResour. Res. 34, 303–316.
Prasad, S., Enzel, Y., 2006. Holocene paleoclimates of India. Science 66, 442–453.Rao, V.P., Kessarkar, P.M., Patil, S.K., Ahmad, S.M., 2008. Rock magnetic and geochemical
record in a sediment core from the eastern Arabian Sea: diagenetic and environmen-tal implications during the late Quaternary. Palaeogeogr. Palaeoclimatol. Palaeoecol.270, 46–52.
Repossini, J., 1912. Memoria sobre el Rio Parana. XIIo. Congreso International deNavegacion1a Section-2a Communicacion, Philadelphia.
Roy, N.G., Sinha, R., 2007. Understanding confluence dynamics in the alluvial Ganga–Ramganga valley, India: an integrated approach using geomorphology and hydrolo-gy. Geomorphology 92, 182–197.
30 N.G. Roy, R. Sinha / Geomorphology 227 (2014) 18–30
Roy, N.G., Sinha, R., Gibling, M.R., 2012. Aggradation, incision and interfluve flooding inthe Ganga Valley over the past 100,000 years: testing the influence of monsoonalprecipitation. Palaeogeogr. Palaeoclimatol. Palaeoecol. 356–357, 38–53.
Shields Jr., F.D., Knight, S.S., Morin, N., Blank, J., 2003. Response of fishes and aquatic habitatsto sand-bed stream restoration using large woody debris. Hydrobiologia 494, 251–257.
Sharma, S., Joachimski, M., Sharma, M., Tobschall, H.J., Singh, I.B., Sharma, C., Chauhan,M.S.,Morgenroth, G., 2004. Late glacial and Holocene environmental changes in Gangaplain, Northern India. Quat. Sci. Rev. 23, 145–159.
Simon, A., Dickerson, W., Heins, A., 2004. Suspended-sediment transport rates at the 1.5-yr recurrence interval for eco regions of the United States: transport conditions at thebankfull and effective discharge? Geomorphology 58, 243–262.
Sinha, R., Bhattacharjee, P., Sangode, S.J., Gibling, M.R., Tandon, S.K., Jain, M., Godfrey, D.,2007. Valley and interfluve sediments in the southern Ganga plains, India: exploringfacies and magnetic signatures. Sediment. Geol. 201, 386–411.
Sinha, R., Friend, P.F., 1994. River systems and their sediment flux, Indo-Gangetic plains,northern Bihar, India. Sedimentology 41, 825–845.
Singh, R.L., 1994. India: A Regional Geography. National Geographical Society of India,Varanasi.
Tandon, S.K., Gibling, M.R., Sinha, R., Singh, V., Ghazanfari, P., Dasgupta, A., Jain, M., Jain, V.,2006. Alluvial valleys of the Gangetic Plains, India: causes and timing of incision.SEPM Spec. Publ. 85, 15–35.
Thorne, C.R., Russel, A., Alam, K., 1993. Planform pattern and channel evolution of theBrahmaputra River, Bangladesh. In: Best, J.L., Bristow, C.S. (Eds.), Braided Rivers. Geo-logical society Special Publication, 75, pp. 257–276.
Toniolo, H., Amsler, M., Ramonell, C., 1999. Prediction of the thalweg aspect ratio at a largealluvial river: the Parana River (Argentina). Proceedings of the XXVIII IAHR BiennialCongress, Graz, Austria.
Torizzo, M., Pitlick, J., 2004. Magnitude–frequency of bedload transport in mountainstreams in Colorado. J. Hydrol. 290, 137–151.
U.S. Water Resources Council, 1981. Guidelines for determining flood flow frequency,Bulletin 17B. US Department of the Interior Geological Survey (28 pp.).
Van Campo, E., Gasse, F., 1993. Pollen and diatom-inferred climatic and hydrologicalchanges in Sumxi Co Basin (Western Tibet), since 13000 yr B.P. Quat. Res. 39,300–313.
Vogel, R.M., Stedinger, J.R., Hooper, R.P., 2003. Discharge indices for water quality loads.Water Resour. Res. 39, 1273.
Watson, C.C., Raphelt, N.K., Biedenharn, D.S., 1997. Historical Background of ErosionProblems in the Yazoo Basin. In: Wang, .S.Y., Langendoen, E.J., Shields, F.D. (Eds.),Center for Computational Hydroscience and Engineering, University of Mississippi,pp. 115–119.
Wahl, K.L., Thomas Jr., W.O., Hirsch, R.M., 1995. The stream-gaging program of the U.S.Geological Survey. U.S. Geological Survey Circular p. 1123.
Webb, B.W., Walling, D.E., 1982. The magnitude and frequency characteristics of fluvialtransport in a Devon drainage basin and some geomorphological implications. Catena9, 9–23.
Werritty, A., 1997. Short-term changes in channel stability. In: Thorne, C.R., Hey, R.D.,Newson, M.D. (Eds.), Applied Fluvial Geomorphology for River Engineering andMan-agement. Wiley, New York, pp. 47–66.
Whiting, P.J., Stamm, J.F., Moog, D.B., Orndorff, R.L., 1999. Sediment-transporting flows inheadwaters streams. Geol. Soc. Am. Bull. 111, 450–466.
Wolman, M.G., Miller, J.P., 1960. Magnitude and frequency of forces in geomorphicprocesses. J. Geol. 68, 54–74.
Yevjevich, V., 1972. Probability and Statistics in Hydrology. Water Resources Publications,Fort Collins, Colorado (302 pp.).