effect of volcanic fumes from mt. oyama, miyakejima island, on atmospheric deposition, soil...
TRANSCRIPT
This article was downloaded by: [Washburn University]On: 21 October 2014, At: 15:31Publisher: Taylor & FrancisInforma Ltd Registered in England and Wales Registered Number: 1072954 Registered office: MortimerHouse, 37-41 Mortimer Street, London W1T 3JH, UK
Soil Science and Plant NutritionPublication details, including instructions for authors and subscription information:http://www.tandfonline.com/loi/tssp20
Effect of volcanic fumes from Mt. Oyama,Miyakejima Island, on atmospheric deposition, soilsolution, and soil properties in Kumagaya, CentralJapanKentaro Hayashi a c & Masanori Okazaki ba Research Center for Life Cycle Assessment , National Institute of Advanced IndustrialScience and Technology , Tsukuba, 305-8569, Japanb Graduate School of Bio-Applications and Systems Engineering , Tokyo University ofAgriculture and Technology , Koganei, 183-8588, Japanc Department of Environmental Chemistry , National Institute for Agro-EnvironmentalSciences , Tsukuba, 305-8604, JapanPublished online: 22 Nov 2011.
To cite this article: Kentaro Hayashi & Masanori Okazaki (2003) Effect of volcanic fumes from Mt. Oyama, MiyakejimaIsland, on atmospheric deposition, soil solution, and soil properties in Kumagaya, Central Japan, Soil Science and PlantNutrition, 49:4, 503-511, DOI: 10.1080/00380768.2003.10410039
To link to this article: http://dx.doi.org/10.1080/00380768.2003.10410039
PLEASE SCROLL DOWN FOR ARTICLE
Taylor & Francis makes every effort to ensure the accuracy of all the information (the “Content”) containedin the publications on our platform. However, Taylor & Francis, our agents, and our licensors make norepresentations or warranties whatsoever as to the accuracy, completeness, or suitability for any purpose ofthe Content. Any opinions and views expressed in this publication are the opinions and views of the authors,and are not the views of or endorsed by Taylor & Francis. The accuracy of the Content should not be reliedupon and should be independently verified with primary sources of information. Taylor and Francis shallnot be liable for any losses, actions, claims, proceedings, demands, costs, expenses, damages, and otherliabilities whatsoever or howsoever caused arising directly or indirectly in connection with, in relation to orarising out of the use of the Content.
This article may be used for research, teaching, and private study purposes. Any substantial or systematicreproduction, redistribution, reselling, loan, sub-licensing, systematic supply, or distribution in anyform to anyone is expressly forbidden. Terms & Conditions of access and use can be found at http://www.tandfonline.com/page/terms-and-conditions

Soil Sci. Plant Nutr., 49 (4), 503-511,2003
Effect of Volcanic Fumes from Mt. Oyama, Miyakejima Island, on Atmospheric Deposition, Soil Solution, and Soil Properties
in Kumagaya, Central Japan
II. Soil Properties
Kentaro Hayashi 1 and Masanori Okazaki *
Research Center for Life Cycle Assessment, National Institute of Advanced Industrial Science and Technology, Tsukuba, 305-8569 Japan; and *Graduate School of Bio-Applications
and Systems Engineering, Tokyo University of Agriculture and Technology, Koganei, 183-8588 Japan
Received October 25,2002; accepted in revised form May 19,2003
Mt. Oyama, a volcano in Miyakejima Island, became active at the end of June 2000 and began emitting volcanic fumes with a high amount of sulfur dioxide (S02) at the end of August 2000. Emission of volcanic fumes was still observed in August 2002. We aimed at analyzing the soil properties in Kumagaya in relation to the effect of the volcanic fumes from Mt. Oyama. A soil survey was conducted in a deciduous secondary forest in Kumagaya, Saitama Prefecture, Japan in September 2001, and the physical and chemical properties of the soil were analyzed. The soil in the research plot consisted of volcanic ash soil. However, the properties were markedly different between the topsoil and subsoil. For example, the base saturation values in the A and Bwl horizons were very low, 1.7 and 0.85%, respectively, while the value in the Bw2 horizon was 29%. The soils in the A and Bwl horizons displayed a considerable anion exchange capacity (AEC) under the field conditions, and the amount of exchangeable sulfate (S042-) accounted for 37% of the AEC in the A horizon. The AEC of the A horizon was considered to have brought about a delay in the changes in the S042- concentration in the soil solution at the depth of 10 cm compared to the changes in the 8°42- concentration in the throughfall (TF). One of the major features of the soil in the research plot was that it had already adsorbed a large amount of S042- compared with the annual deposition load of S042- from the atmosphere; the ratio of the adsorbed S042-
pool to the annual S042- deposition was approximately 60 in the Bwl horizon. Therefore,
the volcanic fumes with a high amount of S02 from Mt. Oyama were considered to have exerted a negligible effect on the soil properties in the research plot, whereas the fumes affected the properties of atmospheric deposition and upper soil solution in the research plot.
Key Words: Mt. Oyama (Miyakejima Island), soil property, sulfate, sulfur dioxide, volcanic ash soil.
503
Mt. Oyama in Miyakejima Island is an active volcano located approximately 180 km south of Tokyo, Japan (34°05' N, 139°32' E). The most recent volcanic activity started in July 2000. Mt. Oyama has continuously emitted sulfur dioxide (S02) since August 2000, and S02 emissions around 4-12 Gg d- 1 were still observed in
1 Present address: Department of Environmental Chemistry, National Institute for Agro-Environmental Sciences, Tsukuba, 305-8604 Japan.
August 2002 (MAJ 2002). The total S02 emission from September 2000 to May 2002 was estimated to reach 15 Tg (Kazahaya et al. 2002). The large amount of S02 emitted from Mt. Oyama has affected the chemical properties of the atmospheric deposition not only in the Kanto District but all over Japan (Yamakawa 2002). The atmospheric deposition could potentially induce chemical changes in the soil solution and soil.
The objective of our study was to analyze the effect of volcanic fumes with a high amount of SOz from Mt.
Dow
nloa
ded
by [
Was
hbur
n U
nive
rsity
] at
15:
31 2
1 O
ctob
er 2
014

504 K. HAYASHI and M. OKAZAKI
Oyama on the chemical properties of atmospheric deposition, soil solution, and soil in Kumagaya, central Japan. In the previous report (Hayashi and Okazaki 2002), it was indicated that the volcanic fumes from Mt. Oyama affected the chemical properties of both the atmospheric deposition and the upper soil solution in Kumagaya through the increase of S02 and sulfate (SO/-) deposition. Also, the changes in the SO/- concentration in the soil solution at the depth of 10 cm appeared two months later than the changes in the throughfall (TF), suggesting the existence of a buffering capacity for S042- movement, namely a strong SO/adsorption. Based on the results already obtained, in this second report, the physical and chemical properties of the soil in the research plot in Kumagaya will be described with emphasis placed on the anion adsorption properties, for SO/- in particular, and also the effect of the volcanic fumes from Mt. Oyama on the soil in Kumagaya will be analyzed.
MATERIALS AND METHODS
Research site. The research plot used for the soil survey was the same as that used for the monitoring of atmospheric deposition and soil solution, located at the Konan Terrace in Kumagaya City, Saitama Prefecture (36°06' N, 139°22' E). The site consisted of a secondary deciduous forest mainly composed of Quercus serrata Thumb. ex Murray (Konara oak). The geological characteristics of the surface of the Konan Terrace corresponded to volcanic ash. The characteristics of the site were described in detail in the previous report (Hayashi and Okazaki 2002).
Soil survey. The soil survey was conducted on September 8, 2001 following the monitoring period for atmospheric deposition and soil solution from June 10, 2000 to June 10,2001. The method adopted for the soil survey followed the recommendations of JSP (1997). A pit was made in a plot adjacent to the plot monitored for the changes in the soil solution, and the characteristics of the soil profile were described. Subsequently, six undisturbed soil samples (core samples) per horizon were collected using soil samplers 100 mL in volume, and a bagged soil sample per horizon was also collected.
Soil analysis. Three core samples per horizon were immediately used for analyzing the three-phase distribution with a three-phase meter (DIK-1121, Daiki, Tokyo) under field conditions. Next, the initial water content in each core sample was measured as the difference in the weight between the field-moisture and dried (l05 e C, 24 h) sample.
The other three core samples per horizon were used for measuring the saturated hydraulic conductivity and
soil water potential. The saturated hydraulic conductivity was measured using a falling-head permeameter (DIK-4000, Daiki). After the measurement of the hydraulic conductivity, the core samples were employed for measuring the water content at given matric potentials (I/Im). Two different methods were applied for measuring the water content depending on the I/Im range. The soil column method (EBMSEA 1997) was applied for the I/Im range from 0 to -4 kPa, and the pressure plate method (EBMSEA 1997) was applied for the lower I/Im range down to -155 kPa using a multifold pF meter (DIK-3421, Daiki) in combination with an automatic pressure controller (DIK-9220, Daiki).
A portion of the bagged fresh soil sample was immediately analyzed for the electric conductivity at the drysoil: water weight ratio of 1 : 5 (CM-5S, TOA, Tokyo) and for the pH at the dry-soil: water weight ratio of 1 : 2.5 (M-7, Horiba, Kyoto). The remaining soil samples were air-dried and passed through a 2 mm sieve for the analysis of their physical and chemical properties.
The soil texture of each soil horizon was determined by the pipette method (EBMSEA 1997) using a 0.05 kg L -1 sodium hexametaphosphate solution (Black 1965) to disperse clay particles.
A portion of the air-dried soil was analyzed for the soil pH in suspension with water and 1 M KCI solution at the soil: liquid ratio of 1 : 2.5 using a pH meter (M-7, Horiba).
Exchangeable base cations (Na+, K+, Mg2+, and Ca2+) in the soil were extracted with 1 M ammonium acetate at pH 7 using glass columns, and the concentrations of these cations were determined by atomic absorption spectrophotometry (Z-501O' Hitachi, Tokyo). Subsequently, the NH4 + on exchangeable sites was replaced with 1 M sodium acetate at pH 7, and the soil column was rinsed with 95% ethanol to remove excess Na+. The retained Na+ was re-extracted with 1 M ammonium acetate at pH 7, and then the Na+ concentration was determined by atomic absorption spectrophotometry (Z-5010, Hitachi) to quantify the cation exchange capacity (CEC) of the soil.
Anion exchange capacity (AEC) of the soil was determined by the single equilibration method (Kamewada and Takahashi 1996). A 0.01 M NaCl solution was used for the electrolyte. Four pH levels were set up by the addition of 1 M HCl solution. After the equilibrium treatment, the electrolyte pH was measured using a pH meter (M-7, Horiba), and the Cl- concentration was determined by capillary electrophoresis (Quanta 4000E, Waters, Massachusetts, USA) employing a buffer solution of chromic acid-tetradecyl trimethylammonium bromide (Cr-TTAB) (Sasaki and Yonekubo 1997).
Exchangeable anions (Cl-, N02-, N03-, and SO/-) in the soil were extracted in polyethylene bottles with
Dow
nloa
ded
by [
Was
hbur
n U
nive
rsity
] at
15:
31 2
1 O
ctob
er 2
014
Effect of Volcanic Fumes from Mt. Oyama (II) 505
0.1 M NaOH, and the concentrations of these anions were determined by capillary electrophoresis (Quanta 4000E, Waters) employing the Cr-TTAB buffer solution (Sasaki and Yonekubo 1997) after filtration with paper filters (5C, ADVANTEC, Tokyo) and membrane filters (mixed cellulose ester with 0.45 J.1m pore size, ADVANTEC).
The carbon and nitrogen contents in the soil were determined using a CN coder (MT-700, Yanako, Kyoto).
RESULTS
Soil profile The soil type in the research plot was classified into
Dystric Andosols (FAO, ISRIC, ISSS 1998), and the soil profile consisted of three horizons A / Bw1 / Bw2 with a water table at the depth of 63 cm in this soil survey.
Physical properties of the soil Table 1 summarizes the physical properties of the soil
sampled in the research plot. Results of the determination of the three-phase distribution and bulk density were included in the report of Hayashi and Okazaki (2002).
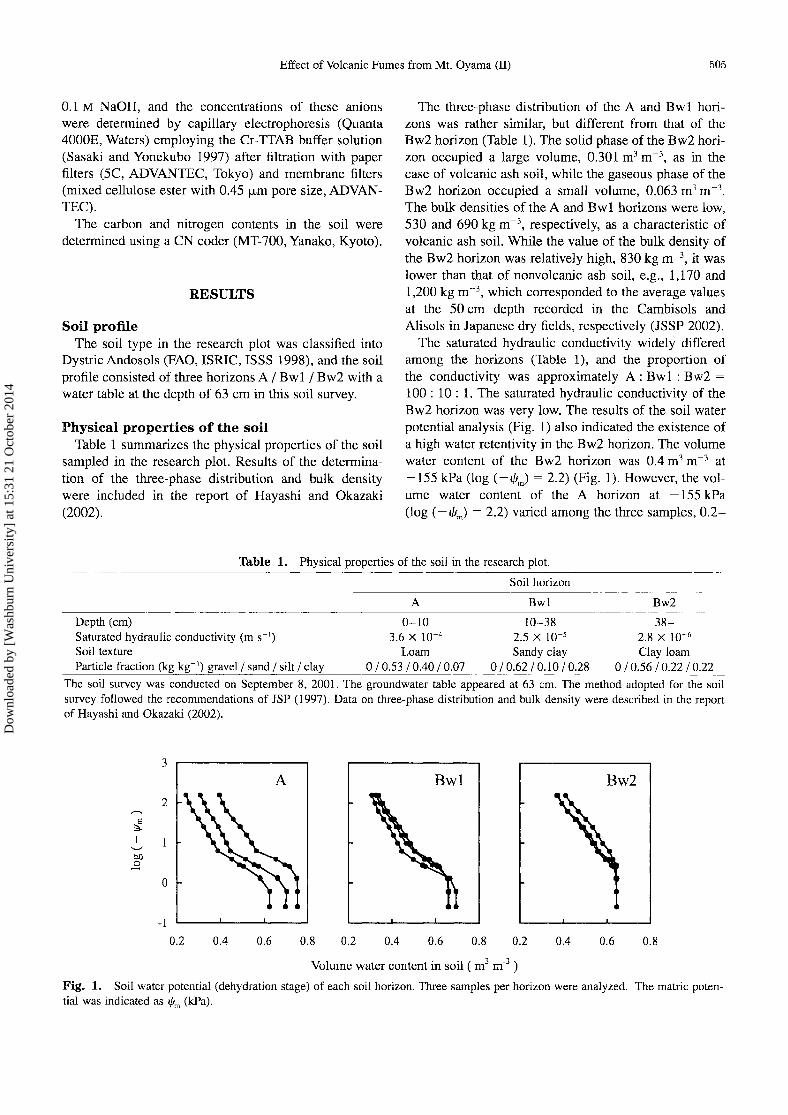
The three-phase distribution of the A and Bwl horizons was rather similar, but different from that of the Bw2 horizon (Table 1). The solid phase of the Bw2 horizon occupied a large volume, 0.301 m3 m-3, as in the case of volcanic ash soil, while the gaseous phase of the Bw2 horizon occupied a small volume, 0.063 m3 m-3
.
The bulk densi.ti.es of the A and Bw1 horizons were low, 530 and 690 kg m-\ respectively, as a characteristic of volcanic ash soil. While the value of the bulk density of the Bw2 horizon was relatively high, 830 kg m-3 , it was lower than that of nonvolcanic ash soil, e.g., 1,170 and 1,200 kg m-3, which corresponded to the average values at the 50 cm depth recorded in the Cambisols and Alisols in Japanese dry fields, respectively (JSSP 2002).
The saturated hydraulic conductivity widely differed among the horizons (Table 1), and the proportion of the conductivity was approximately A: Bwl : Bw2 = 100 : 10 : 1. The saturated hydraulic conductivity of the Bw2 horizon was very low. The results of the soil water potential analysis (Fig. 1) also indicated the existence of a high water retentivity in the Bw2 horizon. The volume water content of the Bw2 horizon was 0.4 m3 m-3 at -155 kPa (log (-I/Jrn) = 2.2) (Fig. 1). However, the volume water content of the A horizon at -155 kPa (log (-I/Jm) = 2.2) varied among the three samples, 0.2-
Table 1. Physical properties of the soil in the research plot. -----------------------------------
Soil horizon _._.- .-------
A Bwl Bw2 -- --- --- ---.---------------------------------------------
Depth (cm) Saturated hydraulic conductivity (m S-I)
Soil texture Particle fraction (kg kg-') gravel/sand / silt / clay
0-10 3.6 X 10⁻⁴
Loam 0/0.53 /0.40/0.07
10-38 38-2.5 X 10⁻⁵ 2.8 X 10⁻⁶
Sandy clay Clay loam 0/ 0.62 / 0.10 / 0.28 0/0.56/0.22/0.22
The soil survey was conducted on September 8, 2001. The groundwater table appeared at 63 cm. The method adopted for the soil survey followed the recommendations of JSP (1997). Data on three-phase distribution and bulk density were described in the report of Hayashi and Okazaki (2002).
3
A Bwl Bw2 2
~ I
eo ..9
0
-I 0.2 0.4 0.6 0.8 0.2 0.4 0.6 0.8 0.2 0.4 0.6 0.8
Volume water content in soil ( m3 m-3 )
Fig. 1. Soil water potential (dehydration stage) of each soil horizon. Three samples per horizon were analyzed. The matric potential was indicated as !{1m (kPa).
Dow
nloa
ded
by [
Was
hbur
n U
nive
rsity
] at
15:
31 2
1 O
ctob
er 2
014

506 K. HAYASHI and M. OKAZAKI
0.4 m' m-3, and the soil water potential of the A horizon also varied among the three samples (Fig. 1). The variation in the A horizon was probably caused by differences in the distribution of the macropores derived from plant roots, especially the roots of Pleioblastus chino Makino (a species of bamboo grass) which were abundant in the A horizon.
A very small amount of gravel was found in the entire soil. The soil texture of each soil horizon determined by the laboratory measurement was loam, sandy clay, and clay loam for the A, BwI, and Bw2 horizons, respectively. These results were obtained prior to the determination of the field texture by tactile sensation in the research plot which is described in the report of Hayashi and Okazaki (2002). The content of sand was high in all
Table 2. Chemical properties of the soil in the research plot.
Soil horizon
A Bw1 Bw2
Electric conductivity (mS m- I) 7.2 4.2 5.5 Soil pH
Air-dried (1 : 2.5 HP) 4.4 4.6 5.7 Air-dried (1 : 2.5 1 M KCl) 4.0 4.3 4.8
Cation exchange capacity 29 29 29 (cmole kg-I)
Exchangeable cations (cmole kg-I) Na+ 0.020 0.027 0.32 K+ 0.14 0.064 0.063 Mcr2+
b 0.13 0.052 4.1 Ca2+ 0.21 0.10 4.0
Base saturation (%) 1.7 0.85 29 Exchangeable anions (cmole kg-I)
Cl- 0.14 0.12 0.19 N0
2- 0.23 0.090 0.11
N03
- 0.19 0.046 0.068 SO/- 0.82 3.5 0.45
Carbon content (kg kg-I) 0.090 0.028 0.027 Nitrogen content (kg kg-I) 0.0059 0.0020 0.0018 C / N ratio 15 14 15
Exchangeable cations were extracted using an ammonium ace-tate solution (1 M). Exchangeable anions were extracted using a sodium hydroxide solution (0.1 M). The fresh soil pH (1 : 2.5 HP) was indicated in the report of Hayashi and Okazaki (2002).
A
Bwl
Bw2
o 2 3 4
the horizons, namely 0.53-0.62 kg kg- I (Table 1). The content of clay was relatively low in the A horizon, 0.07 kg kg I, while it was relatively high in the Bwi and Bw2 horizons, 0.28 and 0.22 kg kg-I, respectively.
Chemical properties of the soil Table 2 summarizes the chemical properties of the
soil sampled in the research plot. The pH (HP) values of air-dried soil in the A, BwI,
and Bw2 horizons were 4.4, 4.6, and 5.7, respectively. The differences in the values between pH (HP) and pH (KCI) of air-dried soil were relatively small in the A and Bwi horizons, 0.4 and 0.3, respectively, while a value of 0.9 was recorded in the Bw2 horizon (Table 2).
The CEC values were similar in all the horizons, 29 cmole kg- I (Table 2). However, the content of exchangeable base cations and the base saturation of the Bw2 horizon were considerably different from those of the other horizons (Table 2 and Fig. 2). The values of the base saturation of the A and Bwi horizons were very low, 1.7 and 0.85%, respectively. In contrast, the base saturation of the Bw2 horizon was high, 29%, and exchangeable Mg2+ accounted for half of the content of the exchangeable base cations, which corresponded to the amount of exchangeable CaH (Table 2 and Fig. 2).
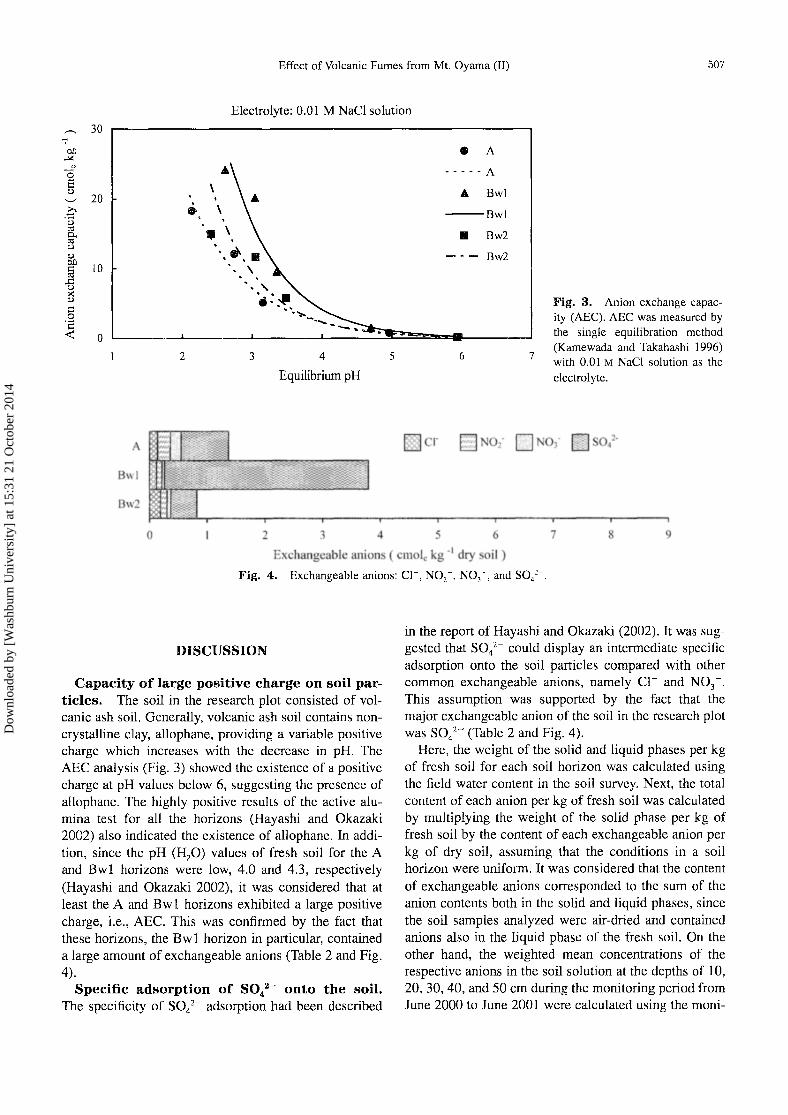
The soil samples displayed an AEC at pH values below 6, and the AEC markedly increased at pH values below 4 (Fig. 3). The AEC values corresponding to the pH (HP) values of air-dried soil for the A, BwI, and Bw2 horizons (Table 2) were estimated to be, 1.4, 1.8, and 0.21 cmole kg-I, respectively.
The content of total exchangeable anions was particularly high in the Bwi horizon (Table 2 and Fig. 4). The major exchangeable anion was S04Z
- in all the horizons, and the content of exchangeable SO/- accounted for 93% of the content of the total exchangeable anion in the Bwi horizon. The content of exchangeable Cl- was relatively low and similar among all the horizons. NOz-was also detectable in all the horizons as an exchangeable anion, though its content was low. The content of exchangeable N03 - was considerably lower than the content of NOz - in all the horizons.
5 6 7 8 9
Exchangeable base cations ( cmole kg -I dry soil)
Fig. 2. Exchangeable base cations: Na+, K+, Mg2+, and Ca2+.
Dow
nloa
ded
by [
Was
hbur
n U
nive
rsity
] at
15:
31 2
1 O
ctob
er 2
014
Effect of Volcanic Fumes from Mt. Oyama (ll) 507
Electrolyte: 0.01 M NaCI solution 30
" "0 S u
20
10
o 2
A
Bwl
Bw2
o
\
.. \ . . \ .. . ..... II
'. \ '.: ,
'.::.(111 ..... "loo.
....... ..-..,
3 4
~-
Equilibrium pH
2 3
• A
-----A
A Bwl
---Bwl
• Bw2
Bw2
5 6
4 5 6
7
Fig. 3. Anion exchange capacity (AEC). AEC was measured by the single equilibration method (Kamewada and Takahashi 1996) with 0.01 M NaCI solution as the electrolyte.
7 8 9
Exchangeable anions ( cl110lc kg -1 dry soil)
Fig. 4. Exchangeable anions: CI-, N02-, NO)-, and SO/-.
DISCUSSION
Capacity of large positive charge on soil particles. The soil in the research plot consisted of volcanic ash soil. Generally, volcanic ash soil contains noncrystalline clay, allophane, providing a variable positive charge which increases with the decrease in pH. The AEC analysis (Fig. 3) showed the existence of a positive charge at pH values below 6, suggesting the presence of allophane. The highly positive results of the active alumina test for all the horizons (Hayashi and Okazaki 2002) also indicated the existence of allophane. In addition, since the pH (HP) values of fresh soil for the A and Bwl horizons were low, 4.0 and 4.3, respectively (Hayashi and Okazaki 2002), it was considered that at least the A and Bwl horizons exhibited a large positive charge, i.e., AEC. This was confirmed by the fact that these horizons, the Bw 1 horizon in particular, contained a large amount of exchangeable anions (Table 2 and Fig. 4).
Specific adsorption of S042- onto the soil. The specificity of SO/- adsorption had been described
in the report of Hayashi and Okazaki (2002). It was suggested that SO/- could display an intermediate-specific adsorption onto the soil particles compared with other common exchangeable anions, namely CI- and N03 -.
This assumption was supported by the fact that the major exchangeable anion of the soil in the research plot was SO/- (Table 2 and Fig. 4).
Here, the weight of the solid and liquid phases per kg of fresh soil for each soil horizon was calculated using the field water content in the soil survey. Next, the total content of each anion per kg of fresh soil was calculated by multiplying the weight of the solid phase per kg of fresh soil by the content of each exchangeable anion per kg of dry soil, assuming that the conditions in a soil horizon were unifonn. It was considered that the content of exchangeable anions corresponded to the sum of the anion contents both in the solid and liquid phases, since the soil samples analyzed were air-dried and contained anions also in the liquid phase of the fresh soil. On the other hand, the weighted mean concentrations of the respective anions in the soil solution at the depths of 10, 20, 30, 40, and 50 cm during the monitoring period from June 2000 to June 2001 were calculated using the moni-
Dow
nloa
ded
by [
Was
hbur
n U
nive
rsity
] at
15:
31 2
1 O
ctob
er 2
014

508 K. HAYASHI and M. OKAZAKI
Table 3. Amounts of major anions in the solid and liquid phases (per kg of fresh soil).
Soil Ion Solid and liquid phase Liquid phase LA LTA
horizon species Amount (a) Depth Amount ({3) (a - (3) / (a- f3)/
(cmol, kg- 1 fresh soil) (cm) (cmol, kg- 1 fresh soil) a (%) ~(a - f3) (%)
A Cl- 0.071 10 0.0033 95.3 12.0 NO -
3 0.096 10 0.021 78.6 13.4 SO/- 0.43 10 0.0078 98.2 74.6
Bwl Cl- 0.072 20 0.0040 94.5 3.2 30 0.0046 93.6 3.1
N03
- 0.027 20 0.018 32.1 0.4 30 0.022 19.4 0.2
SO/- 2.1 20 0.0067 99.7 96.4 30 0.0072 99.7 96.6
Bw2 Cl- O.ll 40 0.0049 95.3 27.5 50 0.0079 92.5 26.9
NO -3 0.038 40 0.020 48.1 5.0
50 0.020 48.2 5.0 SO/- 0.25 40 0.0029 98.8 67.5
50 0.0021 99.2 68.1
LA: Ratio of adsorbed amount to total content in fresh soil within an anion species. LTA: Ratio of adsorbed amount of an anion species to the sum of adsorbed amounts of three anion species.
Table 4. Pool of exchangeable ions in soil horizons and annual deposition load of ions during the monitoring period from June 2000 to June 2001.
Base cations ADL (mole m-2 year- 1), PEl (mol, m-2) Abundance ratio (dimensionless)
Na+ K+ Mg2+ Ca2+ Na+ K+ Mg2+ Ca2+
ADL OP 0.017 0.0086 0.0086 0.029 0.83 0.092 0.19 0.37 TF 0.020 0.094 0.045 0.080 1 1 1
PEI A O.OlO 0.076 0.070 0.11 0.52 0.81 1.5 1.4 Bw1 0.051 0.12 0.10 0.20 2.5 1.3 2.2 2.5 Bw2 0.67 0.13 8.5 8.3 33 1.4 190 100
ADL (mol, m-2 year- 1), PEl (mol, m-2) Abundance ratio (dimensionless)
Anions Cl- N0
2- N0
3- SO/- Cl- N0
2- N0
3- SO/-
ADL OP 0.031 0 0.052 0.D71 0.66 0.96 0.63 TF 0.048 0 0.055 0.11 1 1
PEl A 0.072 0.12 0.098 0.44 1.5 1.8 3.9 Bwl 0.24 0.17 0.88 6.8 4.9 1.6 61 Bw2 0.39 0.23 0.14 0.93 8.2 2.6 8.3
ADL: Annual deposition load during the monitoring period from June 2000 to June 2001. PEl: Pool of exchangeable ions in soil horizons. OP: Open-bulk precipitation, TF: Throughfa11. Abundance ratio: Ratio based on the amount of TF. Thickness of horizon for calculation: A lO cm, Bw1 28 cm, and Bw2 25 cm (to the water table).
Table 5. Correlation coefficient (R) of SO/- concentrations between throughfall (TF) and soil solution with time delay.
Soil solution at corresponding depth Note
lOcm 20 cm 30 cm 40 cm 50 cm
TF -0.382 -0.262 0.069 -0.219 -0.500 Same month 0.409 -0.387 0.074 -0.439 -0.693* 1 month delay in soil solution 0.944** -0.651 * -0.140 -0.480 -0.675* 2 months delay in soil solution 0.285 -0.282 -0.287 -0.136 -0.162 3 months delay in soil solution
----* Significant cOlTelation (p < 0.05). ** Strong significant correlation (p < 0.01). The value shown in figure 8 from the report of Hayashi and Okazaki (2002) corresponds to the determination coefficient (R2) between TF and the soil solution at the depth of 10 cm.
Dow
nloa
ded
by [
Was
hbur
n U
nive
rsity
] at
15:
31 2
1 O
ctob
er 2
014

Effect ofVo1canic Fumes from Mt. Oyama (II) 509
toring data on the soil solution with the collected water volume as the weight. The calculated concentrations in the soil solution were allocated as follows: the concentrations in the A horizon corresponded to those of the soil solution at the depth of 10 cm; similarly, the values for the Bwl horizon corresponded to those of the soil solution at the depths of 20 and 30 cm, and the values for the Bw2 horizon corresponded to those of the soil solution at the depths of 40 and 50 cm. Then, the total content of each anion in the liquid phase per kg of fresh soil was calculated using the mean concentration of each anion in the soil solution. The specific gravity of the soil solution was assumed to be 1.0.
Table 3 shows the results of the estimation including two indices related to the localization of an anion species as follows:
LA(x) = (a(x) - f3(x» / a(x) (1)
/ Cl-,N03 -,S042-
LTA(x) = (a(x) - {3(x» / I (a(x) - {3(x» (2)
where, a is the content of an anion species x both in the solid and liquid phases of fresh soil. {3 is the content of an anion species x in the liquid phase of fresh soil. Therefore, LA indicates the ratio of the quantity of anion species x adsorbed in the solid phase to the total content in fresh soil. Meanwhile, LTA indicates the ratio of the quantity of anion species x adsorbed in the solid phase to the sum of the adsorbed quantities of the three anion species, Cl-, N03 -, and S042- in the solid phase of fresh soil.
The values of LA for Cl- and SO/- were high, more than 90%, indicating the large presence of these anions in the solid phase, whereas the values of LA for N03-
were relatively low and varied from 19.4 to 78.6%. The values of LTA for SO/-, 74.6, 96.4-96.6, and 67.5-68.1 % in the A, Bwl, and Bw2 horizons, respectively, showed that SO/- was strongly adsorbed in the solid phase in preference to the other two anion species. It was therefore concluded that SO/- was specifically adsorbed onto the soil particles of the soil in the research plot.
Soil properties related to ion adsorption. For the exchangeable base cations, the values of the base saturation in the A and Bwl horizons were very low, 1.7 and 0.85%, respectively (Table 2), indicating that the base cations had leached out and H+ and Aj3+ were the major exchangeable cations. Thus, the soil pH values in the A and Bwl horizons were low in the range of pH 4 (Table 2). The larger base saturation in the A horizon than that in the Bwl horizon was ascribed to the supply of base cations by atmospheric deposition and the circulation of base cations among the A horizon, the plants, and the plant litter. Meanwhile, the base satura-
tion in the Bw2 horizon was 29% and evidently larger than that in the other horizons (Table 2).
The pool 61' exchangeable base cations per m2 in each soil horizon was estimated using the results of the analysis of the horizon thickness, bulk density, and content of exchangeable base cations. The uniformity of the conditions in a soil horizon was assumed, though the physical and chemical properties of the soil were heterogeneous for the A horizon in particular, as reflected by the soil water potential (Fig. 1). The thickness of the Bw2 horizon between the top of the horizon and the water table was set as 25 cm as in the case of the thickness adopted in the soil survey. Furthermore, the annual deposition load per m2 from the atmosphere for each base cation was derived from the monitoring results (Hayashi and Okazaki 2002). Table 4 shows the content of exchangeable base cations in the soil and the annual deposition of base cations from the atmosphere. It should be noted that the values denote the quantity of exchangeable ions, and not the total content in soil. The abundance ratios of exchangeable base cations in the A and Bwl horizons, 0.52-2.5, indicated that the deposition load of the base cations as TF was similar. On the other hand, the abundance ratios of exchangeable base cations in the Bw2 horizon were considerably large except for K+ in which the deposition load was similar compared with that in the Bw 1 horizon.
The pool of exchangeable anions in each soil horizon per m2 and the annual deposition load of each anion per m2 from the atmosphere were estimated in the same manner as that for the base cations (Table 4). The major exchangeable anion was SO/- for all the horizons (Table 2 and Fig. 4). The abundance ratios for SO/showed that all the soil horizons had already contained a large amount of SO/- compared with the deposition load as TF. The abundance ratio of SO/- was 61 in the Bwl horizon (Table 4).
The small amount of exchangeable Cl- (Table 2) indicated that the major part of deposited Cl- had leached out, though the soil Cl- content was 2-8 fold higher than the annual Cl- deposition as TF (Table 4). The detection of exchangeable N02 - suggested that nitrification was hampered, especially NOz - oxidation. As a result, the fact that the soil contained a large amount of N02 - than N03 -, indicates that the soil adsorbsed N02 -
in preference to N03 -. In contrast, NOz - was not detected in the soil solution throughout the monitoring period. It is possible that N02 - in the soil solution sample, if it existed, was lost during the collection period, since the soil solution was sampled weekly or biweekly and N02 -
with an unstable behavior might have been decomposed. Effect of volcanic fumes from Mt. Oyama on
the soil chemical properties. As mentioned above, the soil in the research plot contained a large
Dow
nloa
ded
by [
Was
hbur
n U
nive
rsity
] at
15:
31 2
1 O
ctob
er 2
014

510 K. HAYASHI and M. OKAZAKI
amount of exchangeable SO/- compared with the atmospheric deposition load as TF (Table 4). Hence, it was concluded that the increased atmospheric deposition of SO/- associated with the eruption of Mt. Oyama exerted a negligible direct effect on the soil properties in the research plot. However, the changes in the SO/- concentrations showed a strong significant correlation (R 2 = 0.892, R = 0.944, p < 0.01) between TF and the soil solution at a 10 cm depth with a two-month delay (Hayashi and Okazaki 2002). The AEC in the A horizon was estimated at 2.2 cmole kg- 1 for a fresh soil pH of 4.0 (Fig. 3). On the other hand, since the amount of exchangeable S042- in the A horizon was 0.82 cmole
kg- 1 (Table 2), it appeared that SO/- accounted for 37% of AEC. Accordingly, the A horizon had a function to buffer the changes in the SO/- concentration in the soil solution. For the depths of other soil solutions, Table 5 records the absence of a positive correlation between the SO/- concentration in TF and that in the soil solution under the A horizon, namely at 20, 30, 40, and 50 cm depths (p < 0.05). Although several negative correlations were found (p < 0.05), these correlations were not significant at a 1 % level.
Differences between the Bwl and Bw2 horizons. Attempts were also made to identify the factors responsible for the differences in the physical and chemical properties between the Bw1 and Bw2 horizons (Tables 1 and 2) despite the similarity in origin, namely volcanic ashes.
The effect of capillary groundwater could possibly be considered. The existence of a water table in the Bw2 horizon indicated that the Bw2 horizon was usually wet. The low proportion of the volume of the gaseous phase (Table 1), the very low hydraulic conductivity (Table 1), and the high water retentivity (Fig. 1) recorded in the Bw2 horizon could be ascribed to the perennial wet conditions. Moreover, the large difference in the soil solution chemistry between the 10-30 and 40-50 cm depths (Hayashi and Okazaki 2002) also indicated the effect of groundwater. It is possible that the perennial capillary groundwater in the Bw2 horizon caused the distinctive differences in the soil chemistry between the two soil horizons, i.e., the high value of the soil pH, the relatively large quantities of exchangeable cations, and hence the high level of base saturation in the Bw2 horizon (Table 2). Although the amounts of exchangeable SO/also differed between the two horizons, it was considered as the result of the difference in AEC associated with the difference in the soil pH (Fig. 3).
Identification of the soil as volcanic ash soil. The soil in the research plot in Kumagaya was an example of volcanic ash soil. However, its properties differed from those of typical volcanic ash soils. The parent material of the soil in the research plot was not
exclusively associated with the deposition of volcanic ashes, since the research plot was located in the shallow valley of Yoshida River in which volcanic ashes had been washed by water erosion, and simultaneously other materials had been brought from the upstream area. It was considered that this property was directly reflected in the low saturated hydraulic conductivity and relatively large bulk density in the Bw2 horizons, 830 kg m-3
,
compared to the average value, 660 kg m-3, at the 50 cm
depth of Andosols in Japanese dry fields (JSSP 2002). Conclusion. It is concluded that the increased
SO/- deposition did not affect appreciably the physical and chemical properties of the soil in the research plot in Kumagaya, since the A and Bw1 horizons of the soil had already been acidified and showed large AEC values. Furthermore, the soil had already adsorbed a large amount of S042
- compared to the atmospheric deposition load of SO/-. However, it is important to determine how the eruption of Mt. Oyama affected the soil properties of other types of volcanic ash soils and nonvolcanic ash soils, since some soils are more vulnerable to excess acidity load.
Acknowledgments. We thank Dr. Takushi Niki, Rissho University, for his cooperation in the soil survey.
REFERENCES
Black CA (Ed.) 1965: Particle fractionation and particle-size analysis. In Methods of Soil Analysis Part 1, Physical and Mineralogical Properties Including Statistics of Measurement and Sampling, p. 550-551, American Society of Agronomy, Madison
EBMSEA (Editorial Board for Methods of Soil Environment Analysis) 1997: Procedures for Soil Environment Analysis, 427 pp. Hakuyusya, Tokyo (in Japanese)
FAO, ISRIC, ISSS 1998: World reference base for soil resources. World Soil Resources Reports, 84, 88 pp.
Hayashi K and Okazaki M 2002: Effect of volcanic fumes from Mt. Oyama, Miyakejima island, on atmospheric deposition, soil solution and soil properties in Kumagaya, central Japan. 1. Chemical properties of atmospheric deposition and soil solution. Soil Sci. Plant Nutr., 48, 401-411
JSP (Japanese Society of Pedology) (Ed.) 1997: Revised Handbook for Soil Survey. 169 pp., Hakuyusya, Tokyo (in Japanese)
JSSP (Japanese Society of Soil Physics) (Ed.) 2002: New Edition Glossary of Soil Physics, 183 pp., Yokendo, Tokyo (in Japanese)
Kamewada K and Takahashi Y 1996: Increase in cation adsorption induced by surface complexation of sulfate on andisols and prediction by "Four-Plane Mode!." Soil Sci. Plant NutI'. , 42,785-799
Kazahaya K, Shinohara H, Uto K, Odai M, Mori H, Nakabori Y,
Ino H, and Hirabayashi J 2002: Monitoring of sulfur dioxide flux by COSPEC from Miyakejirna volcano, Japan. Pro-
Dow
nloa
ded
by [
Was
hbur
n U
nive
rsity
] at
15:
31 2
1 O
ctob
er 2
014
Effect of Volcanic Fumes from Mt. Oyama (II) 511
ceedings of the 43rd Annual Meeting of the Japan Society for Atmospheric Environment (JSAE), p. 120-123 (in Japanese)
MAJ (Meteorological Agency of Japan) 2002: Monthly Report of Earthquake and Volcano---Disaster Prevention Edition, the Issue for August, p. 26 (in Japanese)
Sasaki Hand Yonekubo J 1997: Optimization of electromigrative sample introduction in capillary electrophoresis. Bunseki Kagaku, 46, 429-437 (in Japanese)
Yamakawa K 2002: The Influence of Miyakejima volcano on acid rain in Japan. Proceedings of the 43rd Annual Meeting of JSAE, p. l32-135 (in Japanese)
Dow
nloa
ded
by [
Was
hbur
n U
nive
rsity
] at
15:
31 2
1 O
ctob
er 2
014