effect of toposequence position on performance of rice ...masajo1992iita.pdf · the toposequence is...
TRANSCRIPT
Resource and Crop Management Research Monograph No.9
Effect of Toposequence Position on Performance of Rice Varieties in
Inland Valleys of West Africa
R. J. Carsky and T. M. Masajo
Resource and Crop Management Division International Institute of Tropical Agriculture
•
Resource and Crop Management Research Monograph No.9
Effect of Toposequence Position
on Performance of Rice Varieties
in Inland Valleys of West Africa
R. J. Carsky and T. M. Masajo

Preface
The Resource and Crop Management Research Monograph series is designed for the wide dissemination of results of research about the resource and crop management problems of smallholder farmers in sub-Saharan Africa, including socioeconomic and policy-related issues. The range of subject matter is intended to contribute to existing knowledge on improved agricultural principles and policies and the effect they have on the sustainability of small-scale food production systems. These monographs summarize results of studies by lIT A researchers and their collaborators; they are generally more substantial in content than journal articles.
The monographs areairned at scientists andresearchers within the national agricultural research systems of Africa, the international research community, policy makers, donors, and international development agencies.
Individuals and institutions in Africa may receive single copies free of charge by writing to:
The Director Resource and Crop Management Division International Institute of Tropical Agriculture PMB 5320, lbadan, Nigeria
The Author
Dr. Carsky is an agronomist. This monograph is based on his experience as a postdoctoral fellow with the Inland Valley Research Group of the Resource and Crop Management Division, UTA, from 1989 to 1991.
T. M. Masajo was lIT A rice breeder until March, 1991. He is presently a rice breeder for the International Rice Research Institute, stationed in Madagascar.
© 1992 International Institute of Tropical Agriculture
Contents
L Introduction................................................... ............................... 1
Role of IV s in rice production .......... ........................................... I GllIdient of conditions along IV toposequences ............................... 1 Use of toposequences for research . ..... ...... ... ................. ..... ............ 3 Objectives of the present toposequence studies ................................ 3
II. Marerials and Methods ................................................................... 5
Makeni trials ............. ...... ..... .... ...... ..... .......... ...... ..... ...... ....... ... 5 Bida trials ................................................................................ 6
Bida trial at Gam - 1986-87 ... ...... ..... .... ...... ..... ...... ..... ........ .... 6 BidatrialsatGadza-1987-88to 1989-90 ................................. 6
ill. Results and Discussion ................................................................... 9
Makeni trials ........................................................................... 9 1987-88 ............................................................................. 9 1988-89 ............................................................................. 9 1989-90 ............................................................................. 9
Bida trials ............................................................................. 12 1986-87 ............................................................................. 12 1987-88 ............................................................................. 14 1988-89 ............................................................................. 14 1989-90 ............................................................................. 18
IV. General Discussion ..................... ........................ ........................... 21
V. Summary ..................................................................................... 22
Acknowledgements 22
References ........................................................................................... 23

I. Introduction
Inland valleys (IVs) are small valleys in the upper reaches of watersheds. They do not have a large floodplain, typical of large rivers, or salinity and sulfur problems, typical of coastal valleys. An IV, according to Andriesse (1986), starts at a water source as a stream flow valley which further downstream becomes a river overflow Valley. Major hydrological processes and valley dimensions change from upper 10 lower sections of IV s. Runoff and seepage in the upper section are replaced by river overflow in the lower part as the major source of water. Valley bottoms increase from tens of meters across in the upper stream flow sections to hundreds of meters in the lower, river overflow sections. The major river with its large floodplain (greater than 200m width) signals the lower end of an IV.
Role of IVs in rice production
Inland valleys are found in all agroecological zones of Africa The area of IV s has been estimated at between 20 and 40 million ha in the West African equatorial forest and Guinea savanna zones alone (Andriesse 1986). In spite of their small size, IVs cover more area in West Africa than the other wetlands (coastal swamps, inland basins, and river floodplains) combined.
The well-watered, well-distributed IVs appear to offer a potential impact on food production. IITA (1988), in its strategic planning study, estimated that the greatest increases in rice production in the region would come from the inland valleys and associated hydromorphic lands. With urban populations increasing in West Africa, rice consumption has surpassed production. The IV s may be the most logical environment in which to close this gap (lITA 1988).
Thus, breeding efforts have begun to address the common rice production problems in the IV s, the major ones being blast (Pyricularia oryzae Cav) and iron toxicity. It was recognized that the shortest varieties are not the best because of the weed competition, drought stress, and flooding common to hydromorphic soils with minimum or partial water control (Masajo and Carsky 1989).
A program to test new varieties was carried out in several sets of conditions (irrigated paddies, floodplains, and IV slopes). This paper analyzes only the trials which • were carried out along IV IOposequences.
Gradient of conditions along toposequeuces
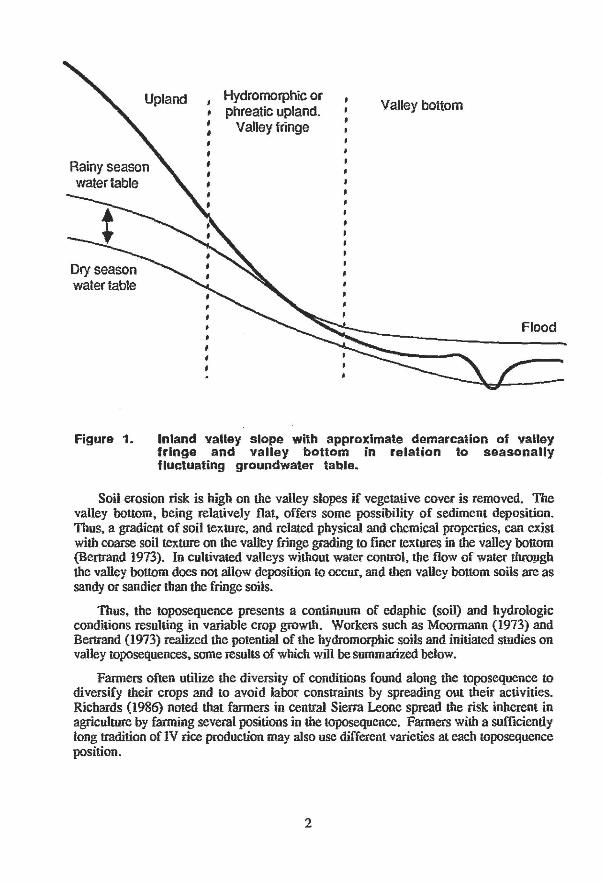
A major characteristic and one common to all IVs is that ecological conditions change along the valley slope. The IV toposequence is frequently divided into two or more sections (Fig. I). The valley fringe is the upper slope where shallow groundwater results in saturated soil and good rice growth during the rainy season. The valley fringe is also referred 10 as phreatic or hydromorphic upland (Garrity 1984).
The valley bottom soils are strongly hydromorphic, a result of shallow groundwater or flooding throughout most of the year. The water table is always higher with respect 10 the soil surface in the valley bottom than on the fringe. Flooding is most likely in the valley bottom and drought is common on the fringe. Thus, there is a gradient of water availability along the IOposequencc.
Dry season water table
Figure 1.
Upland , Hydromorphic or , phreatic upland.
Valley fringe
Valley bottom
Flood
Inland valley slope with approximate demarcation of valley fringe and valley bottom in relation to seasonally fluctuating groundwater table.
Soil erosion risk is high on the valley slopes if vegetative cover is removed. The valley bottom, being relatively flat, offers some possibility of sediment deposition. Thus, a gradient of soil texture, and related physical and chemical properties, can exist with coarse soil texture on the valley fringe grading to finer textures in the valley bottom (Bertrand 1913). In cultivated valleys without water conlI'Ol, the flow of water thro~gh the valley bottom does not allow deposition to occur, and then valley bottom soils are as sandy or sandier than the fringe soils.
Thus, the toposequence presents a continuum of edaphic (soil) and hydrolOgiC conditions resulting in variable crop growth. Workers such as Moormann (1973) and Bertrand (1973) realized the potential of the hydromorphic soils and initiated studies on valley toposequences. some results of which will be summarized below.
Farmers often utilize the diversity of conditions found along the toposequence to diversify their crops and to avoid labor constraints by spreading out their activities. Richards (1986) noted that farmers in central Sierra Leone spread the risk inherent in agriculture by farming several positions in the toposequence. Farmers wilh a suffiCiently long tradition of IV rice production may also use different varieties at each toposequence position.
2
Use of toposequences for research
Gradients along inland vaIley slopes have been used to study response of crops to stresses. Moorman et al. (1977) used the toposequence to quantify the threshold soil moisture level beyond which plants suffer moisture stress and found the level to be higher for a lowland than for an upland rice variety. Scientists at International Rice Research Institute (lRRI 1983) have studied the physiologic response of the rice plant to variable water stress along a toposequence. Both studies also showed the value of screening for blast disease along a toposequence. Nguu et al. (1988) validated the screening process using 19 rice varieties with a known degree of drought tolerance. The linkage of the varietal screening to the measurement of depth to the groundwater table allowed recommendations to be made for matching rice genotypes with groundwater regimes. The results suggested that lowland genotypes should not be grown where the groundwater table is more than 40cm below the soil surface.
Bertrand (1973) described the soils of several valley toposequences in Senegal and recorded groundwater table depth over an entire year. He also grew rice at several positions along two slopes. Grain yield of the local variety "Ikong Pao" varied from 1.6 t ha-1 at the valley fringe, where water table depth was 50cm from the soil surface for about six weeks and deeper at other times, to 4.8 t ha-1 in the valley bottom where 5 to 15 cm flood occurred for the same six weeks. At other toposequence positions, intermediate yields were related to intermediate water table depths.
The toposequence is a methodological tool which should have many uses, not only for screening varieties but for understanding processes related to soil properties and water availability_ For example, Moormann et al. (1977) recorded N deficiency and Fe toxicity symptoms in rice and tissue contents of these and related nutrients. The pattern of occurrence of these symptoms provided hypotheses for further study.
Objectives of tbe present toposequence studies
Studies were initiated to observe the performance of rice varieties developed at lIT A under growing conditions typical of inland valleys and to identify promising rice varieties. The results of these tests might help rice breeders to develop better procedures for selecting rice germplasm for IV conditions. The studies were managed by researchers and meant to be tests of biological performance. At the same time, farmer-managed tests were. conducted to study performance of lIT A varieties from a socioeconomic perspective.
The tremendous variability of conditions along the toposequence was recognized to be severe enough to require rice varieties to be tested at several positions along any given vaIley slope. It was perceived that different materials would perform best at different testing points. Varieties would be recommended for different ecological conditions, mainly related to water availability.
Water control is an important factor in rice growth along the inland valley toposequence. Therefore, the degree of water control will be described for each site used in this study. From an agronomic viewpoint, four distinct levels of water control were used . in these studies:
3

1. None (no attempt to deliver, retain, or drain water).
2. Minimum level of input needed to reduce soil erosion and increase infiltration of rain water into soil (may consist of contour ridges or small square basins).
3. Minimum level of input needed to eliminate or reduce water stress at critical growlh periods (needs increased water retention with bunds and puddling and/or water delivery to field).
4. Minimum level of input needed to suppress non-aquatic weeds, and to provide a reduced soil zone for a deep-placed ammonium-N source (requires regular water delivery to leveled, puddled paddies).
4

II. Materials and Methods
Seven trials were conducted in two sites from the 1986-87 season to the 1989-90 season, three in Sierra Leone, at Makeni, and four at Bida in Nigeria. The Makeni site lies in north central Sierra Leone at about 8"50' N and 12"W. Average annual rainfall in the area is slightly over 3000mm with monthly averages of about l00mm or more from April to November. The predominant upland soils as described by Van Vuure and Miedema (1973) are Paleuduits and Orthox (USDA) or Nitosols and Ferralsols (FAO/UNESCO).
The Bida sire lies in Niger State, in the middle belt of Nigeria at about 9"N and 6"E. Average annual rainfall is 1100 to 1200mm, with monthly averages of more than l00mm from May to October. The dominant upland soils have been classified by Esu (1986) as Ustults (USDA) or Acrisols (FAO/UNESCO) formed from sandstone with high transmissivity aquifers (Oosrerbaan et al. 1987).
In Makeni, the valley called Sawulia is relatively flat-bottomed with a broad shallow central drain. In Bida, two valleys were used. The valley called Gara, used for a trial in 1986-87, is narrow with steep sides. Gadza valley, used for the 1987 through 1989 Bida trials, is broad and gently sloping. The Gadza valley bottom is separated from the stream by a small levee. In both areas, the valley bottom is flooded for much of the rice cropping season (July to November at Makeni and August to October at Bida) and the fringe soil is saturated for most of the season and flooded periodically.
Each trial consisted of growing several varieties at two or more positions along the valley toposequence. Plot size was generally about 1.5 to 2m wide and about 10m long. Rice was transplanted toward the middle or larer part of the rainy season (lare July to late Seprember), since this is the current practice by farmers in both areas. Age of seedlings at transplanting ranged from 25 to 35 days old and seedling spacing was approximately 25 ,,25cm. Weed control was always good.
Wafer management differed substantially between the sites. Experimental protocol and fertility management differed, not only between sires, but within sires between years. Therefore, important details of the trial methodology will be presented below.
Rice yield was estimated by harvesting at ground level and passing through a motorized thresher. Grain moisture conrent was estimated with an electronic moisture • meier with digital readout. All yields were converted to 14% moisture. The presence of bunds was ignored in the calculation of yield per hectare.
Makeni trials
In Makeni, the rice varieties were replicared two times at each toposequence position in 1987-88 and 1988-89 and three times in 1989-90. Two positions, designated valley bottom and fringe, were used in 1987. In 1988-89 and 1989-90, an inrermediate position was included and the three positions called valley bottom, middle slope and valley fringe. Different parts of the same valley were used each year for the trials. There were no canals or bunds to deliver, retain, or drain off warer. Land was prepared by hand hoe with minimal puddling. Thus, the water control can be classified as levell, essentially no control of water. Fertilizer application was 60-40-4{) kg ha-1 of N-P-K, applied in two equal portions at transplanting and during titlering, every year. Soils were not sampled.
5
Bida trials
In Bida, one trial was conducted in Gam valley in 1986-87, and subsequent trials from 1987-88 until 1989-90 in Gadza valley.
Bida trial at Gara -1986-87 In Garn, moderately large (250 m~ leveled, bonded paddies with regular water supply were constructed in the dey seaSOn of 1986. There were two paddies at each of three IOposequence positions which will be called fringe, middle, and bollom. The fringe paddy was divided inlO upper and lower portions for rice harvest, because variable rice growth was observed within the paddy. Fertilizer was applied 10 one set of paddies (set A in Fig. 2) at a rate of 90-60-60 kg ha-i of N-P-K, but not 10. the other set of paddies (set B). Fertilizer was applied in three portions (30-30-30 before last puddling, 30-30-0 at 30 10 40 days after transplanting, and 30-0-30 at panicle initialion). Soils were sampled to IOctn depth after transplanling.
Farmers' fields, immediately leri-and right or ~ iniprovoo structiires, ;"ere also managed by the research tearn 10 grow the ~ainii set of varieties (Fig. 2).- The recommended level of fertilizer', 90-69'60 kg ha- i oOf:-P-K, 'was applied to onc set of plPlS (set C). On the Qther set of plots (set D), 15-15-11 kg ha-1 ofN-P·K was applied, becabse the farmer refused to allow the res~ch tea~1d witbboM ~er completely_ The treatments were not replicated. Rice rows ran alOlig the slope.
The newly constructed paddies in Gara can be corutidered as water control level 4 (see section "Objectives of the present toposequence trials"). The system resembled the Asian paddy or sawah system of leveled paddies, large bunds, dependable water delivery, and mechanized puddling. The adjacent fields had level 3 water control, small paddies with small bunds, poorly developed system of water delivery, and incomplete puddling with hand hoe, resembling the system used by most of the farmers in this valley.
Bida trials at Gadza -1987-88 to 1989-90 Large paddies were constructed in Gadza valley in the dey season of 1987 (Fig. 3 for general view of Gadza trials). In the first rice cropping season, 1987-88, five distinct paddies along the slope were used which will be referred to as paddies I through V (Fig. 4a). Soils were sampled to IOcm depth just before transplanting. The rice rows °ran along the conlOur. Varieties were not replicated within paddies. Fertilizer application was 120-60-60 kg ha-1 N-P-K in paddies I and nand 90-60-60 in the rest
In 1988, the rice varieties were replicated twice at each of two toposequence positions, valley fringe and valley bottom, (Fig. 4b). As in Gara, 1986-87, adjacent farmers' fields were used to assess the effect of water control (Fig. 3). The paddies constructed by IITA had water control level 4, and the adjacent paddies had level 2to 3. About 1010 20% of the farmers' fields were occupied by bunds compared with about 2% in the improved paddies. Fertilizer application was 120-60-60 kg ha-1 N-P-K. Rice was planted along the contour.
In 1989, rice was planted along the slope instead of along the contour and there were four toposequence positions (I to IV in Fig. 4c). Fertilizer application was 90-60-60 kg ha-1ofN-P-K.
6

SelC SelD
Diversion canal
t.· ·1 WC 4IFringe
!WM WC 3/Fringe and Middle
[] WC4/Middle
~ WC 3/Bottom
~ WC 4fBottom
Figure 2. Layout of variety trial iu Gara valley uear Bida, Nigeria, 1986·87. Paddies with water coutrol level 4 (WC 4) were coustructed iu 1986 dry seasou by lIT A. Adjaceut paddies of irregular shape were coustructed by farmers. Horizoutal liue iu WC 4ffriuge paddy iUdicates divisiou betweeu two parts of paddy barvested separately.
1987 Tnal 1988-89 and 1989-90 Tnals
E::I t. -. -.-1 we 4tFringe ImwiJI we 2-3lFnnge
IP~~~~;;~m;;;;;:;;;;;;:!t-""J we 4tBoUom ~ we 2-3lBoUom
canal
•
Figure 3. Geueral layout of trials iu Gadza valley, Bida, Nigeria, 1987, 1988, aud 1989.
7

a) 1987-88 bj 1988-89 c) 1989-90 Rep I Rep II Rep I RepU
I • .. t .. I I wg?@J Q)
OJ c:
Q) 0;:: OJ ------ _ ... --- u. c:
I I 0;:: u. ~ I
I ~WR..a.___/.a
II
IV [I
E E .S! ------ ------ .S! '0 '0 ttl ttl IV E
o V
~ m
Figure 4. Layout of trials in Gadza improved paddies indicating number of toposequence positions (five in 1987, two in 1988, and four in 1989), numbers of replications (one in 1987 and two in subsequent years), and orientation of rows (along contour in 1987 and 1988 and along slope in 1989).
8

III. Results and Discussion
Makeni trials
1987-88 In Makeni, 1987·88, a different set of rice varieties was replicated twice at each of two toposequence positions. The only variety common to the valley bottom and fringe was PJLV. Two varieties from IITA (ITA) and two from Rokupr Rice Research Station (ROK) were grown at each position. The only appropriate comparison is for the local variety PJLV whose mean yields were 2.4 t ha·1 in the valley bonom and 1.8 t ha ·1 in the valley fringe (Table I). There was very little improvement over the local check by the improved varieties on the valley fringe. In the valley bottom, the lIT A varieties (ITA 222 and 312) and ROK 5 gave considerably greater yields, but only the ITA yields were statistically significantly greater than the local. The UTA varieties yielded 4.74 t ha'!, double that of the local check (2.37 t ha'!) in the valley bottom.
1988-89 In 1988, all of the rice varieties and lines were replicated twice at three toposequence positions. The main effects of toposequence position and variety were significant as well as their interaction. Thus, the mean grain yields for all varieties at all positions are reported in Table 2. The mean yield for the 10 varieties increased from 1.7 t ha'! on the valley fringe 10 2.6 t ha'! at the middle position and 4.8 t ha'! at the bottom. This increase is related to water availability and probably nutrient availability. Flood water depth at transplanting was 2lcm in the valley bottom, 4cm, in the middle and Oem at the fringe. Soil chemical and physical properties were not determined.
Four varieties had mean yields, over all toposequence positions, greater than 3 t ha'! Of these, three TOX lines had significantly higher mean yields than the local check. The variety by IOposequence interaction can be shown by the plot of the mean yield of selected varieties at each toposequence position by mean toposequence yield (Fig. 5). The ITA 230 yields varied greatly along the toposequence, while ITA 3!2 yields were relatively stable. At each toposequence position TOX 3142-7-2-3-4, had nearly the highest yield.
1989-90 In 1989, all of the rice varieties were replicated three times at three IOposequence positions. The yield of grain is presented in Table 3. The mean response of the varieties 10 toposequence position was highly significant (p<0.001) and very similar to that observed in 1988-89, from 2.0 t ha'! on the valley fringe to 3.3 t ha'! at the middle position and 5.0 t ha'! at the bottom position. The yield of the 10 varieties averaged over the three valley positions ranged from 2.9 10 3.7 t ha-!, with no significant differences among varieties. The interaction between toposequence position and variety (Tx V) was not significant in the 1989-90 trial.
Productive tiller number (panicle m-2) is presented in Table 4 for each variety and IOposequence position. The number of productive tillers (i.e., panicles) m-2 increased from 140 on the fringe to 164 at the middle position and 252 at the bottom position. The interaction between toposequence position and variety was a significant source of variation in tiller production. Total tillers are not reported, because productive tillers were found 10 be a relatively constant fraction of total tillers (95% on the valley fringe and 98% on middle and bottom positions).
9

Table 1. Grain yield (I ha·1 al 14% molslure) of rice varieties planled on fringe and bottom of inland valley near Makenl, Sierra Leone, 1987. From Jallob and Palada (1989)
Bottom Fringe
Variety y",ld Variety YIeld
ITA 222 4.72 ITA 230 1.92 ITA 312 4.76 ITA 315 1.93 ROK 14 2.64 ROK 11 1.80 ROK5 3.65 ROK 12 1.60 PJLV 2.37 PJLV 1.77
SE 0.66 0.23
Table 2. Yield of grain (I ha-1 al 14% molslore) In rice varlely Irlal along loposequenee of Inland valley Dear Makenl, Sierra Leone, 1988·89. From Palada el al. (1990)
T<>pasequence
Variety Fringe Middle Bottom Mean
TOX 3114-10-1-3-2 2.02 1.89 3.96 2.62 TOX 3118-6-E2-3 1.63 2.17 5.34 3.23 TOX 3118-47-4-2-2 1.62 2.97 4.40 3.00 TOX 3118-18-56-1-2-1 1.15 2.90 4.42 2.83 TOX 3133-56-1-3-3 1.32 258 4.90 3.27
TOX3142-1-1-1 1.44 229 5.19 2.97 TOX 3142-7-2-3-4 2.56 2.90 5.11 352 ITA230 1.01 2.69 499 3.16 ITA312 2.18 2.54 3.84 2.86 Local check (pa Alpha) 1.54 2.15 4.41 2.70
Mean 1.73 2.56 4.76 • SE 0.16 021 0.36 026
Mean yield ofTOX 3ll8-6-E2-3 (the only line common 10 both sludies) was higher in 1989-90 than in 1988-89. This was mainly due to the higher yield at the middle position of the toposequence (3.9 t ha-I in 1989-90 and 2.2 t ha-I in 1988-89). The two trials were conducted in the same valley but nOI in the same spot. The 1989-90 trial was transplanted much later (29 September) than the 1988-89 trial (30 July). Thus, the two trials were conducted under different conditions. Otherwise the fertilizer management was similar and the depth of flood at transplanting was nearly identical. It is not clear what caused the increase in 1989-90.
Several of the lines grown in 1989-90 were selections from populations tested in the 1988-89 trial. In theory, the increases in yield recorded in the 1989-90 trials (Table 3 vs. Table 2) could be due to genetic improvement, bul the increase in the control yield indicates that experimental conditions were responsible for the difference between years.
10
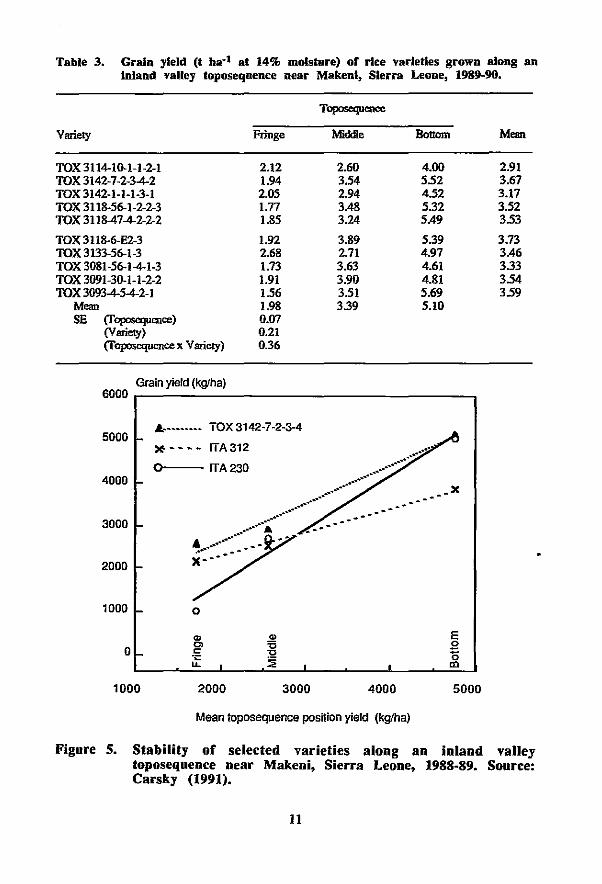
Table 3. Grain yield (t ba·1 at 14% moIsture) or rice varieties grown along an Inland valley toposequenee near Makenl, Sierra Leone, 1989-90.
Variety
TOX 3114-10-1-1-2-1 TOX 3142-7-2-34-2 TOX 3142-1-1-1-3-1 TOX 3118-56-1-2-2-3 TOX 3118474-2-2-2
TOX 3118-6-E2-3 TOX3133-56-1-3 TOX 3081 -56-14-1-3 TOX 3091-30-1-1-2-2 TOX 30934-54-2-1
Mean SE (foposequence)
(Variety) (fopcsequencex Variety)
6000
5000
4000
3000
2000
1000
o
Grain yield (kglha)
o
CD 0> c: ;t
1000 2000
Toposequence
Fringe Middle
2.12 2.60 1.94 3.54 2.05 2.94 1.77 3.48 1.85 3.24
1.92 3.89 2.68 2.71 1.73 3.63 1.91 3.90 156 3.51 1.98 3.39 0.07 0.21 0.36
3000 4000
Mean loposequence posijion yield (kglha)
Bottom
4.00 552 452 532 5.49
5.39 4.97 4.61 4.81 5.69 5.10
E o '5 m
5000
Mean
2.91 3.67 3.17 352 353
3.73 3.46 333 354 359
Figure 5. Stability of selected varieties along an inland valley toposequeuee near Makeni, Sierra Leone, 1988-89. Sonrce: Carsky (1991).
11
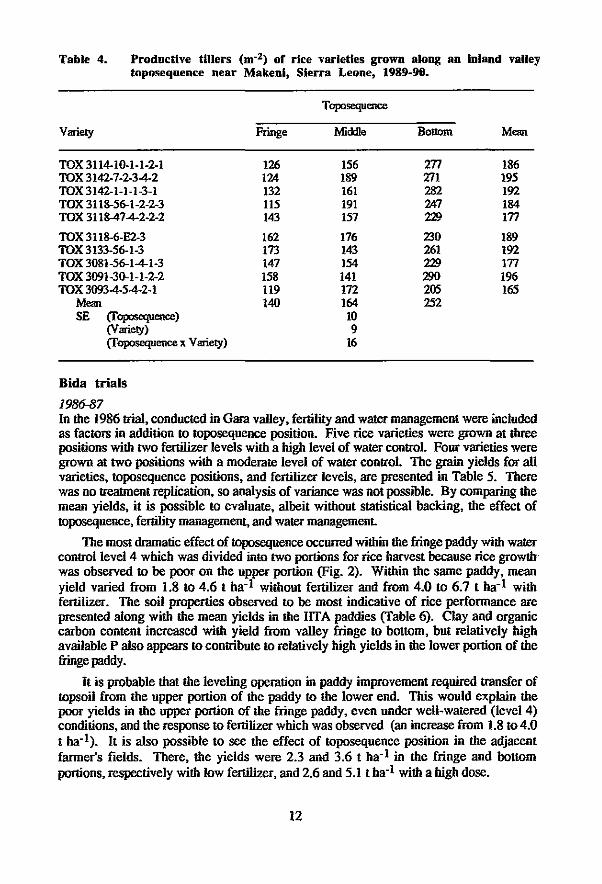
Table 4. Productive tillers (m·2) of rice varieties grown along an inland valley toposequeoce near Makenl, Sierra Leone, 1989~90.
Toposequence
Variety Fringe Middle Bottom Mean
TOX 3114-1()'1·1·2·1 126 156 271 186 TOX 3142·7·2·34-2 124 189 271 195 TOX 3142·1·1-1-3-1 132 161 282 192 TOX 3118-56-1-2-2-3 115 191 247 184 TOX 3118-474-2-2-2 143 157 229 171
TOX 3118-6-E2-3 162 176 230 189 TOX 3133-56-1-3 173 143 261 192 TOX 3081-56-14-1-3 147 154 229 171 TOX 3091-3()'1-1-2-2 158 141 290 196 TOX 30934-5-4-2-1 119 172 205 165
Mean 140 164 252 SE (foposequence) 10
(Variety) 9 (foposequencex Variety) 16
Bida trials
1986-87 In the 1986 trial, conducted in Gara valley, fertility and water management were included as factors in addition to toposequence position. Five rice varieties were grown at three positions with two fertilizer levels with a high level of water control. Four varieties were grown at two positions with a moderate level of water control. The grain yields for all varieties, toposequence positions, and fertilizer levels, are presented in Table 5. There was no treatment replication, so analysis of variance was not possible. By comparing the mean yields, it is possible to evaluate, albeit without statistical backing, the effect of toposequence, fertility management, and water management
The most dramatic effect of toposequence occurred within the fringe paddy with water control level 4 which was divided into two portions for rice harvest because rice growth' was observed to be poor on the upper portion (Fig. 2). Within the same paddy, mean yield varied from 1.8 to 4.6 t ha-l without fertilizer and from 4.0 to 6.7 t ha-l with fertilizer. The soil properties observed to be most indicative of rice performance are presented along with the mean yields in the lIT A paddies (Table 6). Clay and organic carbon content increased with yield from valley fringe to bottom, but relatively high available P also appears to contribute to relatively high yields in the lower portion of the fringe paddy.
It is probable that the leveling operation in paddy improvement required transfer of topsoil from the upper portion of the paddy to the lower end. This would explain the poor yields in the upper portion of the fringe paddy, even under well-watered (level 4) conditions, and the response to fertilizer which was observed (an increase from 1.8 to 4.0 t ha-l ). It is also possible to see the effect of toposequence position in the adjacent farmer's fields. There, the yields were 2.3 and 3.6 t ha- l in the fringe and bottom portions, respectively with low fertilizer, and 2.6 and 5.1 t ha-l with a high dose.
12

Table 5. Effect of posItion in toposequence. fertHlzer application, and water control (level 3 or 4) on yields (t ba-1) of rice grain (14% moisture) In Gara vaHey, Blda, Nigeria, 1986-87. From raw data of Wakatsukl et al. (1988).
Low Fertilizer High Fertilizer Slope position WC4 WC3 WC4 WC3
LocaJ Upper fringe ].7 33 Lower fringe 53 3.1 6.4 2.8 Middle 4_6 6.2 BotIDm. 4..5 3.1 5.8 6.0
ITA 306 Upper fringe 13 43 Lower fringe 4.1 1.8 7.8 21 Middle 4.5 6.5 Bouom 4.6 4.8 5.6 6.7
ITA 212 Upper fringe 1.6 3.6 Lower fringe 3.9 2.1 5.5 2.8 Middle 43 5.1 Bottom 43 3.1 4.1 4.5
ITA 249 Upper fringe 0.7 1.0 Lower fringe 1.6 1.6 Middle 3.8 4.2 Bottom 27 3.0
FARO'lJ Upper fringe 24 4.7 Lower fringe 5.0 2.1 7.1 2.7 Middle 4.1 5.2 Bottom 4.9 3.5 5.1 33
Mean Upper fringe 1.8 4.0 Lower fringe 4.6 23 6.7 2.6 Middle 4.4 5.8 Bottom 4.6 3.6 52 5.1
Note: Low fertilizer was 15-15-15 kg ha·1 of N-P-K on the moderate water control plots (W C 3) and none on the good water control plots (W C 4). High fenilizer was 90-60-60 kg ha-1 of N·P-K in three portions (30-30-30 before last puddling. 30·30-0 at 30 to 40 days after transplanting, and 30-0·30 at panicle initiation).
It is not possible to compare rice growth in the two water control systems directly because (I) the improved paddy received no fertilizer compared with 15-15-15 kg ha-1 of N-P-K in the fanners' field, and (2) the trial was not replicated in space or lime. An examination of the mean yields for the two water control levels in the valley bottom reveals that soil fertility was probably the more important limiting factor. With the recommended dose of fertilizer, yields in the fanner's field equaled those in the improved paddy, indicating that the fanner's water control in the valley bottom was adequate.
13

Water control on the valley fringe appears to have had a large effect on yield of rice. If the mean of the upper and lower fringe and middle positions (equally weighted) is used for comparison with the fringe in the adjacent farmer's field, a rough comparison at best. then the yield increase with increasing level of water control (level 3 to leve14) was 2.3 to 3.6 t ha-1 at low fertilizer and 2.6 to 5.5 t ha-1 at the recommended fertilizer mte.
1987-88 The first trial of rice varieties along the Gadza valley toposequence was conducted in the first season following construction of large,leveled. puddled paddies. Yields are presented in Table 7 for five paddies along the slope from the valley fringe to the bollUm. The varieties were not replicated within the toposequence positions. so there is no estimate of variance.
The toposequence means for the 12 varieties indicate a clear trend of increasing yield from valley fringe to bottom. Since water delivery was dependable. the major factor related to toposequence position should have been soil fertility.
Soil properties from the top lOcm indicate increasing organic C, total N, exchangeable Ca, Mg. and K, % clay, and effective CEC from valley fringe to bottom (Table 8). Soil clay content showed the strongest correlation with yield (Fig. 6) The benefit of clay in this system is related to a dUect effect on water retention and an indirect effect on fertility, allowing accumulation of nutrient supplying organic matter and cation exchange capacity.
The importance of available P is shown by the high yield in paddy no. 2 (Table 8, Fig. 6) which had almost 5 mg kg-I Bray P compared with 1 ppm in the other paddies.
1988-89 In 1988 the rice varieties were replicated at the fringe and valley bottom positions, and dle scheme was repeated on two adjacent fanners' fields-one on the fringe and one in the valley bottom (Fig. 3). Thus, there were two levels of water control-an intermediate level (level 2 to 3) on the fanners' fields and very good control (level 4) in the improved paddies or sawah. Planting, weeding, and fertilization were all carried out by research staff in both water control systems. Although the water control systems were replicated, they were sepamted from each other without being randomly placed in the landscape. Therefore, data were analyzed sepamtely for the two water control systems.
Gmin yields were not significantly affected by toposequence position in the improved paddies. The mean for the fringe was 3.4 t ba-1 compared with 3.9 t ha-1 in the valley bottom (fable 9). It appears that the high level of water control (level 4) has eliminated differences due to toposequence position. The other factor related to toposequence, soil nutrient availability, may have been, at least partly, satisfied by the high dose of fertilizer used (120-60-60 kg ha-1 N-P-K). .
Only replication had a significant effect on grain yield in the improved paddies. This may be related to different soil fertility status of the paddies. When soil was sampled in 1989, the paddies in replication 2 (Fig. 4b) were found to have higher clay and organic carbon content and cation exchange capacity (Table 10).
In the intennediate water control system (level 2-3), toposequence, variety, and their interaction (Tx V), each had a significant effect on grain yield. Grain yield increased from 2.7 t ha-1 on the fringe to 3.7 t ha-1 on the valley bottom (Table 9). In the improved water control system, the corresponding yields were 3.4 and 3.9 t ha-1. Thus, yields were higher and more stable across the toposequence when water control was improved.
14

Table 6. Mean rice yield (t ha'! at 14% moisture) and selected soU (O·10cm depth) properties in two selsa of paddies arranged along a valley toposequeuce Gara valley, Bida, Nigeria, 1986·87.
Toposequence Grnin Clay Organic BrayP position yield (%) Carbcn(%) (mgkg·l)
Set B (No N-P-K) Upper fringe 1.8 6 0.25 5.7 Lower fringe 4.6 8 0.37 8.2 Middle 4.4 18 1.46 4.0 Bottom 4.6 19 1.26 4.9
Set A (With N-P-K) Upper fringe 4.0 9 0.42 18.6 Lower fringe 6.7 15 1.18 23.6 Middle 5.8 19 1.23 12.6 Bottom 5.2 24 1.63 6.3
Note: a. See Figure 1 for location of paddies.
Table 7. Rice yields (t ba" at 14% moisture) in newly constructed paddies, dependable water supply located in different positions along a valley slope in Gadza valley, Bida, Nigeria, 1987-88.Wakatsuki et al. (1989).
Fringe Bottom
Variety I n ill W V Mean
ITA 230 4.7 3.6 5.7 6.4 7.6 5.6 ITA 306 4.9 4.1 4.3 6.6 75 5.4 ITA 312 3.0 55 5.3 6.9 6.9 55 TOX 3109-75-4-1 33 4.2 5.4 6.2 5.6 4.9 TOX3114-I().I-1 2.6 3.8 2.8 4.7 45 3.7 TOX 3118-2-E2-2 5.0 5.0 55 6.6 55
TOX 3118-6-E2-3 33 63 4.7 7.6 7.1 5.8 • TOX311847-1-1 3.0 53 5.2 5.8 6.0 5.1 TOX 3118-78-2-1 3.0 6.4 5.6 5.6 65 5.4 TOX3I33-56-1-3 2.1 5.3 3.4 6.7 62 4.7 ITA 308 2.7 5.9 6.9 4.8 5.0 5.1 FAROlO 2.1 4.9 43 4.8 6.2 45
Mean 3.3 5.0 4.9 6.0 63
There were some important differences among the varieties tested. The current commonly grown variety (FARO 15) served as a check to indicate the potential of the environment for rice production. Few of the materials perfonned better than the check. In the improved paddy system, ITA 306 and TOX 3118-6-E2-3 yielded 0.5 to 1.5 t ha-1 more than the check. In the fanners' system, TOX 3118-6-E2-3 again showed promise by yielding much more than all other varieties in the valley bottom. Another promising new variety was TOX 3118-87-4-2, which gave a unifonnly higher yield than the check.
15
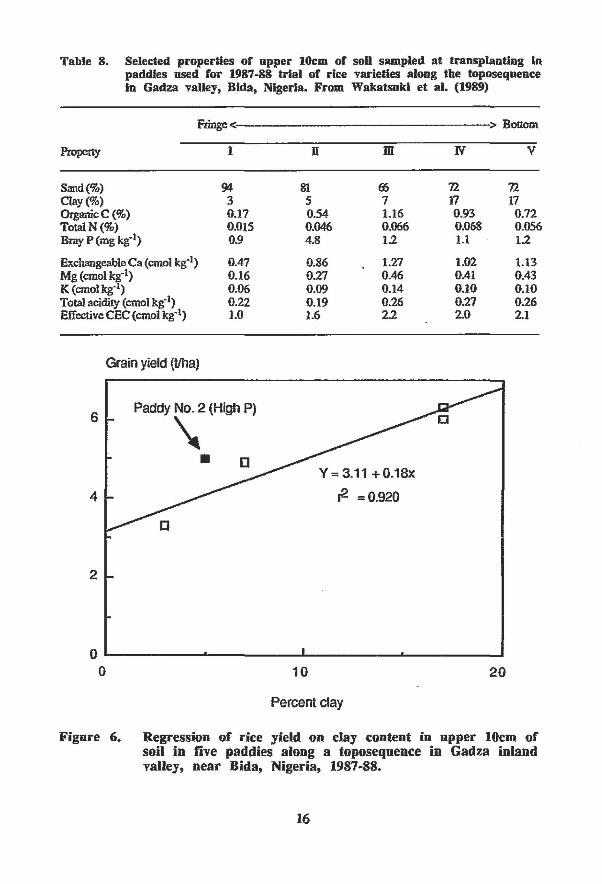
Table 8. Selected properties of upper IOem of soU sampled at transplanting In paddles used for 1987-88 trial of rice varieties along tbe toposequence In Gadza valley, Bida, Nigeria. From Wakatsukl et al. (1989)
> Bottom ~<~----------------------------
Property I
Sand(%) 94 CJay(%) 3 OrganicC(%) 0.17 TotalN (%) 0.015 BrayP(mgkg·l) 0.9
Exchangeable Ca (ernol kg']) 0.47 Mg (ernol kg-I) 0.16 K(ernoIkg-l) 0.06 Total acidity (ernolkg·1) 0.22 Effective CEC (cmol kg·1) 1.0
Grain yield (tlha)
6 Paddy No.2 (High P)
\ •
4
2
n m
81 (6
5 7 0.54 1.16 0.046 0.066 4.8 1.2
0.86 1.27 0.27 0.46 0.09 0.14 0.19 0.26 1.6 22
Y=3.11 +0.18x
r2 =0.920
w
71. 17 0.93 0.068 1.1
1.02 0.41 0.10 0.27 2.0
o ~--------~----------~--------~----------~ o 10 20
Percent clay
V
71. 17 0.72 0.056 1.2
1.13 0.43 0.10 0.26 21
Figure 6. Regression or rice yield on clay content in opper 10cm of' soil in five paddies along a toposeqoence in Gadza inland valley, near Bida, Nigeria, 1987-88.
16

Table 9. Effect of degree of water control" and variety on rice grain yield (I ba·1 at 14% molstnre) on tbe Gadza vaney fringe and bottom, Blda, Nigeria, 1988·89. From raw data of Palada el al. (1990)
Level 4 Level 2·3
Variety Fringe BOI1Dm Fringe BoI1Dm
ITA 306 4.66 4.30 2.34 3.30 ITA 312 3.01 4.41 3.38 3.25 TOX 3118.(j·E2·3 3.92 4.18 2.71 5.24 TOX 3118-874-2 3.32 438 3.86 3.40 TOX3088.3·1·1 1.84 3.50 1.34 2.68 TOX 305246·E2·1 3.93 3.68 2.88 4.36 TOX 3133..59·1·3 3.24 3.32 2.40 3.94 FARO 15 3.00 351 2.49 3.04
Mean 3.36 3.91 2.67 3.65 SE(Valley position) 0.15 0.05
(Variety) 039 0.26 (Position x Variety) 056 0.37
Note: a Water conttol level 4 is dependable water delivery to large. levelled, puddled paddies with large bunds. Water CODlrollevel 3 is irregular water delivery to small paddies with small bunds.
Table 10. Mean rice yield (1988.89 crop) and selected soli fertility Indicators (O·IS, sampled In 1989) presented by toposeqnence and repRcalion for tbe paddles with water control level 4 In Gadza Inland vaJley, near Blda, Nigeria.
Replication Topes.qUl,"':. position I II
Yield (th.·I)
Fringe 2.93 3.82 Bol1Dm 3.66 4.16
C1ay(%)
Fringe 6 10 BOI1Dm 10 12
Orgamccarbon(%)
Fringe 0.45 0.74 BOI1Dm 057 0.77
Effective CEC (cmol kg·l)
Fringe 1.6 2.1 BOI1Dm 1.8 2.0
17

One possible reason for the weak variety effect in the improved system may have been related to the orientation of the rice rows. In this trial and in the previous trial in Gadza valley (1987). the rice was planted parallel to the contour (Fig. 4b). If a gradient existed within a paddy naturally or due to the leveling operation, then some varieties would be located on poor soil and some on relatively fertile soil. In the subsequent year (l989~90). the rice rows were aligned perpendicularly to the contour to avoid this source of error.
1989~90
The trial conducted in 1989-90 was essentially a continuation of the 1988-89 trial. One difference was that some varieties were withdrawn to allow new varieties to be tested. Another major difference was that the rice rows were aligned with the slope. This allowed testing of the varieties at four toposequence positions instead of two (Fig. 4c) and avoided a source of error within the toposequence positions due to a soil fertility gradient within the improved paddies. There remained two replications at each of the four toposequence positions.
The effect of toposequence pOSition on grain yield in the improved paddies was significant (Table 11). The mean yield in position II (2.0 t ha~ 1) was significantly different from paddies ill and IV in the valley bottom (3.8 and 4.4 t ha-1', respectively). The yield in position I was higher than in position II. The reasons for this unexpected occmrence are explored below.
Table ll. MeaD grain yield (t ba- l at 14% moisture) by toposequence position . and variety In a trial of rice along an IV slope under a bigb level of
.' water control In Gadza valley, near Blda, Nigeria, 1989~90.
Fringe< >Bottom Variety
I n ill N
TOX 3118-6-E2~3 3.87 2.75 4.88 4.73 TOX 3107-39~1~2·1~3 2.85 2.37 4.92 5.39 TOX 302743-1-1-E3~1~1-1 3.87 2.81 3:64 4.24 ITA 306 3.15 2.45 5.46 5.13 ITA 234 2.83 1.75 3.66 4.33 TOX 3118-874-2 2.26 1.95 4.34 4.65 TOX 311~10-1-1~2-1 2.79 1.21 250 4.24 FARO 10 1.48 0.84 1.42 2.90
Mean 2.89 2.02 3.85 4.45 SE (Toposequence) 0.35
(Variety) 0.27 (ThY) 0.59
Variety was also a significant factor in me improved paddies. All of me lIT A varieties performed significantly better than the local check which was FARO 10 (1.7 t ha-1). The yield range for the improved varieties was 2.7 to 4.1 t ha~l. with TOX 3118-6-E2-3 and ITA 306 perfurming very well. As in 1988~89. me interaction between toposequence position and variety was not significant.
18
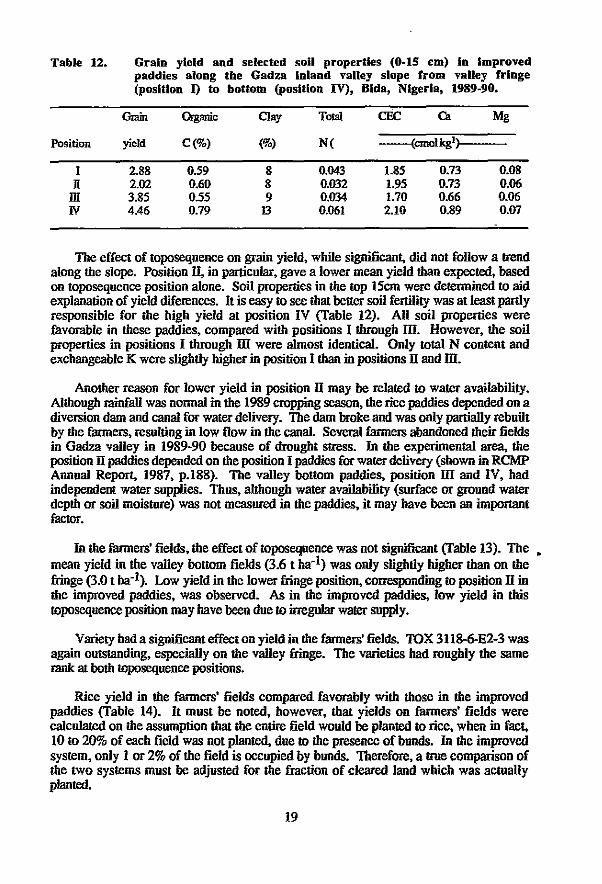
Table 12. Grain yield and selected soil properties (0·15 cm) in Improved paddies along the Gadza inland valley slope from valley fringe (position I) to bottom (position IV), Blda, Nigeria, 1989·90.
Gmin Organic Clay Total CEC Ca Mg
Position yield C(%) (%) N( ---(cmolkgl)
I 2.88 0.59 8 0.043 1.85 0.73 0.08 H 2.02 0.60 8 0.032 1.95 0.73 0.06
ill 3.85 0.55 9 0.034 1.70 0.66 0.06 N 4.46 0.79 13 0.061 2.10 0.89 0.07
The effect of toposequence on grain yield, while significant, did not follow a trend along the slope. Position n, in particular, gave a lower mean yield than expected, based on toposequence position alone. Soil properties in the top 15cm were determined to aid explanation of yield diferences. It is easy to see that better soil fertility was at least partly responsible for the high yield at position IV (Table 12). All soil properties were favorable in these paddies, compared with positions I through ill. However, the soil properties in positions I through ill were almost identical. Only total N content and exchangeable K were slightly higher in position I than in positions n and ill.
Another reason for lower yield in position n may be related to water availability. Although rainfall was nonnal in the 1989 eropping season, the rice paddies depended on a diversion dam and canal for water delivery. The dam broke and was only partially rebuilt by the farmers, resulting in low flow in the canal. Several farmers abandoned their fields in Gadza valley in 1989-90 because of drought stress. In the experimental area, the position n paddies depended on the position I paddies for water delivery (shown in RCMP Annual Report, 1987, p.188). The valley bottom paddies, position ill and IV, had independent water supplies. Thus, although water availability (surface or ground water depth or soil moisture) was not measured in the paddies, it may have been an important factor.
In the farmers' fields, the effect of toposequence was not significant (Table 13). The • mean yield in the valley bottom fields (3.6 t ha- l ) was only slightly higher than on the fringe (3.0 t ha-1). Low yield in the lower fringe position, corresponding to position n in the improved paddies, was observed. As in the improved paddies, low yield in this toposequence position may have been due to irregular water snpp1y.
Variety had a significant effect on yield in the farmers' fields. 10X 3118-6-E2-3 was again outstanding, especially on the valley fringe. The varieties had roughly the same rank at both toposequence positions.
Rice yield in the farmers' fields compared favorably with those in the improved paddies (Table 14). It must be noted, however, that yields on farmers' fields were calculated on the assumption that the entire field would be planted to rice, when in fact, 10 to 20% of each field was not planted, due to the presence of bunds. In the improVed system, only 1 or 2% of the field is occupied by bunds. Therefore, a true comparison of the two systems must be adjusted for the ftaction of cleared land which was actually planted.
19

Afler adjusting for the presence of bUIlds, the farmers' system still compared quite favorably with the improved paddies, especially on the fringe. This was also observed in the 1988-89 trial (Table 9). This may be related to the process of leveling the large paddies which may have resulted in the exposure of poor subsoil. While it is not unequivocally demonsttated by the data at hand, it is a factor which must be kept in mind when planning large paddies on N slopes.
Table 13. Mean grain yield (t ba-1 at 14% moisture) by toposequence position and variety In a trial of rice along an IV slope under tbe farmers moderate level of water control In Gadza valley, near Blda, Nigeria, 1989-90.
Pring< >Bottam Variety
Upper Lower Upper Lower
TOX 3118-6·E2-3 4.57 5.75 4.45 4.82 TOX 3107-39-1-2-1-3 3.90 2.15 5.11 4.17 TOX 3027-43-1-1-E3-1-1-1 2.65 3.46 4.39 4.04 ITA 306 3.61 2.16 4.64 3.40 ITA 234 3.54 2.95 3.24 3.86 TOX 3118-874-2 1.93 242 3.58 3.68 TOX 3114-10-1-1-2-1 3.15 1.05 2.98 2.09 FARO 10 2.49 2.24 1.74 1.54
Meal 3.23 2.77 3.77 3.4S SE (Toposequence) 0.16
(Variety) 0.38 (fxV) 0.70
Table 14. Mean yields (t ba·1 at 14% moisture) of rice In upper and lower portions of fringe and bottom toposequence pOSitions under two water control systems at Gadza IV, Blda, Nigeria, 1989-90.
Position
Fringe ~3.24 Lower 2.77
BotlOm Upper 3.76 Lower 3.45
2-3
2.88 2.02
3.85 4.46
Wa~ Control Levela
4
Note: a Water control level 2-3 on farmers' paddies adjacent to improved paddies witbJeveJ4.
20

IV. General Discussion
The objective of the loposequence trials was to identify rice varieties for inland valley conditions. One variety (TOX 3118-6-E2-3) performed consistently well at all toposequence positions in two years in central Sierra Leone and three years in central Nigera. This is remarkable considering the difference between the two areas, mostly in tenns of rainfall but also in term s of waler control levels used in the two sileS. A further selection from this population is now called ITA 326.
An important toposequence by variety interaction (TxV) would indicate the need to select varieties for specific toposequence positions. An interaction would be more likely when toposequence effect is strong. The toposequence effect, in turn, was most related to the level of waler control which was different at each site. Yields were relatively slable between valley fringe and bottom at Bida, especially in the improved paddies with a high level of waler control. An important Tx V was never observed in the improved paddies, while some TxV was observed in the farmers' paddies in Gadza which had a low to moderate level of water control. Under minimum water control, as practiced in the Makeni area. the toposequence effect was strong and Tx V was important In spite of this, some varieties (such as TOX 3142-7-2-3-4, now called ITA 342) were observed to perform well at all toposequence positions. Thus, breeding for different positions on the toposequence is not justified. Screening of new varieties along the toposequence is, however, still needed to identify varieties which perform well. These trials provided a lest of rice varieties under well-managed conditions. A major test will come when varieties are grown by farmers under real conditions of little fertilizer input and less labor input for weeding. These tests have also not addressed grain quality, a major constraint to the adoption of improved varieties by fanners.
This synthesis provides an opportunity to analyze the methodology used to screen varieties along IV slopes. This would allow easier and more definitive comparison of results from different valleys in different environments. An important need in trials of this type, especially in areas with a minimum level of waler control, is to measure·~e depth of surface or ground water periodically during the growing season. This, along with some basic soil characteristics, would allow eXlrapolation of results to other IVs in other environments. The critical soil properties to be determined depend, to some extent, on the level of water control in use. Clay and organic carbon content are determinants of water relention and availability in systems with a low level of waler control. Properties related to nutrient supply (total N, Bray P, exchangeable K, and cation exchange capacity) are most imporl3nt when water control is improved, and soil fertility becomes limiting.
Future trials should be conducted using a methodology based on past experience. From the trials reported here, it is clear that it is necessary to replicate varieties at each toposequence position. This allows an estimate of the variance to distinguish slatistically between varieties and toposequence positions. Another important issue, especially in valleys with relatively steep slopes, is the orienlation of the rows of rice. Since a gradient along the toposequence is likely, rice plants from the same toposequence position should be compared. If the rice rows follow the contour, then one variety will be compared to another which is higher or lower on the toposequence. Rather, the rice should be planted along the slope, so that every plant along the row will have a counterpart in any other row. If it is necessary to orientale the rows along the contour, then covariance should be used to adjust the means. The covariate can be an inleger representing the position of the plot from upper to lower, or a value such as the distance from a fixed Object such as a stream or canal.
21

v. Summary
To realize the potential of the West African inland valleys (IVs) for rice production, there is a need to screen varieties in differing agroecological zones and under the variable conditions found along IV slopes. Seven such trials, conducted in Sierra Leone and Nigeria from 1986-87 to 1989-90, are analyzed here.
Water control was a major determinant of the effect of toposequence. Water control teduced differences in rice yield from valley fringe to bottom, making toposequence by variety interaction (TxV) less likely. TxV was only evident in minimum or moderate water control systems, where the toposcquence effect was also strong.
One variety, TOX 3118-6-E2-3, stood out in the five trials in which it was grown in a wide range of climates, water control systems, and toposequence positions. Another variety, TOX 3142-7-2-3-4, grown only in the Sierra Leone trials, was equally good.
Soil analyses proved valuable in helping to explain differences in rice yield along the toposequence. Surface and ground water table depth are critical data, which should be collected in screening studies of this kind.
Acknowledgements
The work reponed here was conducted by the rice-based systems working group. The group leader was M. C. Palada, RCMP agronomist until 1989. His major collaborators in this work were T. M. Masajo, rice breeder with the rice research program (RRP), and T. Wakatsuki, visiting JICA soil scientist with RCMP until (1988). The trials were conducted in Makeni, Sierra Leone, under the supervision of M. Jalloh, agronomist with the Land and Water Development Division of the Ministry of Agriculture, Natural Resources and Forestry, Sierra Leone and in Bida, Nigeria, under the supervision of O. O. Fashola, RCMP research assistant.
22

References
Andriesse W. 1986. Area and distribution. p. 15-30. in A. S. R. Juo and J. A. Lowe (ed.). The Wetlands and Rice in SubSabanm Africa lITA, Ibadan.
Bertrand, R. 1973. Contribution a l'elUde hydrologique, pedologique et agronomique des sols gris sableux hydromOlphes de Casamance (Senegal). L'Agronomie Tropicale 28: 1145-1192.
Carsky, RJ. 1991. Rice-based production in inland valleys of West Africa: research review and recommendations. Resource and Crop Management Program (RCMP) Research Monograph No.8. UTA, lbadan, Nigeria
Esu, I.E. 1986. Morphology and classification of soils of the Nupe Sandstone Formation in Niger State, Nigeria. Samaru Journal of Agricultural Research 4: 13-23.
Garrity, D.P. 1984. Rice environmental classifications: A comparative review. p.lI-26. in Terminology for rice growing environments. International Rice Research instilUte (IRRI), Los Banos, The Philippines.
International Institute of Tropical Agriculture. 1988. UTA Strategic Plan 1989-2000. lbadan, Nigeria.
International Rice Research Institute. 1983. IRRI Annual Report for 1983. pp 354-355. Los Banos, The Philippines.
Jalloh, M. and M.C. Palada 1989. On-farm trials in Makeni, Sierra Leone p. 177-179 in Resource and Crop Management Program (RCMP) 1987 Annual Report , Ibadan, Nigeria.
Masajo, T.M. and R.I. Carsky. 1989. Selecting and developing rice and upland crop varieties for inland valley swamps with minimum or partial water control. Paper presented at Second West African Farming Systems Research • symposium, Accra, Ghana, August 28 - 1 September, 1989.
Moormann, F.R. 1973. General assessment of land on which rice is grown in West Africa. Seminar on rice soil fertility and fertilizer use. West African Rice Development Association (WARDA). Monrovia, Liberia.
Moormann, F.R., W.J. Veldkamp and J.C. Ballaux. 1977. The growth of rice on a toposequence--a methodology. Plant and Soil 48:565-580.
Nguu, N.V., J.W. Gibbons and R.L. Dobson. 1988. Performance of rice (Oryza sativa) on slopes of inland valleys in West Africa. Field Crops Research 18: 113-125.
Oosterbaan, R.I., H.A. Gunneweg and A. Huizing. 1987. Water control for rice cultivation in small valleys of West Africa. International Institute for Land Reclamation and Improvement (ILRI) 1986 Annual Report. p. 30-49. Wageningen.
23

Palada, M.C., T.M. Masajo and P.Wa1ker. 1990. Rice variety trial at Bida, Nigeria. p. 160-162 in Resource and Crop Management Program (RCMP) 1988 Annual Report, Ibadan, Nigeria.
Palada, M.C., M. Jalloh and T.M. Masajo. 1990. Rice variety trial at Makeni, Sierra Leone. p. 162-163 in Resource and Crop Management Program (RCMP) 1988 Annual Report, Ibadan, Nigeria.
Richards. P. 1986. Coping with Hunger: Hazard and Experiment in an African Rice Farming System. Allen and Unwin, London
Van Vuure, W. and R. Miedema. 1973. Soil survey of the Makeni area, Northern province, Sierra Leone. Njala University College, University of Sierra Leone. 103 p.
Wakatsuki, T., T. Kosaki and M.C. Palada. 1989. Sawah for sustainable rice farming in inland valley swamps, IVSs, in West Africa. Paper presented at Second West African Farming Systems Research symposium, Accra. Ghana, 28 August· 1 September 1989.
Wakatsuki, T., Y.S. Chen, N.C. Navasero. A. Evers, M.C. Palada, 0.0. Fashola and J. Musa. 1988. Water management and hydrological studies: Bida, Nigeria. p. 81-86 in Resource and Crop Management Program (RCMP) 1986 Annual Report, Ibadan, Nigeria.
24

ERRATA
Table 1. Grain yield (t ba·1 at 14 % moisture) orr-ice varieties planted on fringe and bottom of Inland vaDey near Makeni, Sierra Leone, 1987. From Jalloh and Parada (1989).
Variety
HTA222 ITA 312 ROK14 ROK5 PJLV
SE
Bottom Yield
4.72 4.76 2.64 3.65 237 0.66
Fringe Variety Yield
ITA 230 1.92 ITA 315 1.93 ROKll 1.80 ROK12 1.60 PJLV 1.77
0.23
Table 2. Yield of gram (t ba·I ) at 14% moisture) m rice variety trial along toposeqoence of Inland vaney near Makeni, Sierra Leone. 1988-89. From Palada et aI. (1990).
Toposequence Variety Fringe Middle Bottom Mean
TOX 3114-10-1-3-2 2.02 1.89 3.96 2.62 TOX 3118-6-E2-3 1.63 2.17 534 3.23 TOX 3118-47-4-2-2 1.62 2.97 4.40 3.00 TOX 3118-18-56-1-2-1 1.15 2.90 4.42 2.83 TOX 3113-56-1-3-3 132 258 4.90 3.27
TOX 3142-1-1-1 1.44 2.29 5.19 2.97 TOX 3142-7-2-3-4 2.56 2.90 5.11 2.52 ITA 230 1.01 2.69 4.99 3.16 ITA 312 2.18 2.54 3.84 2.86 Local check (pa Alpha) 1.54 2.15 4.41 2.70
Mean 1.73 2.56 4.76 SE 0.16 0.21 0.36 0.26
Table 14. Mean pelds (t ha·I at 14% moisture) of rice in upper and lower portions offringe and bottom toposequence pOSitions under two water control systems at Gadza IV, Bida, Nigeria, 1989·90.
Water Control Level& Position 2·3 4
Fringe Upper 324 2.88 Lower 2.77 2.02
Bottom Upper 3.76 3.85 Lower 3.45 4.46
Note: & Water control level 2-3 on farmers' paddies adjacent to improved paddies with level 4.

Resource and Crop Management Research Monographs
1. Economics of Root and Tuber Crops in Africa, Paul Dorosh, January 1988.
2. Cropping Systems and AgroeconomJc Performance of Improved Cassava in aHumid Forest Ecosystem, Felix I. Nweke, Humphrey C. Ezumah and DunstanS.C. Spencer, June 1988.
3. Indices for Measuring the Sustainability and Economic Viability of FarmingSystems, Simeon K. Ehui and Dunstan S.C. Spencer, November 1990.
4. Opportunities for Second Cropping in Southwestern Nigeria. H.J.W. Mutsaers,February 1991.
5. A Strategy for Inland Valley Agroecosystems Research in West and CentralAfrica, A-M. N. Izac, MJ. Swift and W. Andriesse, March 1991.
6. Production Costs in the Yam-based Cropping Systems of Southeastern Nigeria,Felix I. Nweke, B.O. Ugwu, C.L.A. Asadu and P. Ay, June 1991.
7. Annual Report 1990: Highlights of Research Findings, June 1991.
8. Rice-based Production in Inland Valleys of West Africa: Research Review andRecommendations, R. J. Carsky, October 1991.
9. Effect of Toposequence Position on Performance of Rice Varieties in InlandValleys of West Africa, R. J. Carsky and T. M. Masajo, October 1991.