effect of the hedgehog pathway inhibitor gdc-0449 in lung
TRANSCRIPT
Division of Respiratory Medicine, Medizinische Klinik und Poliklinik IV
der Ludwig-Maximilians-University of Munich, Germany
Director: Prof. Dr. Martin Reincke
Effect of the Hedgehog Pathway Inhibitor GDC-0449
in Lung Cancer Cells and Lung Cancer Stem Cells
Thesis submitted for a Doctoral Degree in Human Biology at the faculty of Medicine,
Ludwig-Maximilians-University, Munich, Germany
by
Fei Tian
from Shanghai, China
2013

2
With approval of the Medical Faculty
University of Munich
First reviewer: Priv. Doz. Dr. med. Albrecht Bergner
Second reviewer: Prof. Dr. Hans-Joachim Stemmler
Priv. Doz. Dr. Barbara Mayer
Priv. Doz. Dr. Silke Meiners
Co-supervisor: Prof. Dr. Dolores J. Schendel
Dean: Prof. Dr. med. Dr. h.c. M. Reiser, FACR, FRCR
Date of the examination: 19.03.2013

3
Abstrakt-Zusammenfassung
Die Krebsstammzellen-Hypothese impliziert, dass eine Tumorzellpopulation sowohl mit
relativ gut differenzierten Zellen wie auch mit schlecht differenzierten Zellen ist. Nur eine
kleine Population von schlecht differenzierten tumorigen Cancer Stem Cells kann die
normalen Grenzen der Selbst-Erneuerungen überschreiten, hat die Fähigkeit zur Vermehrung
und hält das bösartige Wachstum des Tumors aufrecht.
Die Fähigheit con Stammzellen, durch eine Überexpression von ATP-binding casette-
Transporteren auf der Zellmembran Farbstoff wie Hoechst 33342 zu eliminieren, erlaubt
deren Identifizierung. Dies macht die Erkennung der Stammzellen möglich. Nach der Hoechst
33342 Färbung scheiden die Stammzellen den Farbstoff aus und zeigen ein typisches Profil
von niedrigen Floreszenzen in Hoechst Rot und Hoechst Blau Dot-Plots. Diese mit Hoechst
33342 schwach gefärbten Zellen werden als Side Population (SP)-Zellen bezeichnet. Diese
Eigenschaft ermöglicht eine Reinigung und Charakterisierung wenn diese allein oder in
Kombination mit Stammzellen Oberflächenmarker durchgeführt wird. Die CSC-Hypothese
könnte einen wesentlichen Einfluss auf die Krebstherapie haben. CSCs haben im Gegensatz
zu differenzierten Krebszellen eine erhebliche Resistenz gegen herkömmliche
Chemotherapeutika gezeigt. Es ist wichtig, zunächst eine komplette Therapie-Strategie zu
entwerfen. Die proliferierende Zellmasse sollte reduziert oder minimiert, um dann CSCs
differenzieren oder eliminieren. So zu können ergabe sich eine Möglichheit, die Schübe der
metastierenden Krebserkrankungen zu verhindern.
Diese Arbeit untersucht die Fragenstellung ob der Hedgehog-Signal-Pathway-Inhibitor GDC-
0449 in den Lungenkrebs-Zelllinien HCC (Adeno-Karzinom) und H1339 (Kleinzelliges
Bronchialkarzinom) und in Cisplatin resistenten Lungenkrebszellen wirksam ist und ob
mögliche Auswirkungen der GDC-0449 über SP übermittelt werden. Ferner wurde die
Wirkung von GDC-0449 auf die Calcium-Homöostase untersucht.
GDC-0449 zeigte eine dosisabhängige hemmende Wirkung auf das Zellwachstum in HCC
und H1339 Zellen. Die Kombination von GDC-0449 und Cisplatin erzielte eine zusätzliche
hemmende Wirkung. GDC-0449 konnte auch das Zellwachstum in Cisplatin-resistenten HCC
und H1339 Zellen hemmen. SP-Zellen als Krebsstammzell-ähnliche Zellen konnten in HCC
und H1339 Zellen gefunden werden. Lediglid SP-Zellen zeigten eine Repopulationsfähigkeit,
nicht aber Non-SP-Zellen. GDC-0449 konnte die SP-Zellfraktion in HCC und H1339 Zellen
hemmen. Die Wirkung von GDC-0449 auf das Zellwachstum kann somit durch SP vermittelt
werden.

4
GDC-0449 beeinflusste die Expression der Hh-Pathway-Komponenten in HCC und H1339
Zellen. In HCC Zellen hemmte GDC-0449 die Aktivität des Hh-Pathways, somit konnte die
De-Regulation von Hh-Pathway-Komponenten Shh, Patched und Gli-1 gezeigt werden. In
H1339 Zellen konnte GDC-0449 auch die Pathway Aktivität hemmen und die Expression von
Gli-1 in einem autokrinen Muster durch Shh Überexpression verringern. Die Hemmung der
Hh-Pathways erhöhte die Expression von Bmi-1, um den Verlust der Hh-Pathway -Funktion
zu kompensieren. Die Hh-Pathway-Aktivität konnte nur in SP-Zellen von HCC und H1339
Zellen identifiziert werden.
Die Anwendung des GDC-0449 auf HCC und H1399 naiven und Cisplatin-resistenten Zellen
erhöhte Zytoplasma Calcium Konzentration durch eine Verringerung von ER Calcium
Konzentration. GDC-0449 induzierte eine Calcium Freisetzung aus ER ins Zytoplasma in
HCC und H1339 naiven und Cisplatin-resistenten Zellen. Die Calcium Überlastung konnte
zur Apoptose führen, welche im Zusammenhang mit der das Zellwachstum hemmenden
Wirkung von GDC-0449 bei Lungenkrebs-Zellen steht. Die Expression von SERCA und
IP3R war nicht nachweislich durch GDC-0449 beeinflusst. Die Wirkung des GDC-0449 auf
die Lungenkrebszellen Calcium-Regulationsvorgänge wurde nicht mittels Wechsel der
Expression von ER Ca2+ regulierenden Kanälen erzielt.

5
Abstract- Summary
The cancer stem cell hypothesis implicates that tumor cell population is heterogeneous with
relatively well-differentiated cells and poorly-differentiated cells. Only the small population
of tumourigenic poorly-differentiated CSCs can escape the normal limits of self-renewal and
has the ability to proliferate and maintain the malignant growth of the tumor.
One characteristic of stem cell is that the ability to exclude DNA dyes, such as Hoechst 33342
via the over-expression of ATP-binding cassette transporters (ABC transporters) on the cell
membrane. It makes the detecting of the stem cell possible. After the Hoechst 33342 staining,
stem cells extrude this dye and show a typical profile of low fluorescence in Hoechst red
versus Hoechst blue bivariate dot plots. These low Hoechst 33342 stained cells are named as
side population (SP) cells. This characteristic has enabled purification and characterization of
CSCs when carried out alone or in combination with stem cell surface markers.
The CSC hypothesis could have a fundamental influence on cancer therapy. CSCs have
shown significant substantial resistance to conventional chemotherapy in contrast to the
differentiated cancer cells. It is essential to design a complete therapy strategy first to reduce
or minimize proliferating cell mass and then to differentiate or eliminate CSCs, so that the
relapses of metastatic cancers could be prevented.
This work aimed at investigating if Hedgehog pathway inhibitor GDC-0449 is effective in the
lung cancer cell lines HCC (adeno-carcinoma) and H1339 (small cell lung carcinoma) and
also the cisplatin resistant lung cancer cells, and if possible effects of GDC-0449 are mediated
via SPs. Furthermore, the effect of GDC-0449 on the calcium homeostasis was also
investigated.
GDC-0449 showed dose-dependent inhibitory effects on cell growth in both HCC and H1339
cells. The combination of GDC-0449 and cisplatin gave an additional inhibitory effect. GDC-
0449 could also inhibit the cell growth in cisplatin resistant HCC and H1339 cells.
SP cells as cancer stem-cell-like cells could be found in HCC and H1339 cells. Only the SP
cells showed the repopulation ability but not the non-SP cells. GDC-0449 could inhibit the SP
cell fraction in both HCC and H1339 cells. So the inhibitory effect of GDC-0449 on cell
growth may be mediated via SP.
GDC-0449 affected the expression of the Hh pathway components in both HCC and H1339
cells. In HCC cells, GDC-0449 inhibited the activity of the Hh pathway and the down-
regulation of Shh, Patched and Gli-1 could be shown. In H1339 cells, GDC-0449 could also
inhibit the pathway activity and decrease the expression of Gli-1 in an autocrine pattern due

6
the over-expression of Shh. The inhibition of Hh pathway increased the expression of Bmi-1
to compensate the loss of Hh pathway function. The Hh pathway activity could be detected
only in SP cells from HCC and H1339 cells.
The application of GDC-0449 on HCC and H1339 naïve and cisplatin resistant cells increased
[Ca2+]c by decreasing [Ca2+]ER. GDC-0449 induced Ca2+ release from ER into cytoplasm in
HCC and H1339 naïve and cisplatin resistant cells. The Ca2+ overload could lead to apoptosis,
which was related to the cell growth inhibitory effect of GDC-0449 in lung cancer cells. The
expression of SERCA and IP3R was not detectably influenced by GDC-0449. The effect of
GDC-0449 on lung cancer cell Ca2+ -regulating machinery was not via the alternation of the
expression of ER Ca2+ regulating channels.

7
1 INTRODUCTION ............................................................................................................ 13
1.1 Cancer stem cells ...................................................................................................... 13
1.2 Side population phenotype ....................................................................................... 15
1.3 Human ATP-binding cassette transporter superfamily ............................................ 16
1.4 Hedgehog pathway and Hedgehog pathway inhibitors ............................................ 18
1.4.1 Structure and function of the Hh pathway components ................................... 19
1.4.2 Hedghog pathway and cancer ........................................................................... 23
1.4.3 Targeting Hedgehog signaling in cancer therapy ............................................. 26
1.5 Calcium signaling ..................................................................................................... 28
1.5.1 Calcium channels and pumps ........................................................................... 28
1.5.2 Calcium and cancer .......................................................................................... 29
1.5.3 Target calcium in cancer .................................................................................. 30
2 METHODS AND MATERIALS ..................................................................................... 32
2.1 Biological material ................................................................................................... 32
2.2 Lab material and equipment ..................................................................................... 32
2.2.1 Laboratory consumables ................................................................................... 32
2.2.2 Lab equipment .................................................................................................. 33
2.3 Cell culture ............................................................................................................... 33
2.3.1 Cell culture medium and supplement ............................................................... 33
2.3.2 Cell culture equipment ..................................................................................... 34
2.3.3 Cell culture medium recipe .............................................................................. 34
2.3.4 Monolayer culture of lung cancer cell lines ..................................................... 35
2.3.5 Survival curve ................................................................................................... 35
2.4 Mini-organ culture system ........................................................................................ 35
2.4.1 Culture material and equipments ...................................................................... 35
2.4.2 Culture medium and agar plate ........................................................................ 36
2.4.3 Biopsy cultivation ............................................................................................ 37
2.5 Flow cytometry and cell sorting of SPs ................................................................... 37
2.5.1 Material and equipment .................................................................................... 37
2.5.2 FACS analysing and cell sorting for SPs ......................................................... 38
2.5.3 Stem cell markers analysis ............................................................................... 39
2.6 Western blot ............................................................................................................. 39
2.6.1 Material and equipment .................................................................................... 39
2.6.2 Solution recipe .................................................................................................. 41
8
2.6.3 Western blot ..................................................................................................... 42
2.7 Immunofluorescence ................................................................................................ 44
2.7.1 Immunofluorescence material .......................................................................... 44
2.7.2 Immunofluorescence for SP and non-SP cells ................................................. 45
2.8 Calcium staining ....................................................................................................... 46
2.8.1 Calcium staining material ................................................................................. 46
2.8.2 Composition of fluorescent microscope for calcium imaging ......................... 46
2.8.3 Fura-2 calibration curve ................................................................................... 46
2.8.4 Cytoplasm Ca2+ concentration measurement ................................................... 47
2.8.5 ER Ca2+ concentration measurement ............................................................... 48
3 RESULTS ......................................................................................................................... 49
3.1 Inhibitory effect of GDC-0449 on cell growth ......................................................... 49
3.2 Inhibitory effect of GDC-0449 combined with cisplatin on cell growth ................. 51
3.3 Effect of GDC-0449 on the expression of Hh pathway components in HCC and
H1339 cells ............................................................................................................... 56
3.4 SP fraction in HCC and H1339 cells ........................................................................ 63
3.5 SP cells repopulation ability ..................................................................................... 64
3.6 Expression of stem cell marker in lung cancer SP cells ........................................... 65
3.7 Inhibitory effect of GDC-0449 on SP cells .............................................................. 66
3.8 Hh pathway activity in SP cells and non-SP cells .................................................... 68
3.9 Cytoplasm free Ca2+ concentration measurements .................................................. 69
3.10 Endoplasmic reticulum Ca2+ concentration measurements ...................................... 70
3.11 GDC-0449 effect on cytoplasm free Ca2+ concentration ......................................... 71
3.12 GDC-0449 effect on ER Ca2+ concentration ............................................................ 74
3.13 Effect of GDC-0449 on SERCA, IP3R expression in HCC-Res and H1339-Res cells
……………………………………………………………………………………..76
4 DISCUSSION .................................................................................................................. 80
4.1 Effect of Hedgehog pathway inhibitor on lung cancer cell lines ............................. 80
4.2 Cancer stem cell in lung cancer cell lines ................................................................ 82
4.3 Effect of GDC-0449 on cancer stem cells ................................................................ 83
4.4 Ca2+ homeostasis in lung cancer cell lines and lung cancer stem cells .................... 84
4.5 Effect of Hedgehog pathway inhibitor on the Ca2+ homeostasis in lung cancer cell
lines .......................................................................................................................... 86
4.6 Outlook ..................................................................................................................... 87

9
5 CONCLUSION ................................................................................................................ 89
6 REFERENCES ................................................................................................................. 90
Appendix I ................................................................................................................................ 98

10
FIGURES Figure 1. Standard curve from BSA standard samples.
Figure 2. Fura-2 calcium calibration curve: the Kd of Fura-2 AM was yielded as 269 nM.
Figure 3. GDC-0449 effect on the growth of lung cancer cells.
Figure 4. GDC-0449 effect on the growth of HCC and H1339 cells with or without cisplatin.
Figure 5. GDC-0449 effect on the growth of HCC-Res and H1339-Res cells with or without
cisplatin.
Figure 6. GDC-0449 effect on the expression of Hh pathway components in HCC cells.
Figure 7. GDC-0449 effect on the expression of Hh pathway components in H1339 cells.
Figure 8. SP in HCC and H1339 cells.
Figure 9. Repopulation ability of SP cells.
Figure 10. Stem cell marker expression of SP cells.
Figure 11. GDC-0449 effect on SP cell fraction.
Figure 12. SMO expression in SP and non-SP cells.
Figure 13. [Ca2+]c of lung caner cells and BEC.
Figure 14. [Ca2+]ER of lung caner cells and BEC.
Figure 15. Effect of GDC-0449 on [Ca2+]c in HCC and H1339 cells.
Figure 16. Effect of GDC-0449 on [Ca2+]c in HCC-Res and H1339-Res cells.
Figure 17. Effect of GDC-0449 on [Ca2+]ER in HCC and H1339 cells.
Figure 18. Effect of GDC-0449 on [Ca2+]ER in HCC-Res and H1339-Res cells.
Figure 19. Effect of GDC-0449 on SERCA, IP3R expression in HCC-Res and H1339-Res
cells.

11
LIST OF ABBREVIATIONS:
NEB: neuroepithelial body
BADJ: bronchoalveolar duct junction
CSC: cancer stem cell
AML: acute myelogenous leukaeia
BASC: bronchioalveolar stem cell
SP: side population
ATRA: all-trans retinoic acid
HSC: hematopoietic stem cell
ABC transporter: ATP-binding cassette transporter
MDR1: multidrug resistance 1
Bcrp1: breast cancer resistance protein 1
TMD: transmembrane domain
NBD: nucleotide-binding domain
MDR: multidrug resistance
DISC: death inducing signal complex
Hh: hedgehog
SMO: Smoothened
Gli-1: GLI family zinc finger 1
Shh: Sonic hedgehog
Dhh: Desert hedgehog
Ihh: Indian hedgehog
SEPE: Shh floor plate enhancers
SBE: Shh brain enhancers
SHH-C: C-terminal catalytic domain
SHH-N: N-terminal signaling domain
CHOL: cholesterol
PAL: palmitoylation
CTD: C-terminal domain
SSD: sterol sensing domain
Fz: frizzled
CRD: cysteine-rich domains
GPCR: G-protein-coupled receptor

12
Bmi-1: B-cell-specific Moloney murine leukemia virus integration site 1
NSCLC: non-small cell lung cancer
SCLC: small cell lung cancer
BCC: basic cell carcinoma
IGF 2: insulin growth factor 2
VEGF: vascular endothelial growth factor
CML: chronic myeloid leukemia
MM: multiple myeloma
siRNA: small interfering RNA
shRNA: small hairpin RNA
PD: pharmacodynamic
PK: pharmacokinetic
PM: plasma membrane
ER: endoplasmic reticulum
SR: sarcoplasmic reticulum
[Ca2+]c: cytoplasm free Ca2+
[Ca2+]ER: endoplasmic reticulum Ca2+
SOCC: store-operated Ca2+ channel
VOCC: voltage-operated Ca2+ channel
ROCC: receptor-operated Ca2+ channel
IP3: inositol 1, 4, 5-trisphosphate
IP3R: inositol 1, 4, 5-trisphosphate receptor
RyR: ryanodine receptor
SERCA: sarcoplasmic/endoplasmic reticulum Ca2+ ATPase
PARP1: poly ADP-ribose polymerase-1
ROI: regions of interest
CPA: cyclopiazonic acid
Kd: dissociation constant
HCC-Res: HCC cisplatin resistant cell
H1339-Res: H1339 cisplatin resistant cell
ROI: region of interest
BEC: human bronchial epithelium cell

13
1 INTRODUCTION
1.1 Cancer stem cells
Stem cells are characterized as cells that have the self-renewal ability to undergo cycles of
mitotic cell division while maintaining the undifferentiated state and at the same time have the
potency to differentiate into specialized cell types. Concisely the key features of normal stem
cells are quiescent, asymmetrical and multipotent. In adult tissues, stem cells and progenitor
cells have been identified to contribute to tissue maintenance and repair. Stem cells in adult
tissues are mainly quiescent and can self-renew and also differentiate into all types of tissue
cells. According to the adult stem cell asymmetrical division hypothesis, one stem cell divides
into one daughter cell that remains quiescent as a stem cell and at concurrently the other one
commences determination and generates proliferating progenitor cells, which have merely
limited cell divisions. The fate of these could be either to differentiate or die. The adult stem
cells have been frequently detected in special niches due to a local anatomical and chemical
microenvironment. In an adult lung, stem cell population has been demonstrated to restrict
themselves to the tracheal submucosal gland ducts, neuroepithelial bodies (NEBs) of the
bronchi and bronchioles, and bronchoalveolar duct junction (BADJ) of the terminal
bronchioles [1-5].
Similarities have been observed between the self-renewal mechanism of normal tissue stem
cells and the continuous proliferation of cancer. Certain connections between stem cells and
tumor cells have been shown; therefore the concept of cancer stem cells (CSCs) has arisen.
The cancer stem cell hypothesis implicates that tumor cell population is heterogeneous with
relatively well-differentiated cells and poorly-differentiated cells. Only the small population
of tumourigenic poorly-differentiated CSCs can escape the normal limits of self-renewal and
has the ability to proliferate and maintain the malignant growth of the tumor. The concept of
CSC gains its ground mostly in a haematopoietic system when it just emerged and research
has been extended to solid tumors subsequently. The CSC phenomenon was first documented
in acute myelogenous leukaeia (AML) by John Dick et al. in 1997 [6]. In 2003, M Al-Hajj et
al. have described the isolation from human breast cancer tissues of a unique subset of cancer
cells that was capable of repopulating the tumor, whereas most of the breast cancer cells were
not capable of perpetuating the tumor [7], which has taken the cancer research field by storm
and afterward cancer stem cells have been identified also in other cancers, including lung
cancer.

14
How to identify normal adult stem cells and cancer stem cells depends on the tissue
specialties as well as the functional definition. Conservative stem cell surface markers have
been used to isolate cancer stem cells, e.g. CD24, CD31, CD34, CD44, CD45, CD117, CD33
etc.. M Al-Hajj et al. announced that CSC in breast cancer showed CD44+CD24- phenotype
and can induce tumor formation after being isolated and then transplanted into immune-
deficient NOD/SCID mice, whereas other cell types from the entire tumor cell population
failed to demonstrate the same capability [7]. Bronchioalveolar stem cells (BASCs), which
exhibited stem cell self-renewal and potency features and which were able to give rise to
adenocarcinoma as a response to oncogenic stimulation (K-ras) both in vitro and in vivo, had
a surface stem cell marker phenotype as Sca-1+CD45-CD34+CD31- [5]. But a grave drawback
of this method is that no marker or a pattern of markers has been known to prospectively
identify CSCs in many tumor types. Owning to the sophisticated anatomical structure and
variety of cell populations in the lung, the detection, identification and isolation of the lung
CSCs remained to be an almost unmanageable task.
One characteristic of stem cell is that the ability to exclude DNA dyes, such as Hoechst 33342
via the over-expression of ATP-binding cassette transporters (ABC transporters) on the cell
membrane. It makes the detecting of the stem cell possible. After the Hoechst 33342 staining,
stem cells extrude this dye and show a typical profile of low fluorescence in Hoechst red
versus Hoechst blue bivariate dot plots. These low Hoechst 33342 stained cells are named as
side population (SP) cells. This characteristic has enabled purification and characterization of
CSCs when carried out alone or in combination with stem cell surface markers.
The CSC hypothesis could have a fundamental influence on cancer therapy. CSCs have
shown significant substantial resistance to conventional chemotherapy in contrast to the
differentiated cancer cells. It is essential to design a complete therapy strategy first to reduce
or minimize proliferating cell mass and then to differentiate or eliminate CSCs, so that the
relapses of metastatic cancers could be prevented. Retinoic acid has been proved efficient to
induce differentiation and has been used in all-trans retinoic acid (ATRA)-based induction
therapy followed by chemotherapy for acute promyleocytic leukaemia. The therapy resulted
in 90% remission and in an over 70% cure rate [8]. To apply elimination therapy, further
research needs to be done in several directions, such as targeted therapies against self-renewal
signaling pathways or other specific characteristics of CSCs.

15
1.2 Side population phenotype
The SP phenotype was first discovered in murine hematopoietic stem cells (HSCs) via the dye
efflux test, which this fraction was found to be significantly enriched for long-term
repopulating hematopoietic stem cells [9]. After Hoechst 33342 and Rhodamine 123 staining,
a definite property of HSCs has shown relatively lower Hoechst red and Hoechst blue
fluorescence, which makes the cells appear aside of the bulk of positively stained cells and
gives the name of Side Population.
Hoechst 33342 is a cell permeable nucleic acid stain, which stoichometrically binds to AT-
rich regions of the minor groove of dsDNA (2-fold greater fluorescence than GC-rich region),
and its fluorescence intensity indexes DNA content and DNA damage, conformation and
discrimination of cell cycle stages, and chromatin state in cells by monitoring the emission
spectral shifts of the dye [10]. What enables the Hoechst 33342 to detect SP cells is that the
dye is effluxed by membrane efflux pumps of ABC transporter superfamily, including
multidrug resistance 1 (MDR1) and breast cancer resistance protein 1 (Bcrp1)/ABCG 1 [11,
12]. Over-expression of these ABC transporters is one characteristic of stem cells and thus the
cells, which are detected with lower fluorescence via pumping out the dyes during staining,
are isolated out as stem-cell-like cells. This phenomenon can be blocked by verapamil and the
SP fraction evaporates with the presence of verapamil in the Hoechst incubation. Since its
original discovery, SP cells have been identified in many other tissues, including skin, lung,
liver, heart, brain, kidney, testis, retina, mammary gland and skeletal muscle [13]. In
functional tests, these SP cells were identified to hold stem cell abilities and Hoechst 33342
staining has proved to be a valuable technique for the isolation of both hematopoietic and
organ-specific stem cells, especially in the absence of definitive cell-surface markers.
Transplantation activity enrichment of mouse bone marrow derived SP cells isolated by
Hoechst staining is similar with that of HSC cells purified by combination of cell-surface
stem cell markers, which vary from 1,000 to 3,000 fold [14].
Because of the connection and similarity between the normal tissue stem cell and cancer cell,
SP phenotype was detected in kinds of tumors as a sequence. SP cells have been identified in
a large variety of cancer cell lines, ranging from 0%-20% [13]. However up to date no data
has shown that the percentage of SP cells is an indication of tumorigenicity and
aggressiveness. Not surprisingly SP cells have been detected not only in cancer cell lines but
also in tumor tissues, such as primary neuroblastomas [15], the ascites of ovarian cancer [16],
and in mesenchymal neoplasms [17]. By immunodeficient mice xenografting experiments, SP
cells isolated from a wide variety of cancer cell lines and primary tumor tissues have a higher

16
enhanced capacity to initiate tumor formation compared to non-SP cells and the whole tumor
cell population, for instance SP cells from hepatocellular [18], lung [19], gastric [20] and
nasopharyngeal [21] cancer cell lines and also from primary mesenchymal tomurs [17]. These
findings suggest that non-SP cells are transiently amplifying bulk with rapid proliferation
ability but not with self-renew ability, which would enable them to sustain tumor initiation
during transplantation, whereas SP cells are the only ones who are able to self-renew and
differentiate.
Why SP cells hold the self-renewal and differentiating ability has been explained with the
phenomenon that they have increased expression of genes which are involved in the
regulation of stem cell function, such as genes from WNT/ß-catenin signaling pathway [20],
genes associated to cell cycling regulation (EXT1, INHBA, CCNT2, et al.) [22, 23], and
genes belonging to PI3K/AKT pathway [24]. But the expression of genes from Hh pathway
has not yet been investigated in SP cells, although the Hh pathway is believed to contribute to
stem cell maintenance and regulate stem cell differentiation.
1.3 Human ATP-binding cassette transporter superfamily
The ABC transporter superfamily is composed of membrane transport proteins that
translocate a diverse assortment of substrates, including ions, lipids, sterols, metabolic
products and drugs. They convert the energy from ATP hydrolysis into trans-phospholipid-
bilayer cellular activities to either import or export substrates unidirectionally. The ATP-
binding domains of specific structure, which conservatively present in their genes, have
characterized about 300 proteins in ABC transporter superfamily [25]. The importer-type
ABC transporters have been found in prokaryotes, whereas the exporters are ubiquitously
expressed in both prokaryotes and eukaryotes. In eukaryotes particular family members are
located in the plasma membranes, endoplasmic reticulum and other intracellular membranes.
Human ABC transporters are divided into seven distinct subfamilies according to domain
organization, named by the numbers and combination of transmembrane domain (TMD) and
ATP-binding domains (also called nucleotide-binding domain, NBD), which are the
conserved domains of this protein family with 30-40% homology [26]. The NBDs contains
two sub-domains, RecA-like domain and helical domain. In all the sequence motifs of NBDs,
P-loops in RecA-like domain and LSGGQ motif in helical domain show the most importance.
The architecture of full transporters includes two TMDs and two NBDs and the two NBDs
assemble in head-to-tail arrangement with the P-loops and LSGGQ motif exposing at a

17
common interface [27]. So according to this structure, two ATP binding and hydrolysis sites
are generated. So in each transport cycle, two molecules of ATP are consumed. During
binding of ATP, the gap between the NBDs is pulled together by the coupling helices. As a
consequence there is a cycle of conformational changes of the TMDs, which alternate
exposure of these binding sites to both sides of the membrane and open a gate to allow
substrates to travel into the cytoplasm or to escape out to the periplasm [28].
Some ABC-transporters affect the drug penetration process through the membrane and the
accumulation of intracellular drug effective concentration, which causes the multidrug
resistance (MDR) during tumor therapy. MDR is defined as a protection of the cells against
numerous drugs, with different chemical structures and by different intracellular functional
mechanisms, like Anthracyclines (doxorubicin, daunorubicin, et al.), Epipodophyllotoxins
(etoposide, teniposide, et al.), Vinca alkaloids (vincristine, vinblastine, et al.), Taxanes
(paclitaxel, docetaxel, et al.), Kinase inhibitors (imatinib, flavopyridol, et al.) and other
preparation classes. MDR turns into an extraordinary limitation to cancer chemotherapy. The
ABC transporters ABCB1, ABCC1, ABCC2, ABCC3, ABCC4, ABCC5 and ABCG2 have
been discovered to be implicated in MDR. So far ABCB1 (also known as Pgp) has been found
to transport the largest number of drugs. The same drug can be a substrate of different ABC
transporters and while ABC transporters have distinct substrate specificities [29, 30]. Using
microchips to scan in order to compare transcription of the ABC transporter related genes in
antitumor drug sensitive cell lines with those in resistant cell lines, 28 ABC transporters were
defined to have a protection function against some drugs or whole antitumor preparation class
[30], but actually not all of them were declared as MDR related transporters. These
discoveries indicate that in ABC transporters there is a switch to function activity from their
conventional physiological routine to protective function against the damage from antitumor
drugs.
Stem cells and cancer stem cells have been ascertained to hyperexpress several ABC-
transporters. Cancer stem cells in many different tumors, both leukemic and solid, have
shown the SP phenomenon and the fluorescent dyes (Hoechst 33342 and Rhodamine 123) are
transported by ABC-transporters, which can be efficiently inhibited by verapamil [31].
Verapamil is a L-type calcium channel inhibitor, which is often found to antagonize ABC
transporter mediated MDR, and is widely used as an ABC transporter inhibitor, however the
relationship between intracellular calcium homeostasis and ABC transporters still remains
unknown [32]. The functions of ABC-transporters in both normal and cancer stem cells
remain poorly defined. It is postulated that ABC transporters protect stem cells from

18
damaging substances and regulate the stem cell self-renewal and differentiation. For instance,
the bone marrow cells of ABCG2 gene knockout mice, which obtained increased sensitivity
to toxic agents [12] and the ABC transporter Rh T from Dictyostelium can efflux
differentiation factors from the cells to regulate cell fate determination [33]. In addition to the
protective function, ABC transporters have been implicated in resistance to apoptosis, which
might contribute to maintaining the stem cells and in a cancer case to cause therapy failure
and higher recrudescence possibility. Pgp can specifically inhibit Fas-induced caspase-3
activation and apoptosis via inhibiting caspase-8 activation at the death inducing signal
complex (DISC) following FAS ligation [34].
1.4 Hedgehog pathway and Hedgehog pathway inhibitors
The Hedgehog (Hh) pathway is an embryonic signaling cascade conserved from fly to human.
The pathway was named after its ligand Hedgehog, an intercellular signaling molecule, which
was first discovered and identified by screening genetic mutation occurring in Drosophila
larva [35]. In 1970s, Christiane Nüsslein-Volhard and Eric F. Wiechaus attempted to isolate
gene mutations which direct the segmented anterior-posterior body axis of the fly [36]. They
developed the Saturation mutagenesis technique, which is an in vitro mutagenesis strategy
wherein one tries to generate all (or most) possible mutations within a narrow region of a gene.
It enabled them to discovery a group of genes involved in the development of body
segmentation. Thanks to this work, in 1995 the Nobel Prize in Physiology or Medicine was
awarded jointly to Edward B. Lewis, Christiane Nüsslein-Volhard and Eric F. Wieschaus "for
their discoveries concerning the genetic control of early embryonic development". The
Drosophila Hh gene was identified then as a gene contributing to anterior and posterior body
patterning of individual body segments. The mutations of the Hh segment polarity gene
resulted in a loss of anterior-posterior polarity in the larval cuticle, disrupting the cuticular
denticle pattern as well as adult appendages as leg and antennae [36]. The mutant larva
exhibits a continuous solid denticle lawn instead of denticle belts normally seen in larval
parasegment. Some Hh mutants incur peculiarly shaped embryos, which are unusually short
and stubby compared with the wild type. The stubby and hirsute appearance of the larva
resembled a hedgehog and inspired the scientists with the name ‘Hedgehog’.
In the absence of Hh ligand, Patched acts constitutively upon Smoothened (SMO) to inhibit
its activity. It is resultant that unrestrained processing of GLI family zinc finger 1 (Gli-1)
transcription factors by the Cos2/Sufu/Fu complex, which results in formation of truncated,
19
transcriptionally repressive Gli proteins and silence Hh signaling. The presence of Hh ligand
actuates the pathway via inhibiting Patched by ligand binding, resulting in the activation of
SMO. Activated SMO inhibits the processing complex and sequentially it stabilizes the full-
length Gli proteins, which act as transcriptional activators. Active Gli proteins induce the
expression of target genes, comprising Gli-1 and Patched.
1.4.1 Structure and function of the Hh pathway components
Shh, Dhh, Ihh
Three mammalian orthologues, Sonic (Shh), Desert (Dhh) and Indian (Ihh) Hhs, are identified
as Hh genes, in which Shh is the best examined. Dhh is most closely related to Drosophila Hh.
Ihh and Shh have more in common with each other and represent a more recent gene
duplication [37]. The three mammalian Hhs mostly act as morphogen in a concentration
dependent manner activating distinct cell fates within a target tissue, or as inducing factors
controlling the form of a developing organ. Nevertheless they specialize in different functions.
Shh is universally expressed in many mammalian tissues. Shh transcripts have been found in
the notochord, ventral neural plate, the zone of polarizing activity of the limb buds, the distal
elements of the limbs, pituitary gland, many gut-derived organs, the heart, the lungs, the
prostate gland and so on. Starting from the early embryogenesis, Shh controls the left-right
and dorsoventral axes patterning in the embryo, and later the development of the many organs,
the formation of olfactory pathway, and the smooth muscle regulation Dhh expression is
mainly restricted to the gonads, including Sertoli cells in the testes and granula cells in the
ovaries, and Dhh functions also in the formation of neural sheaths. Ihh expression was
detected in the primitive endoderm and prehypertrophic chondrocytes in the growth plates
during endochondral bone formation [35, 37]. Studies have shown that the transcription of
Shh in different tissues is independently controlled by the action of multiple enhancer
elements, including Shh floor plate enhancers (SEPE 1, 2), and Shh brain enhancers (SBE 1-
4), although very little is known about the specific transcription factors that control their
activity [35].
The Hh ligands are diffusible morphogens synthesized as 45-kDa precursor proteins and
undergo autocatalytic cleavage to yield a 25-kDa C-terminal catalytic domain (SHH-C) and a
19-kDa N-terminal signaling domain (SHH-N), which heralds the activation of Hh pathway.
During the cleavage process, an esther-linked cholesterol moiety (CHOL) molecule is added

20
to the carboxyl end of SHH-N and the catalytic portion then diffuses away. Following the
CHOL adduct, palmitoylation (PAL) of the SHH-N cystein results in the final processed
molecular, which functions in trafficking, secretion and receptor interaction of the ligand [38,
39]. Shh can signal in an autocrine pattern, affecting the cells in which it is produced and
activating Hh pathway [36]. Paracrine pattern of Hh activation is mediated by Dispatched
where the participation of Dispatched protein is required in secretion and consequent
paracrine Hh signaling [40]. The ligands are processed to become bilipidated and then
multimerize, which allows them to leave the signaling cell via Dispatched 1 and being
transported via glypicans and megalin to the responding cells. In the responding cells, the
bilipidated Shh (PAL-SHH-CHOL) becomes the ligand of Patched [41].
Patched
Three Patched homologs are found in human, Ptch 1, Ptch2 and Dispatched. Ptch 1 is the
major Hh receptor in embryonic developments [42]. The human PTCH 1 gene is recognized
as a tumor suppressor gene, stopping cell division in the absence of SHH ligand and
permitting cell division when binding occurs, and it maps to 9q22.3 encoding a 1,500 amino
acid glycoprotein, which has two large extracellular loops, amino- and carboxyl-terminal
intracellular regions, and 12-pass transmembrane domains. Chen et al. have discovered that
Ptch 1 has dual roles in sequestering and transducing Hh [43]. The extracellular loops are Hh
ligands binding sites. When the second loop, especially essential for ligand binding, is deleted
in a PTCH 1 mutation, Hh binding can not take place [44], while the repression of SMO is
unaltered, which is the function of the C-terminal [45]. The human PTCH 2 gene maps to
1p32–p34 and encodes a 1,204 amino acid protein. PTCH 2 has a 54% overall identity to
PTCH1, which gives the PTCH 2 protein the structure of 12 transmembrane domains and two
large extracellular loops as well. However, there are dissimilar amino- and carboxyl-termini,
compared with those of PTCH 1, including an absence of 150 amino acid residues in the C-
terminal domain (CTD) [46]. All three Hh ligands bind to Ptch 1 and Ptch 2 with similar
affinity and the receptors cannot distinguish the ligands, however Ptch 1 and Ptch 2 differ in
the expression pattern. For instance Ptch 2 is expressed at a significant higher level in tests,
which is the reason for the deserting of the Hh signaling [47]. The human DISPATCHED1
gene maps to 1q42 and encodes a 1,401 amino acid protein, which shares structure similarity
with Ptch 1 and Ptch 2 [46]. In the ligand binding process, Dispatched is not required for lipid
attachment to Hh, but releases Cholesterol-modified Hh from its tether to the plasma

21
membrane of the signaling cell and permits transport to the responding cell [48], and
palmitoylation is required for the production of the soluble multimeric Hh protein complex
and long range signaling [49]. In Ptch 1, Ptch 2 and Dispatched, 5 of the 12-pass
transmembrane domains are named as sterol sensing domain (SSD), consisting of
approximately 180 amino acids. SSD has the properties, such as rapid trafficking between
organelles, cargo transport, and modification of their activity by sterol and/or lipoprotein
concentrations [50]. SSD is essential for suppression of SMO activity, since Patched regulates
SMO by removing oxysterols, which is created by 7-dehydrocholesterol reductase, from SMO
as a sterol pump and mutations in SSD can turn off the pump and allow the accumulation of
oxysterols around SMO [51].
Smoothened
SMO is consisted of a long N-terminal extracellular amino-terminal region, 7 hydrophobic
transmembrane α helices domains and an intracellular carboxyl-terminal region. In SHH-
secreting cells, newly made SHH protein undergoes auto-processing and lipid modification,
which result in the secretion of a fully active SHH-N of 19 kDa modified by a palmitoyl
group and a cholesterol in its N- and C-terminal extremities, respectively. Hence SMO
transduces the signal from Hh ligand in a concentration-dependent pattern. Its function and
regulation is complex. Although as a central factor in Hh signaling pathway, many questions
are still pertaining to the regulation, and the function, while the exact downstream signal
transduction remain unclear as well. SMO is most closely related to the Frizzled (Fz) family
of GPCRs for Wnt signaling, since high homology is found within the extracellular N-
terminal cysteine-rich domains (CRD), although the clear function of CRD has not been
found yet [52]. Recent finding have provided evidence that SMO acts as a G-protein-coupled
receptor (GPCR) according to the similarities in domain organization, regulation mechanism
by small molecules, and phosphorylation via activation Phosphorylation of SMO, like many
other GPCRs, controls the switch between on/off signaling status. In this process, GPCR
kinase GRK2 plays a positive role and blocking its function with small-molecule inhibitors
blocks Shh-induced SMO activation of Hh target genes [53].
Since Hh signaling activates when Patched is repressed by Hh ligands, freeing SMO for
downstream signaling, Patched and SMO have no physical interaction in transducing Hh
signals [54]. The mechanism of how Patched inhibits SMO has not yet been clearly explained,
however it has been speculated that Patched may inhibit SMO via intermediate small

22
molecule, for instance several synthetic molecules as cyclopamine, a Hh antagonist [55], and
purmophamine, a Hh agonist [56] can modulate the activity of SMO. Patched controls the
level of 3β-hydroxysteroids, one form of pro-vitamin D3, so when Patched induces the
secretion of Vitamin D3, it represses SMO activity [57]. Several oxysterols, downstream of
Vitamin D3 in the cholesterol biosynthetic pathway, including 25-hydroxycholesterols, can
act as potent activators of Shh signaling by activating SMO [51]. So with no sterols, SMO is
inactive, whereas with sterols, SMO is active. When sterols combine with Hh antagonist
cyclopamine or GDC-0449, which inhibits SMO with more potency and better
pharmaceutical properties [58], instead of Hh, SMO is inactive.
GLI family zinc fingers
Three GLI genes encode Gli transcription factors, and they share five highly conserved
tandem C2H2 zinc fingers and a conservative histidine-cysteine linker sequence between zinc
fingers [59]. In the three GLI genes identified, GLI 1 has two isoforms and encodes a 1,106
amino acid protein (maps to 12q13); GLI 2 has three different spliced exons and encodes 810,
829, 1,241, and 1,258 amino acid proteins (maps to 2q14); GLI 3, which is the longest GLI
gene and followed by GLI 2 and GLI 1, has one isoform and encodes 1,595 amino acid
protein (maps to 7q13) [60]. Gli 1 and Gli 2 have only activator form, whereas Gli 3 has both
activator and repressor forms. The balance between the activator and repressor forms of the
Glis results in the expression of target genes [61].
According to the cilium-based Hh signaling mechanisms [62], hypothesized that the
subcellular localization of the Hh pathway components is the major regulator of its activity, in
the presence of Hh binding to Patched, Gli proteins in activator form are switched from the
anterograde cilium tip to the retrograde side and activate the downstream genes. Since Gli 3
has both activator and repressor forms, in the absence of Hh binding, Gli 3 locating on the
anterograde tip of the cilium is cleaved into transcriptional repressor form by limited
proteasome-mediated degradation and loses the downstream target genes transmission ability
[63]. The target genes are widely ranged since Hh signaling affects the whole process of
vertebrate development, including BMP 4, FGF 4, VEGF, Myf5, Ptch 1, Ptch 2, Nkx 2.2, Nkx
2.1, Rab 34, Pax 6, Pax 7, Pax 9, Jagged 1, genes involved in cell growth and division as N-
Myc and many other transcription factors [64].

23
Bmi-1
The B-cell-specific Moloney murine leukemia virus integration site 1 (Bmi-1) gene localizes
on human chromosome 10p11.23 and encodes a 36.9-kDa nuclear protein consisting of 326
amino acids. The Bmi-1 protein contains a conserved RING finger domain in its N-terminal
end, which is essential for its ability to modulate cell proliferation, and a central helix-turn-
helix-turn-helix-turn motif (H-T-H-T), which is required for inducing telomerase activity and
immortalization of human epithelial cells [65-67]. Bmi-1 is one of the core members of the
polycomb group proteins, which act as epigenetic gene silencers with essential roles
associated with organism development through the formation of a minimum of two
multimeric complexes. As a key component of PRC1 complex, it is an epigenetic chromatin
modifier and was initially identified as an oncogene that cooperates with c-Myc in retrovirus
induced lymphomagenesis in mice [68, 69]. The oncogenic potential of Bmi-1 is because of
the negative regulation of the Ink4a/Arf site that encodes p16INK4a and p19ARF, whose function
is to suppress proliferation and promote apoptosis [70, 71].
Since Ink4a/Arf locus is a frequent target for mutations, deletions, and epigenetic silencing in
a wide spectrum of human tumors, the amplification of Bmi-1 has been shown in some
hematological disorders, such as mantle cell and non-Hodgkin lymphomas, and notably Bmi-
1 is also overexpressed in solid tumors such as non-small cell lung cancer (NSCLC) and
medulloblastoma [72-76]. Bmi-1 is implicated in the control of tissue stem cells and the
tumors to which they may give rise. Bmi-1-deficient animal model reveals the presence of
defects in hematopoiesis and the central and peripheral nervous systems, which shows that
Bmi-1 is required for self-renewal of hematopoietic and neural stem cells [77, 78]. It has been
shown also that K-ras-induced lung tumorigenesis is impaired in Bmi-1-null animals and
Bmi-1 is necessary for BASC proliferation and self-renewal in vivo and in vitro [79]. Bmi-1
has also been found to mediate the Hh pathway regulation of the self-renewal of normal and
malignant human mammary stem cells [80].
1.4.2 Hedghog pathway and cancer
During the mammalian development, the Hh pathway is highly active and regulates the
proliferation, migration and differentiation of target cells in a spatial, temporal, and
concentration dependent manner, especially within the neural tube and skeleton. But
subsequently the Hh pathway is silenced in most adult tissues. During tissue homeostasis and
24
repair following an injury in some postnatal tissues, like the lung and central nervous system,
continued Hh signaling is still detectable [81-83].
The identification of PTCH 1 mutations in patients with basal cell nevus syndrome and Gorlin
syndrome at first implicated a role of Hh signaling pathway in cancer, since these patients
have significantly higher basic cell carcinoma (BCC), medulloblastoma and
rhabdomyosarcoma predisposition [45, 84]. Genetically altered expression of other pathway
components were also detected, such as SUFU mutations in medulloblastoma, GLI 1 over
expression in glioblastoma, GLI 1 and GLI 3 mutations in pancreatic adenocarcinoma [62, 85,
86]. That aberrant Hh signaling can induce cancers has been proofed by transgenic mouse
studies, which definitively showed that conditional loss of function of PATCHED or gain
function of SMO or GLIs can recapitulate medulloblastoma and BCC [87]. At the same time,
some tumors display aberrant Hh pathway activity as a response to over signal from the Hh
pathway ligand, including multiple myeloma, pancreatic carcinoma, glioma, prostate
carcinoma, and lymphoma. Due to these ligand-dependent carcinomas, several hypothesis of
the pathway activation mode have been made. In many tumors, like small cell lung (SCLC),
pancreatic, colon, metastatic prostate cancers, glioblastoma and melanomas, pathogenic Hh
activity has been described in an autocrine and/or juxacrine mode, in which tumor cells both
produce and react to Hh ligands [83, 88-90].
Pathologic Hh signaling may affect also tumor microenvironment in a paracrine pattern,
similar with Hh signaling in embryonic development. It has been reported during pancreatic
carcinogenesis Hh signaling is restricted to the stromal compartment [40]. Recently it has
been found that in B-cell lymphomas and multiple myeloma, Hh ligands are mainly produced
by stroma cells derived from bone marrow, lymphnode, or spleen, but not by tumor cells [91].
An alternative mode of paracrine has been described as that tumor cells produce Hh ligands
activating the Hh signaling in the nonmalignant stromal and endothelial cells, and as a
sequence these cells produce some factors within the microenvironment to support tumor cell
growth ultimately and survival as well as angiogenesis [92]. Yauch RL et al. reported in a
study examining human pancreatic and colon primary tumors and cell lines grown as
xenograft in mice. The expression of Hh ligand was associated with canonical pathway
activity in tumor infiltrating stromal cells from the murine host, which indicated that tumor
derived Hh ligand first induced pathway activity in stromal cells and in return the stromal
cells influenced the tumor growth [93]. However the exact factors generated by stromal cells
remain unknown, Hh pathway activation in the stromal cells may induce the secretion of
soluble factors such as insulin growth factor 2 (IGF 2) and vascular endothelial growth factor

25
(VEGF), including VEGF-A, VEGF-B, VEGF-C and Ang2, which affect tumor cell
proliferation as well as survival, and promote coronary angiogenesis [94-96]. Different
signaling mode in specific tumors might be also distinct clinical and biological factors such as
cancer stage or genetic lesions were suggested, due to the conflicting data from different
experimental systems. So disease specific information will be necessary to optimize the
clinical use of Hh pathway inhibitors. Hh pathway was discovered to be a potent regulator of
angiogenesis in SCLC in a ligand dependent pattern in mouse model and cancer cell lines but
whether autocrine or paracrine activities exist is not yet reported.
Emerged data from many human tumors suggested that Hh signaling regulates CSCs, which
have been functionally defined by self-renewal capacity and the ability to proliferate and
maintain the malignant growth of the tumor. An alteration in the Hh pathway, either by mis-
expression of the pathway components or by changes in the expression of other cellular
components that interfere with the Hh signalling system, may trigger the development of
several types of cancer via generation of CSCs.
During tumor formation, Hh signaling has been found active in CSCs in many tumors,
including multiple myeloma, glioblastoma, breast cancer, pancreatic adenocarcinoma, and
chronic myeloid leukemia (CML) [97, 98], and affects CSC self-renewal, expansion,
tumorigenic potential, and differentiation. In multiple myeloma (MM), a malignancy with a
well-defined stem cell compartment, the subset of MM cells that manifests Hh pathway
activity is markedly concentrated within CSCs. The Hh ligand promotes expansion of MM
stem cells without differentiation, whereas the Hh pathway blockade, via cyclopamine or the
ligand-neutralizing antibody 5E1, markedly inhibits clonal expansion accompanied by
terminal differentiation of purified MM stem cells [99]. In breast cancer, both in vitro
cultivation and a xenograft mouse in vivo model were used to examine the role of Hh
signaling and Bmi-1, which is a central regulator of self-renewal in normal stem cells, in
regulating self-renewal of normal and malignant human mammary stem cells [80]. PTCH 1,
GLI 1, and GLI 2 are highly expressed in human breast CSCs characterized as CD44+CD24-
/lowLin- and with cyclopamine or small interfering RNA (siRNA) against GLI 1, and GLI 2
changed the expression of BMI-1.
Further more, during tumor progression and metastasis, Hh may also play a critical role. In
colon cancer derived from primary clinical specimens, CSCs exhibit active Hh signaling.
Further Hh signaling over activity was also detected in metastatic cells, along with the
evidence of relatively higher expression of GLI 1, GLI 2, and PTCH 1 [100]. Inhibition of Hh
pathway activity with cyclopamine or siRNA against SMO, GLI 1 and GLI 2, or over-
26
expression of the repressor form of GLI 3 reduced tumor cell proliferation and induced
apoptosis. Moreover, cyclopamine reduced tumor regrowth in vivo and small hairpin RNA
(shRNA) directed against SMO eliminated the formation of metastatic disease. In pancreatic
cancer cell lines, Hh inhibition with cyloplamine resulted in down-regulation of SNAIL and
up-regulation of E-cadherin, consistent with inhibition of epithelial-to-mesenchymal
transition. Cylopamine has been found to inhibit metastatic spread in an orthotopic xenograft
model [101].
1.4.3 Targeting Hedgehog signaling in cancer therapy
Since many human cancers have been shown to require the activity of Hh pathway and the
regulation of CSC, which presents high resistance to classical treatments, is also Hh pathway
dependent, the proteins of the Hh pathway are very promising targets for antitumor therapy.
In mammals, the Hh pathway is not completely understood and all the components of this
pathway have not been identified yet. The membrane receptors of the pathway, Patched and
SMO are mutated and/or deregulated in cancer cells, resulting in the abnormal activation of
the pathway and development of cancers. This has prompted a general interest in targeting Hh
pathway for cancer therapy and many Hh pathway small molecule modulators have been
developed as anti-tumor compounds. There are two major divisions in these compounds as the
SMO inhibitors and the Gli antagonists. Both natural compounds and synthetic molecules that
target SMO and Gli are investigated and utilized in cancer therapy.
Several Hh inhibitors were developed to block Hh pathway activity on the level of the
activating receptor SMO. Cyclopamine (11-deoxojervine) is one of steroidal jerveratrum
alkaloids isolated from the corn lily Veratrum californicum, which was discovered over 30
years ago as a natural Hh pathway inhibitor [102, 103]. It was identified to be responsible for
cyclopia, anophtalmia and abnormalities of midline development observed in the livestock
that ate corn lily Veratrum californicum by suppressing the Hh genes. Cyclopamine inhibits
the Hh pathway by influencing the balance between the active and inactive forms of SMO.
And recent evidence suggests that cyclopamine disturbs SMO trafficking and promotes its
accumulation in the primary cilium [104, 105]. It has been evaluated in vivo to inhibit tumor
growth in human cancers of orthotopic glioma [89], melanoma [106], and colon [100],
xenograft models of pancreas [101] and prostate [90]. But since the IP issues of cyclopamine
are largely mute, it is not embarked on clinical tests although several derivatives have been
made.

27
GDC-0449 is the first systemic SMO-inhibitor entering clinical trials. It was discovered by
highthroughput screening of a library of small-molecule compounds and subsequent
optimization through medicinal chemistry from HhAntag691 with improved solubility and
absorption properties [107]. GDC-0449 is a selective Hh pathway inhibitor with greater
potency and more favourable pharmaceutical properties than cyclopamine. It has antitumor
activity in medulloblastoma mouse model and in xenograft models of primary human tumor
cells [108]. It was successfully tested in a phase-I clinical trial demonstrating good
pharmacodynamic (PD) and pharmacokinetic (PK) properties and showing objective response
and clinical benefit in the patients with basal cell carcinoma, although not all the patients
responded. Clinical trials have been carried out by different institutes and companies (Phase-I:
NCT00822458; Phase-II: NCT00636610, NCT00739661, NCT00833417, NCT00887159)
[109]. In 2008 LoRusso and coworkers presented the phase-I results of 19 patients with solid
tumors. The patients were enrolled at 3 different dose levels of GDC-0449, 150, 270, 540 mg,
with a dose schedule as day 1 followed by a 2nd dose at day 8. The same maximal drug
concentration after a single dose has been found in the 270 and 540 mg cohorts. The half-life
of GDC-0449 was between 10-14 days. Gli1 was down modulated >2-fold in skin biopsies
from 11 of 14 patients analyzed [110]. And in 2010 the safety, preliminary efficacy, and PK
of GDC-0449 were assessed in a phase I trial for patients with locally advanced or metastatic
BCC by Genentech and Genomics Research Institute and Scottsdale Healthcare. 33 patients
with locally advanced or metastatic BCC received GDC-0449 orally at one of 150, 270, 540
mg for a median duration of 9.8 months. Of those treated as best response, 2 patients had a
complete response, 16 patients had a partial response, 11 patients had stable disease, and 4
patients had progress diseases. GDC-0449 was generally well tolerated, with 8 reversible
grade III events (4 fatigue, 2 hyponatremia, 1 muscle spasm, 1 atrial fibrillation) and no grade
IV events assessed to be related to study drug. Because of the encouraging tolerability and
efficacy data observed in the phase I study, a phase II, open-label, single-arm global trial of
GDC-0449 in advanced BCC is currently enrolling patients [111, 112].
Despite the encouraging and promising results of the SMO antagonists, some alternative
means to inhibit Hh pathway activity has been also developed. For instance, the downstream
of SMO genetic activities can be detected in several human cancers, such as mutations of the
negative pathway regulating genes SUFU or the amplifications in GLIs [113]. And further
more, Gli-1 can be activated in a SMO-independent manner by transforming events, such as
mutant KRAS in pancreatic cancer and EWS-FLI in Ewing sarcoma [114].

28
1.5 Calcium signaling
1.5.1 Calcium channels and pumps
The calcium ion (Ca2+) is a ubiquitous cellular signal, which regulates various cellular
processes by activating or inhibiting cellular signalling pathways and Ca2+-regulated proteins,
such as gene transcription, muscle contraction, synaptic transmission, cell proliferation and
apoptosis [115]. Cells have to shape Ca2+ signals in the dimensions of space, time and
amplitude in order to carry out the Ca2+ controlled cell biology activities. Ca2+ channels,
pumps and exchangers control the complex and tight regulation of Ca2+ homeostasis, which
differ in their cellular distribution and their mechanism of transport. The Ca2+ ‘on’
mechanisms include the plasma membrane (PM) channels, which regulate the Ca2+ supply
from extracellular space, the endoplasmic reticulum (ER) and sarcoplasmic reticulum (SR)
channels [116]. An equally set of ‘off’ to remove Ca2+ from the cytoplasm includes Ca2+
ATPases on the PM and ER/SR, and additionally to exchangers that utilize gradients of ions
to provide the energy to transport Ca2+ out of the cell, such as Na+/Ca2+ exchange.
Mitochondria also play an important role in the regulation of cytoplasm Ca2+. These Ca2+
stores have a low affinity but high-capacity rapid Ca2+ uniporter that can significantly reduce
cytoplasmic Ca2+ transients and diminish cellular responses. A strict equilibrium between the
‘on’ and ‘off’ mechanisms in the cells keeps Ca2+ under regulation within cellular
compartments to achieve the sensitive control of cell signaling pathways that can precisely
respond to many stimuli. Resting cytoplasm free Ca2+ ([Ca2+]c) is maintained at a low level
(∼100nM), with a much higher extracellular Ca2+ concentration of ∼1.2 mM [117]. There are
mainly three types of Ca2+ entry channels: (1) store-operated Ca2+ channels (SOCCs), which
are activated in response to depletion of the intracellular Ca2+ stores, either by physiological
Ca2+ -mobilising messengers or pharmacological agents. SOCCs are the most ubiquitous PM
Ca2+ channels. The mechanisms of how the SOCCs sense the status of the intracellular pool
are unknown. (2) voltage-operated Ca2+ channels (VOCCs), which are largely employed by
excitable cell types such as muscle and neuronal cells, where they are activated by
depolarisation of the PM. (3) receptor-operated Ca2+ channels (ROCCs), which comprise a
range of structurally and functionally diverse channels. They are particularly prevalent on
secretory cells and at nerve terminals. ROCCs are activated by the binding of an agonist to the
extracellular domain of the channel [118].
29
Within the cell itself there is a Ca2+ concentration gradient between the cytoplasm and the
Ca2+ stores. The Ca2+ stores are enriched with Ca2+ binding proteins, such as calsequestrin and
calreticulin. Ca2+ can be released from the stores by the generation of inositol 1, 4, 5-
trisphosphate (IP3) [119]. IP3 is highly mobile in the cytoplasm and diffuses into the cell
interior where it encounters specific IP3 receptors (IP3Rs) on ER/SR. The binding of IP3
changes the conformation of IP3Rs so that an integral channel is opened, thus allowing the
Ca2+ in the ER/SR to enter the cytoplasm. IP3Rs are composed of four subunits (∼1200 kDa),
encoded by three different genes [120]. The opening of IP3Rs is enhanced by the modest
increase of Ca2+ concentration (0.5-1 µM) whereas higher Ca2+ concentration (> 1 µM)
inhibits the opening. Ryanodine receptors (RyRs) are structurally and functionally analogous
to IP3Rs, with an approximately twice the conductance and molecular mass of IP3R [121].
RyRs are generally actived by the increase of Ca2+ of 1-10 µM and inhibited by higher Ca2+
concentration of > 10 µM. They are largely present in excitable cell types [122]. The opening
of these channels has been shown to modulated by numerous factors, including
phosphorylation, adenine nucleotides, thiol reactive compounds, pH level and the Ca2+ load of
ER/SR [116]. Other than the Ca2+ channels on ER/SR, there are also Ca2+ ATPase pumps
actively transport Ca2+ against a concentration gradient, such as the sarcoplasmic/endoplasmic
reticulum Ca2+ ATPases (SERCAs) pumping Ca2+ into the ER.
1.5.2 Calcium and cancer
Since Ca2+ signalling can affect pathways regulating proliferation and apoptosis, alterations in
Ca2+ channels and pumps could have a causal and promoting role in cancer. The location,
degree and temporal aspects of changes in [Ca2+]c regulate the pathways relating to
tumorigenesis.
Ca2+ is implicated in cellular motility including neurite outgrowth and contraction [115, 123].
Ca2+ is also a key regulator of signalling pathway important in angiogenesis, since some
angiogenic stimuli, such as vascular endothelial growth factor, can increase [Ca2+]c by
mobilizing Ca2+ release from the internal Ca2+ stores [124]. Ca2+ can influence genomic
stability and cell survival, for example Ca2+ is a modulator of poly (ADP-ribose) polymerase-
1 (PARP1) activity, which alters cellular metabolism and DNA repair [125]. Ca2+ is a key
regulator of the cell cycle, and hence proliferation, through various different pathways
including Ras signalling [126]. Ca2+ signalling is implicated in the cancer cell differentiation
process either through the extracellular Ca2+-sensing receptor and/or through changes in

30
intracellular Ca2+ [127]. Ca2+ can modulate cell-cycle regulators directly, for example by
activating the transcription of the genes crucial in the G0-G1 transition [128] and for the
phosphorylation of retinoblastoma protein in late G1 phase [129]. Ca2+ can also indirectly
regulate the subcellular localization of the key tumorigenic proteins. Minaguchi et al. found
out that the nuclear localization of PTEN is regulated by Ca2+ through a tyrosil
phosphorylation-independent conformational modification in major vault protein [128]. The
accumulation of excessive Ca2+ has often been found to link to apoptosis and necrosis by the
activation of ER/SR and mitochondrial membrane permeabilization [130]. A reduction of ER
Ca2+ content is associated with resistance to apoptosis [120].
Alternations in Ca2+ channels and pumps are detected in many cancers. SOCCs as IP3R2 and
IP3R3 were found over expressed in non-small cell lung cancer and gastric cancer
respectively [131, 132]. RyR1 was down regulated in thyoma [133]. VOCCs as T-typeα10, T-
typeα11 and CACNA2D2, which is a regulatory subunit of VOCC, were down regulated in
colorectal cancer [134], colon carcinoma and adenomas [135], and lung cancers [136]. Ca2+
pumps SERCA has also been found to change expression or activity in different cancers.
Down-regulation of SERCA 2 was discovered in oral cancer [137], colon cancer [138],
thyroid cancer [139] and lung cancer [138] but up-regulation in colorectal cancer [140].
SERCA 3 was found down regulated in colon cancer [141]. Changes in the expression or
activity of PMCA pumps and transient receptor potential channels, such as TRPM8, TRPM1,
TRPV1, TRP6, and TRPC6, were also found in several of cancers [119].
1.5.3 Target calcium in cancer
Ca2+ channels and pumps with altered expression in cancer might represent potential
biomarkers of disease. When cancer cells undergo differentiation in tumorigenic process,
changes in the expression of Ca2+ pumps can be detected in many cancer cell lines. Changes
in the ER Ca2+ pump SERCA3 protein expression is either reduced or lost in colon
carcinomas compared with normal tissue, consistent with a loss of differentiation in cancer
cells [142]. The increased apoptotic resistance of the malignant neuroendocrine differentiated
prostate cells is due to a general alteration in Ca2+ homeostasis in which the reduction in
SERCA2b has an important role. The reduced ER Ca2+ content partially because of the
decrease of SERCA2b expression is a probable mechanism for apoptotic resistance [143].
These Ca2+ channels and pumps can be used as prognostic indicators or can guide treatment
by the means of techniques such as microarrays in cancers.

31
Ca2+ channels and pumps with altered expression offer the potential not only as biomarker for
cancer diagnosis but also anticancer therapeutic targets. First, the significance of increased
expression of Ca2+ channels and pumps in cancer is directly related to the Ca2+ regulated
tumorigenic pathways. Secondly, many of the Ca2+ channels and pumps with altered
expression in cancer have a highly restricted tissue distribution, unlike many of the ubiquitous
potential anticancer drug targets such as cell cycle regulator. Therapies based on a target with
a limited tissue distribution are less associated with generalized toxicity, which is a factor
limiting clinical use for agents that have widespread expression. For instance, PMCA2 is
upregulated in human breast cancer cell lines, whereas its expression is restricted normally to
the central nervous system [144]. Thirdly, the availability of pharmacological Ca2+ channels
and pumps inhibitors or activators makes it as an outstanding feature of Ca2+ channels or
pumps as cancer targets. For instance heparin, dantrolene and CPA are inhibitors for IP3R,
RyR and SERCA, while adenophostin A and suramin are activators for IP3R and RyR
(SERCA activator has not been discovered) [145-147]. So modulating the activity of Ca2+
channels and pumps that are aberrantly expressed in cancer cells and cancer stem cells
efficiently might sufficiently interrupt Ca2+ homeostasis to target cancer cells with restricted
tissue distribution. Chemogenomic approached will drive the development of the Ca2+
homeostasis regulating pharmacopoeias for the known cancer related Ca2+ channels and
pumps, at the same time the research should continue for the identification of other Ca2+
channels, pumps or exchangers that may serve as anticancer targets as well as specific
biomarkers for cancer prognosis and treatment.
32
2 METHODS AND MATERIALS
2.1 Biological material
Tumor cell lines
• HCC-78: DSMZ no. ACC 563, human non-small cell lung carcinoma. According to
the histological classification of the original tumor, HCC is defined as
adenocarcinoma (Virmani et. al., 1998).
• H-1339: DSMZ no. ACC 506, human small cell lung carcinoma (Phelps et. al., 1996).
2.2 Lab material and equipment
2.2.1 Laboratory consumables
• Culture flasks: 25 cm2, 2 µm vent cap, Cat. 430639, Corning Incorporated, NY, US;
75 cm2 and 175 cm2, 2 µm vent cap, Cat. 658175 and 660175, Greiner Bio-One GmbH,
Frickenhausen, Germany.
• Multi-well dishes: 96-well, 24-well and 6-well, Cat. 353072, 353935 and 351146,
Falcon, BD Biosciences Labware, NJ, US.
• Cell culture dishes: 35 × 10 mm and 100 × 20 mm, Cat. 353001 and 353003, Falcon,
BD Biosciences Labware, NJ, US.
• Centrifuge tubes: 15 ml and 50 ml, Cat. 62 554 502 and 227 261, Sarstedt AG & Co.,
Nümbrecht, Germany.
• Cryotubes: Cryo Vials, Cat. 121 277, Greiner Bio-One GmbH, Frickenhausen,
Germany.
• Filter system: 500 ml, 0.22 µm filter, Cat. 430758, Corning Incorporated, NY, US
• Slides: 25 × 1.0 × 75 mm, superfrost, Cat. J1800AMNZ, Menzel-Gläser, Mezel GmbH
& Co KG, Braunschweig, Germany.
• Cover slides: 24 × 32 mm and 18 × 18 mm, Menzel-Gläser, Mezel GmbH & Co KG,
Braunschweig, Germany.
• Counting chamber: 0.1 × 0.0025 mm2, Cat. 63510-10, Neubauer, Brand, Germany.
• Pipettes: 10 ml, Cat. 47110, Sterilin Ltd. Caerphilly, UK; 25 ml, Cat. 4251, Corning
Incorporated, US.
33
• Tips: 10 µl, 200 µl, 1000 µl, Cat. 70 1115, 70 760 002 and 70 762, Sarstedt AG & Co.,
Nümbrecht, Germany.
2.2.2 Lab equipment
• Water bath: Techne TE-10D, Tempunit Gesellschaft für Laborgeräte mbH, Wertheim,
Germany.
• Thermomixer: 5436, Eppendorf-Netheler-Hinz GmbH, Hamburg, Germany.
• Magnetic stirrer: IkaMag RH, Janke & Kunkel IKA-Labortechnik, Staufen, Germany.
• Centrifuge: Hettich EBA 12R and Universal 16A, Minnesota, US.
• Eppendorf pipettes: 0.5-10 µl, 10-100 µl, 20-200 µl, 100-1000 µl, Eppendorf-
Netheler-Hinz GmbH, Hamburg, Germany.
• Electronic pipette controller: Gilson, Middleton, US.
2.3 Cell culture
2.3.1 Cell culture medium and supplement
• RPMI 1640: Cat. F1415, Biochrom AG, Berlin, Germany.
• Fungizone: amphothericin B, 250 µg/ml, Cat. P11-001, PAA Laboratories GmbH,
Pasching, Austria.
• Penstrep: penicillin (10,000 IU/ml) and streptomycin (10,000 IU/ml), Cat. P11-010,
PAA Laboratories GmbH, Pasching, Austria.
• L-glutamine: 200 mM, Cat. M11-004, PAA Laboratories GmbH, Pasching, Austria.
• Trypsin-EDTA: 0.05%/0.02% in D-PBS, Cat. L11-004, PAA Laboratories GmbH,
Pasching, Austria.
• FBS: REF. 16170-078, Gibco, Darmstadt, Germany.
• NCS: REF. 26010-074, Gibco, Darmstadt, Germany.
• PBS: Phosphate Buffered Saline, without Ca2+ and Mg2+, Cat. H15-002, PAA
Laboratories GmbH, Pasching, Austria.
• Ethanol: pure, Pharmacy, Klinikum Grosshadern, Munich, Germany.
• DMSO: dimethyl sulfoxide, 5 ×10 ml. Cat. D2650, Sigma-Aldrich, St. Louis, US.
• Trypan blue: 0.4%, Cat. T8154, Sigma-Aldrich, St. Louis, US.

34
• StemPro hESC SFM: human embryonic stem cell culture kit, Cat. A10007-01, Gibco,
Darmstadt, Germany.
• FGF-2: recombinant human fibroblast growth factor- basic, 50 µg, Cat. PHG0026,
Gibco, Darmstadt, Germany.
• GDC-0449: 50 mg, Cat. S1082, Selleck Chemicals Co., Ltd, Houston, US.
• Cyclopamine hydrate: 1mg, Cat. C4116, Sigma-Aldrich, St. Louis, US.
• Cisplatin: 1mg, Pharmacy, Klinikum Grosshadern, Munich, Germany.
2.3.2 Cell culture equipment
• Laminar airflow: Heraeus, Munich, Germany.
• Incubator: Heraeus, Munich, Germany.
2.3.3 Cell culture medium recipe
• HCC medium
Final Conc.
90% RPMI 1640
10% FBS heat inactivated
200 mM L-glutamine
10,000 IU/ml Penstrep
2.5 µg/ml Fungizone
• H1339 medium
Final Conc.
80% RPMI 1640
20% FBS heat inactivated
200 mM L-glutamine
10,000 IU/ml Penstrep
2.5 µg/ml Fungizone
• Stem cell medium for SP
Final Conc.
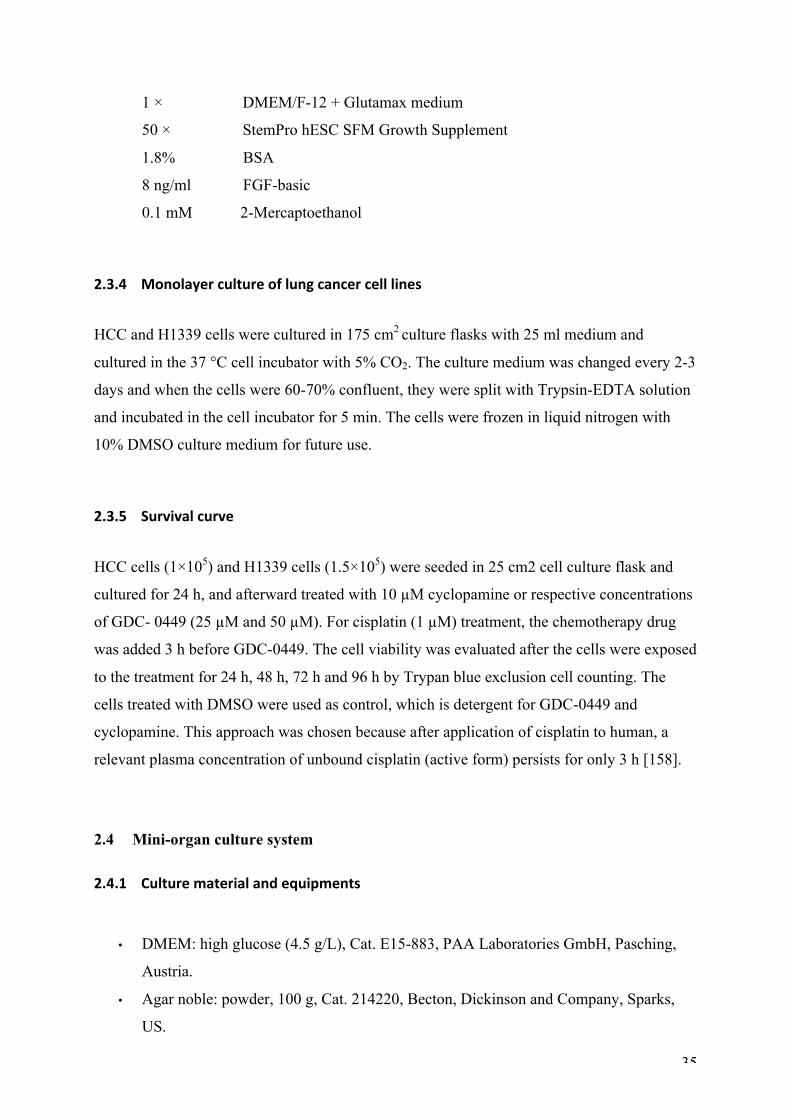
35
1 × DMEM/F-12 + Glutamax medium
50 × StemPro hESC SFM Growth Supplement
1.8% BSA
8 ng/ml FGF-basic
0.1 mM 2-Mercaptoethanol
2.3.4 Monolayer culture of lung cancer cell lines
HCC and H1339 cells were cultured in 175 cm2 culture flasks with 25 ml medium and
cultured in the 37 °C cell incubator with 5% CO2. The culture medium was changed every 2-3
days and when the cells were 60-70% confluent, they were split with Trypsin-EDTA solution
and incubated in the cell incubator for 5 min. The cells were frozen in liquid nitrogen with
10% DMSO culture medium for future use.
2.3.5 Survival curve
HCC cells (1×10⁵) and H1339 cells (1.5×10⁵) were seeded in 25 cm2 cell culture flask and
cultured for 24 h, and afterward treated with 10 µM cyclopamine or respective concentrations
of GDC- 0449 (25 µM and 50 µM). For cisplatin (1 µM) treatment, the chemotherapy drug
was added 3 h before GDC-0449. The cell viability was evaluated after the cells were exposed
to the treatment for 24 h, 48 h, 72 h and 96 h by Trypan blue exclusion cell counting. The
cells treated with DMSO were used as control, which is detergent for GDC-0449 and
cyclopamine. This approach was chosen because after application of cisplatin to human, a
relevant plasma concentration of unbound cisplatin (active form) persists for only 3 h [158].
2.4 Mini-organ culture system
2.4.1 Culture material and equipments
• DMEM: high glucose (4.5 g/L), Cat. E15-883, PAA Laboratories GmbH, Pasching,
Austria.
• Agar noble: powder, 100 g, Cat. 214220, Becton, Dickinson and Company, Sparks,
US.

36
• MEM NEAA: MEM non-essential amino acid, 100 ×, 100 ml, Cat. M11-003, PAA
Laboratories GmbH, Pasching, Austria.
• Tissue slicer: OTS-4000 oscillating tissue slicer, FHC Inc, Bowdoinham, USA.
• Super glue: Aron Alpha industrial krazy glue, high strength rapid bonding adhesive
alpha cyanoacrylate, 2 g × 5 tubes, Elmer’s Products Inc, Columbus, USA.
• Other medium and supplements needed were mentioned in 2.2.1.
2.4.2 Culture medium and agar plate
• Culture medium
Final Conc.
90% RPMI 1640
10% FBS heat inactivated
200 mM L-glutamine
10,000 IU/ml Penstrep
2.5 µg/ml Fungizone
• Agar Plate
30 ml 1.5% Agar
30 ml 2× DMEM
6 ml NCS
75 µl non-essential amino acids
120 µl Penstrep
240 µl Fungizone
150 ml ddH2O
Agar powder was first dissolved in ddH2O on magnetic stirrer at 50 °C and afterward
sterilized by autoclaving at 120 °C for 20 min. Before the agar was mixed with the medium
and other components, it has been heated in the microwave oven into fluid form. The agar gel
was equally distributed into a 24-well plate with 200 µl in each well. The ready agar plates
were wrapped with cling film and stored at 4 °C.

37
2.4.3 Biopsy cultivation
Biopsies were removed from visually normal mucosa from the main bronchi via a
bronchoscope. After the biopsies were transferred to the lab, they were first washed with PBS
with penstrep and fungizone for 3 times in the cell culture dish to clear up the remaining
mucus tissue and blood. Afterward they were cut into about 2 mm × 2 mm sized pieces and
cultured in an agar plate with 400 µl co-culture medium added on top. The tissue cultures
were maintained in the 37°C cell incubator with 5% CO2. The medium was changed every
two days and each time the biopsy was observed under a light microscope to evaluate the
epithelializing progress and the active cilia percentage. Every week the tissue cultures were
transferred to a new plate to avoid contamination, and in case of contamination, the whole
plate has been discarded. The biopsy was transferred to a 35 × 10 mm cell culture dish and
until the epithelium cells would have expanded, the culture was applied for Ca2+ staining.
2.5 Flow cytometry and cell sorting of SPs
2.5.1 Material and equipment
• Hoechst 33342: trihydrochloride, trihydrate, FluoroPure grade, 100mg, Cat. H21492,
Invitrogen, Darmstadt, Germany.
• Verapamil: hydrochloride, 1g, Cat. V4629, Sigma-Aldrich, St. Louis, US.
• Propidium iodide: 1 mg/ml, Cat. P4170, Sigma-Aldrich, St. Louis, US.
• Anti-human CD133-PE: mouse anti human CD133 monoclonal antibody, PE
conjugated, Cat. 130-080-801, Miltenyi Biotec GmbH, Bergisch Gladbach, Germany..
• Anti-human CD34-PE-Cy5.5: mouse anti human CD34 monoclonal antibody, PE-
Cy5.5 conjugated, Cat. CD34-581-18, Invitrogen, Darmstadt, Germany.
• Anti-human CD117-APC: mouse anti human CD117 monoclonal antibody, APC
conjugated, Cat. CD117-05, Invitrogen, Darmstadt, Germany.

38
• IgG1-FITC/IgG1-PE: mixture of FITC conjugated mouse IgG1 and mouse PE
conjugated IgG1, isotype control, Cat. A07794, Beckman Coulter, Marseille Cedex,
France.
• IgG1-APC: APC conjugated mouse IgG1, isotype control, Cat. 400121, Biozol
Diagnostica Vertrieb GmbH, Eching, Germany.
• IgG1-PE-Cy5.5: PE-Cy5.5 conjugated mouse IgG1, isotype control, Cat. MG118,
Invitrogen, Darmstadt, Germany.
• FACSAria II flow cytometer: BD, New Jersey, USA.
• MoFlo High Speed Sorter: DAKO-Cytomation, Glostrup, Denmark.
2.5.2 FACS analysing and cell sorting for SPs
Single-cell suspensions of HCC and H1339 cells respectively, 1 × 10⁶/ml in 2% FBS RPMI
1640, were stained with 2.5 µg/ml Hoechst 33342 for 1.5 h in a 37°C water bath. During the
loading, it was important that the cell suspension was gently vortexed every 15 min in order to
avoid clumping while the staining temperature was kept constantly at 37°C. Propidium Iodide
was added with a final concentration of 5µg/106 cells to discriminate viable and non-viable
cells before measurements. Cells were analyzed with FACSAria II flow cytometer to identify
the SP fraction and sorted with the MoFlo High Speed Sorter. The cells with low fluorescence
at both 450~50 nm and 670~30 nm wavelengths were defined as SP cells. 50 µM verapamil
was employed to block the ABC transporter as a control for staining and as a standard for
gating. After sorting, the SP cells were cultured with the stem cell medium and non-SP cells
with medium for HCC and H1339 cells.

39
2.5.3 Stem cell markers analysis
Cells were handled and loaded with Hoechst 33342 as described above and whereas stem cell
surface markers were tested with the specific antibodies. 10 µl of the specific antibodies were
added to the cells. After the cells were well mixed, they were kept in the dark in the 4°C
refrigerator. The cells were washed with medium, centrifuged at 300 ×g for 10 min, then the
cell pellet was resuspended in 200 µl medium for analysis by FACS.
2.6 Western Blot
2.6.1 Material and equipment
• TBS: 10 ×, Tris-buffered saline solution, 1L, Cat. 170-6435, Bio-Rad Laboratories,
Munich, Germany.
• NuPAGE MOPS SDS running buffer: 20 ×, 500 ml, Cat. NP0001, Invitrogen,
Darmstadt, Germany.
• NuPAGE transfer buffer: 20 ×, 1 L, Cat. NP0006-1, Invitrogen, Darmstadt, Germany.
• Skim milk powder: 500 g, Cat. 70166, Sigma-Aldrich, St. Louis, US.
• NuPAGE antioxidant: 15 ml, Cat. NP0005, Invitrogen, Darmstadt, Germany.
• NuPAGE sample reducing agent: 10 ×, Cat. NP0004, Invitrogen, Darmstadt, Germany.
• NuPAGE LDS sample buffer: 4 ×, Cat. NP0007, Invitrogen, Darmstadt, Germany.
• Tween 20: 100 ml, Cat. P7949, Sigma-Aldrich, St. Louis, US.
• Complete lysis-M: protein extraction reagent set, Cat. 04 719 956 001, Roche,
Mannheim, Germany.

40
• BSA standard set: bovine serum albumin standard set for creating assay standard
curve, BSA concentrations from 0.125 to 2 mg/ml, Cat. 500-0207, Bio-Rad
Laboratories, Munich, Germany.
• Non-interfering protein assay kit: Cat. 488250, Calbiochem, EMD Bioscience Inc.,
Darmstadt, Germany.
• NuPAGE 4-12% Bis-tris gel: 1.5 mm × 10 well, Cat. NP0335BOX, Invitrogen,
Darmstadt, Germany.
• SeeBlue plus 2 pre-stained standard: 500 µl, Cat. LC 5925, Invitrogen, Darmstadt,
Germany.
• Criterion gel blotting sandwiches: immun-blot PVDF with filter papers, Cat. 162-0238,
Bio-Rad Laboratories, Munich, Germany.
• Hybond-P PVDF membrane: 20 × 20 cm, Cat. RPN2020F, Amersham Biosciences
Europe GmbH, Freiburg, Germany.
• Anti-human SMO: H-300, rabbit anti human SMO polyclonal antibody, Cat. sc-13943,
Santa Cruz Biotechnology Inc., Heidelberg, Germany.
• Anti-human Gli-1: N-16, goat anti human Gli-1 polyclonal antibody, Cat. sc-6153,
Santa Cruz Biotechnology Inc., Heidelberg, Germany.
• Anti-human Patched: G-19, goat anti human Patched polyclonal antibody, Cat. sc-
6149, Santa Cruz Biotechnology Inc., Heidelberg, Germany.
• Anti-human Shh: N-19, goat anti human Shh polyclonal antibody, Cat. sc-1194, Santa
Cruz Biotechnology Inc., Heidelberg, Germany.
• Anti-human Bmi-1: mouse anti human Bmi-1 monoclonal antibody, Cat. 37-5400,
Invitrogen, Darmstadt, Germany.
• Anti-human SERCA 1/2/3: rabbit anti human SERCA 1/2/3 polyclonal antibody, Cat.
sc-30110, Santa Cruz Biotechnology Inc., Heidelberg, Germany.
41
• Anti-human IP3R I/II/III: rabbit anti human IP3R I/II/III polyclonal antibody, Cat. sc-
28613, Santa Cruz Biotechnology Inc., Heidelberg, Germany.
• Anti-human β-actin HRP: C4, HRP conjugated mouse anti human β-actin monoclonal
antibody, Cat. sc-47778, Santa Cruz Biotechnology Inc., Heidelberg, Germany.
• Donkey anti-goat IgG-HRP: HRP conjugated secondary antibody, Cat. sc-2020, Santa
Cruz Biotechnology Inc., Heidelberg, Germany.
• Goat anti-rabbit IgG-HRP: HRP conjugated secondary antibody, Cat. sc-2004, Santa
Cruz Biotechnology Inc., Heidelberg, Germany.
• Goat anti-mouse IgG-HRP: HRP conjugated secondary antibody, Cat. sc-2005, Santa
Cruz Biotechnology Inc., Heidelberg, Germany.
• Amersham ECL plus western blotting detection reagents: Cat. RPN2132, GE
Healthcare UK Limited, Buckinghamshire, UK.
• Power PAC 3000: power supply for electrophoresis applications, Bio-Rad
Laboratories, Munich, Germany.
• XCell II blot module: Cat. EI9051, Invitrogen, Darmstadt, Germany.
2.6.2 Solution recipe
• TBS-T buffer
100 ml 10 × TBS buffer
1 ml Tween 20
to 1 L ddH2O
• Blocking buffer
5 g Slim fat milk powder
100 ml TBS-T

42
• Transfer buffer
50 ml 20 × NuPAGE transfer buffer
150 ml Methanol
1 ml Antioxidant
to 1 L ddH2O
• MOPS buffer
1 ml Antioxidant
50 ml 20 × MOPS NuPAGE buffer
to 1 L ddH2O
• Mild stripping buffer
15 g Glycine
1 g SDS
10 ml Tween 20
Adjust pH to 2.2
to 1 L ddH2O
2.6.3 Western blot
HCC and H1339 cells were cultured in 175 cm2 cell culture flasks for 24 h, afterward treated
with 10 µM cyclopamine or respective concentrations of GDC- 0449 (25 µM and 50 µM) for
another 24h. Whole protein extraction was carried out according to the protocol from
complete lysis-M protein extraction reagent set. 500 µl lysis buffer was used for 107 cells for
high protein concentration and efficient protein extraction. Protein concentration was

43
measured with a non-interfering protein assay kit and a standard curve from BSA standard
samples. (Figure 1)
Figure 1. Standard curve from BSA standard samples.
50 µg protein from each sample was diluted with NuPAGE reducing buffer, sample buffer
and ddH2O to 50 µl and was heated by the thermomixer at 70 °C for 10 min to denature.
Electrophoresis voltage was set at constant 150 V and with the run time of 90 min. Western
transfer was performed at constant 30 V for 60 min. The membranes were blocked in
blocking buffer at room temperature for 3 h and afterward incubated with specific antibodies
for 16 h at 4 °C. The primary antibodies anti-human SMO, Gli-1, Patched, Shh, SERCA,
IP3R were diluted 1: 200 and anti-Bmi-1 was diluted 1:500 with blocking buffer for the
loading. The membranes were incubated with diluted 1:2000 matched HRP conjugated
secondary antibodies for 1h at room temperature on the next day. Then the western blotting
detection reagents were applied at 0.1ml/cm2 to the membranes for 5 min at room temperature
and films were developed in the dark room.
Standard Curve
BSA mg/ml
-500 0 500 1000 1500 2000 2500
OD
490
nm
0,05
0,10
0,15
0,20
0,25
0,30
0,35
Figure 1

44
After the membranes for the target proteins were filmed, one membrane was chosen for β-
actin reprobing from each sample group. The membrane was washed with mild stripping
buffer and then blocked for 3 h at room temperature. The anti-human β-actin HRP antibody
was 1:2000 diluted with blocking buffer and applied on the membrane for 1 h incubation at
room temperature. Procedures afterward were implemented as described above.
The films were scanned with HP ScanJet into digital pictures, then analysed with the imaging
processing program Image J. The regions of interest (ROIs) were defined according to the size
of the protein and the average light intensity was measured. After the background intensity
was corrected, each sample was standardized with β-actin via the light intensity of ROIs
divided by the light intensity of β-actin.
2.7 Immunofluorescence
2.7.1 Immunofluorescence material
• Paraformaldehyde: powder form, 250 g, Cat. 0335.1, Carl Roth GmbH + Co. KG,
Karlsruhe, Germany.
• Sodium borohydride: powder form, 100 g, Cat. 45, 288-2, Sigma-Aldrich, St. Louis,
US.
• Triton X-100: 100 ml, Cat. T8787, Sigma-Aldrich, St. Louis, US.
• BSA: powder form, 200 g, Cat. 8076.4, Carl Roth GmbH + Co. KG, Karlsruhe,
Germany.
• Mounting medium with DAPI: 1.5µg/ml DAPI, 10 ml, Cat. H-1200, Vector
Laboratories, Inc., Burlingame, US.
• Anti-human SMO: H-300, rabbit anti human SMO polyclonal antibody, Cat. sc-13943,
Santa Cruz Biotechnology Inc., Heidelberg, Germany.

45
• Anti-human SERCA 1/2/3: H-300, rabbit anti human SERCA 1/2/3 polyclonal
antibody, Cat. sc-30110, Santa Cruz Biotechnology Inc., Heidelberg, Germany.
• Anti-human IP3R-I/II/III: H-300, rabbit anti human IP3R-I/II/III polyclonal antibody,
Cat. sc-28613, Santa Cruz Biotechnology Inc., Heidelberg, Germany.
• Goat anti-rabbit IgG-FITC: FITC conjugated secondary antibody, Cat. sc-2012, Santa
Cruz Biotechnology Inc., Heidelberg, Germany.
• Donkey anti-goat IgG-FITC: FITC conjugated secondary antibody, Cat. sc-2024,
Santa Cruz Biotechnology Inc., Heidelberg, Germany.
2.7.2 Immunofluorescence for SP and non-‐SP cells
After sorting, isolated SP cells from both HCC and H1339 cell lines were cultured in Stem
Pro hESC Supplement with 10 µg/ml and non-SP cells were cultured in RPMI-1640 medium
with 10% FBS for HCC cells and 20% FBS for H1339 cells. Cells were grown on a glass
cover slip in a 6-well cell culture plate, fixed with 4% paraformaldehyde for 30 min at room
temperature and permeabilized with 0.5% Triton X-100/PBS for 10 min at room temperature
before incubation with the specific antibodies 4°C overnight. Primary antibodies were diluted
1:50. After the cells stained with diluted 1:100 matched FITC combined secondary antibodies
for 1 h at room temperature, the cells were visualized by fluorescence microscope with a
digital CCD camera.

46
2.8 Calcium staining
2.8.1 Calcium staining material
• Fura-2 calcium imaging calibration kit: 11 Ca2+ standard buffers premixed with 50µM
fura-2, Cat. F-6774, Molecular Probes, Invitrogen, Eugene, US.
• Fura-2 AM: 50 µg × 20 special packaging, Cat. F14185, Molecular Probes, Invitrogen,
Eugene, US.
• CPA: cyclopiazonic acid from penicillium cyclopium, Cat. C1530, Sigma-Aldrich, St.
Louis, US.
2.8.2 Composition of fluorescent microscope for calcium imaging
• Microscope: Axiovert 200M, SIP 79800, Carl Zeiss AG, Jena, Germany.
• HBO lamp: 103W/2, short Arc mercury lamp, Osram GmbH, Augsburg, Germany.
• Objective Fluar: 20 × 0.75, transmission wavelength from 340 nm, Zeiss AG,
Oberkochen, Germany.
• Filters: excitation wavelength 340 nm and 380 nm, emission wavelength 510 nm both,
Cat. 340 AF 15 and 380 AF 15, Laser components GmbH, Olching, Germany.
• CCD digital camera: AxioCam MRm, Carl Zeiss Vision, Munich, Germany.
2.8.3 Fura-‐2 calibration curve
A ratio metric measurement method was utilized to determine the dissociation constant (Kd)
of Fura-2 AM at the staining condition, in order to reduce artifacts from the microscope
application and to generate the absolute [Ca2+]c. With the Fura-2 calcium imaging calibration
kit, images of different Ca2+ concentration standard solution with Fura-2 AM were acquired,

47
with excitation at 340 nm and 380 nm respectively, while the emission was measured at 510
nm, according the protocol offered with the kit. With the online Kd calculator
(www.probes.com), the Kd of Fura-2 AM was yielded as 269 nM. (Figure 2)
Figure 2. Fura-2 calcium calibration curve: the Kd of Fura-2 AM was yielded as 269 nM.
A ratio (R) of emission intensities was calculated as the emission intensity at 510 nm from
340 nm excitation divided by the emission intensity at 510 nm from 380 nm excitation (R =
F340/F380). According the equation below, the [Ca2+]c can be obtained from the fluorescence
emission intensity ratio:
2.8.4 Cytoplasm Ca2+ concentration measurement
HCC, H1339 SP cells and non-SP cells were seeded in cell culture dishes with the same
density. After the cells grew adherent, Fura-2 AM was applied for cytoplasm calcium staining
with a final concentration of 10 µM in 37°C cell incubator for 90 min. After loading, the cells
were incubated another 30 min in PBS (with Ca2+ and Mg2+) to allow complete dye
[Ca2+]free = R-Rmin
Rmax-R × × Kd
F380max
F380min

48
deesterification and they were examined with the fluorescent microscope. Images of the same
field were taken at both exciting wavelength 340 nm and 380 nm with the image-processing
program Axio Vision 4.1 (Carl Zeiss). For each image, ROIs were defined in cytoplasm of
every single cell, and the average fluorescence of ROIs was measured with the image-
processing program Scion Image 4.0 (Scion). [Ca2+]c was calculated as described above.
2.8.5 ER Ca2+ concentration measurement
[Ca2+]ER was measured in an indirect approach. 1 µM CPA was applied during the Fura-2
loading to inhibit SERCA, which pumps Ca2+ into the ER, and it leads to a net Ca2+- efflux
out of the ER. The increase of [Ca2+]c was utilized as an estimate of [Ca2+]ER. In order to
prevent Ca2+ - entry by store-operated channels, incubation solution was substituted by PBS
without Ca2+ and Mg2+ immediately prior to the imaging.

49
3 RESULTS
3.1 Inhibitory effect of GDC-0449 on cell growth
HCC and H1339 cells were treated with 25 µM and 50 µM GDC-0449 respectively and the
survival fraction was calculated every 24 hours for 4 days. In both cell lines, a significant
concentration dependent cell growth inhibition could be shown and the effect was comparable
to 10 µM Cyclopamine, which is a widely used Hh pathway inhibitor. In HCC cells, the cell
number decreased after 24 h treatment, and the lowest survival fraction was observed at 48 h
with 25 µM and 50 µM GDC-0449 as 62.5±3.9% and 38.5±4.5%. 96 h after the treatment, the
survival fraction was 65.8±9.8% and 53.8±7.8% with 25 µM and 50 µM GDC-0449. In
H1339 cells, the cell number decreased slightly after 24 h treatment, and the lowest survival
fraction was observed at 96 h with 25 µM and 50 µM GDC-0449 as 62.9±6.6% and
45.4±3.1%. (n = 3) (Figure 3 A, B)
After the GDC-0449 treatment on HCC and H1339 cells, the same experiment was applied to
HCC and H1339 cisplatin resistant cells (HCC-Res and H1339-Res). In HCC-Res cells, the
cell number decreased after 24 h treatment, and the cell number kept decreasing until the
lowest survival fraction was observed at 96 h with 25 µM and 50 µM GDC-0449 as
42.4±6.9% and 24.9±3.6%. In H1339 cells, the cell number decreased also after 24 h
treatment, and the lowest survival fraction was observed at 96 h with 25 µM and 50 µM
GDC-0449 as 45.4±3.8% and 30.0±3.3%. (n = 3) (Figure 3 C, D)
0 1 2 3 40
20
40
60
80
100
Cyclopamine 10 µM GDC-0449 25 µM GDC-0449 50 µM
HCC
time after exposure (d)
surv
ival
frac
tion
(% c
ontr
ols) *
Figure 3 A

50
H1339
time after exposure (d)0 1 2 3 4
surv
ival
frac
tion
(% c
ontr
ols)
0
20
40
60
80
100Cyclopamine 10 µM GDC-0449 25 µM GDC-0449 50 µM
*
Figure 3 B
0 1 2 3 40
20
40
60
80
100
Cyclopamin 10 µM GDC-0449 25 µM GDC-0449 50 µM
HCC-Res
time after exposure (d)
surv
ival
frac
tion
(% c
ontr
ols)
*
Figure 3 C
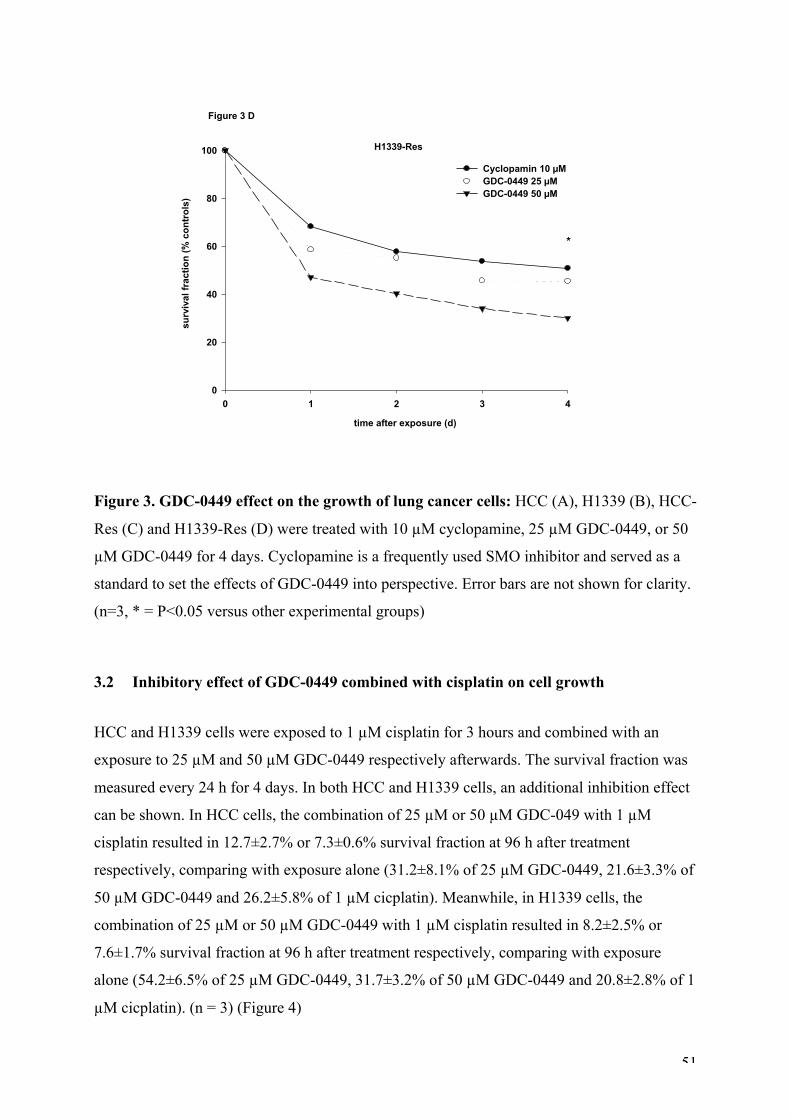
51
H1339-Res
0 1 2 3 40
20
40
60
80
100
Cyclopamin 10 µM GDC-0449 25 µM GDC-0449 50 µM
time after exposure (d)
surv
ival
frac
tion
(% c
ontr
ols)
*
Figure 3 D
Figure 3. GDC-0449 effect on the growth of lung cancer cells: HCC (A), H1339 (B), HCC-
Res (C) and H1339-Res (D) were treated with 10 µM cyclopamine, 25 µM GDC-0449, or 50
µM GDC-0449 for 4 days. Cyclopamine is a frequently used SMO inhibitor and served as a
standard to set the effects of GDC-0449 into perspective. Error bars are not shown for clarity.
(n=3, * = P<0.05 versus other experimental groups)
3.2 Inhibitory effect of GDC-0449 combined with cisplatin on cell growth
HCC and H1339 cells were exposed to 1 µM cisplatin for 3 hours and combined with an
exposure to 25 µM and 50 µM GDC-0449 respectively afterwards. The survival fraction was
measured every 24 h for 4 days. In both HCC and H1339 cells, an additional inhibition effect
can be shown. In HCC cells, the combination of 25 µM or 50 µM GDC-049 with 1 µM
cisplatin resulted in 12.7±2.7% or 7.3±0.6% survival fraction at 96 h after treatment
respectively, comparing with exposure alone (31.2±8.1% of 25 µM GDC-0449, 21.6±3.3% of
50 µM GDC-0449 and 26.2±5.8% of 1 µM cicplatin). Meanwhile, in H1339 cells, the
combination of 25 µM or 50 µM GDC-0449 with 1 µM cisplatin resulted in 8.2±2.5% or
7.6±1.7% survival fraction at 96 h after treatment respectively, comparing with exposure
alone (54.2±6.5% of 25 µM GDC-0449, 31.7±3.2% of 50 µM GDC-0449 and 20.8±2.8% of 1
µM cicplatin). (n = 3) (Figure 4)

52
HCC
time after exposure (d)0 1 2 3 4
surv
ival
frac
tion
(% c
ontr
ols)
0
20
40
60
80
100Cisplatin 1 µM GDC-0449 25 µM GDC-0449 25 µM+Cisplatin 1 µM
*
Figure 4 A
HCC
time after exposure (d)0 1 2 3 4
surv
ival
frac
tion
(% c
ontr
ols)
0
20
40
60
80
100
Cisplatin 1 µM GDC-0449 50 µM GDC-0449 50 µM+Cisplatin 1 µM
*
Figure 4 B

53
H1339
time after exposure (d)0 1 2 3 4
surv
ival
frac
tion
(% c
ontr
ols)
0
20
40
60
80
100Cisplatin 1 µM GDC-0449 25 µM GDC-0449 25 µM+Cisplatin 1 µM
*
Figure 4 C
H1339
time after exposure (d)
0 1 2 3 4
surv
ival
frac
tion
(% c
ontr
ols)
0
20
40
60
80
100
Cisplatin 1 µM GDC-0449 50 µM GDC-0449 50 µM+Cisplatin 1 µM
*
Figure 4 D
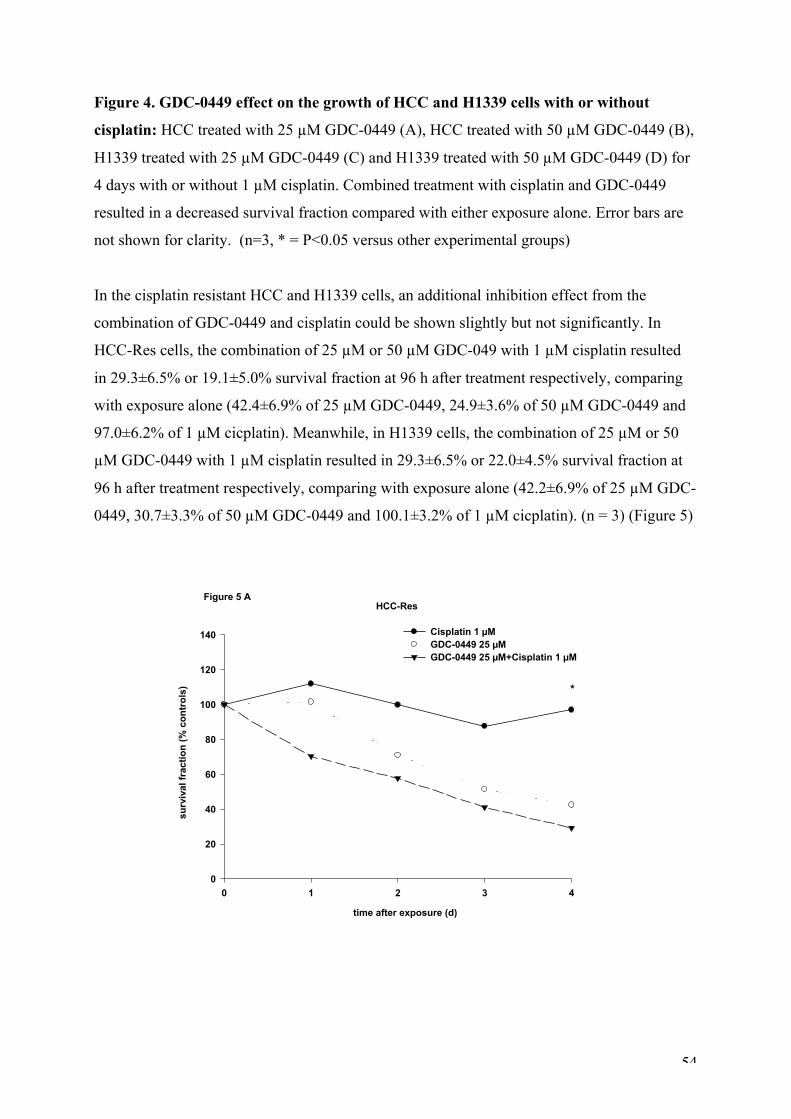
54
Figure 4. GDC-0449 effect on the growth of HCC and H1339 cells with or without
cisplatin: HCC treated with 25 µM GDC-0449 (A), HCC treated with 50 µM GDC-0449 (B),
H1339 treated with 25 µM GDC-0449 (C) and H1339 treated with 50 µM GDC-0449 (D) for
4 days with or without 1 µM cisplatin. Combined treatment with cisplatin and GDC-0449
resulted in a decreased survival fraction compared with either exposure alone. Error bars are
not shown for clarity. (n=3, * = P<0.05 versus other experimental groups)
In the cisplatin resistant HCC and H1339 cells, an additional inhibition effect from the
combination of GDC-0449 and cisplatin could be shown slightly but not significantly. In
HCC-Res cells, the combination of 25 µM or 50 µM GDC-049 with 1 µM cisplatin resulted
in 29.3±6.5% or 19.1±5.0% survival fraction at 96 h after treatment respectively, comparing
with exposure alone (42.4±6.9% of 25 µM GDC-0449, 24.9±3.6% of 50 µM GDC-0449 and
97.0±6.2% of 1 µM cicplatin). Meanwhile, in H1339 cells, the combination of 25 µM or 50
µM GDC-0449 with 1 µM cisplatin resulted in 29.3±6.5% or 22.0±4.5% survival fraction at
96 h after treatment respectively, comparing with exposure alone (42.2±6.9% of 25 µM GDC-
0449, 30.7±3.3% of 50 µM GDC-0449 and 100.1±3.2% of 1 µM cicplatin). (n = 3) (Figure 5)
HCC-Res
0 1 2 3 40
20
40
60
80
100
120
140 Cisplatin 1 µM GDC-0449 25 µM GDC-0449 25 µM+Cisplatin 1 µM
time after exposure (d)
surv
ival
frac
tion
(% c
ontr
ols) *
Figure 5 A

55
0 1 2 3 40
20
40
60
80
100
120
140
Cisplatin 1 µM GDC-0449 50 µM GDC-0449 50 µM+Cisplatin 1 µM
HCC-Res
time after exposure (d)
surv
ival
frac
tion
(% c
ontr
ols) *
Figure 5 B
H1339-Res
0 1 2 3 40
20
40
60
80
100
120
140 Cisplatin 1 µM GDC-0449 25 µM GDC-0449 25 µM+Cisplatin 1 µM
time after exposure (d)
surv
ival
frac
tion
(% c
ontr
ols)
*
Figure 5 C

56
0 1 2 3 40
20
40
60
80
100
120
140Cisplatin 1 µM GDC-0449 50 µM GDC-0449 50 µM+Cisplatin 1 µM
H1339-Res
time after exposure (d)
surv
ival
frac
tion
(% c
ontr
ols)
*
Figure 5 D
Figure 5. GDC-0449 effect on HCC-Res and H1339-Res cells with or without cisplatin:
HCC-Res treated with 25 µM GDC-0449 (A), HCC-Res treated with 50 µM GDC-0449 (B),
H1339-Res treated with 25 µM GDC-0449 (C) and H1339-Res treated with 50 µM GDC-
0449 (D) for 4 days with or without 1 µM cisplatin. Combined treatment with cisplatin and
GDC-0449 did not result in a significantly additional decreased survival fraction compared
with exposure alone. Error bars are not shown for clarity. (n=3, * = P<0.05 versus cisplatin
treated group)
3.3 Effect of GDC-0449 on the expression of Hh pathway components in HCC and H1339 cells
In order to detect the effect of GDC-0449 on the Hh pathway components, Shh, Patched,
SMO, Gli-1 and Bmi-1 were examined by Western blot. In both HCC and H1339 cell lines,
the Hh pathway components showed substantial expression. In HCC cells, after the
application of GDC-0449 50 µM, Gli-1, Patched and Shh expression decreased significantly
compared with the control group by 43.9±11.2%, 55.9±10.0% and 65.2±7.8% respectively. (n
= 3) (Figure 6)

57
HCC Shh
0
20
40
60
80
100
120
140
DMSO Cyclopamine 10µM
GDC-0449 25µM
GDC-0449 50µM
RO
I / fl
-act
inFigure 6 A
*
HCC Patched
RO
I / fl
-act
in
0
20
40
60
80
100
120
140
DMSO Cyclopamine 10 µM
GDC-0449 25 µM
GDC-0449 50 µM
Figure 6 B
*

58
0
20
40
60
80
100
120
140
DMSO Cyclopamine 10 µM
GDC-0449 25 µM
GDC-0449 50 µM
HCC SMOR
OI /
fl-a
ctin
Figure 6 C
HCC Gli-1
0
20
40
60
80
100
120
140
RO
I / fl
-act
in
DMSO Cyclopamine 10 µM
GDC-0449 25 µM
GDC-0449 50 µM
Figure 6 D
*
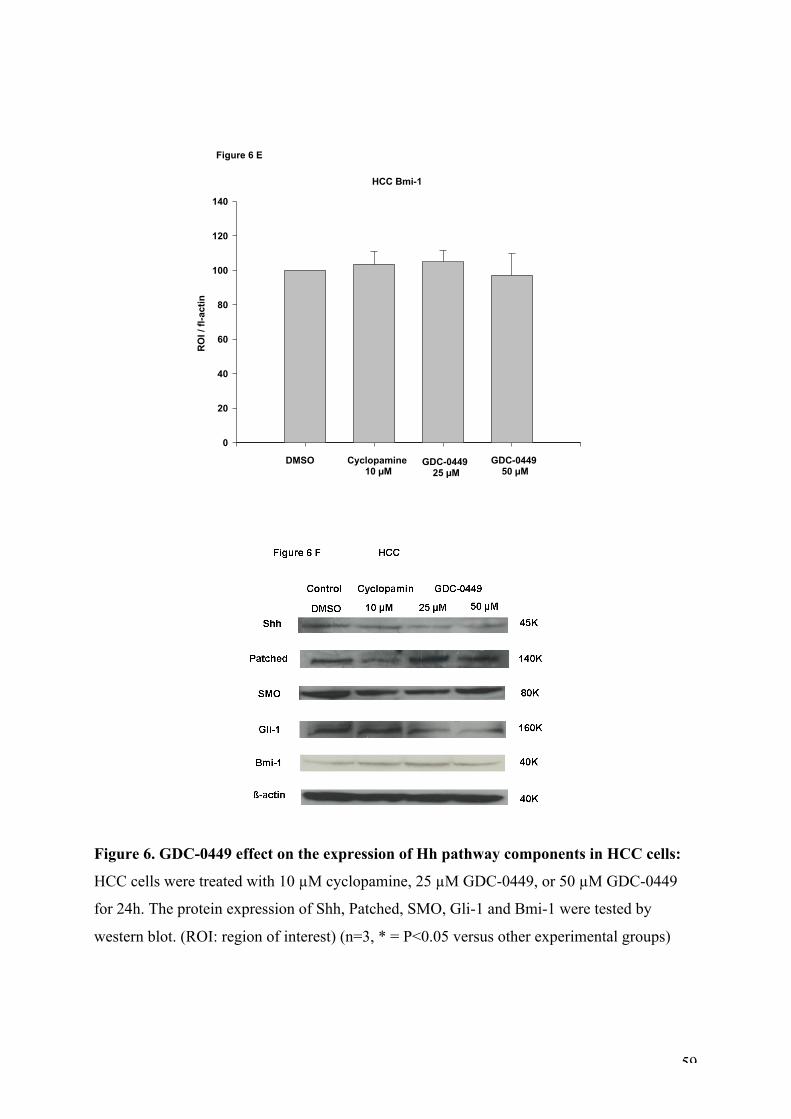
59
HCC Bmi-1
0
20
40
60
80
100
120
140
DMSO Cyclopamine 10 µM
GDC-0449 25 µM
GDC-0449 50 µM
RO
I / fl
-act
in
Figure 6 E
Figure 6. GDC-0449 effect on the expression of Hh pathway components in HCC cells:
HCC cells were treated with 10 µM cyclopamine, 25 µM GDC-0449, or 50 µM GDC-0449
for 24h. The protein expression of Shh, Patched, SMO, Gli-1 and Bmi-1 were tested by
western blot. (ROI: region of interest) (n=3, * = P<0.05 versus other experimental groups)

60
In H1339 cells, after the treatment, Gli-1 expression reduced significantly by 46.8±8.9% and
Shh and Bmi-1 expression increased by 100.7±6.2% and 120.1±8.0% compared with the
control group. (n = 3) (Figure 7)
H1339 Shh
0
50
100
150
200
250
300
DMSO Cyclopamine 10 µM
GDC-0449 25 µM
GDC-0449 50 µM
RO
I / fl
-act
in
Figure 7 A
* *
H1339 Patched
RO
I / fl
-act
in
0
50
100
150
200
250
300
DMSO Cyclopamine 10 µM
GDC-0449 25 µM
GDC-0449 50 µM
Figure 7 B

61
0
50
100
150
200
250
300
DMSO Cyclopamine 10 µM
GDC-0449 25 µM
GDC-0449 50 µM
H1339 SMO
RO
I / fl
-act
in
Figure 7 C
H1339 Gli-1
0
50
100
150
200
250
300
RO
I / fl
-act
in
DMSO Cyclopamine 10 µM
GDC-0449 25 µM
GDC-0449 50 µM
Figure 7 D
*
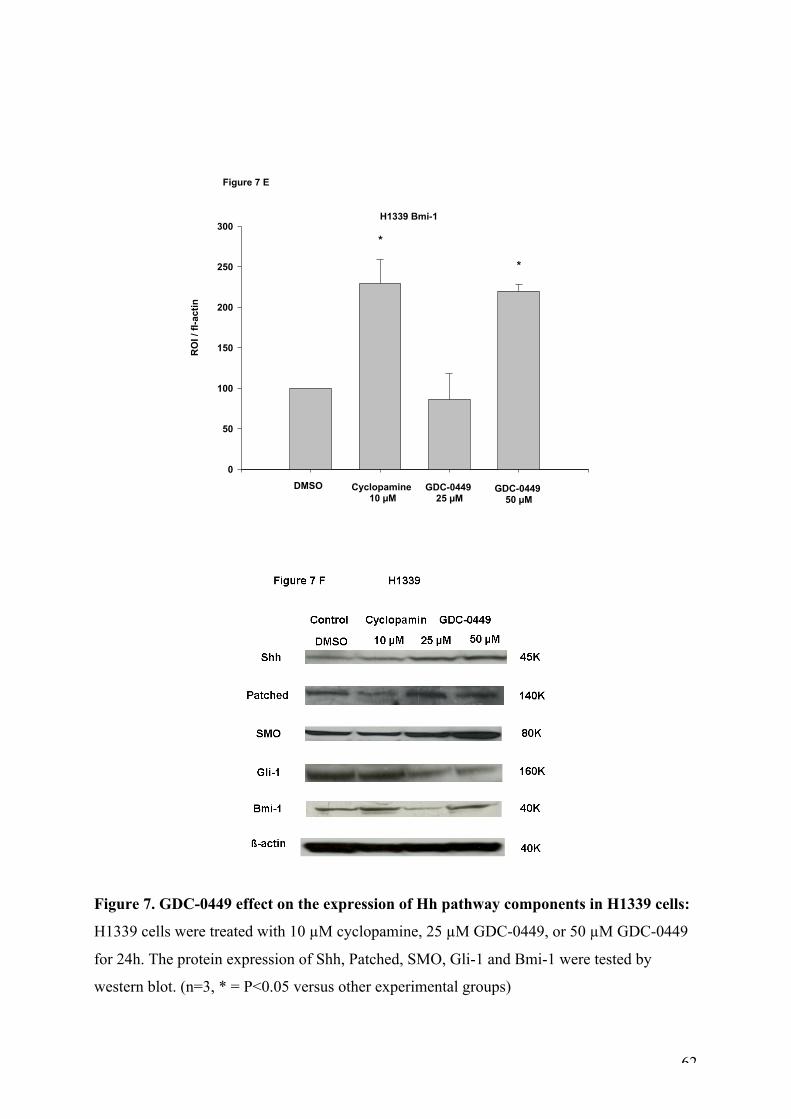
62
H1339 Bmi-1
0
50
100
150
200
250
300
DMSO Cyclopamine 10 µM
GDC-0449 25 µM
GDC-0449 50 µM
RO
I / fl
-act
inFigure 7 E
*
*
Figure 7. GDC-0449 effect on the expression of Hh pathway components in H1339 cells:
H1339 cells were treated with 10 µM cyclopamine, 25 µM GDC-0449, or 50 µM GDC-0449
for 24h. The protein expression of Shh, Patched, SMO, Gli-1 and Bmi-1 were tested by
western blot. (n=3, * = P<0.05 versus other experimental groups)

63
3.4 SP fraction in HCC and H1339 cells
To demonstrate the SP phenomenon in lung cancer cell lines, HCC and H1339 cells were
stained with 2.5 µM Hoechst 33342 and analysed with FACS. In both HCC and H1339 cells,
the SP phenomenon could be exhibited. To examine the participation of ABC-transporters in
the reduced dye uptake, 50 µM verapamil was employed to block the ABC-transporters. In
HCC and H1339 cells, 0.57±0.10% and 0.46±0.10% SP cells were shown (n = 3). With the
application of verapamil, HCC SP fraction was reduced and H1339 SP fraction was not
perceptible due to the efficient inhibition of ABC-transporters. (Figure 8)

64
SP fraction in lung cancer cell lines
SP fr
actio
n (%
)
0,0
0,2
0,4
0,6
0,8
HCC H1339
Figure 8 C
Figure 8. SP in HCC and H1339 cells: HCC and H1339 cells were stained with 2.5 µM
Hoechst 33342 and analyzed by FACS. SP cells were shown in both HCC (A upper) and
H1339 cells (A lower) SP fraction was measured after 3 times of independent experiments (C).
Blocking ABC transporters with 50µM verapamil, the SP was substantially reduced in HCC
(B upper) and was not detectable in H1339 (B lower) cells. (n=3)
3.5 SP cells repopulation ability
SP and non-SP cells from HCC and H1339 cells were isolated and cultured for 1 week and
then SP fraction of cells derived from SP and non-SP cells were examined. Cells derived from
SP showed repopulation of the original cell population with a SP of 9.3%, which was a
significantly increased than the whole SP fraction from the whole HCC cell population. Cells
derived from non-SP showed lower cell number with substantially lower SP of 0.5% and the
decreased cell number indicated that the repopulation ability was absent. (n = 3) (Figure 9)

65
Figure 9. Repopulation ability of SP cells: HCC SP and non-SP cells were isolated and
cultured separately for 1 week in RPMI medium. Cells derived from SP showed repopulation
of the original cell population with a SP of 9.3%. Cells derived from non-SP showed lower
cell number with substantially lower SP of 0.5%. Similar results were obtained in H1339 cells.
(n=3)
3.6 Expression of stem cell marker in lung cancer SP cells
In order to show the stem cell marker expression in SP cells, three conventional stem cell
markers, CD133, CD34, and CD117, were tested with specific antibodies via FACS. SP cells
from HCC and H1339 cells were gated out after Hoechst 33342 staining and the expression of
CD133, CD34, and CD117 was analyzed. In both HCC SP and H1339 SP cells, no stem cell
marker expression was detectable. (Figure 10)

66
Figure 10. Stem cell marker expression of SP cells: HCC SP and H1339 SP cells were
stained with specific antibodies for the stem cell markers at the mean time with Hoechst
33342 staining, CD133, CD34, and CD117. No positive stem marker expression was
detectable. (n=3)
3.7 Inhibitory effect of GDC-0449 on SP cells
50 µM GDC-0449 was applied on HCC and H1339 cells for 24 h and the SP fraction in the
surviving cells was measured via FACS after 2.5 µM Hoechst 33342 staining. The application
of GDC-0449 led to a reduction of SP percentage from 0.45±0.13% to 0.24±0.08% in HCC
cells and from 0.75±0.08% to 0.18±0.03% in H1339 cells. (n = 3) (Figure 11)

67
HCC
SP fr
actio
n
0,0
0,1
0,2
0,3
0,4
0,5
0,6
DMSO GDC-0449 50µM
*
Figure 11 C

68
SP fr
actio
n
0,0
0,2
0,4
0,6
0,8
1,0
DMSO GDC-0449 50µM
H1339
*
Figure 11 D
Figure 11. GDC-0449 effect on SP fraction: HCC (A) and H1339 (B) cells were treated
with 50 µM GDC-0449 and the percentage of SP in the surviving cells was measured. The
application of GDC-0449 led to a reduction of SP fraction in HCC cells (C) and in H1339
cells (D). (n=3, * = P<0.05 versus other experimental group)
3.8 Hh pathway activity in SP cells and non-SP cells
To investigate the Hh pathway activity in SP and non-SP cells of lung cancer cell lines, the
Hh pathway receptor SMO was evaluated by a specific antibody via immuno-fluorescence. In
HCC and H1339 SP cells but not in non-SP, SMO was detected. The control staining was
performed at the same time and no unspecific staining was shown. (n = 3) (Figure 12)

69
Figure 12. SMO expression in SP and non-SP cells: Immuno-fluorescence of
HCC SP (A), HCC non-SP (B), H1339 SP (C) and H1339 non-SP (D) cells was performed
with a specific antibody for SMO. Only HCC and H1339 SP cells showed specific SMO
fluorescence (green, nucleus blue stained with DAPI), indicating the activation of the Hh
pathway only in the stem cell-like population. Bar 10 µm. (n=3)
3.9 Cytoplasm free Ca2+ concentration measurements
[Ca2+]c of HCC and H1339 cells were 33.0±2.5 nM and 34.4±2.5 nM, which were
significantly higher than that of human bronchial epithelium cells (BECs) (18.8±1.8 nM). (n =
3) (Figure 13)

70
Lung cancer cells and BECcytoplasm free Ca2+ concentration
0
10
20
30
40
50
[Ca2+
] c (n
M)
HCC H1339 BEC
*
Figure 13. [Ca2+]c of lung caner cells and BEC: After Fura-2 staining, BEC cells showed a
significantly lower [Ca2+]c than HCC and H1339 cells. (n=3, * = P<0.05 versus other
experimental groups)
3.10 Endoplasmic reticulum Ca2+ concentration measurements
Direct measurement of [Ca2+]ER is not feasible due to the lack of a standard curve for Mag-
Fura 2. Therefore an indirect approach was used. The ER Ca2+ pumping receptor SERCA
were inhibited using 1 µM CPA leading to a net Ca2+ -efflux out of the ER. The resulting
increase in [Ca2+]c was an estimate of the [Ca2+]ER. The [Ca2+]ER of HCC and H1339 cells
were 2854.7±279.8 nM and 2210.5±154.9 nM, while that of BEC was 1941.1±190.4 nM. (n =
3) (Figure 14)

71
Lung cancer cells and BECER Ca
2+ concentration
0
500
1000
1500
2000
2500
3000
3500
[Ca2+
] c (n
M)
HCC H1339 BEC
*
Figure 14. [Ca2+]ER of lung caner cells and BEC: After Fura-2 staining and the application
of CPA, BEC cells showed a significantly lower [Ca2+]ER than HCC and H1339 cells. (n=3, *
= P<0.05 versus other experimental groups)
3.11 GDC-0449 effect on cytoplasm free Ca2+ concentration
50 µM GDC-0449 has been applied on HCC, H1339, HCC-Res and H1339-Res cells with or
without 1 µM cisplatin 3 h treatment. [Ca2+]c was measured after 24 h.
In HCC cells, 50 µM GDC-0449, 1 µM cisplatin and 50 µM GDC-0449 combined with 1 µM
cisplatin treated groups showed significantly increased [Ca2+]c, as 138.6±3.9 nM, 86.7±1.3nM
and 157.5±3.0 nM respectively, compared with untreated control group as 56.1±3.9nM. In
H1339 cells, after the treatment with 50 µM GDC-0449, 1 µM cisplatin and 50 µM GDC-
0449 with 1 µM cisplatin, significantly increased [Ca2+]c was shown as 133.6±5.0 nM,
99.5±2.5 nM and 177.4±3.0 nm respectively, compared with the untreated control group as
44.5±3.3 nM. (n=3) (Figure 15)

72
HCC
[Ca2+
] c (n
M)
0
20
40
60
80
100
120
140
160
180
DMSO GDC-0449 50 µM Cisplatin 1µM GDC-0449 50 µM + Cisplatin 1µM
*
*
*
Figure 15 A
H1339
[Ca2+
] c (n
M)
0
20
40
60
80
100
120
140
160
180
200
DMSO GDC-0449 50 µM Cisplatin 1µM GDC-0449 50 µM + Cisplatin 1 µM
Figure 15 B
*
*
*
Figure 15. Effect of GDC-0449 on [Ca2+]c in HCC and H1339 cells: The 50 µM GDC-
0449, 1 µM cisplatin and 50 µM GDC-0449 combined with 1 µM cisplatin treated groups
showed significantly increased [Ca2+]c in both HCC and H1339 cells. (n=3, * = P<0.05
versus control group)
In the cisplatin resistant cells, 1 µM cispatin failed to induce a [Ca2+]c increase. In HCC-Res
cells, after the treatment of GDC-0449 with or without cisplatin, the [Ca2+]c was increased

73
from 43.8 ±1.0 nM of the control group to 140±3.5 nM and 163.3±6.5 nM. In H1339-Res
cells, after the treatment of GDC-0449 with or without cisplatin, the [Ca2+]c was increased
from 43.2 ±0.6 nM of the control group to 149.4±4.0 nM and 150.9±2.4 nM. (n = 3) (Figure
16)
HCC-Res
[Ca2+
] c (n
M)
0
20
40
60
80
100
120
140
160
180
DMSO GDC-0449 50 µM Cisplatin 1µM
*
*
Figure 16 A
GDC-0449 50 µM + Cisplatin 1 µM
H1339-Res
[Ca2+
] c (n
M)
0
20
40
60
80
100
120
140
160
180* *
Figure 16 B
DMSO GDC-0449 50 µM Cisplatin 1µM GDC-0449 50 µM + Cisplatin 1 µM

74
Figure 16. Effect of GDC-0449 on [Ca2+]c in HCC-Res and H1339-Res cells: 50 µM GDC-
0449 and 50 µM GDC-0449 combined with 1 µM cisplatin treated groups showed
significantly increased [Ca2+]c in both HCC-Res and H1339-Res cells. (n=3, * = P<0.05
versus control group)
3.12 GDC-0449 effect on ER Ca2+ concentration
50 µM GDC-0449 has been applied on HCC, H1339, HCC-Res and H1339-Res cells with or
without 1 µM cisplatin 3 h treatment. [Ca2+]ER was measured after 24 h.
In HCC cells, 50 µM GDC-0449, 1 µM cisplatin and 50 µM GDC-0449 combined with 1 µM
cisplatin treated groups showed significantly decreased [Ca2+]ER, as 1168.6±140.2 nM,
1586.3±170.8 nM and 1008.8±77.4 nM respectively, compared with the untreated control
group as 2602.0±427.7 nM. In H1339 cells, [Ca2+]ER dropped from 3840.0±566.7 nM in the
untreated control group to 1279.4±766.6 nM after 50 µM GDC-0449 treatment, 1408.6±88.5
nM after 1 µM cisplatin treatment and 1059.8±79.4 nM after 50 µM GDC-0449 with 1 µM
cisplatin treatment. (n = 3) (Figure 17)
HCC
[Ca2+
] c (n
M)
0
1000
2000
3000
4000
5000
DMSO GDC-0449 50 µM Cisplatin 1µM GDC-0449 50 µM + Cisplatin 1µM
Figure 17 A
*
*
*

75
H1339
0
1000
2000
3000
4000
5000
[Ca2+
] c (n
M)
DMSO GDC-0449 50 µM Cisplatin 1µM GDC-0449 50 µM + Cisplatin 1µM
Figure 17 B
**
*
Figure 17. Effect of GDC-0449 on [Ca2+]ER in HCC and H1339 cells: 50 µM GDC-0449, 1
µM cisplatin and 50 µM GDC-0449 combined with 1 µM cisplatin treated groups showed
significantly decreased [Ca2+]ER in both HCC and H1339 cells. (n=3, * = P<0.05 versus
control group)
In the cisplatin resistant cells, 1 µM cispatin failed to cause [Ca2+]ER decrease. In HCC-Res
cells, after the treatment of GDC-0449 with or without cisplatin, the [Ca2+]ER decreased from
3323.3±166.1 nM of the control group to 1607.3±93.3 nM and 1550.0±47.1 nM. In H1339-
Res cells, after the treatment of GDC-0449 with or without cisplatin, the [Ca2+]ER decreased
from 2871.2 ±181.2 nM of the control group to 1706.8±54.7 nM and 1928.5±100.5 nM. (n =
3) (Figure 18)

76
HCC-Res
0
1000
2000
3000
4000
5000
DMSO GDC-0449 50 µM Cisplatin 1µM GDC-0449 50 µM + Cisplatin 1µM
[Ca2+
] c (n
M)
* *
Figure 18 A
H1339-Res
0
1000
2000
3000
4000
5000
[Ca2+
] c (n
M)
DMSO GDC-0449 50 µM Cisplatin 1µM GDC-0449 50 µM + Cisplatin 1µM
Figure 18 B
**
Figure 18. Effect of GDC-0449 on [Ca2+]ER in HCC-Res and H1339-Res cells: 50 µM
GDC-0449 and 50 µM GDC-0449 combined with 1 µM cisplatin treated groups showed
significantly decreased [Ca2+]ER in both HCC-Res and H1339-Res cells. (n=3, * = P<0.05
versus control group)
3.13 Effect of GDC-0449 on SERCA, IP3R expression in HCC-Res and H1339-Res cells
In a previous study, an altered expression of SERCA and IP3R was detected in cisplatin
resistant cells. In order to investigate whether the altered Ca2+ homeostasis trigged by GDC-

77
0449 was caused by an increased expression of IP3R or decreased expression of SERCA in
HCC-Res and H1339-Res cells, the expression of SERCA and IP3R were tested after the cells
were treated with 50 µM GDC-0449 for 24h with or without 1 µM cisplatin treatment for 3h.
SERCA and IP3R were stably expressed in HCC-Res and H1339-Res cells. Nevertheless, the
expression of both proteins was not significantly changed after the exposure to GDC-0449
with or without cisplatin. (n = 3) (Figure 19)
HCC-Res SERCA
0
20
40
60
80
100
120
140
DMSO Cisplatin 1 µM GDC-0449 50 µM GDC-0449 50 µM+ Cispaltin 1 µM
RO
I / fl
-act
in
Figure 19 A
HCC IP3R
RO
I / fl
-act
in
0
20
40
60
80
100
120
140
DMSO Cisplatin 1 µM GDC-0449 50 µM GDC-0449 50 µM+ Cisplatin 1 µM
Figure 19 B

78
H1339-Res SERCA
0
20
40
60
80
100
120
140
DMSO Cisplatin 1 µM GDC-0449 50 µM GDC-0449 50 µM+ Cispatin 1 µM
RO
I / fl
-act
inFigure 19 C
H1339-Res IP3R
RO
I / fl
-act
in
0
20
40
60
80
100
120
140
DMSO Cispatin 1 µM GDC-0449 50 µM GDC-0449 50 µM+ Cispatin 1 µM
Figure 19 D

79
Figure 19. Effect of GDC-0449 on the expression of SERCA and IP3R in HCC-Res and
H1339-Res cells: A difference in the expression of SERCA and IP3R compared with control
group was not observed in HCC-Res and H1339-Res cells after treatments. (n=3)
80
4 DISCUSSION
4.1 Effect of Hedgehog pathway inhibitor on lung cancer cell lines
Inhibitors of the Hh molecular signaling pathway have emerged in recent years as a promising
new class of potential therapeutics for cancer treatment. Within the identified wide variety of
small molecules that target different members of Hh pathway, GDC-0449 has been entered
phase I and phase II clinical trials because of its effectiveness and excellent tolerance, but not
in lung cancer yet. In this work, it was the first time to show that Hh pathway inhibitor GDC-
0449 inhibited cell growth in a NSCLC (lung adeno-carcinoma) cell line and a SCLC cell line.
This effect was additional to the cytotoxic effects of the conventional chemotherapy
medication cisplatin. Further more, GDC-0449 managed to inhibit the cell growth in cisplatin
resistant lung cancer cells as well, to which cisplatin had no therapeutic effect. The
combination of GDC-0449 and cisplatin did not show a significant additional inhibitory effect
in the cisplatin resistant cells but the cell survival fraction was reduced slightly in the
combined treatment groups. The cell growth inhibitory effect of GDC-0449 on lung cancer
cell lines agrees the effect of another Hh pathway receptor SMO inhibitor cyclopamine on
SCLC cell line NCI-H249 [82].
The protein expression of Hh pathway components Shh, Patched, SMO, Gli-1 and Bmi-1,
which has been found to mediate the Hh pathway regulation of the self-renewal of normal and
malignant stem cells, was investigated in the study. In NSCLC cell line HCC and SCLC
H1339, all the proteins were expressed substantially. It was reported by Watkins et al. that
analysis of SCLC tissue showed five out of ten tumors expressed both Shh and Gli-1, and out
of 40 NSCLC tumors, nine demonstrated Shh expression and four of these demonstrated co-
expression of Gli-1 [148].
In HCC cell line, the expression of Shh, Patched, and Gli-1 was reduced by GDC-0449, but
not SMO and Bmi-1. In H1339 cells, the expression of Shh and Bmi-1 were induced while the
expression of Gli-1 was reduced. However, the expression of Patched and SMO was not
affected.
Thus in HCC cells, after the Hh pathway receptor SMO was inhibited by GDC-0449, the
expression of the pathway ligand Shh was reduced because of a paracrine requirement for Hh
signaling in NSCLC. Yauch et al. found in mouse stroma xenograft tumor model that Hh
ligands produced by the implanted tumor cells activated the Hh pathway in the surrounding
stroma [112]. The down-regulated Shh level by GDC-0449 in the microenvironment could

81
result in the further inhibition of the Hh pathway activity. But the expression of Shh was up
regulated by GDC-0449 in SCLC H1339 cells, which indicated that in SCLC another
regulation mechanism of Hh pathway might exist. Hibi et al. reported the functional autocrine
loop, which was constituted by co-expression of the KIT receptor tyrosine kinase and its
ligand stem cell factor, in SCLC tumors and cell lines in 1991 [149]. Shh can signal in an
autocrine pattern, affecting the cells in which it is produced and activate Hh pathway [83, 88-
90]. Thus Shh might be one of the effectors involved in SCLC growth regulation. When the
Hh pathway activity is inhibited by GDC-0449, the SCLC cells may compensate the lack of
Hh pathway function by secreting more pathway ligand.
Patched is one of the Hh genes whose expression is regulated by Hh signaling and it was
found in SCLC NCI-H249 cells, Patched mRNA expression was reduced by cyclopamine
[82]. In HCC cells, the expression of Patched was down regulated at the protein level, which
might be due to the down regulation of Patched expression. Although in H1339 cells Patched
protein was not significantly reduced, a decrease still might happen at mRNA level and
another regulatory factors might affect the transcription process during the protein synthesis
process.
In both cell lines, the expression of SMO was not affected significantly by GDC-0449. These
results suggest mechanism responsible to SMO inhibition resides with GDC-0449 binding
rather than SMO protein expression. It was shown in the work from Liu’s group that the
expression of SMO mRNA was decreased by cyclopamine [80]. However, the functional role
of the phosphorylation of SMO in Hh pathway activity is required [150]. Although the
expression of SMO might not be altered, GDC-0449 might still regulate the phosphorylation
of SMO to reduce the activity of Hh signaling.
Gli-1 has been used as an indicator of Hh signaling activity. The expression of Gli-1 at both
mRNA level and protein level is widely used to judge the effectiveness of Hh pathway
inhibitor. In HCC cells and H1339 cells, the expression of Gli-1 was reduced significantly by
GDC-0449 treatment. This agrees with the work from Bhattacharya et al. in ovarian cancer
that the Gli-1 mRNA expression was reduced by cyclopamine [151].
Since Bmi-1 is critical for lung tumorigenesis and bronchioalveolar stem cell expansion [79]
and the regulatory function of Hh signaling in self-renewal of normal and malignant human
mammary stem cell is mediated by Bmi-1 as a downstream factor [80]. Due to the important
roles Bmi-1 plays in cancer and cancer stem cell function, the expression of Bmi-1 was tested
in order to investigate the connection between Bmi-1 and Hh signaling in lung cancer. The
expression of Bmi-1 was detected in both NSCLC and SCLC cell lines and the application of
82
GDC-0449 increased the expression of Bmi-1 in H1339 cells. So in HCC cells, the Hh
pathway activity did not affect Bmi-1 expression but in H1339 cells. A compensation
mechanism might be employed in H1339 cells. As more Shh was secreted by H1339 in
autocrine regulation, the over-expressed Shh may increase the expression of Bmi-1 in order to
regulate proliferation of tumor cells and cancer stem cells, while Shh cannot activate Hh
pathway due to the inhibition of SMO from GDC-0449. This agrees to the result that the
activation of Hh pathway by Shh increased the mRNA expression of Bmi-1 and when Hh
pathway inhibitor cyclopamine was presented, the effect was reversed [80].
So these data show that GDC-0449 induces growth inhibition in NSCLC and SCLC cells
expressing Hh pathway proteins by specific inhibition of the Hh pathway. The stable
expression of the Hh pathway proteins provides evidence of persistent activation of Hh
signaling in lung cancer. GDC-0449 inhibits the Hh pathway function effectively by affecting
the protein expression of the pathway partners, but in the two different cell lines, various
mechanism presents and especially in SCLC H1339 cells, a compensation regulation might
take place by the autocrine Shh and the up regulation of the expression of cancer stem cell
related Bmi-1.
4.2 Cancer stem cell in lung cancer cell lines
In HCC and H1339 cells, the SP cells were detected after Hoechst 33342 staining with the
fraction less than 1%. This is in agreement with the research work from Salcido et al., who
reported less than 1% SP cells in several SCLC cell lines [152]. In NSCLC cell lines, 1.5% to
6.1% SP fraction has been reported [153]. However, the investigation with human tumor
samples found the SP fraction less than 1% in most of the cases. Although different groups
have reported various SP fractions from 0.1% to 24.0% in lung cancer cell lines, it could be
explained by the mechanism of Hoechst staining [154]. Since its initial report approximately
10 years ago, the SP phenotype, defined by the rates of the DNA dye Hoechst accumulation in
a cell-type dependent manner, has provided a simple approach for the stem cell enrichment
from a broad range of tissue types. This method is independent to of surface phenotype
identification and different from specific combination, it is a kinetic process. Thus, the SP
fraction may vary from experiments but as long as ABC-transporter inhibitor could inhibit the
SP phenomenon and the low stained cell population could be refined afterwards, the SP cells
as CSC-like cells can be detected in lung cancer cells. More essentially, despite differences in
SP size, all studies showed CSC-like properties of SP cells, including chemoresistance, high

83
proliferative capacity, high tumorigenicity in vivo, high invasiveness, self-renew and
repopulating ability [153].
4.3 Effect of GDC-0449 on cancer stem cells
First-line chemotherapy can lead to encouraging responses in lung cancer, but unfortunately
during the process of treatment, resistance to chemotherapy frequently occurs as a major
obstacle to successful cancer treatment and ultimately limits the life expectancy of the patient.
The over-expression of cellular transport proteins of ABC transporters in CSCs is one
explanation to this phenomenon. As CSCs are chemo-resistant, they survive chemotherapy,
and because of their proliferation ability, they reestablish the tumor burden. The SP cells were
discovered to have self-renewal and repopulating abilities, which are specialties of the cancer
stem cells. The SP cells could be the cancer stem cells in lung cancer cell lines and
responsible to the MDR of cancer cells. The Hh pathway receptor SMO was found only in SP
cells, which indicates the over activity of Hh pathway. The activity of Hh pathway in SP cells
would allow the SP cells to promote proliferation, inhibit differentiation and maintain the
stem cell status. So the application of Hh pathway inhibitor can inhibit the Hh pathway
activity in SP cells, since the SP fraction in lung cancer cells was reduced significantly by
GDC-0449. This agrees with the result from Bar et al. that the cyclopamine-mediated Hh
pathway inhibition depletes stem-like cancer cells in glioblastoma, in which was shown that
cyclopamine decreased SP fraction in the glioblastoma multiforme neurospheres [88]. Zhang
et al. stated that Hh pathway inhibitor HhAntag691 (GDC-0449) is a potent inhibitor of ABC
transporters ABCG2/BCRP and is a mild inhibitor of ABCB1/Pgp [155]. It was found also in
my work that GDC-0449 could inhibit the efflux of DNA dye via ABC transporters and the
lower staining profile of the lung cancer cell lines was inhibited. The cell growth inhibiting
effects of GDC-0449 is not only due to the inhibition of Hh pathway but also through
inhibition of ABC transporters, so targeting Hh pathway might be one way to overcome MDR.
The effectiveness of GDC-0449 in cisplatin resistant lung cancer cells, which was found in
my study, strongly supports that contention. The cancer stem cell SP cells in cispatin resistant
lung cancer cells were inhibited effectively by GDC-0449, which contributes to the GDC-
0449 effect to the cell growth in cisplatin resistant cells. GDC-0449 inhibits the ABC
transporters, which might be over-expressed in cisplatin resistant cells, and the cells could not
pump cispatin extracellularly. As a result, the resensitization in the chemo-therapy resistant
cells could take place. The combination of GDC-0449 and cispatin seems particularly

84
reassuring, because cisplatin could effectively reduce the tumor mass while GDC-0449 could
target the CSCs responsible for cancer relapse.
GDC-0449 has progressed into human clinical trials, and positive results in patients with local
or metastatic advanced basic cell carcinoma (BCC) were reported. In the study with the scale
of 33 patients, 2 patients had a complete response, 16 had partial response, and 11 had stable
disease. No dose-limiting toxic effects were observed during the study period of 9.8 months
[58]. But relapse was also observed after GDC-0449 treatment in 1 patient with
medulloblastoma. Following relapse, molecular profiling of a tumor sample from the
medulloblastoma patient revealed that there was a single point mutation in SMO that
prevented the binding of GDC-0449, thereby conferring resistance to treatment [114]. Focal
amplifications of the Hh pathway transcription factor Gli 2 and the Hh target gene cyclin D1
were observed in GDC-0449 resistant medulloblastoma models, indicating the resistance may
occur downstream of SMO [156]. Thus, other Hh pathway inhibitors targeting Gli-1 could be
combined with GDC-0449 to avoid the resistance.
4.4 Ca2+ homeostasis in lung cancer cell lines and lung cancer stem cells The origin of the various lung carcinomas is in a controversial discussion. Squamous cell lung
carcinomas origin from metaplastic bronchial epithelium and small cell lung carcinomas are
believed to origin from neuro-epithelial bodies. But the origin of large cell carcinomas and
adeno carcinomas is less clear [157]. In this work, normal human bronchial epithelial cells in
primary culture taken by bronchoscope were chosen as a normal tissue to compare with the
malignant cell lines for the calcium homeostasis investigation. It is different from the former
research works, in which ‘normal’ human bronchial epithelial cell line (NHBE) was used as a
reference. The bronchial cell line constituted compromise since the modified cell line can not
fully represent in vivo situation and especially in the measurement of Ca2+ concentration
because the Ca2+ homeostasis is different in vivo cells from in the cells after passages. In my
work, HCC, H1339 cells and HCC, H1339 cisplatin resistant cells showed a higher [Ca2+]ER
than the BEC cells. In the work of Bergner et al., NHBE was found to have a higher [Ca2+]ER
than HCC and H1339 cells [158]. This difference may be explained by the usage of BEC
instead of NHBE.
It has been known for a long time that Ca2+ signals govern a host of vital cell functions and so
are necessary for cell survival. More recently, it has become more clear that cellular Ca2+
overload or perturbation of intracellular Ca2+ compartmentalization can cause cytotoxicity and

85
trigger apoptosis or necrotic cell death [159]. Ca2+-dependent processes are involved with the
caspases, the mainstream apoptosis executioners, and the interfering with the sequestration of
Ca2+ into intracellular pools as ER can be sufficient to trigger apoptosis as part of a stress
response [160]. The earliest link that was found between Ca2+ and apoptosis was that Ca2+
induced a typical apoptosic ladder-like DNA fragmentation pattern in isolated thymocytes
nuclei through the activation of a Ca2+ -and Mg2+ -dependent endonuclease [161]. It has been
discovered in mouse T-lymphocytes that high-dose pharmacologically raising cytoplasmic
Ca2+ resulted in apoptosis but low-dose treatment gave a resistant capacity to apoptosis [162].
It is shown in my work that HCC, H1339 cells and HCC, H1339 cisplatin resistant cells
showed a higher [Ca2+]c than the BEC cells. The higher [Ca2+]c base line in cancer cells can
provide a protection from the raise of [Ca2+]c by the Ca2+ released from ER when the cells are
under stress and damage. The HCC, H1339 cisplatin resistant cells showed an even higher
[Ca2+]c than HCC and H1339 cells, which indicated that the resistant cells are less sensitive to
chemotherapy medication due to the less sensitiveness to Ca2+ efflux in apoptosis resulted
from a higher cytoplasmic Ca2+ concentration base line.
SERCA is an ER transmembrane protein and serves to maintain the concentration gradient
between the cytoplasm and the ER by pumping calcium into the ER. SERCA has been
regarded as a potential mediator of alterations of the ER Ca2+ content. The altered expression
of SERCA in SR leaded to increased Ca2+ content and it correlated to the hyperreactivity in an
asthma model [163]. The downregulation of SERCA2 protein has been found in cancer
tissues in several studies of oral cancer, colon cancer and thyroid cancer [137-139, 141], but
in colorectal cancer, Chung et al. reported the increased SERCA2 mRNA in normal tissue
[140]. Legrand et al. showed that in prostate cancer cells, proliferation was related with higher
[Ca2+]ER and increased SERCA 2 expression [164]. Apparently the relationship between
SERCA expression, [Ca2+]ER, and tumorgenesis varies between studies, cell types and also
differentiation status. Although the data of SERCA activity is still lacking in many cancers, an
aberrant ER homeostasis is involved in malignant transformation and tumorgenesis. This
agrees with the result of SERCA protein expression in HCC and H1339 SP. Although the
variation of SERCA expression was exhibited in different lung cancer cells, the cancer stem
cell shows a altered ER Ca2+ channel expression from the bulk cancer cells, while different
ATPase activities may exist.
The IP3R is a Ca2+ channel releasing Ca2+ from ER upon the binding of IP3 [165]. IP3R2
mRNA was found amplified in NSCLC patient tissue samples compared with normal tissue
[132]. An overexpression of IP3R3 mRNA was detected in gastric cancer patient tissue

86
samples but the expression of the Ca2+ channel was not detectable at protein level because of
the weak expression, as well as in normal gastric epithelial cells. At the same time, in
malignant ascites derived gastric cancer cell lines an overexpression of IP3R was shown at
both mRNA and protein level [131]. Thus Sakakura et al. proposed a role for the IP3R in the
transition to a metastatic phenotype. In my work, the higher expression of IP3R was found in
HCC and H1339 SP cells, which suggests the function of the cancer stem cells in the
metastatic process.
4.5 Effect of Hedgehog pathway inhibitor on the Ca2+ homeostasis in lung cancer cell lines
Research on the relationship between cancer stem cell and Ca2+ homeostasis has not yet been
widely carried out. Sugimura et al. found that Wnt signalling, which is involved in stem cell
maintenance, is mediated by intracellular calcium ion and JNK in T cells [167]. This also
indicates the possible connection between Hh pathway and Ca2+ homeostasis. The growth
inhibition effect of GDC-0449 is the specific inhibition of lung cancer cell proliferation and/or
induction of apoptosis. It has been demonstrated that increased [Ca2+]c is involved in number
of cellular event, including apoptotic pathways. The evaluation of [Ca2+]c might be result of
Ca2+ enters from extracellular space or Ca2+ released from intracellular Ca2+ stores. In
apoptosis, it results in an increase in the mitochondrial Ca2+ concentration, which opens the
permeability transition pore followed by an efflux of cytochrome C. As a consequence,
cytochrome C amplifies the Ca2+ release from the ER and activates the intrinsic apoptotic
pathway via caspase 9 [168]. Zhao et al. discovered Asterosaponin 1 can induce ER stress-
associated apoptosis in A549 human lung cancer cells [169]. Cisplatin was found to increase
apoptosis rate by the activation of IP3R motivated Ca2+ entry in Hela-S3 cells, but meanwhile
the change of [Ca2+]ER was not measured [170]. In a previous study, the cisplatin resistance in
lung cancer cells was mediated by a lower [Ca2+]ER caused by altered expression of IP3R and
SERCA [158]. GDC-0449 was found effective to reduce the growth of cispatin resistant cells.
After the application of GDC-0449, [Ca2+]c in both HCC, H1339 cells and HCC, H1339
cisplatin resistant cells was evaluated and at the same time, a related reduction of [Ca2+]ER
was also detected. GDC-0449 inhibits cell growth via the release of Ca2+ from ER and the
increase of intracellular Ca2+ concentration, which may induce apoptosis of the lung cancer
cell. The increase in [Ca2+]c triggered by GDC-0449 could have been mediated by an altered
expression of IP3R and/or SERCA. Nevertheless, the expression of IP3R and SERCA in

87
cispatin resistant cells were found to be unchanged after the exposure to GDC-0449. This
might be explained by the possibility of functional alteration of IP3R and/or SERCA without
the change of expression. The phosphorylation of the Ca2+ regulating proteins might be
affected in case the other apoptotic related factors, which interact with IP3R and/or SERCA.
For instance, pro- and anti-apoptotic Bcl-2-family members specifically determine the
phosphorylation status of IP3R1. Activation of Bcl-2 function may result in
hyperphosphorylation of IP3R and an enhanced Ca2+ release [171].
4.6 Outlook
Worldwide, lung cancer is the most common cancer in terms of both incidence and mortality
with the highest rates in Europe and North America. First-line chemotherapy often leads to
encouraging responses in lung cancer, but during the treatment process, resistance to the
chemotherapy frequently occurs and ultimately limits the life expectancy of the patient. The
existence of CSC is an possible explanation for this phenomenon. Since CSCs are chemo-
resistant, they survive the chemotherapy and reestablish the tumor burden afterwards. A better
understanding of the CSC mechanism is required, which includes the generation of CSC, the
functional evidences of CSC to proliferate the cancer bulk and the escape mechanism of CSC
from conventional cancer therapy. The cancer specific markers for CSCs need to be found and
methods to detect CSCs in vivo need to be established, in order to use the CSC status in
cancer as one indicate for the relapse possibility and one index for therapy effectiveness.
Therefore, the incorporation of anti-CSC component into the therapeutic regiments casts light
into the cancer therapy field. A new therapy strategy could be to combine the chemotherapy
medication, which executes the tumor bulk, with the anti-CSC component as GDC-0449,
which prevents CSCs from proliferating cancer cells after the withdrawing of chemotherapy.
As GDC-0449 has not yet been evaluated in lung cancer, although it has entered clinical trials
in several other cancers and showed promising effect, our findings support the further clinical
usage of GDC-0449 in lung cancer and GDC-0449 used alone or combined with other
conventional chemotherapy medications would be new lung cancer therapies. The other
‘druggable’ Hh pathway inhibitors combined with SMO inhibitor would also provide new
therapeutic options. In case of the SMO mutations, the potential resistance to SMO inhibitors
could be bypassed by the simultaneous use of both SMO inhibitors and Gli-1 inhibitors. The
combination with anti-oncogenic molecules as anti-RAS, AKT, or MEK molecules, will be
essential in those cases in which over-activation of Hh pathway occurs through oncogenic or

88
loss of tumor suppressive inputs. A new class of therapeutic agents as combination partner
could be investigated in the future.
Moreover, the further research into Hh pathway activation mechanism in lung cancer still
needs to be done, for instance the down stream factors of Hh pathway and the cross talk
between Hh pathway and other oncogenic pathways. Since it has been found in our work that
Hh pathway inhibitor influences the homeostasis of calcium, as the universe second
messenger, the cross talk between Hh pathway and calcium signaling was shown. To build
up a network to provide a distinct comprehension of calcium signaling and Hh pathway is
necessary to understand tumorigenesis and furthermore to set up new cancer therapy method.

89
5 CONCLUSION
In this study, the Hh pathway inhibitor GDC-0449 showed dose-dependent inhibitory effects
on cell growth in both NSCLC (adeno-carcinoma) cell line HCC and SCLC cell line H1339.
The combination of GDC-0449 and cisplatin gave an additional inhibitory effect. GDC-0449
could also inhibit the cell growth in cisplatin resistant HCC and H1339 cells, although the
combination of GDC-0449 and cisplatin could only give a slight but not significant additional
effect.
SP cells as cancer stem cells could be found in HCC and H1339 cells. Only the SP cells
showed the repopulation ability but not the non-SP cells. The expression of conventional stem
cell markers such as CD133, CD117 and CD34 were not detectable in HCC and H1339 SP
cells.
GDC-0449 could inhibit the SP cell fraction in both HCC and H1339 cells. So the inhibitory
effect of GDC-0449 on cell growth may be mediated via SP.
GDC-0449 affected the expression of the Hh pathway components in both HCC and H1339
cells. In HCC cells, GDC-0449 inhibited the activity of the Hh pathway and the down-
regulation of Shh, Patched and Gli-1 could be shown. In H1339 cells, GDC-0449 could also
inhibit the pathway activity and decrease the expression of Gli-1 in an autocrine pattern due
the over-expression of Shh. The inhibition of Hh pathway increased the expression of Bmi-1
to compensate the loss of Hh pathway function. The Hh pathway activity could be detected
only in SP cells from HCC and H1339 cells.
HCC and H1339 cells showed significantly higher [Ca2+]c and [Ca2+]ER than the human
bronchial epithelium cells.
The application of GDC-0449 on HCC and H1339 naïve and cisplatin resistant cells increased
[Ca2+]c by decreasing [Ca2+]ER. GDC-0449 induced Ca2+ release from ER into cytoplasm in
HCC and H1339 naïve and cisplatin resistant cells. The Ca2+ overload could lead to apoptosis,
which was related to the cell growth inhibitory effect of GDC-0449 in lung cancer cells. The
expression of SERCA and IP3R was not detectably influenced by GDC-0449. The effect of
GDC-0449 on lung cancer cell Ca2+ -regulating machinery was not via the alternation of the
expression of ER Ca2+ regulating channels.
90
6 REFERENCES
1. Engelhardt, J.F., Stem cell niches in the mouse airway. Am J Respir Cell Mol Biol, 2001. 24(6): p. 649-52.
2. Engelhardt, J.F., et al., Progenitor cells of the adult human airway involved in submucosal gland development. Development, 1995. 121(7): p. 2031-46.
3. Giangreco, A., S.D. Reynolds, and B.R. Stripp, Terminal bronchioles harbor a unique airway stem cell population that localizes to the bronchoalveolar duct junction. Am J Pathol, 2002. 161(1): p. 173-82.
4. Hong, K.U., et al., Clara cell secretory protein-expressing cells of the airway neuroepithelial body microenvironment include a label-retaining subset and are critical for epithelial renewal after progenitor cell depletion. Am J Respir Cell Mol Biol, 2001. 24(6): p. 671-81.
5. Kim, C.F., et al., Identification of bronchioalveolar stem cells in normal lung and lung cancer. Cell, 2005. 121(6): p. 823-35.
6. Bonnet, D. and J.E. Dick, Human acute myeloid leukemia is organized as a hierarchy that originates from a primitive hematopoietic cell. Nat Med, 1997. 3(7): p. 730-7.
7. Al-Hajj, M., et al., Prospective identification of tumorigenic breast cancer cells. Proc Natl Acad Sci U S A, 2003. 100(7): p. 3983-8.
8. Guzman, M.L., et al., Preferential induction of apoptosis for primary human leukemic stem cells. Proc Natl Acad Sci U S A, 2002. 99(25): p. 16220-5.
9. Wolf, N.S., et al., In vivo and in vitro characterization of long-term repopulating primitive hematopoietic cells isolated by sequential Hoechst 33342-rhodamine 123 FACS selection. Exp Hematol, 1993. 21(5): p. 614-22.
10. Lalande, M.E. and R.G. Miller, Fluorescence flow analysis of lymphocyte activation using Hoechst 33342 dye. J Histochem Cytochem, 1979. 27(1): p. 394-7.
11. Schinkel, A.H., et al., Normal viability and altered pharmacokinetics in mice lacking mdr1-type (drug-transporting) P-glycoproteins. Proc Natl Acad Sci U S A, 1997. 94(8): p. 4028-33.
12. Zhou, S., et al., The ABC transporter Bcrp1/ABCG2 is expressed in a wide variety of stem cells and is a molecular determinant of the side-population phenotype. Nat Med, 2001. 7(9): p. 1028-34.
13. Wu, C. and B.A. Alman, Side population cells in human cancers. Cancer Lett, 2008. 268(1): p. 1-9.
14. Goodell, M.A., Multipotential stem cells and 'side population' cells. Cytotherapy, 2002. 4(6): p. 507-8.
15. Hirschmann-Jax, C., et al., A distinct "side population" of cells with high drug efflux capacity in human tumor cells. Proc Natl Acad Sci U S A, 2004. 101(39): p. 14228-33.
16. Szotek, P.P., et al., Ovarian cancer side population defines cells with stem cell-like characteristics and Mullerian Inhibiting Substance responsiveness. Proc Natl Acad Sci U S A, 2006. 103(30): p. 11154-9.
17. Wu, C., et al., Side population cells isolated from mesenchymal neoplasms have tumor initiating potential. Cancer Res, 2007. 67(17): p. 8216-22.
18. Chiba, T., et al., Side population purified from hepatocellular carcinoma cells harbors cancer stem cell-like properties. Hepatology, 2006. 44(1): p. 240-51.
19. Ho, M.M., et al., Side population in human lung cancer cell lines and tumors is enriched with stem-like cancer cells. Cancer Res, 2007. 67(10): p. 4827-33.
20. Haraguchi, N., et al., Characterization of a side population of cancer cells from human gastrointestinal system. Stem Cells, 2006. 24(3): p. 506-13.

91
21. Wang, J., et al., Identification of cancer stem cell-like side population cells in human nasopharyngeal carcinoma cell line. Cancer Res, 2007. 67(8): p. 3716-24.
22. Reya, T., et al., A role for Wnt signalling in self-renewal of haematopoietic stem cells. Nature, 2003. 423(6938): p. 409-14.
23. Willert, K., et al., Wnt proteins are lipid-modified and can act as stem cell growth factors. Nature, 2003. 423(6938): p. 448-52.
24. Wood, L.D., et al., The genomic landscapes of human breast and colorectal cancers. Science, 2007. 318(5853): p. 1108-13.
25. Higgins, C.F., Multiple molecular mechanisms for multidrug resistance transporters. Nature, 2007. 446(7137): p. 749-57.
26. Dean, M., A. Rzhetsky, and R. Allikmets, The human ATP-binding cassette (ABC) transporter superfamily. Genome Res, 2001. 11(7): p. 1156-66.
27. Stavrovskaya, A.A. and T.P. Stromskaya, Transport proteins of the ABC family and multidrug resistance of tumor cells. Biochemistry (Mosc), 2008. 73(5): p. 592-604.
28. Sarkadi, B., et al., Human multidrug resistance ABCB and ABCG transporters: participation in a chemoimmunity defense system. Physiol Rev, 2006. 86(4): p. 1179-236.
29. Szakacs, G., et al., Targeting multidrug resistance in cancer. Nat Rev Drug Discov, 2006. 5(3): p. 219-34.
30. Annereau, J.P., et al., Analysis of ATP-binding cassette transporter expression in drug-selected cell lines by a microarray dedicated to multidrug resistance. Mol Pharmacol, 2004. 66(6): p. 1397-405.
31. Dean, M., T. Fojo, and S. Bates, Tumour stem cells and drug resistance. Nat Rev Cancer, 2005. 5(4): p. 275-84.
32. Raaijmakers, M.H., ATP-binding-cassette transporters in hematopoietic stem cells and their utility as therapeutical targets in acute and chronic myeloid leukemia. Leukemia, 2007. 21(10): p. 2094-102.
33. Good, J.R. and A. Kuspa, Evidence that a cell-type-specific efflux pump regulates cell differentiation in Dictyostelium. Dev Biol, 2000. 220(1): p. 53-61.
34. Ruefli, A.A., et al., P-glycoprotein inhibits caspase-8 activation but not formation of the death inducing signal complex (disc) following Fas ligation. Cell Death Differ, 2002. 9(11): p. 1266-72.
35. Varjosalo, M. and J. Taipale, Hedgehog: functions and mechanisms. Genes Dev, 2008. 22(18): p. 2454-72.
36. Nusslein-Volhard, C. and E. Wieschaus, Mutations affecting segment number and polarity in Drosophila. Nature, 1980. 287(5785): p. 795-801.
37. Ingham, P.W. and A.P. McMahon, Hedgehog signaling in animal development: paradigms and principles. Genes Dev, 2001. 15(23): p. 3059-87.
38. Porter, J.A., K.E. Young, and P.A. Beachy, Cholesterol modification of hedgehog signaling proteins in animal development. Science, 1996. 274(5285): p. 255-9.
39. Porter, J.A., et al., Hedgehog patterning activity: role of a lipophilic modification mediated by the carboxy-terminal autoprocessing domain. Cell, 1996. 86(1): p. 21-34.
40. Tian, H., et al., Hedgehog signaling is restricted to the stromal compartment during pancreatic carcinogenesis. Proc Natl Acad Sci U S A, 2009. 106(11): p. 4254-9.
41. Nakano, Y., et al., Inactivation of dispatched 1 by the chameleon mutation disrupts Hedgehog signalling in the zebrafish embryo. Dev Biol, 2004. 269(2): p. 381-92.
42. Goodrich, L.V., et al., Altered neural cell fates and medulloblastoma in mouse patched mutants. Science, 1997. 277(5329): p. 1109-13.
43. Chen, Y. and G. Struhl, Dual roles for patched in sequestering and transducing Hedgehog. Cell, 1996. 87(3): p. 553-63.

92
44. Briscoe, J., et al., A hedgehog-insensitive form of patched provides evidence for direct long-range morphogen activity of sonic hedgehog in the neural tube. Mol Cell, 2001. 7(6): p. 1279-91.
45. Johnson, R.L., L. Milenkovic, and M.P. Scott, In vivo functions of the patched protein: requirement of the C terminus for target gene inactivation but not Hedgehog sequestration. Mol Cell, 2000. 6(2): p. 467-78.
46. Cohen, M.M., Jr., Craniofacial anomalies: Clinical and molecular perspectives. Ann Acad Med Singapore, 2003. 32(2): p. 244-51.
47. Motoyama, J., et al., Ptch2, a second mouse Patched gene is co-expressed with Sonic hedgehog. Nat Genet, 1998. 18(2): p. 104-6.
48. Kawakami, T., et al., Mouse dispatched mutants fail to distribute hedgehog proteins and are defective in hedgehog signaling. Development, 2002. 129(24): p. 5753-65.
49. Chen, W., et al., Activity-dependent internalization of smoothened mediated by beta-arrestin 2 and GRK2. Science, 2004. 306(5705): p. 2257-60.
50. Kuwabara, P.E. and M. Labouesse, The sterol-sensing domain: multiple families, a unique role? Trends Genet, 2002. 18(4): p. 193-201.
51. Corcoran, R.B. and M.P. Scott, Oxysterols stimulate Sonic hedgehog signal transduction and proliferation of medulloblastoma cells. Proc Natl Acad Sci U S A, 2006. 103(22): p. 8408-13.
52. Alcedo, J., et al., The Drosophila smoothened gene encodes a seven-pass membrane protein, a putative receptor for the hedgehog signal. Cell, 1996. 86(2): p. 221-32.
53. Ayers, K.L. and P.P. Therond, Evaluation Smoothened as a G-protein-coupled receptor for Hedgehog signaling. Trends in cell biology, 2010. 20(5): p. 287-298.
54. Ingham, P.W., et al., Patched represses the Hedgehog signalling pathway by promoting modification of the Smoothened protein. Curr Biol, 2000. 10(20): p. 1315-8.
55. Chen, J.K., et al., Small molecule modulation of Smoothened activity. Proc Natl Acad Sci U S A, 2002. 99(22): p. 14071-6.
56. Sinha, S. and J.K. Chen, Purmorphamine activates the Hedgehog pathway by targeting Smoothened. Nat Chem Biol, 2006. 2(1): p. 29-30.
57. Bijlsma, M.F., et al., Repression of smoothened by patched-dependent (pro-)vitamin D3 secretion. PLoS Biol, 2006. 4(8): p. e232.
58. Von Hoff, D.D., et al., Inhibition of the hedgehog pathway in advanced basal-cell carcinoma. N Engl J Med, 2009. 361(12): p. 1164-72.
59. Ruppert, J.M., et al., The GLI-Kruppel family of human genes. Mol Cell Biol, 1988. 8(8): p. 3104-13.
60. Ruppert, J.M., et al., GLI3 encodes a 190-kilodalton protein with multiple regions of GLI similarity. Mol Cell Biol, 1990. 10(10): p. 5408-15.
61. Kinzler, K.W. and B. Vogelstein, The GLI gene encodes a nuclear protein which binds specific sequences in the human genome. Mol Cell Biol, 1990. 10(2): p. 634-42.
62. Jones, S., et al., Core signaling pathways in human pancreatic cancers revealed by global genomic analyses. Science, 2008. 321(5897): p. 1801-6.
63. Pan, Y. and B. Wang, A novel protein-processing domain in Gli2 and Gli3 differentially blocks complete protein degradation by the proteasome. J Biol Chem, 2007. 282(15): p. 10846-52.
64. Cohen, M.M., Jr., Hedgehog signaling update. Am J Med Genet A, 2010. 152A(8): p. 1875-914.
65. Alkema, M.J., et al., Characterization and chromosomal localization of the human proto-oncogene BMI-1. Hum Mol Genet, 1993. 2(10): p. 1597-603.
66. Alkema, M.J., et al., Identification of Bmi1-interacting proteins as constituents of a multimeric mammalian polycomb complex. Genes Dev, 1997. 11(2): p. 226-40.
93
67. Itahana, K., et al., Control of the replicative life span of human fibroblasts by p16 and the polycomb protein Bmi-1. Mol Cell Biol, 2003. 23(1): p. 389-401.
68. van Lohuizen, M., et al., Identification of cooperating oncogenes in E mu-myc transgenic mice by provirus tagging. Cell, 1991. 65(5): p. 737-52.
69. Haupt, Y., et al., Novel zinc finger gene implicated as myc collaborator by retrovirally accelerated lymphomagenesis in E mu-myc transgenic mice. Cell, 1991. 65(5): p. 753-63.
70. Jacobs, J.J., et al., The oncogene and Polycomb-group gene bmi-1 regulates cell proliferation and senescence through the ink4a locus. Nature, 1999. 397(6715): p. 164-8.
71. Jacobs, J.J., et al., Bmi-1 collaborates with c-Myc in tumorigenesis by inhibiting c-Myc-induced apoptosis via INK4a/ARF. Genes Dev, 1999. 13(20): p. 2678-90.
72. Raaphorst, F.M., et al., Poorly differentiated breast carcinoma is associated with increased expression of the human polycomb group EZH2 gene. Neoplasia, 2003. 5(6): p. 481-8.
73. Raaphorst, F.M., et al., Coexpression of BMI-1 and EZH2 polycomb group genes in Reed-Sternberg cells of Hodgkin's disease. Am J Pathol, 2000. 157(3): p. 709-15.
74. Vonlanthen, S., et al., The bmi-1 oncoprotein is differentially expressed in non-small cell lung cancer and correlates with INK4A-ARF locus expression. Br J Cancer, 2001. 84(10): p. 1372-6.
75. Lessard, J. and G. Sauvageau, Bmi-1 determines the proliferative capacity of normal and leukaemic stem cells. Nature, 2003. 423(6937): p. 255-60.
76. Leung, C., et al., Bmi1 is essential for cerebellar development and is overexpressed in human medulloblastomas. Nature, 2004. 428(6980): p. 337-41.
77. van der Lugt, N.M., et al., Posterior transformation, neurological abnormalities, and severe hematopoietic defects in mice with a targeted deletion of the bmi-1 proto-oncogene. Genes Dev, 1994. 8(7): p. 757-69.
78. Grinstein, E. and P. Wernet, Cellular signaling in normal and cancerous stem cells. Cell Signal, 2007. 19(12): p. 2428-33.
79. Dovey, J.S., et al., Bmi1 is critical for lung tumorigenesis and bronchioalveolar stem cell expansion. Proc Natl Acad Sci U S A, 2008. 105(33): p. 11857-62.
80. Liu, S., et al., Hedgehog signaling and Bmi-1 regulate self-renewal of normal and malignant human mammary stem cells. Cancer Res, 2006. 66(12): p. 6063-71.
81. Ahn, S. and A.L. Joyner, In vivo analysis of quiescent adult neural stem cells responding to Sonic hedgehog. Nature, 2005. 437(7060): p. 894-7.
82. Watkins, D.N., D.M. Berman, and S.B. Baylin, Hedgehog signaling: progenitor phenotype in small-cell lung cancer. Cell Cycle, 2003. 2(3): p. 196-8.
83. Beachy, P.A., S.S. Karhadkar, and D.M. Berman, Tissue repair and stem cell renewal in carcinogenesis. Nature, 2004. 432(7015): p. 324-31.
84. Hahn, H., et al., Mutations of the human homolog of Drosophila patched in the nevoid basal cell carcinoma syndrome. Cell, 1996. 85(6): p. 841-51.
85. Taylor, M.D., et al., Mutations in SUFU predispose to medulloblastoma. Nat Genet, 2002. 31(3): p. 306-10.
86. Wong, A.J., et al., Increased expression of the epidermal growth factor receptor gene in malignant gliomas is invariably associated with gene amplification. Proc Natl Acad Sci U S A, 1987. 84(19): p. 6899-903.
87. Pasca di Magliano, M. and M. Hebrok, Hedgehog signalling in cancer formation and maintenance. Nat Rev Cancer, 2003. 3(12): p. 903-11.
88. Bar, E.E., et al., Cyclopamine-mediated hedgehog pathway inhibition depletes stem-like cancer cells in glioblastoma. Stem Cells, 2007. 25(10): p. 2524-33.
94
89. Clement, V., et al., HEDGEHOG-GLI1 signaling regulates human glioma growth, cancer stem cell self-renewal, and tumorigenicity. Curr Biol, 2007. 17(2): p. 165-72.
90. Karhadkar, S.S., et al., Hedgehog signalling in prostate regeneration, neoplasia and metastasis. Nature, 2004. 431(7009): p. 707-12.
91. Dierks, C., et al., Essential role of stromally induced hedgehog signaling in B-cell malignancies. Nat Med, 2007. 13(8): p. 944-51.
92. Theunissen, J.W. and F.J. de Sauvage, Paracrine Hedgehog signaling in cancer. Cancer Res, 2009. 69(15): p. 6007-10.
93. Yauch, R.L., et al., A paracrine requirement for hedgehog signalling in cancer. Nature, 2008. 455(7211): p. 406-10.
94. Kanda, S., et al., Sonic hedgehog induces capillary morphogenesis by endothelial cells through phosphoinositide 3-kinase. J Biol Chem, 2003. 278(10): p. 8244-9.
95. Pola, R., et al., The morphogen Sonic hedgehog is an indirect angiogenic agent upregulating two families of angiogenic growth factors. Nat Med, 2001. 7(6): p. 706-11.
96. Ingram, W.J., et al., Novel genes regulated by Sonic Hedgehog in pluripotent mesenchymal cells. Oncogene, 2002. 21(53): p. 8196-205.
97. Dierks, C., et al., Expansion of Bcr-Abl-positive leukemic stem cells is dependent on Hedgehog pathway activation. Cancer Cell, 2008. 14(3): p. 238-49.
98. Zhao, C., et al., Hedgehog signalling is essential for maintenance of cancer stem cells in myeloid leukaemia. Nature, 2009. 458(7239): p. 776-9.
99. Peacock, C.D., et al., Hedgehog signaling maintains a tumor stem cell compartment in multiple myeloma. Proc Natl Acad Sci U S A, 2007. 104(10): p. 4048-53.
100. Varnat, F., et al., Human colon cancer epithelial cells harbour active HEDGEHOG-GLI signalling that is essential for tumour growth, recurrence, metastasis and stem cell survival and expansion. EMBO Mol Med, 2009. 1(6-7): p. 338-51.
101. Feldmann, G., et al., Blockade of hedgehog signaling inhibits pancreatic cancer invasion and metastases: a new paradigm for combination therapy in solid cancers. Cancer Res, 2007. 67(5): p. 2187-96.
102. Binns, W., et al., Effects of teratogenic agents in range plants. Cancer Res, 1968. 28(11): p. 2323-6.
103. Keeler, R.F. and W. Binns, Teratogenic compounds of Veratrum californicum (Durand). V. Comparison of cyclopian effects of steroidal alkaloids from the plant and structurally related compounds from other sources. Teratology, 1968. 1(1): p. 5-10.
104. Wang, Y., et al., Selective translocation of intracellular Smoothened to the primary cilium in response to Hedgehog pathway modulation. Proc Natl Acad Sci U S A, 2009. 106(8): p. 2623-8.
105. Rohatgi, R., et al., Hedgehog signal transduction by Smoothened: pharmacologic evidence for a 2-step activation process. Proc Natl Acad Sci U S A, 2009. 106(9): p. 3196-201.
106. Stecca, B., et al., Melanomas require HEDGEHOG-GLI signaling regulated by interactions between GLI1 and the RAS-MEK/AKT pathways. Proc Natl Acad Sci U S A, 2007. 104(14): p. 5895-900.
107. Robarge, K.D., et al., GDC-0449-a potent inhibitor of the hedgehog pathway. Bioorg Med Chem Lett, 2009. 19(19): p. 5576-81.
108. Wong, H., et al., Preclinical assessment of the absorption, distribution, metabolism and excretion of GDC-0449 (2-chloro-N-(4-chloro-3-(pyridin-2-yl)phenyl)-4-(methylsulfonyl)benzamide) , an orally bioavailable systemic Hedgehog signalling pathway inhibitor. Xenobiotica, 2009. 39(11): p. 850-61.
109. Mas, C. and A. Ruiz i Altaba, Small molecule modulation of HH-GLI signaling: current leads, trials and tribulations. Biochem Pharmacol, 2010. 80(5): p. 712-23.

95
110. Molckovsky, A. and L.L. Siu, First-in-class, first-in-human phase I results of targeted agents: highlights of the 2008 American society of clinical oncology meeting. J Hematol Oncol, 2008. 1: p. 20.
111. Rudin, C.M., et al., Treatment of medulloblastoma with hedgehog pathway inhibitor GDC-0449. N Engl J Med, 2009. 361(12): p. 1173-8.
112. Yauch, R.L., et al., Smoothened mutation confers resistance to a Hedgehog pathway inhibitor in medulloblastoma. Science, 2009. 326(5952): p. 572-4.
113. Jiang, J. and C.C. Hui, Hedgehog signaling in development and cancer. Dev Cell, 2008. 15(6): p. 801-12.
114. Peukert, S. and K. Miller-Moslin, Small-molecule inhibitors of the hedgehog signaling pathway as cancer therapeutics. ChemMedChem, 2010. 5(4): p. 500-12.
115. Berridge, M.J., M.D. Bootman, and H.L. Roderick, Calcium signalling: dynamics, homeostasis and remodelling. Nat Rev Mol Cell Biol, 2003. 4(7): p. 517-29.
116. Berridge, M.J., P. Lipp, and M.D. Bootman, The versatility and universality of calcium signalling. Nat Rev Mol Cell Biol, 2000. 1(1): p. 11-21.
117. Carafoli, E., Intracellular calcium homeostasis. Annu Rev Biochem, 1987. 56: p. 395-433.
118. Bootman, M.D., et al., Calcium signalling--an overview. Semin Cell Dev Biol, 2001. 12(1): p. 3-10.
119. Monteith, G.R., et al., Calcium and cancer: targeting Ca2+ transport. Nat Rev Cancer, 2007. 7(7): p. 519-30.
120. Pinton, P. and R. Rizzuto, Bcl-2 and Ca2+ homeostasis in the endoplasmic reticulum. Cell Death Differ, 2006. 13(8): p. 1409-18.
121. Franzini-Armstrong, C. and F. Protasi, Ryanodine receptors of striated muscles: a complex channel capable of multiple interactions. Physiol Rev, 1997. 77(3): p. 699-729.
122. Bennett, D.L., et al., Expression and function of ryanodine receptors in nonexcitable cells. J Biol Chem, 1996. 271(11): p. 6356-62.
123. Jacques-Fricke, B.T., et al., Ca2+ influx through mechanosensitive channels inhibits neurite outgrowth in opposition to other influx pathways and release from intracellular stores. J Neurosci, 2006. 26(21): p. 5656-64.
124. Patton, A.M., et al., Calcium as a molecular target in angiogenesis. Curr Pharm Des, 2003. 9(7): p. 543-51.
125. Bentle, M.S., et al., Calcium-dependent modulation of poly(ADP-ribose) polymerase-1 alters cellular metabolism and DNA repair. J Biol Chem, 2006. 281(44): p. 33684-96.
126. Cullen, P.J. and P.J. Lockyer, Integration of calcium and Ras signalling. Nat Rev Mol Cell Biol, 2002. 3(5): p. 339-48.
127. Bikle, D.D., Y. Oda, and Z. Xie, Calcium and 1,25(OH)2D: interacting drivers of epidermal differentiation. J Steroid Biochem Mol Biol, 2004. 89-90(1-5): p. 355-60.
128. Minaguchi, T., K.A. Waite, and C. Eng, Nuclear localization of PTEN is regulated by Ca(2+) through a tyrosil phosphorylation-independent conformational modification in major vault protein. Cancer Res, 2006. 66(24): p. 11677-82.
129. Cook, S.J. and P.J. Lockyer, Recent advances in Ca(2+)-dependent Ras regulation and cell proliferation. Cell Calcium, 2006. 39(2): p. 101-12.
130. Rizzuto, R. and T. Pozzan, Microdomains of intracellular Ca2+: molecular determinants and functional consequences. Physiol Rev, 2006. 86(1): p. 369-408.
131. Sakakura, C., et al., Possible involvement of inositol 1,4,5-trisphosphate receptor type 3 (IP3R3) in the peritoneal dissemination of gastric cancers. Anticancer Res, 2003. 23(5A): p. 3691-7.

96
132. Heighway, J., et al., Coamplification in tumors of KRAS2, type 2 inositol 1,4,5 triphosphate receptor gene, and a novel human gene, KRAG. Genomics, 1996. 35(1): p. 207-14.
133. Kusner, L.L., A. Mygland, and H.J. Kaminski, Ryanodine receptor gene expression thymomas. Muscle Nerve, 1998. 21(10): p. 1299-303.
134. Toyota, M., et al., Inactivation of CACNA1G, a T-type calcium channel gene, by aberrant methylation of its 5' CpG island in human tumors. Cancer Res, 1999. 59(18): p. 4535-41.
135. Paz, M.F., et al., Genetic unmasking of epigenetically silenced tumor suppressor genes in colon cancer cells deficient in DNA methyltransferases. Hum Mol Genet, 2003. 12(17): p. 2209-19.
136. Lerman, M.I. and J.D. Minna, The 630-kb lung cancer homozygous deletion region on human chromosome 3p21.3: identification and evaluation of the resident candidate tumor suppressor genes. The International Lung Cancer Chromosome 3p21.3 Tumor Suppressor Gene Consortium. Cancer Res, 2000. 60(21): p. 6116-33.
137. Endo, Y., et al., Sarcoendoplasmic reticulum Ca(2+) ATPase type 2 downregulated in human oral squamous cell carcinoma. Int J Cancer, 2004. 110(2): p. 225-31.
138. Korosec, B., et al., Alterations in the ATP2A2 gene in correlation with colon and lung cancer. Cancer Genet Cytogenet, 2006. 171(2): p. 105-11.
139. Pacifico, F., et al., The expression of the sarco/endoplasmic reticulum Ca2+-ATPases in thyroid and its down-regulation following neoplastic transformation. J Mol Endocrinol, 2003. 30(3): p. 399-409.
140. Chung, F.Y., et al., Sarco/endoplasmic reticulum calcium-ATPase 2 expression as a tumor marker in colorectal cancer. Am J Surg Pathol, 2006. 30(8): p. 969-74.
141. Brouland, J.P., et al., The loss of sarco/endoplasmic reticulum calcium transport ATPase 3 expression is an early event during the multistep process of colon carcinogenesis. Am J Pathol, 2005. 167(1): p. 233-42.
142. Gelebart, P., et al., Expression of endomembrane calcium pumps in colon and gastric cancer cells. Induction of SERCA3 expression during differentiation. J Biol Chem, 2002. 277(29): p. 26310-20.
143. Vanoverberghe, K., et al., Ca2+ homeostasis and apoptotic resistance of neuroendocrine-differentiated prostate cancer cells. Cell Death Differ, 2004. 11(3): p. 321-30.
144. Stauffer, T.P., D. Guerini, and E. Carafoli, Tissue distribution of the four gene products of the plasma membrane Ca2+ pump. A study using specific antibodies. J Biol Chem, 1995. 270(20): p. 12184-90.
145. Zhao, F., et al., Dantrolene inhibition of ryanodine receptor Ca2+ release channels. Molecular mechanism and isoform selectivity. J Biol Chem, 2001. 276(17): p. 13810-6.
146. Thastrup, O., et al., Thapsigargin, a tumor promoter, discharges intracellular Ca2+ stores by specific inhibition of the endoplasmic reticulum Ca2(+)-ATPase. Proc Natl Acad Sci U S A, 1990. 87(7): p. 2466-70.
147. Catterall, W.A., et al., International Union of Pharmacology. XLVIII. Nomenclature and structure-function relationships of voltage-gated calcium channels. Pharmacol Rev, 2005. 57(4): p. 411-25.
148. Watkins, D.N., et al., Hedgehog signalling within airway epithelial progenitors and in small-cell lung cancer. Nature, 2003. 422(6929): p. 313-7.
149. Hibi, K., et al., Coexpression of the stem cell factor and the c-kit genes in small-cell lung cancer. Oncogene, 1991. 6(12): p. 2291-6.
150. Zhang, C., et al., Extensive phosphorylation of Smoothened in Hedgehog pathway activation. Proc Natl Acad Sci U S A, 2004. 101(52): p. 17900-7.

97
151. Bhattacharya, R., et al., Role of hedgehog signaling in ovarian cancer. Clin Cancer Res, 2008. 14(23): p. 7659-66.
152. Salcido, C.D., et al., Molecular characterisation of side population cells with cancer stem cell-like characteristics in small-cell lung cancer. Br J Cancer, 2010. 102(11): p. 1636-44.
153. Tian, F., et al., Effects of the Hedgehog pathway inhibitor GDC-0449 on lung cancer cell lines are mediated by side populations. Clin Exp Med, 2011.
154. Sung, J.M., et al., Characterization of a stem cell population in lung cancer A549 cells. Biochem Biophys Res Commun, 2008. 371(1): p. 163-7.
155. Zhang, Y., J. Laterra, and M.G. Pomper, Hedgehog pathway inhibitor HhAntag691 is a potent inhibitor of ABCG2/BCRP and ABCB1/Pgp. Neoplasia, 2009. 11(1): p. 96-101.
156. Dijkgraaf, G.J., et al., Small molecule inhibition of GDC-0449 refractory smoothened mutants and downstream mechanisms of drug resistance. Cancer Res, 2011. 71(2): p. 435-44.
157. Bergner, A., et al., Endoplasmic reticulum Ca2+-homeostasis is altered in Small and non-small Cell Lung Cancer cell lines. J Exp Clin Cancer Res, 2009. 28: p. 25.
158. Schrodl, K., et al., Altered Ca2+-homeostasis of cisplatin-treated and low level resistant non-small-cell and small-cell lung cancer cells. Cell Oncol, 2009. 31(4): p. 301-15.
159. Orrenius, S., B. Zhivotovsky, and P. Nicotera, Regulation of cell death: the calcium-apoptosis link. Nat Rev Mol Cell Biol, 2003. 4(7): p. 552-65.
160. Witkowski, J.M. and R.A. Miller, Calcium signal abnormalities in murine T lymphocytes that express the multidrug transporter P-glycoprotein. Mech Ageing Dev, 1999. 107(2): p. 165-80.
161. Wyllie, A.H., J.F. Kerr, and A.R. Currie, Cell death: the significance of apoptosis. Int Rev Cytol, 1980. 68: p. 251-306.
162. Khan, A.A., et al., Lymphocyte apoptosis: mediation by increased type 3 inositol 1,4,5-trisphosphate receptor. Science, 1996. 273(5274): p. 503-7.
163. Bergner, A., et al., Ca2+-signaling in airway smooth muscle cells is altered in T-bet knock-out mice. Respir Res, 2006. 7: p. 33.
164. Legrand, G., et al., Ca2+ pools and cell growth. Evidence for sarcoendoplasmic Ca2+-ATPases 2B involvement in human prostate cancer cell growth control. J Biol Chem, 2001. 276(50): p. 47608-14.
165. Bezprozvanny, I., The inositol 1,4,5-trisphosphate receptors. Cell Calcium, 2005. 38(3-4): p. 261-72.
166. Sulova, Z., et al., Does any relationship exist between P-glycoprotein-mediated multidrug resistance and intracellular calcium homeostasis. Gen Physiol Biophys, 2009. 28 Spec No Focus: p. F89-95.
167. Sugimura, R. and L. Li, Noncanonical Wnt signaling in vertebrate development, stem cells, and diseases. Birth Defects Res C Embryo Today, 2010. 90(4): p. 243-56.
168. Santo-Domingo, J. and N. Demaurex, Calcium uptake mechanisms of mitochondria. Biochim Biophys Acta, 2010. 1797(6-7): p. 907-12.
169. Zhao, Y., et al., Asterosaponin 1 induces endoplasmic reticulum stress-associated apoptosis in A549 human lung cancer cells. Oncol Rep, 2011. 26(4): p. 919-24.
170. Splettstoesser, F., A.M. Florea, and D. Busselberg, IP(3) receptor antagonist, 2-APB, attenuates cisplatin induced Ca2+-influx in HeLa-S3 cells and prevents activation of calpain and induction of apoptosis. Br J Pharmacol, 2007. 151(8): p. 1176-86.
171. Vanderheyden, V., et al., Regulation of inositol 1,4,5-trisphosphate-induced Ca2+ release by reversible phosphorylation and dephosphorylation. Biochim Biophys Acta, 2009. 1793(6): p. 959-70.

98
Appendix I
Fei Tian, Josef Mysliwietz, Joachim Ellwart, Fernando Gamarra, Rudolf Maria Huber,
Albrecht Bergner:
Effects of the Hedgehog pathway inhibitor GDC-0449 on lung cancer cell lines are
mediated by side populations
Clinical and Experimental Medicine, 2011 Apr 26. [Epub ahead of print]

99

100

101

102

103

104