effect of agricultural commercialization on intensification and crop production among smallholders...
TRANSCRIPT

Effect of Agricultural Commercialization on Intensification
and Crop Production among Smallholders in Central
Africa
Ochieng Justus
4-03-2014

Presentation outline
1. Introduction
2. Objectives
3. Methodology
4. Results
5. Conclusion
8. Recommendations
2

1. Introduction
• Low food production and high poverty levels.
• 45%- poverty level in Rwanda (GOR,2013)
• 28% food insecure, 24% and 25% highly and moderately vulnerable to food insecurity (WFP, 2009)
• 71%- poverty level in the DRC (UNDP, 2013)- 75% food insecure (AfDB,2013)
• Recovering from political and civil strife
3

1. Introduction
• CAADP agenda 2006-Abuja declaration to achieve 50kg per ha by 2015
• CIALCA interventions in Rwanda & DRC
• Interventions disseminated to make farmers commercialized and improve market access:
• ISFM
• Germplasm development
• Collective marketing
• Business plan development
• Participatory market research
• Product transformation
4
Strategies to improve commercialization among farmers

1. Introduction….continues • Commercialization can increase farmer’s financial capacity - resources to reinvest in
inputs and increase farm profits
• Why banana and legumes (beans, soya beans and groundnuts)?
• Staple crop
• 80% of households consume
• 80-96% grow the crops in Rwanda and 80% in the DRC
• Can commercialization help to motivate investment in yield enhancing technologies and increase yields among smallholder farmers?
•
5
6
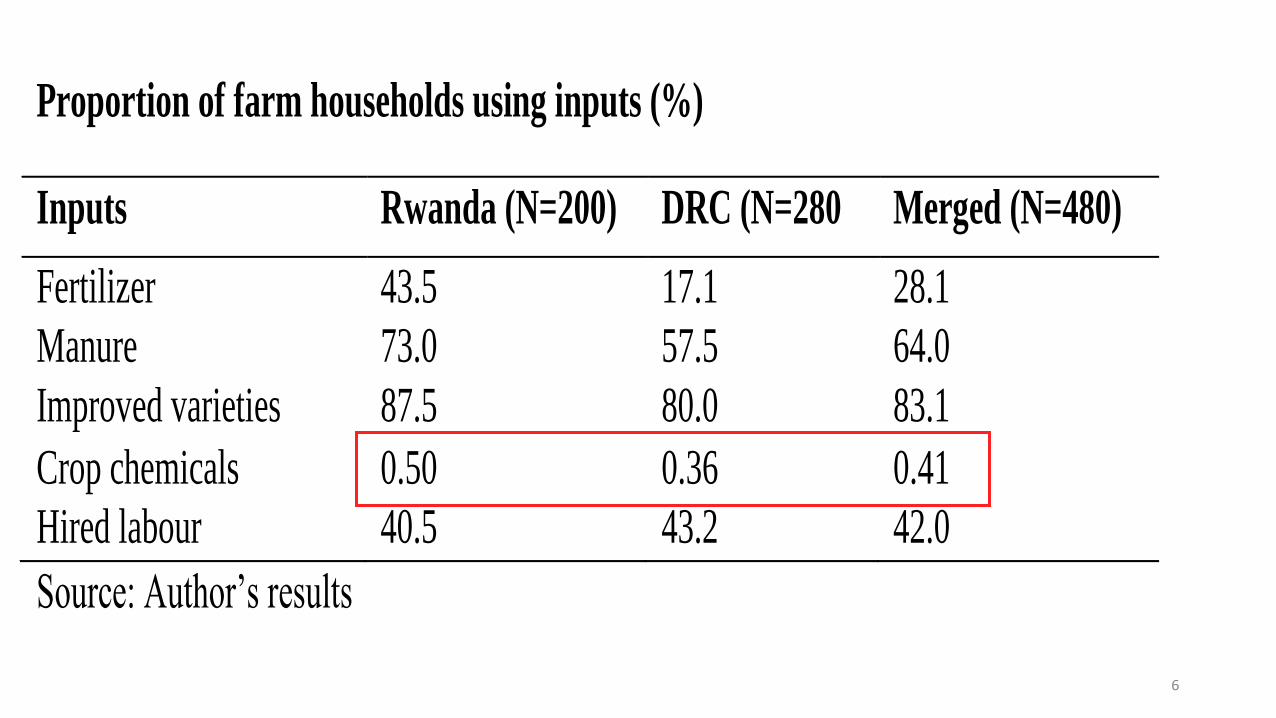
Proportion of farm households using inputs (%)
Inputs Rwanda (N=200) DRC (N=280 Merged (N=480)
Fertilizer 43.5 17.1 28.1
Manure 73.0 57.5 64.0
Improved varieties 87.5 80.0 83.1
Crop chemicals 0.50 0.36 0.41
Hired labour 40.5 43.2 42.0
Source: Author’s results

• to assess the effect of agricultural commercialization on:
• Intensification
• Banana and legume production
2. Specific objectives
7

3. Research Methodology
8

Sampling procedure
9
Stages Sampling activity
Stage 1. Purposively select the 7 Action sites from the 3 mandate areas (5 in
Rwanda and 2 in DRC).
Mandate area: Kigali-Kibungo and Umutara in Rwanda and South Kivu
Action sites: Kabare, and Walungu in South Kivu, Rwanda: Kirehe,
Gatsibo (Umutara), Kayonza, Ngoma, and Bugesera
Stage2. 30 farmer groups in CIALCA program – From 7 action sites.
21 and 9 from South Kivu and Rwanda respectively.
Stage 3. From the list of farmers, provided by groups - Randomly selected
proportionate to the size of the group.
480 farmers selected

Data collection
10

Econometric modelling • Aggregate production equation is specified in equation :
• Y is crop yield (measured in terms of value of crop output per hectare (US/ha) for agricultural crop production in household i.
are unknown parameters of interest
is a vector of common exogenous variables hypothesized to influence agricultural productivity including fertilizers, improved varieties and chemicals.
is the commercialization index while is an error term.
• Crop chemicals excluded from the analysis (0.41%)
11
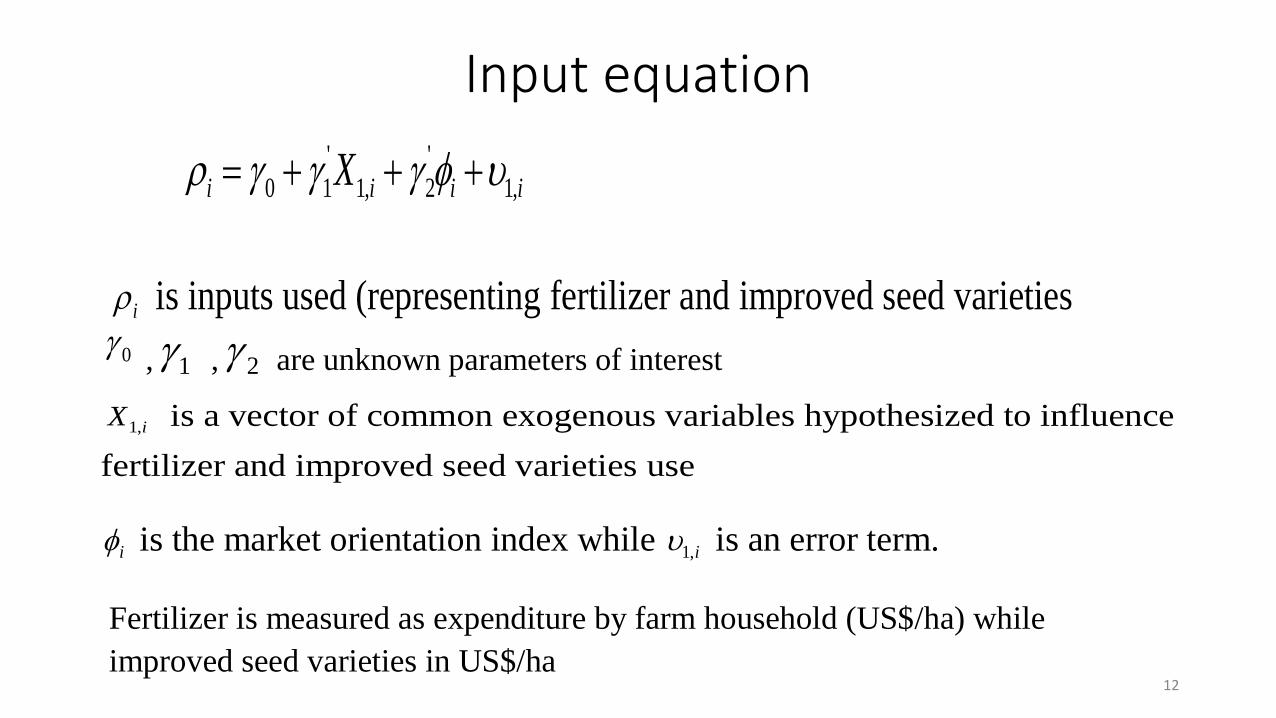
Input equation
12
iiii X ,1
'
2,1
'
10
is inputs used (representing fertilizer and improved seed varieties i
, , are unknown parameters of interest 01 2
is a vector of common exogenous variables hypothesized to influence
fertilizer and improved seed varieties use
iX ,1
is the market orientation index while is an error term. i i,1
Fertilizer is measured as expenditure by farm household (US$/ha) while
improved seed varieties in US$/ha

Instrumental variable (IV) regression
• Instrumental variables for commercialization:
• Transport equipment
• Payment of market fees
• Access to all weather roads
• Endogeneity tests to ensure that the chosen instruments are valid to obtain consistent and unbiased estimates and reduce efficiency loss (Wooldridge, 2006).
• Tests show that commercialization is exogenous to fertilizers and improved varieties (tobit) but endogenous to yields
13

Agricultural commercialization measurement
• Market orientation is measured as proportion of total amount of bananas and legumes sold to total output produced at farm level (Strasberg et al, 1999 and Bekele et al, 2010).
• The households with index value >50 are regarded as market oriented; <50 are considered subsistence oriented (Strasberg et al, 1999 and Bekele et al, 2010) .
14
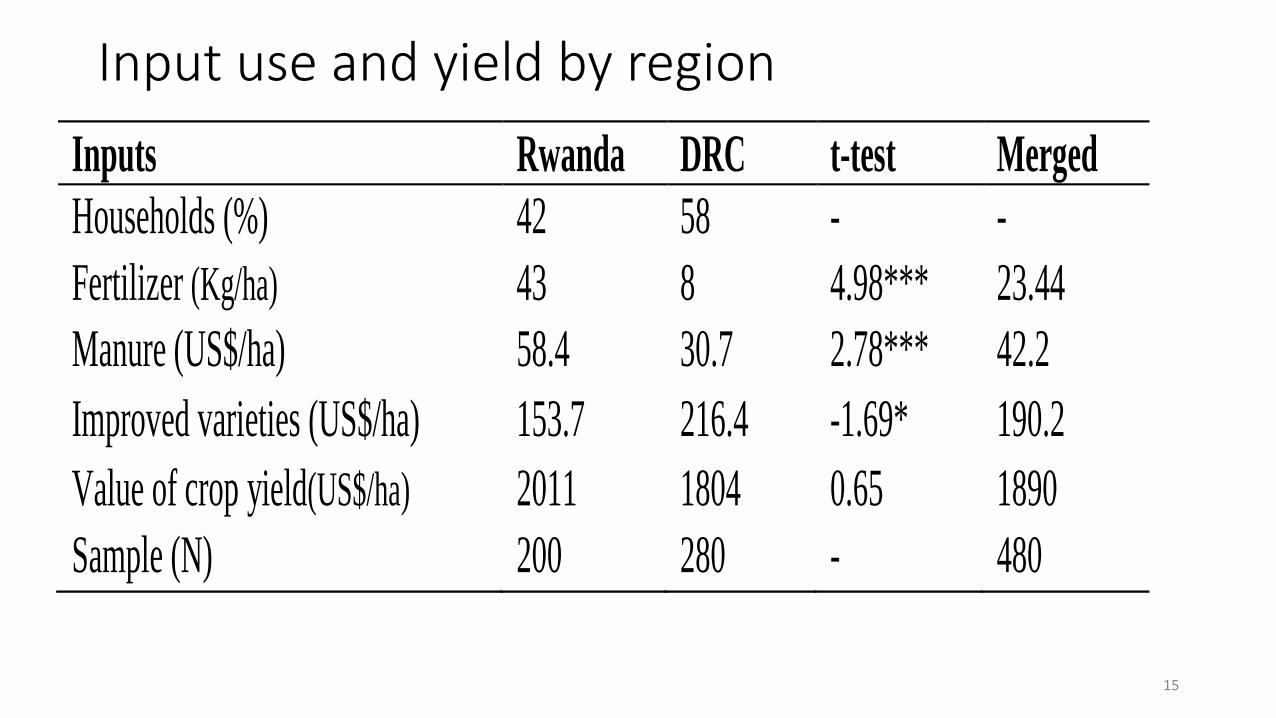
Input use and yield by region
15
Inputs Rwanda DRC t-test Merged
Households (%) 42 58 - -
Fertilizer (Kg/ha) 43 8 4.98*** 23.44
Manure (US$/ha) 58.4 30.7 2.78*** 42.2
Improved varieties (US$/ha) 153.7 216.4 -1.69* 190.2
Value of crop yield(US$/ha) 2011 1804 0.65 1890
Sample (N) 200 280 - 480

Household commercialization level
16 Rwanda=56%; DRC 49% & Overall 52%

Input use and yield by commercialization level
17

Effect of commercialization on intensification and yield
Dependent/
Independent
variables
Fertilizer-
(Tobit)
Improved varieties -
(Tobit)
Yield value
(2SLS)
Coeff. t-statistic Coeff. t-statistic Coeff. t-statistic
Commercialization 0.18 (0.25) 0.71 0.18 (0.09) 2.01** 12.97(6.5) 2.01**
Fertilizer (US/ha) - - - - 13.3(5.3) 2.52**
Improved varieties
(US/ha)
0.199 (0.05) 3.72*** - - 2.59(1.7) 1.56
Age (years) 5.36 (3.0) 1.78* -2.26(3.01) -0.75 -43.1(45.0) -0.96
Female (1= female) -62.19 (24.7) -2.52*** 19.4 (23.2) 0.84 261.5(215) 1.22
Farm size (ha) 0.655 (0.7) 0.91 1.73 (1.3) 1.36 32.1(17.9) 1.79*
Effect of commrcialization on input use and crop yield
18

Market
information(1=yes)
30.62
(20.10)
1.52 37.93
(12.86)
2.95*** 433.28
(157.86)
2.74***
Credit (1=yes) 23.07(15.1) 1.53 44.04
(17.81)
2.47** 48.17
(15.82)
3.04***
Extension contacts (#) 0.77 (0.65) 1.18 2.17(1.2) 1.78* 6.83
(7.69)
0.89
Livestock holding (TLU) 1.59 (1.66) 0.96 8.44(1.9) 4.42*** -2.59(40.5) -0.06
Distance to the nearest
market (km)
-1.95 (2.02) -0.97 -1.42(1.1) -1.24 -43.12
(22.93)
-1.88*
Education (years) 3.96 (2.40) 1.65 -0.35(1.9) -0.17 45.6 (18.7) 2.43**
Country(1 =Rw; 0DRC) 132.1(28.6) 4.62*** -30.1(14.4) -2.10** 515.8(206) 2.51**
Joint sig. test (F) F=21.28; P=0.000 F=21.25; P=0.000 F=53.93; P=0.000
N 480 480 480
19
Table 4 Continues…………..

Conclusion • The production system in the region is characterized with low input low output.
• Commercialization is critical for improving crop production as well as adoption of improved varieties and fertilizer in banana and legume based systems.
• However, influence of commercialization cannot remain strong without complementary effect of market access and resources endowment factors specifically availability of credit, good roads and market information, land availability and country specific policies. Policies in these areas are important.
• Thus promoting commercialization of staples in Central Africa will trigger investment in intensification among smallholders thereby increasing yields.
20

Acknowledgements
• International Center for Development and Decent Work (ICDD)
• International Institute of Tropical Agriculture (IITA)
• Smallholder farmers in Rwanda and the DRC
21

THANK YOU 22