ecopath and ecosim in the eastern bering sea an evaluation focusing on steller sea lion issues kerim...
TRANSCRIPT

Ecopath and Ecosim in the Eastern Bering Sea
An evaluation focusing on Steller Sea Lion Issues
Kerim Y. Aydin1
Collaborators Nancy Friday2
Patricia Livingston3
11School of Aquatic and Fishery Sciences, University of WashingtonSchool of Aquatic and Fishery Sciences, University of Washington22Alaska Fisheries Science Center (NMML)Alaska Fisheries Science Center (NMML)33Alaska Fisheries Science Center (REFM)Alaska Fisheries Science Center (REFM)

Ecopath methods
• Just a population-scale quantitative food web.
• Mass-balance (not necessarily equilibrium) quantifies known and unknown flows for each box.
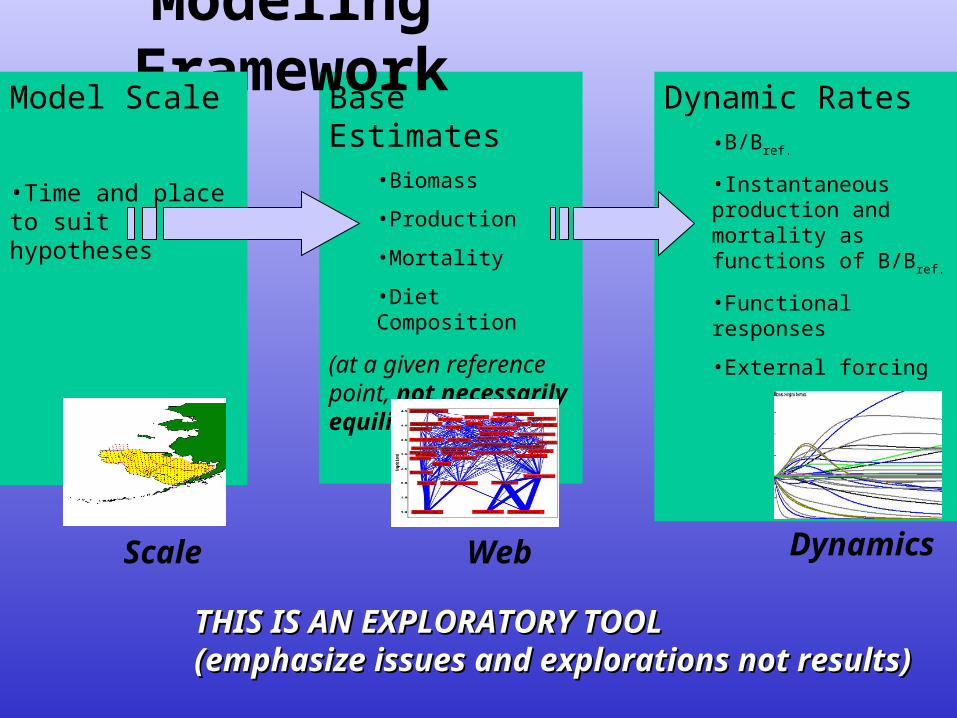
Base Estimates •Biomass
•Production
•Mortality
•Diet Composition
(at a given reference point, not necessarily equilibrium)
Dynamic Rates •B/Bref.
•Instantaneous production and mortality as functions of B/Bref.
•Functional responses
•External forcing
Modeling Framework
Model Scale
•Time and place to suit hypotheses
THIS IS AN EXPLORATORY TOOLTHIS IS AN EXPLORATORY TOOL(emphasize issues and explorations not results)(emphasize issues and explorations not results)
Scale Web Dynamics

Scale
• No scale is universal scale of model => scale of hypothesis => scale of action
• Spatial scaleSpatial scale• Community scale Community scale • Temporal scaleTemporal scale

Scale
• Current model– EBS trawl survey area– Stellers on Edge– Jellyfish ‘unimportant’– Missing
• Sea otters• Atka mackerel• Nearshore infauna, kelp...
• ‘‘Whole EBS’ scale Whole EBS’ scale resultsresults

Scale
• Community scale– Species emphasize
groundfish• Extremely good diet and
assessment data
• Data quality– Key interactions present– Specific weaknesses (forage
fish)– (Sensitivity later)
• Temporal reference Temporal reference points?points?
Trans.killers SkatesRes.killers SculpinsSperm&bk. wh. SablefishBeluga wh. RockfishPorp.&dolph. MacrouridaeGray whales ZoarcidaeFin&hump. wh. C. bairdiSei&right wh. C. opilioBowhead wh. King crabMinke wh. ShrimpWalr.&B.Seals OctopiSeals EpifaunaAdu.StellerS.L. InfaunaJuv.StellerS.L. Benthic amph.Skua&Jae.&Alb. SalmonShearwaters P. herringKittiw.&Puffins&Murres SquidSt.Petr.&Fulm. Forage fishSharks Myc. & Bathy.Adult pollock2+ JellyfishJuv. pollock0-1 EuphausiidsP. cod O. large zoop.P. halibut CopepodsGr. turbot PhytoplanktonArrow. flounder Pelagic DetritusFlat. sole Benthic DetritusYellowf. soleRock soleAk. plaice
Good Med. Poor

Scale• Time scale
– Average annual production and
annual anomalies-no seasons
– “Present” 1993-95
– (but no reference points (but no reference points for S.S.L.s)for S.S.L.s)
0
10
20
30
40
50
60
1979
1980
1981
1982
1983
1984
1985
1986
1987
1988
1989
1990
1991
1992
1993
1994
1995
1996
1997
1998
Bio
ma
ss
(t/
km
^2
)
JellyfishPacific herringKing crabC. opilioC. bairdiZoarcidaeMacrouridaeRockfishSablefishSculpinsSkatesAk. plaiceRock soleYellow. soleFlat. soleArrow. flounderGr. turbotP. halibutP. codJuv. pollock0-1Adult pollock2+

UnexplainedUnexplained(could be balance or loss)(could be balance or loss)
metabolism
Mass balance(not an equilibrium)
Biomass
Consumption Predation
Fishing
Ecotrophic (or Modeling!) Efficiency (EE):Ecotrophic (or Modeling!) Efficiency (EE):Quantified at a single (temporal) reference point.Quantified at a single (temporal) reference point.

UnexplainedUnexplained(could be balance or loss)(could be balance or loss)
metabolism
Mass balance(not an equilibrium)
Biomass
Consumption Predation
Fishing
OK for fish.OK for fish.For Steller Sea Lions: WHEN???For Steller Sea Lions: WHEN???

Reference points
• For each species of interest • Need a time snapshot when most
sources of production and mortality are quantified.
• (or assume equilibrium- Not for S.S.L.s).
55% of mortality 55% of mortality “unexplained”. “unexplained”. (Loughlin and York 2001)(Loughlin and York 2001)
All data All data (especially (especially predation) poor.predation) poor.

Reason for past decline
• A modeling tautology:– Anything you want, according to
Ecosim

Juv. Pollock
-25% -20% -15% -10% -5% 0%
Baleen whales
Toothed whales
Sperm Whales
Walr.&B.Seals
Seals
Steller S.L.
Pisc. birds
Adult pollock2+
Juv. pollock0-1
P. cod
P. halibut
Gr. turbot
Arrow. flounder
Flat. sole
Skates
Sculpins
Sablefish
Rockfish
Macrouridae
Zoarcidae
Cephalopods
Jellyfish
Overall change 1980s to 1990s
Projected percent in diet
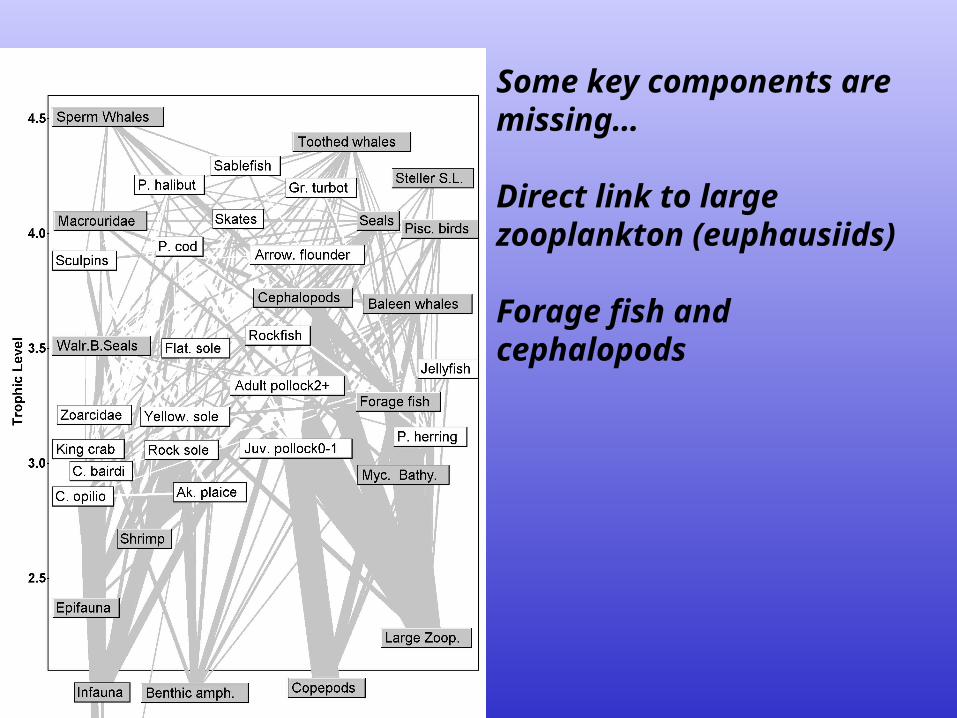
Some key components are missing…
Direct link to large zooplankton (euphausiids)
Forage fish and cephalopods

Dynamic Structure (Ecosim)
• Biomass based » ok - exploratory
• Food web based» ok - isolate these effects
• Equilibrium » ok - use sensitivity analyses (or start in decline)» Expect unmodeled invasions
• functional responses, bioenergetics, populations
» Keep results exploratory, qualitative» Sensitivity» 1 Ph.D. Unit of work1 Ph.D. Unit of work

But since answers are required…
• Time constraint for management
– What do best current models say?– How should we use the results?– Improvement - how and when?
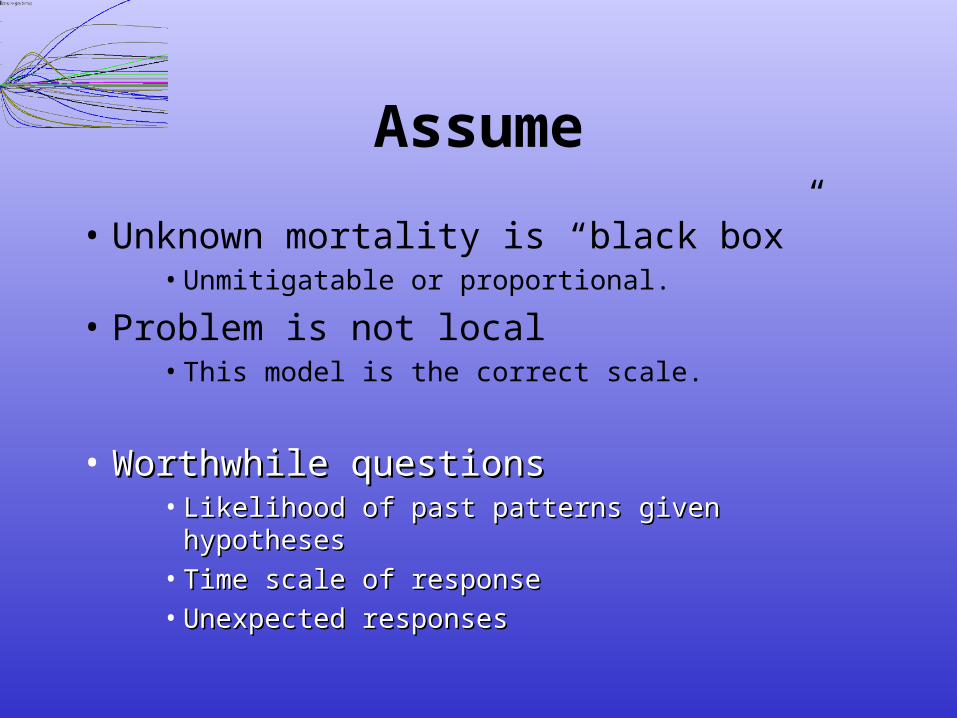
Assume
• Unknown mortality is “black box”• Unmitigatable or proportional.
• Problem is not local• This model is the correct scale.
• Worthwhile questionsWorthwhile questions• Likelihood of past patterns given hypothesesLikelihood of past patterns given hypotheses• Time scale of responseTime scale of response• Unexpected responsesUnexpected responses

Indirect effects
• Unexpected indirect effects of fishery manipulation
• Preponderance of the evidence explaining multiple trends (regimes)

Direct top-down interactions can’t be
confirmed• Tautology again
– Food web is the only interaction.– But largest changes may occur
here.• (general agreement with life-table
analysis).
• A single trajectory for a single A single trajectory for a single species is non-explanatory.species is non-explanatory.

Bottom up?
‘Physical forcing’ with anomalies
‘Wiggle and test’ data exploration...
1979-98Historical fishing incl.

Primary production
forcing
1979-981979-98
• Preponderance of the Preponderance of the evidence? evidence?
• Frequency response.Frequency response.
0 1 2
1974
1976
1978
1980
1982
1984
1986
1988
1990
1992
1994
1996
1998
2000
Primary Production anomaly (multiplier)

0
0.01
0.02
0.03
0.04
0.05
0 1 2 3 4 5 6
P. Cod biomass (t/km2)
Fla
thea
d s
ole
mo
rtal
ity
by
P.
cod
(1/
year
)
0
0.01
0.02
0.03
0.04
0.05
0.06
0.07
0.08
0.09
0.1
0.11
0.12
0.13
0.14
0 1 2 3 4 5 6
P. Cod biomass (t/km2)
Wal
leye
po
llock
mo
rtal
ity
by
P.
cod
(1/
year
)
Additional data:
anomalies in consumption
– Systematic anomalies in consumption rates?
• Food habits• Predator size• Prey size• abundant year classes• Age class models
– Evidence of alternate stable Evidence of alternate stable states?states?

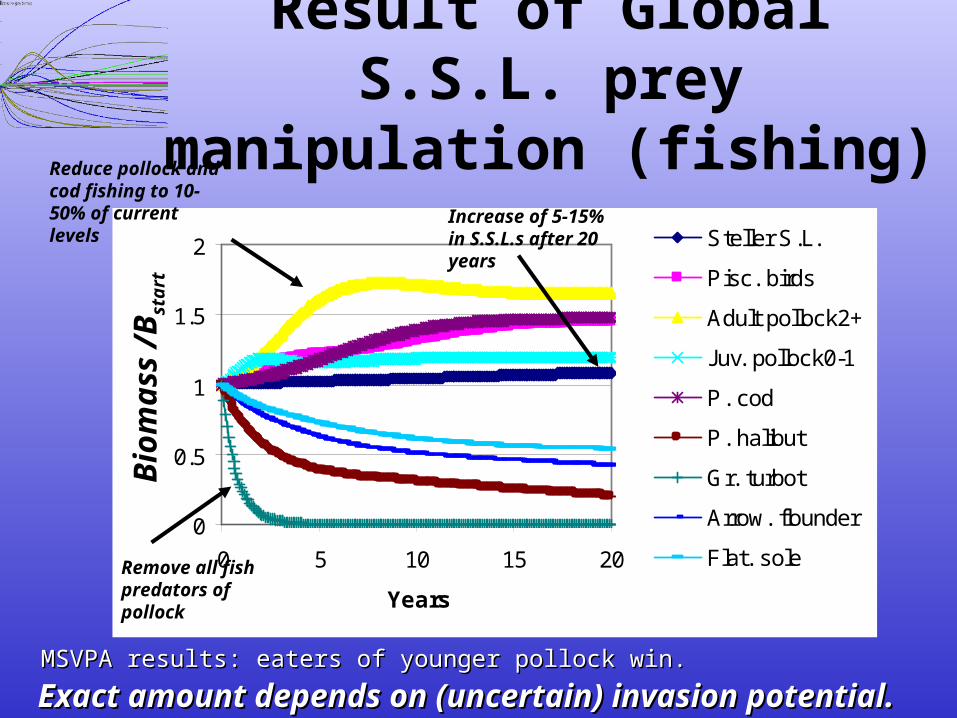
Result of Global S.S.L. prey manipulation
(fishing)
00.2
0.40.6
0.81
1.21.4
1.6
0 10 20
Years
B/B
ref.
Steller S.L.
Pisc. birds
Adult pollock2+
Juv. pollock0-1
P. cod
P. halibut
Gr. turbot
Arrow. flounder
Flat. soleElimination of pollock from the EBS through fishing
Harms birds, many fish spp.
Harms S.S.L., although some compensation
Exact amount depends on (uncertain) forage fish.Exact amount depends on (uncertain) forage fish.
Bio
mass
/Bsta
rt
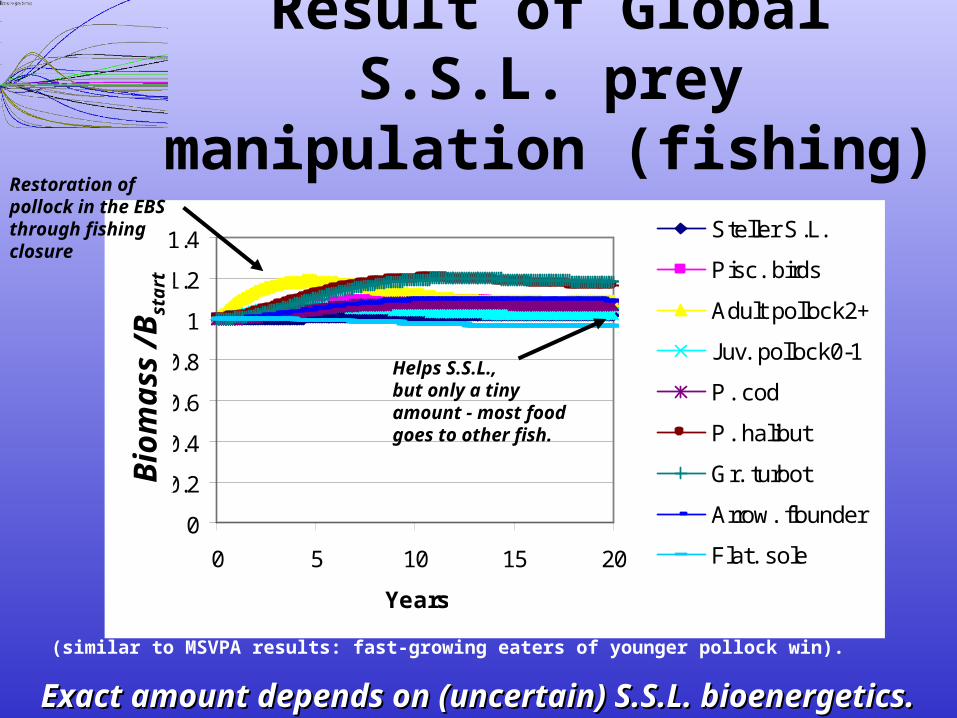
Result of Global S.S.L. prey manipulation
(fishing)
0
0.2
0.4
0.6
0.8
1
1.2
1.4
0 5 10 15 20
Years
B/B
ref.
Steller S.L.
Pisc. birds
Adult pollock2+
Juv. pollock0-1
P. cod
P. halibut
Gr. turbot
Arrow. flounder
Flat. sole
Restoration of pollock in the EBS through fishing closure
Exact amount depends on (uncertain) S.S.L. bioenergetics.Exact amount depends on (uncertain) S.S.L. bioenergetics.
Helps S.S.L., but only a tiny amount - most food goes to other fish.
(similar to MSVPA results: fast-growing eaters of younger pollock win).
Bio
mass
/Bsta
rt
0
0.5
1
1.5
2
0 5 10 15 20
Years
B/B
ref.
Steller S.L.
Pisc. birds
Adult pollock2+
Juv. pollock0-1
P. cod
P. halibut
Gr. turbot
Arrow. flounder
Flat. sole
Result of Global S.S.L. prey manipulation
(fishing)
Exact amount depends on (uncertain) invasion potential.Exact amount depends on (uncertain) invasion potential.
Reduce pollock and cod fishing to 10-50% of current levels
Remove all fish predators of pollock
Increase of 5-15% in S.S.L.s after 20 years
MSVPA results: eaters of younger pollock win.MSVPA results: eaters of younger pollock win.
Bio
mass
/Bsta
rt

Result of Global S.S.L. prey manipulation
(fishing)
Exact amount depends on (uncertain) invasion potential.
Reduce pollock and cod fishing to 10-50% of current levels
Remove all fish predators of pollock
Increase of 5-15% in S.S.L.s after 20 years
Management Management does not equal does not equal Control !!Control !!

These results are sensitive to:
•S.S.L. diet assumptions» Energy vs. biomass. » Other forage fish dynamics.
•Bioenergetics» Some key parameters are 2 trophic levels down.» Fish and zooplankton as well as S.S.L.’s.» Pup death and other amplifiers.
•Regimes and invasive species » Dogfish? Skates??
• But what about locally?

Spatial resolution
• Community-level Community-level central place central place foraging creates foraging creates local conflicts with local conflicts with fishery.fishery.
• These conflicts are These conflicts are probably more probably more important than important than global interactions. global interactions.

Methods of concentric circles
Red : 50 nautical miles radiusGreen : 100 nautical miles radiusYellow: 150 nautical miles radius
Energetics-based ecosystem boundary: the boundary that the boundary that accommodates energetics demands accommodates energetics demands of species within the system = of species within the system = foraging range of C.P. Foragersforaging range of C.P. Foragers
How does fishing change this How does fishing change this boundary?boundary?
Ciannelli et al. submitted

Consumption: TL>4 - 50 NM
0
10
20
30
40
50
50NM 100NM 150NM
Co
nsu
mp
tio
n (
MT
km
-2 y
-1)
Furseals Groundfish Seabirds Other MM
Ciannelli et al. submitted
Time period: 1990-1999Time period: 1990-1999

Model Output: increase of area
0
2
4
6
8
Mes
opl
Forag
e
Zoarc
idae
Adult P
llk
Agonid
ae
Juv G
adids
Squids
Mac
roZpE
cotr
op
hic
Eff
icie
ncy 50 EE 100 EE 150 EE
Ciannelli et al. submitted
Migration only way to support seals at 50 nmMigration only way to support seals at 50 nm

Vectors showing 119 foraging trips made by 97 fur seal females 1995-96
- Median distance 179.7 km
What do fur seals do?
Robson et al. submitted
Also looks at Also looks at fisheries edge fisheries edge effectseffects
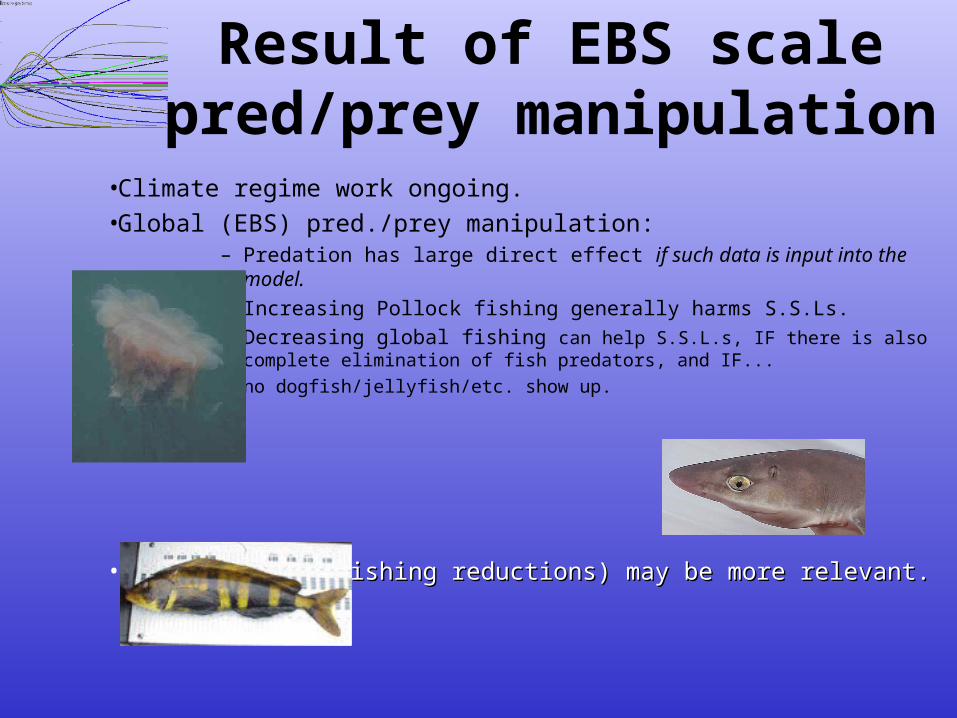
Result of EBS scale pred/prey manipulation
•Climate regime work ongoing.•Global (EBS) pred./prey manipulation:
– Predation has large direct effect if such data is input into the model.
– Increasing Pollock fishing generally harms S.S.Ls.– Decreasing global fishing can help S.S.L.s, IF there is also
complete elimination of fish predators, and IF... – no dogfish/jellyfish/etc. show up.
•Local effects (fishing reductions) may be more relevant.Local effects (fishing reductions) may be more relevant.

Proposed/planned steps– Bering Sea regime/sensitivity work in progress.
– Bioenergetics, bioenergetics, bioenergetics (1 Ph.D.) – Fish and plankton as well, forage fish especially.
– Local Ecosim/Ecospace? (1 Ph.D.) – Still parameter sensitive. – Best available ref. points are not strong.– Seasonal and migratory modeling poor (so is data).
– Successive (nested) Ecopath models (1 Masters) – SE vs. Pribs. vs. Aleutian islands – Protected areas
– Collaboration with other scales of modelsCollaboration with other scales of models