economics of cellulosic ethanol production marie walsh, burt english, daniel de la torre ugarte, kim...
TRANSCRIPT
Economics of Cellulosic Ethanol Production
Marie Walsh, Burt English, Daniel de la Torre Ugarte, Kim Jensen, Richard Nelson
SAEA Annual Meeting
Mobile, AL
February 6, 2007

Interest in Biomass• Numerous visions/initiatives have been recently
proposed to displace 20-30 percent of our transportation fuels with biomass-derived fuels within the next 20-25 years.
• Large scale production of biofuels raises numerous issues regarding feasiblility, development approach, and impacts, particularly– Food vs. fuel issues– Limits to corn and soybean use– Need for alternative technologies (i.e., cellulose)
• UT has developed a modeling framework to rigorously evaluate the potential and selected impacts.

Approach
• Dynamic model of the U.S. agricultural sector (POLYSYS)– POLYSYS contains major
crops, livestock, food and feed markets, major cropland classes
– 305 geographic regions– Anchored to 2006 USDA
baseline – Allocates land based on
relative profits

Approach
• Modify POLYSYS– Extend the baseline to 2025– Add cellulose feedstocks
• Endogenous feedstocks include corn stover, wheat straw, and switchgrass
• Exogenous feedstocks include forest logging residues, forest other removals, primary mill residues
– Add bioenergy technologies• Ethanol from corn grain and cellulose• Biodiesel from soybeans• Electricity from cellulose

Corn Stover
• Major Assumptions Include:– Continuous corn rotation– Current tillage mix with
increasing no-till over time
– Control erosion at <T– Collected as large,
round bales

Wheat Straw
• Major Assumptions Include:– Continuous wheat
rotation– Current tillage mix with
increasing no-till over time
– Control erosion at <T– Collected as large,
round bales

SwitchgrassRegion Annual Increases in Yield
Lake States 1.00 percent
Corn Belt 1.75 percent
Northeast 1.25 percent
Appalachia 2.50 percent
Southeast 3.00 percent
North Plains 1.25 percent
South Plains 1.00 percent

Forest Residues
• Combined logging residues and other removals (land clearing, pre-commercial thinnings).
• Quantities from USDA Forest Service Forest Inventory Analysis database
• Estimated collection costs using traditional forestry equipment
Forest Residue Supplies
(million dry tons)
$20/dt $30/dt $40/dt $50/dt
2005 1.01 2.27 30.66 35.06
2010 1.02 2.33 31.63 36.21
2015 1.05 2.37 32.02 36.63
2020 1.08 2.44 33.0 37.75
2025 1.12 2.52 34.0 38.88

Mill Residues
• Quantities and current uses from USDA Forest Service Forest Inventory Analysis database
• Costs based on estimated prices needed to attract mill residues from current uses
Mill Residues
(million dry tons)
$20/dt $30/dt $40/dt $50/dt
2005 1.80 23.98 45.70 50.52
2010 1.81 24.30 46.01 50.87
2015 1.87 25.05 47.50 52.53
2020 1.92 25.80 48.98 54.18
2025 1.98 26.47 50.17 55.53

Bioenergy Technologies
Conversion Costs & Yields(feedstock and co-product values not included)
Year 2005 Year 2015 Year 2025
ETOH from Corn 2.7 gal/bu$0.55/gal
2.7 gal/bu$0.55/gal
3.0 gal/bu$0.55/gal
ETOH from Cellulose 67-70 gal/dt$1.47/gal
74-80 gal/dt$0.73/gal
83-90 gal/dt$0.73/gal
Biodiesel from Soybeans 1.4 gal/bu$0.436/gal
1.4 gal/bu$0.436/gal
1.4 gal/bu$0.436/gal
Electricity from Cellulose (co-fire)
1425-1532 kwh/dt
$0.0036/kwh
1425-1532 kwh/dt
$0.0032/kwh
1425-1532 kwh/dt
$0.0032/kwh

Bioenergy/Bioproduct Demand
Demand Quantities (above baseline) Year 2006 Year 2015 Year 2025
Ethanol(billion gallons)
3.97 23.34 68.24
Biodiesel(billion gallons)
0.11 0.82 1.7
Electricity(billion kWh)
Excess feedstocks
used for co-fire
Excess feedstocks used
for co-fire
Excess feedstocks used
for co-fire
Bioproducts(billion lbs)
Not included Not included Not included

Scenario Constraints
• Bioenergy demand must be met regardless of cost
• Baseline food, feed, and export demands must be met– Forage supplies lost due to shift of pasture
acres to other crops must be met by increased hay production

Results—Feedstock Use
Year 2006 Year 2015 Year 2025
ETOH from Corn (billion bu) 1.85 3.83 4.78
ETOH from Cellulose (million dt)
Ag Residue
Switchgrass
Wood Wastes
Total = 224
95
76
53
Total = 670
245
312
113
Biodiesel from Soybeans (million bushel)
58 426 835
Electricity from Cellulose (million dt)
Ag Residue
Switchgrass
Wood Wastes
97.1
76.9
53.7
0.5
0.7
0.3

Results—Bioenergy/Bioproduct Production Costs(Feedstock Cost and Co-Product Credits Included)
Year 2006 Year 2015 Year 2025
ETOH (combined corn and cellulose)($/gal) 1.08 1.32 1.52
Biodiesel ($/gal) 0.69 1.80 2.50
Electricity ($/kwh) 0.047 0.079 0.081
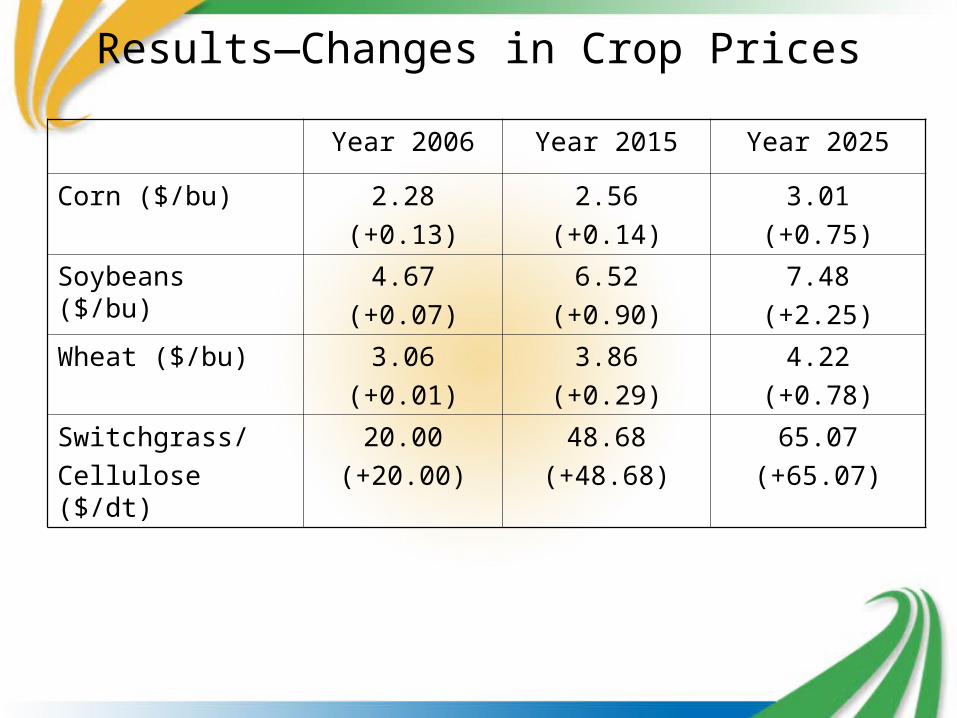
Results—Changes in Crop Prices
Year 2006 Year 2015 Year 2025
Corn ($/bu) 2.28
(+0.13)
2.56
(+0.14)
3.01
(+0.75)
Soybeans ($/bu) 4.67
(+0.07)
6.52
(+0.90)
7.48
(+2.25)
Wheat ($/bu) 3.06
(+0.01)
3.86
(+0.29)
4.22
(+0.78)
Switchgrass/
Cellulose ($/dt)
20.00
(+20.00)
48.68
(+48.68)
65.07
(+65.07)

Results—Changes in Farm Income (Million Dollars)
Year 2006 Year 2015 Year 2025
Change in Crop Income(value – expenses + government payments) (crop residues included)
+303 +4,732 +19,742
Change in Income from Switchgrass
0 +4,686 +15,351
Changes in livestock sector income—Analysis still underway. Substitution of feed co-products and need for forage are important components and are not well represented in current analysis. Likely to be negative.

Distribution of Net Returns
Year 2025Year 2015
Less Than 70,000,000
70,000,001 - 250,000,000
250,000,001 - 580,000,000
580,000,001 - 1,000,000,000
Above 1,000,000,000

Results—Changes in Crop Acres (millions)Year 2006 Year 2015 Year 2025
Corn 81.0 85.5
(+1.6)
80.7
(-0.3)
Soybeans 73.8 70.3
(-2.7)
62.5
(-8.0)
Wheat 58.2 58.4
(-3.9)
52
(-10.9)
Other Major Grain Crops
33.9 31.7
(-0.4)
29.1
(-2.23)
Switchgrass 0 27.2
(+27.2)
48.8
(+48.8)
Pasture acres decline and hay acres increase to meet forage needs

Closing Comments
• Based on the assumptions in the analysis, sufficient quantities of biomass resources exist to meet significant increases in biofuel production.
• Large-scale production of biofuels will require, and result in, a paradigm shift in agriculture.