economic outlookeconomic outlook · sector while local government debt and shadow bank lending are...
TRANSCRIPT

Economic OutlookEconomic Outlook
The Birmingham Estate PlanningThe Birmingham Estate Planning Council
Nathaniel KarpChi f U S E i tChief U.S. EconomistBBVA Research
Birmingham, AL February 7, 2013

US Economic Outlook
Global Outlook
Global GDP growth (%)
We expect global growth to pick up in 2013
g ( )Source: BBVA ResearchGlobal growth will recover
supported by policy makers:
• A three speed world still 2 8
5,13,9
3,2 3,54
5
6
• A three speed world, still dependent on stimulus policies
• Solid growth in emerging markets,
2,8,
1
2
3
4
Solid growth in emerging markets, slow recovery in the US, weakness in Europe -0,6
-2
-1
0
A tail-risk scenario is less likely
• Important challenges remain: fi l t it li t i t
2008 2009 2010 2011 2012 (f) 2013 (f)
Advanced economies Emerging economies
2
fiscal austerity, policy uncertainty, reform fatigue & geopolitical risks
Baseline
US Economic Outlook
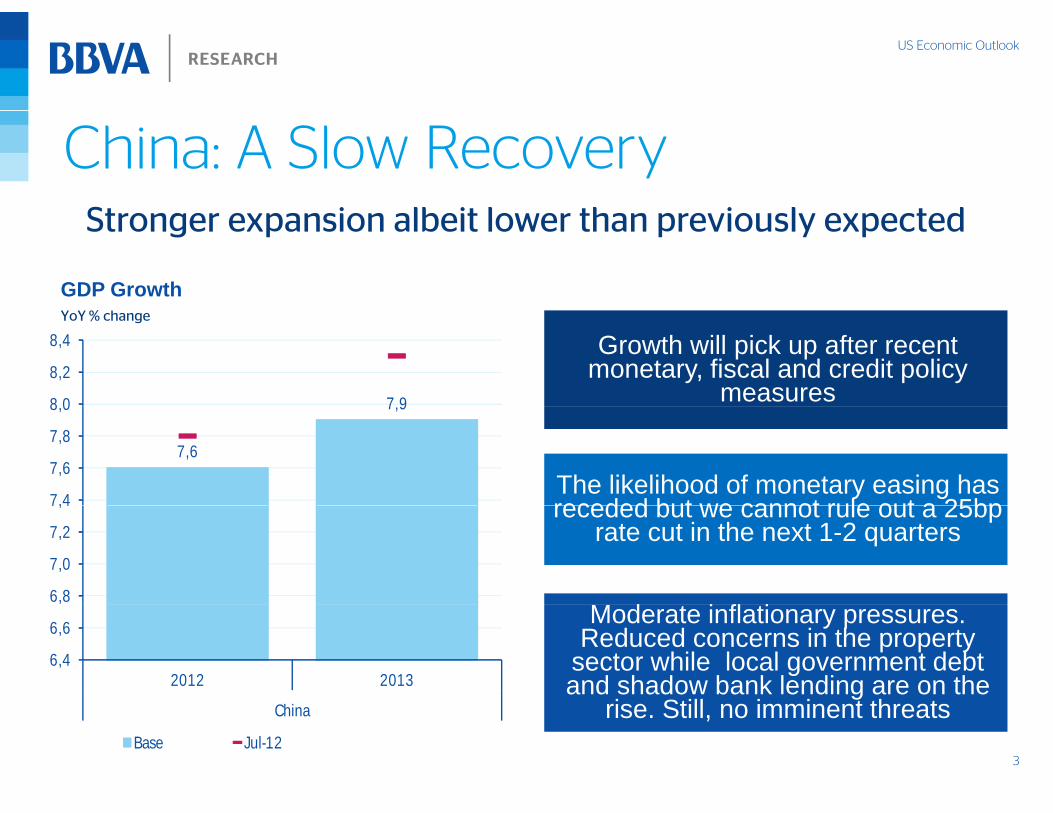
China: A Slow RecoverySt i lb it l th i l t d
GDP Growth
Stronger expansion albeit lower than previously expected
Growth will pick up after recent monetary, fiscal and credit policy
measures
YoY % change
7 98 0
8,2
8,4
The likelihood of monetary easing has receded but we cannot rule out a 25bp
7,6
7,9
7,4
7,6
7,8
8,0
receded but we cannot rule out a 25bp rate cut in the next 1-2 quarters
f6,8
7,0
7,2
7,4
Moderate inflationary pressures.Reduced concerns in the property
sector while local government debt and shadow bank lending are on the
i Still i i t th t
6,4
6,6
2012 2013
3
rise. Still, no imminent threatsChina
Base Jul-12

US Economic Outlook
LATAM: Solid performanceR b t i tl k f t t i St th
GDP Growth
Robust economic outlook for most countries. Stronger than expected data in Brazil and upside risks in Mexico
Stronger-than-expected data signaling solid domestic demand growth
GDP GrowthYoY % change
10
12
Policymakers will respond differently to FX appreciation pressures and
4
6
8
to FX appreciation pressures and higher inflation
‐2
0
2
Solid fundamentals help the region to withstand potential negative shocks
‐8
‐6
‐4 Contribución de la demanda interna
Contribución de la demanda externa
Crecimiento del PIB
Domestic demandExternal demandGDP Growth
4
T1 T2 T3 T4 T1 T2 T3 T4 T1 T2 T3 T4 T1 T2 T3 T4 T1 T2 T3 T4
2009 2010 2011 2012 2013
Source: BBVA Research & Haver

US Economic Outlook
Europe: Lower risk but high uncertaintyRi k ti h d li d i ifi tl idi t t th
EMU: PMI and Leading IndicatorsBBVA European Financial Stress
Risk perception has declined significantly, providing support to the recovery process. However, economic fundamentals remain weak
EMU: PMI and Leading IndicatorsIndex
BBVA European Financial StressIndex
2 0
2.560102
EMU
1.0
1.5
2.0
50
55
99
100
101
-0.5
0.0
0.5
40
45
96
97
98
-1.5
-1.0
07
08
09 10 11 12 13
30
35
94
95
ene-
08
may
-08
sep-
08
ene-
09
may
-09
sep-
09
ene-
10
may
-10
sep-
10
ene-
11
may
-11
sep-
11
ene-
12
may
-12
sep-
12
ene-
13
5
Jan
0
Jan
0
Jan
0
Jan
1
Jan
Jan
1
Jan
e m s e m s e m s e m s e m s e
Lead_EMU (left) PMI_EMU
Source: BBVA Research & Haver

US Economic Outlook
Europe: Financial fragmentationR d i fi i l i j h fi T kli kReducing financial stress is just the first step. Tackling market
fragmentation will allow to rebalance risks and eliminate uncertainty
Change in Interest Rate on New Bank Loans(In basis points, December 2010 to July 2012)Source: ECB, IMF and BBVA Research
Banking imbalances : capital injections and market opennessSource: BBVA Reaerch based on European Commissionand ECB
SP
IT
PT 80
100
120
140
H
IE (43%)
CY11%
13%
15%
GDP)
FR
SP
CYIRE
0
20
40
60
Households loanBE
LU
EL
CY
7%
9%tal Injection
(%G
NTH
GER
FIAU
BE
-60
-40
-20
-80
-60
-40
-20 0 20 40 60 80 00
sES
DE
IT
PT
FI
NL
BE
FR
AU
SK MTSI1%
3%
5%
Public Capit
6
- - - - 1
Corporate loans
FISK MT
‐1%‐80% ‐60% ‐40% ‐20% 0% 20% 40% 60%
Target Position (%GDP)
US Economic Outlook
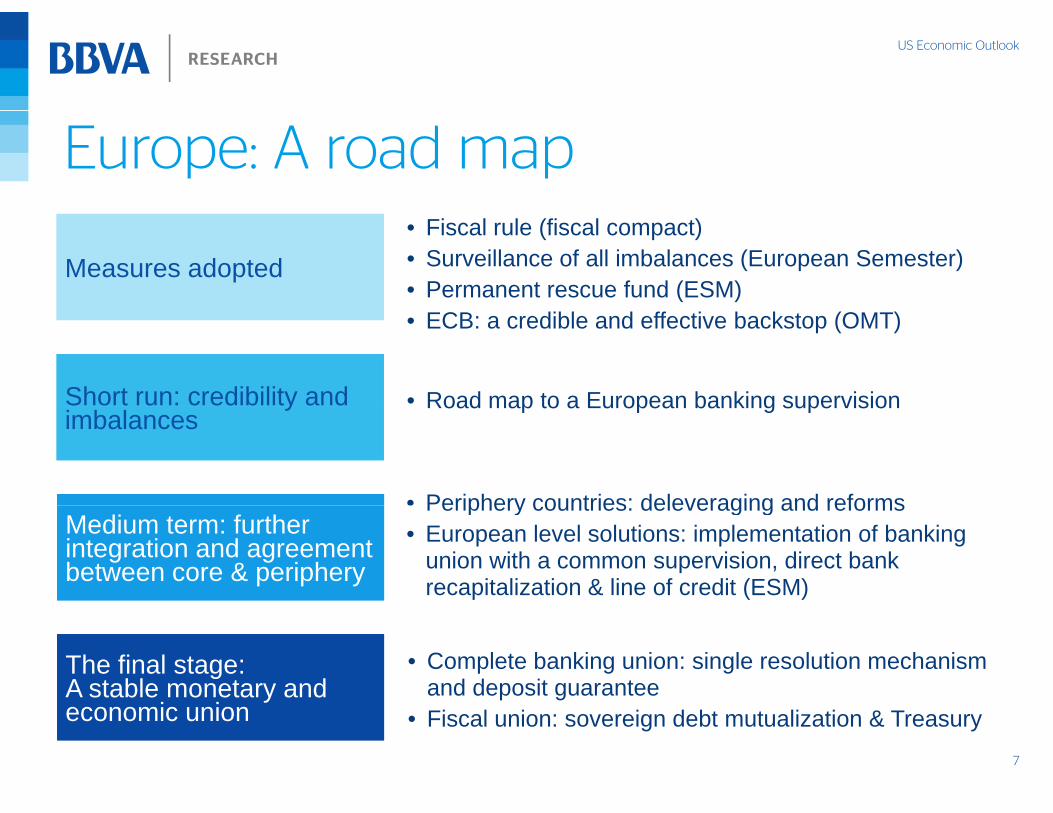
Europe: A road map
Measures adopted Measures adopted • Fiscal rule (fiscal compact)• Surveillance of all imbalances (European Semester)• Permanent rescue fund (ESM)• ECB: a credible and effective backstop (OMT)
• Road map to a European banking supervisionShort run: credibility and Short run: credibility and
• Periphery countries: deleveraging and reforms
Road map to a European banking supervisionyimbalances
yimbalances
Periphery countries: deleveraging and reforms• European level solutions: implementation of banking
union with a common supervision, direct bank recapitalization & line of credit (ESM)
Medium term: further integration and agreement between core & periphery
Medium term: further integration and agreement between core & periphery
• Complete banking union: single resolution mechanism and deposit guarantee
The final stage:A stable monetary and
i i
The final stage:A stable monetary and
i i
7
• Fiscal union: sovereign debt mutualization & Treasury economic unioneconomic union
US Economic Outlook
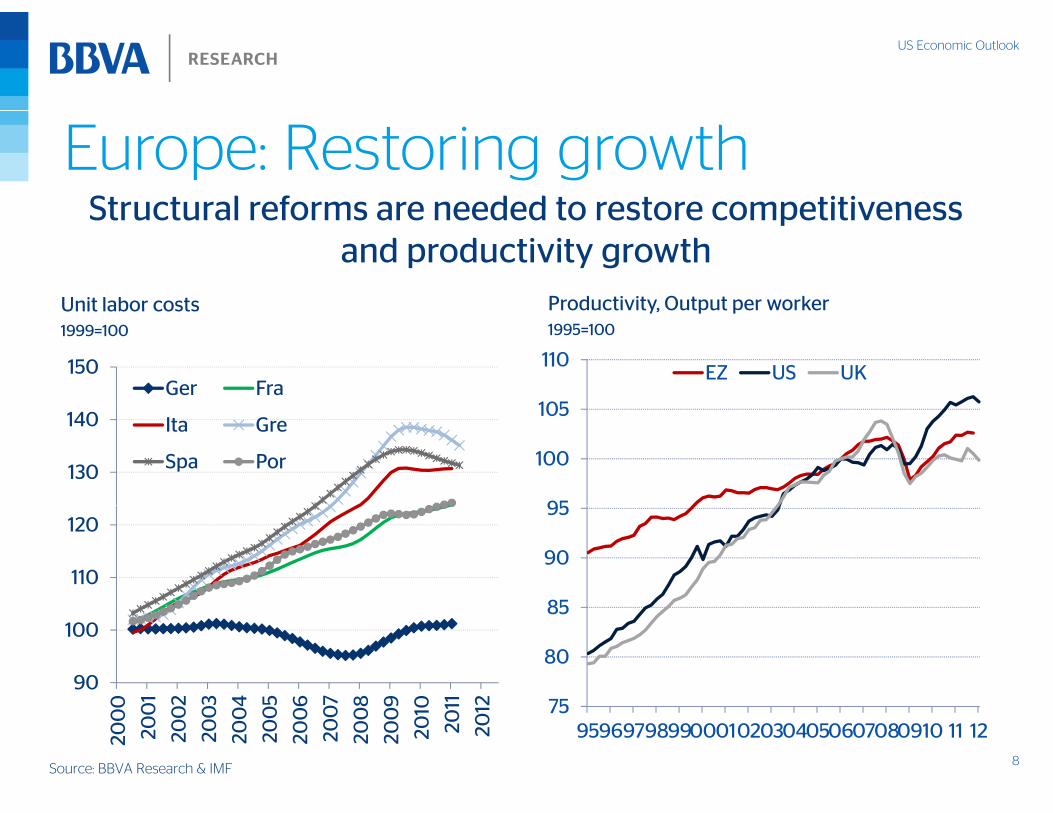
Europe: Restoring growthStructural reforms are needed to restore competitiveness
Productivity, Output per workerUnit labor costs
Structural reforms are needed to restore competitiveness and productivity growth
150Ger Fra
105
110EZ US UK
Productivity, Output per worker1995=100
Unit labor costs1999=100
130
140 Ita Gre
Spa Por
95
100
105
110
120
85
90
95
90
100
0 1 2 3 4 5 6 7 8 9 0 1 2 75
80
85
8
200
0
200
200
2
200
3
200
4
200
5
200
6
200
7
200
8
200
9
2010
201
2012 75
95969798990001020304050607080910 11 12
Source: BBVA Research & IMF

US Economic Outlook
Europe: Structural reforms•Fiscal stability •Wage and labor cost flexibility•Fiscal stability
•Enhance technological change
•Working-time flexibility
•Flexible retirement
•Wage and labor cost flexibility
•Reform security provisions
•Increase skills
•Reform benefit system
Employment Protection, 2008
•Flexible retirement
•Nurture Entrepreneurship
•Reform benefit system
•Align incentives
3 0
3.5Protection of permanent workers against dismissal Requirements for collective dismissal Regulation on temporary employment
Employment Protection, 2008Scale from 0 (least restrictions) to 6 (most restrictions)
1.5
2.0
2.5
3.0
0.0
0.5
1.0
ey ux co in sia ce ce g
al na
nia ay ny
dia m aly
nd
ria
nia ep nd zil
ds
ep ea nd ry en ile rk ael
ed nd an nd lia ca nd
UK da
US
9
Turk
eLu
Mex
icSp
aIn
do
nes
Fran
cG
reec
Po
rtu
gC
hin
Slov
enN
orw
aG
erm
anIn
dB
elg
iu Ita
Po
lan
Au
str
Est
on
Cze
ch R
eFi
nla
nB
raz
Net
her
lan
dSl
ovak
Re
Ko
reIc
elan
Hu
ng
aSw
ede
Ch
iD
enm
aIs
r aR
uss
ian
Fe
Swit
zerl
anJa
pa
Irel
anA
ust
ral
Sou
th A
fric
N Z
eala
n UC
anad U
Source: IMF, OECD & BBVA Research

US Economic Outlook
Political challengesS d d i l d liti l
Socio-economic democracy: EurozoneSocio-economic democracy: U S
Success depends on social and political consensus
0 7
0.8
Other Core0 7
0.8
G F
Socio-economic democracy: Eurozone%
Socio-economic democracy: U.S.%
0.5
0.6
0.7
are 0.5
0.6
0.7
are
Ger+Fra
Periphery
0 2
0.3
0.4
GD
P S
ha
Bubble: Population shareCA+TX
0 2
0.3
0.4
GD
P S
ha
B bbl P l
Periphery
Other Core
0
0.1
0.2
0 0 1 0 2 0 3 0 4 0 5 0 6 0 7 0 8
Periphery
0
0.1
0.2
0 0 1 0 2 0 3 0 4 0 5 0 6 0 7 0 8
Bubble: Population share
10
0 0.1 0.2 0.3 0.4 0.5 0.6 0.7 0.8Political Share
0 0.1 0.2 0.3 0.4 0.5 0.6 0.7 0.8Political Share
Source: BBVA Research & Haver
Other Core: NY, FL, IL, PA & NJ, Other Core: Neth, Fin, Aus, Bel, Lux

US Economic Outlook
Long-term Global Outlook
Businesses must prepare to changing global dynamics
Percentage of urban population and agglomerations by size classSource: UN Urbanization Prospects, 2011 revision
2011 2025
11

US Economic Outlook
Long-term Global Outlook
C i P i Chi (2000 2020) US Exports as a share of GDP and
Abundant opportunities for US businesses
Consumption Patterns in China (2000-2020)(% of total urban household spending)Source: Mckinsey
16.0160% of NRI % of GDP (rhs)
US Exports as a share of GDP and Nonresidential Investment; 1930-2012
10 0
12.0
14.0
100
120
140% of NRI % of GDP (rhs)
6.0
8.0
10.0
60
80
100
2.0
4.0
20
40
12
0.0030 40 50 60 70 80 90 00 10

US Economic Outlook
US Economic Activity“Th f i ' h i d b ”
U.S. Real GDP per working age populationU.S. Real GDP Growth
“The future ain't what it used to be” (Y. Berra)
Log GDP/Pop 16-65yrsYoY % change
6.011.2
2.0
4.0
10.8
11.0
-2.0
0.0
10.4
10.6
-6.0
-4.0
100
10.2
13
6.093 95 97 99 01 03 05 07 09 11
10.050 60 70 80 90 00 10
Source: BBVA Research & Haver

US Economic Outlook
Economic ActivityD it th h l d i 4Q12 t i di t
BBVAUS Weekly Activity IndexBBVA US MAI
Despite the sharp slowdown in 4Q12, recent indicators suggest stronger growth ahead
BBVAUS Weekly Activity Index3m % change
BBVA US MAILast vs. previous 3M average
H i
Prices
10
15
Confidence
Spending
Banking
Housing
0
5
10
Financial
Composite
Foreign Trade
Confidence
-5
0
Employment
Production
CRE
Financial
-15
-10
14
-2.0 -1.0 0.0 1.0 2.0 3.0
p y-20
2008 2009 2010 2011 2012 2013
Source: BBVA Research & Haver

US Economic Outlook
HouseholdsHousehold Debt Flows
1000
1500Mortgages Consumer+Other*
US$bn, SAARA painful deleverage process was needed to support sustained consumption
-500
0
500
Debt Service RatioD b d fi i l bli i di bl i
sustained consumption growth
-1000
500
98 99 00 01 02 03 04 05 06 07 08 09 10 11 12
Liabilities / Disposable Personal Income18
19
20Financial Obligations Ratio Debt Service Ratio
Debt and financial obligations to disposable income
1.2
1.4
Actual
Liabilities / Disposable Personal IncomeHousehold sector, ratio
15
16
17
0.8
1.0
Trend before12
13
14
150.6
90 92 94 96 98 00 02 04 06 08 10 12
Trend beforeboom
10
11
80 82 84 86 88 90 92 94 96 98 00 02 04 06 08 10 12Source: BBVA Research & Haver

US Economic Outlook
Business SectorA h lth t b i t t d d t t k th
NRI and capital pending planC t fit
A healthy corporate business sector stands ready to take the lead if expectations edge up
NRI and capital spending plansUS$bn and net index
Corporate profits% of GDP
13
14120040
CEO Confidence
Equipment & Software (rhs)
11
12
13
1050
1100
1150
10
20
30Equipment & Software (rhs)
9
10
900
950
1000
‐10
0
10
7
8
800
850
‐30
‐20
06 06 07 07 08 08 09 09 10 10 11 11 12 12
16
600 01 02 03 04 05 06 07 08 09 10 11 12 13
Source: Haver & BBVA Research
Mar
Sep
Mar
Sep
Mar
Sep
Mar
Sep
Mar
Sep
Mar
Sep
Mar
Sep

US Economic Outlook
Business SectorH ll fi f h ll i b i
Mo t Impo tant P oblemS ll B i O ti i
However, smaller firms face a more challenging business environment
Most Important Problem:% sha of responsesre
Small Business OptimismIndex
15
20Good time to expand
Taxes
5
10
15Increase Employment
Other
Sales
Regulation
-5
0
Labor Quality
Competition
Insurance
-15
-10
07
07
07
08
08
08
09
09
09 10 10 10 n
11 y 11
p 11 12 12 12 Interest rates
Labor cost
Inflation
17Source: Haver & BBVA Research
Jan
0M
ay 0
Sep
0Ja
n 0
May
0Se
p 0
Jan
0M
ay 0
Sep
0Ja
n
May
Se
p
Jan
May
Sep
Jan
M
ay
Sep
0 10 20 30

US Economic Outlook
Residential ActivityA i i iti t ib ti f th d i
Home PricesHousing Starts and Home Sales
An increasing positive contribution from the enduring housing recovery
o e cesIndex
Housing Starts and Home SalesThousands
8000
90002500
200
220
Distressed Sales
5000
6000
7000
1500
2000
180
200 Distressed Sales
Ex. Distressed Sales
2000
3000
4000
500
1000
S
140
160
0
1000
2000
0
500
03
04
05
06 07
08
09 10 11 12
Housing StartsHome sales (rhs)
100
1200
7
08
09 0 11 12
18Source: BBVA Research & Haver Source: BBVA Research, CoreLogic, Haver
Jan
0
Jan
0
Jan
0
Jan
0
Jan
0
Jan
0
Jan
0
Jan
1
Jan
Jan
Jan
0
Jan
0
Jan
0
Jan
1
Jan
1
Jan
1
US Economic Outlook
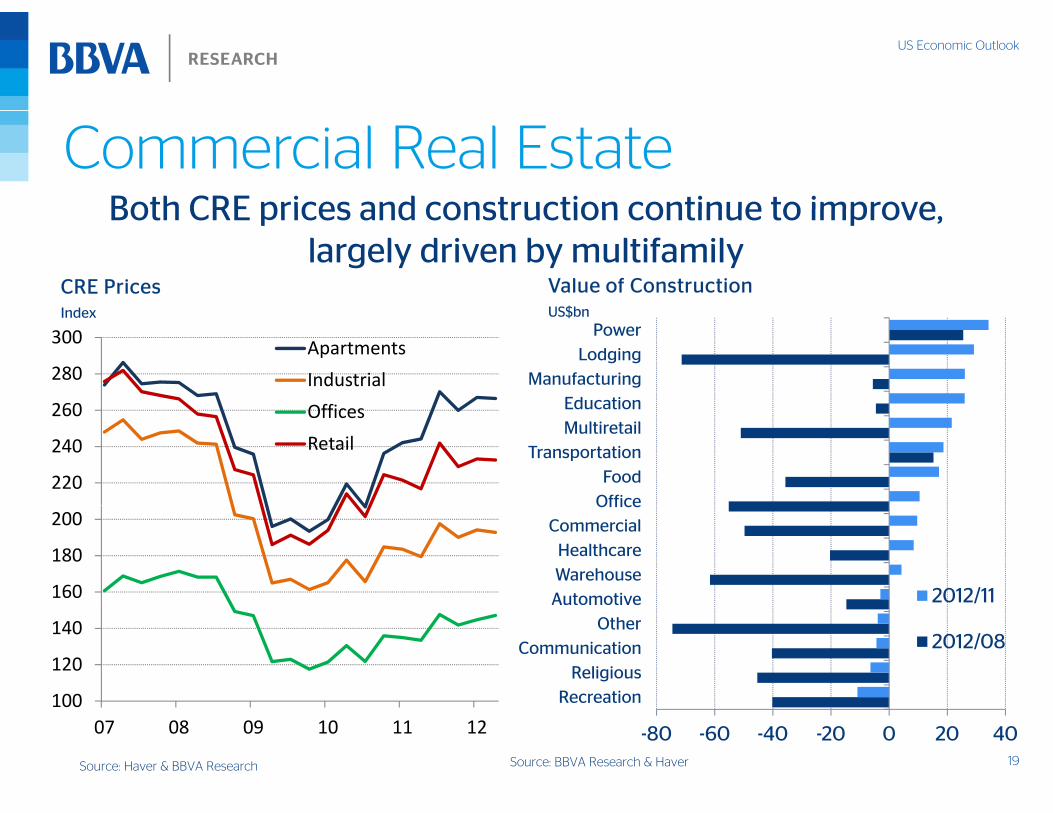
Commercial Real EstateBoth CRE prices and construction continue to improve
Value of ConstructionUS$b
CRE PricesI d
Both CRE prices and construction continue to improve, largely driven by multifamily
US$bnIndex
260
280
300 Apartments
Industrial
Offi Education
ManufacturingLodging
Power
220
240
260 Offices
Retail
Office
Food
TransportationMultiretail
Education
160
180
200
AutomotiveWarehouse
Healthcare
CommercialOffice
2012/11
100
120
140
RecreationReligious
Communication
Other
Automotive
2012/08
19Source: BBVA Research & HaverSource: Haver & BBVA Research
10007 08 09 10 11 12 -80 -60 -40 -20 0 20 40
ec eat o

US Economic Outlook
Labor MarketsL b k t k tit t j h d i dLabor market weakness constitutes a major headwind
N f P i t P llNonfarm payrollYoY % change
Nonfarm Private PayrollT= start of the recession
120
1973 741
16
110
1151973-74
1981-821
1
1
2
4
100
1051990-91
1981 82
0
0
1
1
-2
0
90
95
2007-12
2001-02
0
0
0
6
-41954-86: 2.1%
1987-01: 1.9%
2002-12: 0.1%
20Source: BLS & BBVA Research
90T 4 8 12 16 20 24
0-654 58 62 66 71 75 79 83 88 92 96 00 05 09
US Economic Outlook
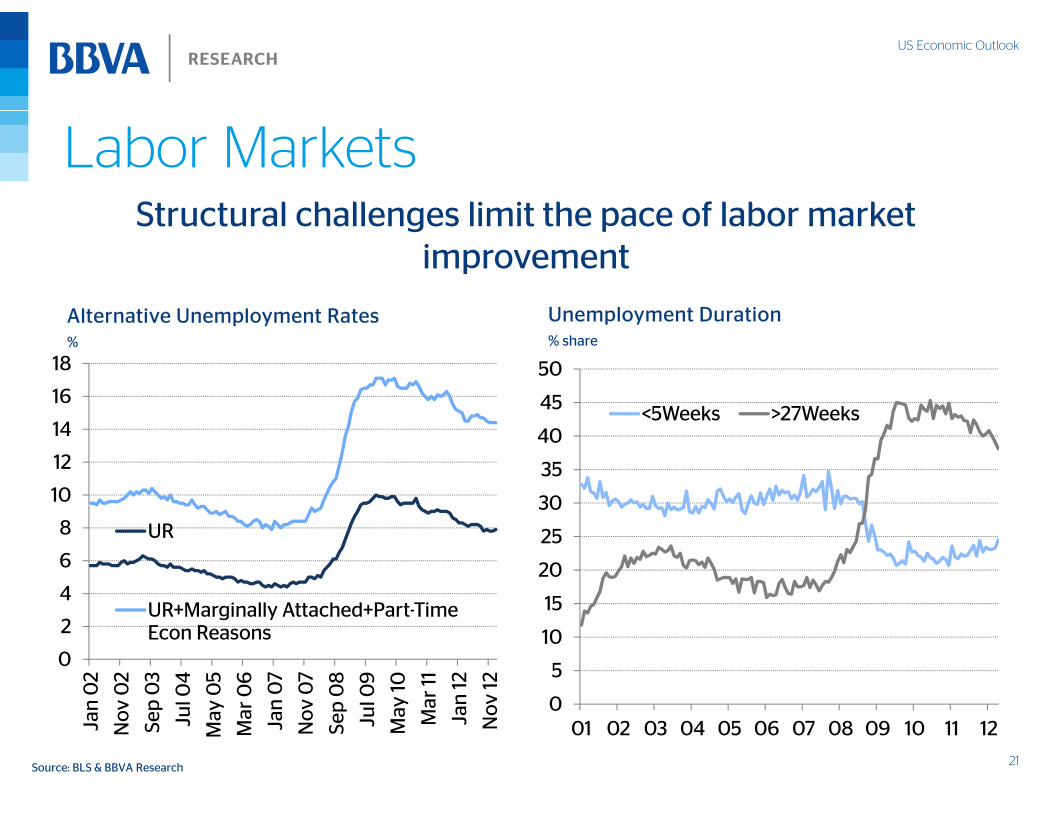
Labor MarketsStructural challenges limit the pace of labor marketStructural challenges limit the pace of labor market
improvement
U l t D tiAlternative Unemployment Rates%
Unemployment Duration% share
16
18
45
50
5W k 27W k
10
12
14
30
35
40
45 <5Weeks >27Weeks
4
6
8 UR
UR M i ll Att h d P t Ti 15
20
25
30
0
2
n 0
2
v 0
2
p 0
3
l 04
y 0
5
r 0
6
n 0
7
v 0
7
p 0
8
l 09
y 10
ar 11
n 12 v 12
UR+Marginally Attached+Part-Time Econ Reasons
0
5
10
15
21Source: BLS & BBVA Research
Jan
Nov Se
p
Jul
May
Mar Ja
n
Nov
Sep
Jul
May M
a
Jan
Nov 0
01 02 03 04 05 06 07 08 09 10 11 12

US Economic Outlook
Banking SectorA h lth b ki t i d d t t
Bank Profitability and CapitalDelinquency rates
A healthy banking sector is needed to support a private-led recovery
Bank Profitability and Capital%
Delinquency rates% of total loans
2.09.5Core CapitalROA (rhs)16
18Real estate
0 5
1.0
1.5
8 5
9.0ROA (rhs)
12
141-4 family
Construction
C&I
0 5
0.0
0.5
8.0
8.5
6
8
10 Credit cards
Other consumer
-1 5
-1.0
-0.5
70
7.5
0
2
4
22
1.57.004 05 06 07 08 09 10 11 12
007 08 09 10 11 12
Source: BBVA Research & Haver
US Economic Outlook
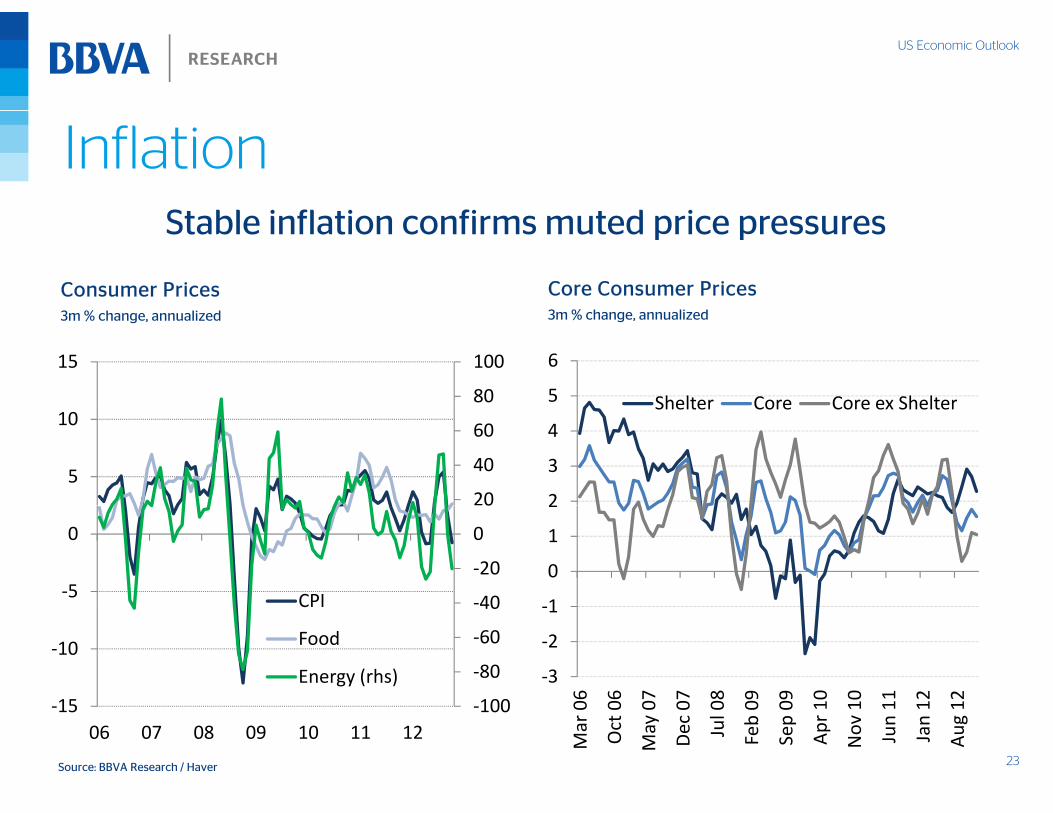
Inflation
Core Consumer PricesConsumer Prices
Stable inflation confirms muted price pressures
3m % change, annualized3m % change, annualized
5
6
Shelter Core Core ex Shelter80
10015
2
3
4Shelter Core Core ex Shelter
20
40
60
5
10
1
0
1
2
‐40
‐20
0
0
‐5
0
CPI
‐3
‐2
‐106 06 07 07 08 09 09 10 10 11 12 12100
‐80
‐60
‐40
15
‐10
CPI
Food
Energy (rhs)
23Source: BBVA Research / Haver
Mar 0
Oct 0
May 0
Dec 0
Jul 0
Feb 0
Sep 0
Apr 1
Nov
1
Jun 1
Jan 1
Aug
1‐100‐1506 07 08 09 10 11 12
US Economic Outlook
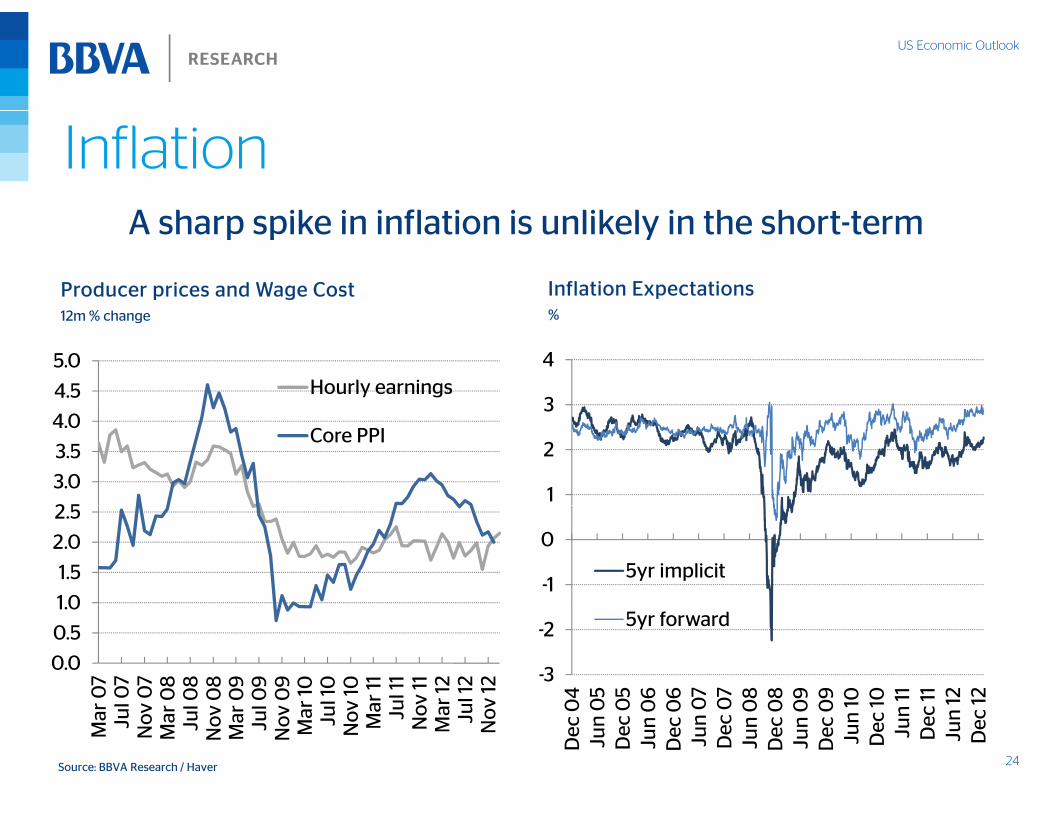
Inflation
Inflation ExpectationsProducer prices and Wage Cost
A sharp spike in inflation is unlikely in the short-term
%12m % change
3
4
4.5
5.0Hourly earnings
1
2
3
2 5
3.0
3.5
4.0Core PPI
-1
0
5yr implicit
1 0
1.5
2.0
2.5
-3
-2
04
05
05
06
06 07
07
08
08
09
09 10 10 11 11 12 12
5yr forward
0.0
0.5
1.0
07
07
07
08
08
08
09
09
09
r 10 l 10
v 10 r 11
ul 1
1v
11r
12 l 12
v 12
24Source: BBVA Research / Haver
Dec
0Ju
n 0
Dec
0Ju
n 0
Dec
0Ju
n 0
Dec
0Ju
n 0
Dec
0Ju
n 0
Dec
0Ju
n 1
Dec
1Ju
n
Dec
Ju
n 1
Dec
1
Mar Ju
lN
ovM
ar
Jul
Nov
M
ar
Jul
Nov
M
ar Jul
Nov M
a J u Nov
Mar Ju No v

US Economic Outlook
Fiscal PolicyTh fi l liff d l h l d t id th i
Size of the cliff
The fiscal cliff deal helped to avoid another recession
• The deal represents a wasted % of GDP, CY 2013
4.0
4.5Doc fix
popportunity to improve fiscal conditions
2.5
3.0
3.5 ACA
Tax extendersUI benefits
• Positive: Avoids an abrupt economic impact; increases revenues; extension of the sequester and doc
1.5
2.0
2.5
Payroll tax
Tax cuts
fix with offsetting provisions; and leaves open the option to discuss a more meaningful agreement
0.0
0.5
1.0 AMT Patch
BCA cuts • Negative: No entitlement reform; no
pro-growth policy measures; no debt sustainability triggers; missed
25
Fiscal Cliff Left out ATRAdebt sustainability triggers; missed opportunity for a grand-bargain
*American Taxpayer Relief Act of 2012
Source: BBVA Research
US Economic Outlook
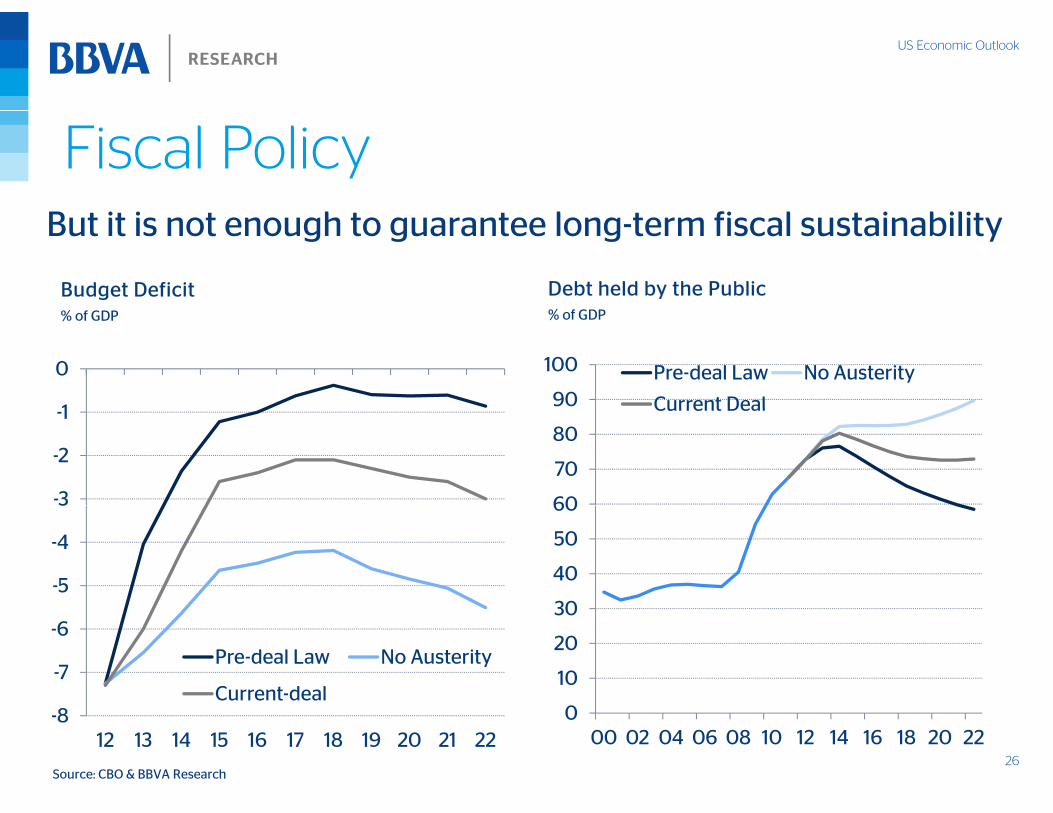
Fiscal Policy
Debt held by the PublicBudget Deficit
But it is not enough to guarantee long-term fiscal sustainability
% of GDP% of GDP
1
0
90
100 Pre-deal Law No Austerity
Current Deal
-3
-2
-1
60
70
80
Current Deal
-5
-4
3
30
40
50
60
-7
-6Pre-deal Law No Austerity
Current-deal10
20
30
26
-812 13 14 15 16 17 18 19 20 21 22
000 02 04 06 08 10 12 14 16 18 20 22
Source: CBO & BBVA Research

US Economic Outlook
Monetary PolicyTh FOMC i i d th t th d
Fed Balance Sheet
The FOMC remains worried on the strength and sustainability of the recovery
Fed Balance SheetUS$bn
FOMC Strategy
Objecti e 3000
3500
Banks' Reserves• Objective• Improve labor market conditions and
maintain price stability
• Quantitative Easing 2000
2500
3000Assets
Q g– $40bn monthly purchases of MBS
– $45bn monthly purchases of Treasury Securities
R i ti i i l t f it 1000
1500
2000
– Reinvesting principal payments from its holdings rolling over maturing Treasuries
• Policy Guidance– Thresholds: unemployment rate at 6.5% and 0
500
1000
27
Thresholds: unemployment rate at 6.5% and one-two year inflation expectation at 2.5%
007 08 09 10 11 12
Source: BBVA Research & Haver

US Economic Outlook
Financial MarketsThe positive reaction to QE3 and the fiscal deal could
Asset Prices & Personal ConsumptionEquity Prices and Risk Perception
The positive reaction to QE3 and the fiscal deal could generate a positive feedback loop
pYoY % change
q y pS&P 500 & VIX
26
28
1 500
1,550SP500 VIX (rhs)
6
8
40
60S&P500 Real PCE (rhs)
20
22
24
1,450
1,500
4
6
20
40
14
16
18
20
1,350
1,400
0
2
-20
0
10
12
14
1,250
1,300
2 2 2 2 2 2 3
-4
-2
-60
-40
82
84
86
89 91
94
96
99 01
03
06
08 -11
28Source: BBVA Research / Haver
Jan
-1
Mar
-1
May
-1
Jul-1
Sep
-1
Nov
-1
Jan
-1
Feb
-8
Jul-8
Dec
-8
May
-8
Oct
-9
Mar
-9
Au
g-9
Jan
-9
Jun
-0
Nov
-0
Ap
r-0
Sep
-0
Feb
-

US Economic Outlook
QE3 ImpactImpact on the unemployment rate
Th f ll i t f QE3 d d thp p y
Pp, accumulated
-0.20
0.00The full impact of QE3 depends on the
size and duration of the program, which are inversely dependent on the self-
i bili f h
Impact of QE3 on Real GDP growth% l d
-0.60
-0.40
3Qtrs 5Qtrs 11Qtrs
sustainability of the recovery
Impact on 5yr forward inflation expectations
%, accumulated -0.80
1.4
1.6
1.83Qtrs
5QtrsImpact on 5yr forward inflation expectationsPp, accumulated
0.15
0.203Qtrs 5Qtrs 11Qtrs
0.8
1.0
1.2 11Qtrs
0 00
0.05
0.10
0 0
0.2
0.4
0.6
29
0.000.0

US Economic Outlook
Interest RatesThe low interest rate environment is likely to continue for a
Mortgage Interest RatesYield Curve
The low interest rate environment is likely to continue for a prolonged period
Mortgage Interest Rates%
Yield Curve%
3 00
3.50
6.5
7.0
2 00
2.50
3.00 10/12/12
12/07/125.0
5.5
6.0
1.00
1.50
2.00
02/01/13
3 5
4.0
4.5
0.00
0.50
1.00
2 0
2.5
3.0
3.55/1 ARM 30Y-fixed
30Source: Bloomberg & BBVA Research Source: Haver & BBVA Research
1m 3m 6m 1y
r
2yr
3yr
5yr
7yr
10yr
20yr
30yr
2.005 06 07 08 09 10 11 12 13

US Economic Outlook
Policy UncertaintyResponse to Uncertainty: Unemployment RatePercentage pointsPolicy uncertainty is the most
important domestic risk to our outlook 0.15
0.20
BBVA US Uncertainty IndexIndex (0=normalized average)
our outlook
0.05
0.10
Response to Uncertainty: U.S. Treasuries
LehmannDebt ceiling
0.000 6 12 18 24
8.0
10.0
Response to Uncertainty: U.S. Treasuries bp
0
530YR 10YR 3MONTH
Fiscal
Cliff
2 0
4.0
6.0
-10
-5
-2.0
0.0
2.0
31
Index weights: Policy(60%), Financial(30%), Geopolitical(10%)
-150 2 4 6 8 10 12 14 16 18 20 22 24
-4.0J-06 J-07 J-08 J-09 J-10 J-11 J-12
US Economic Outlook
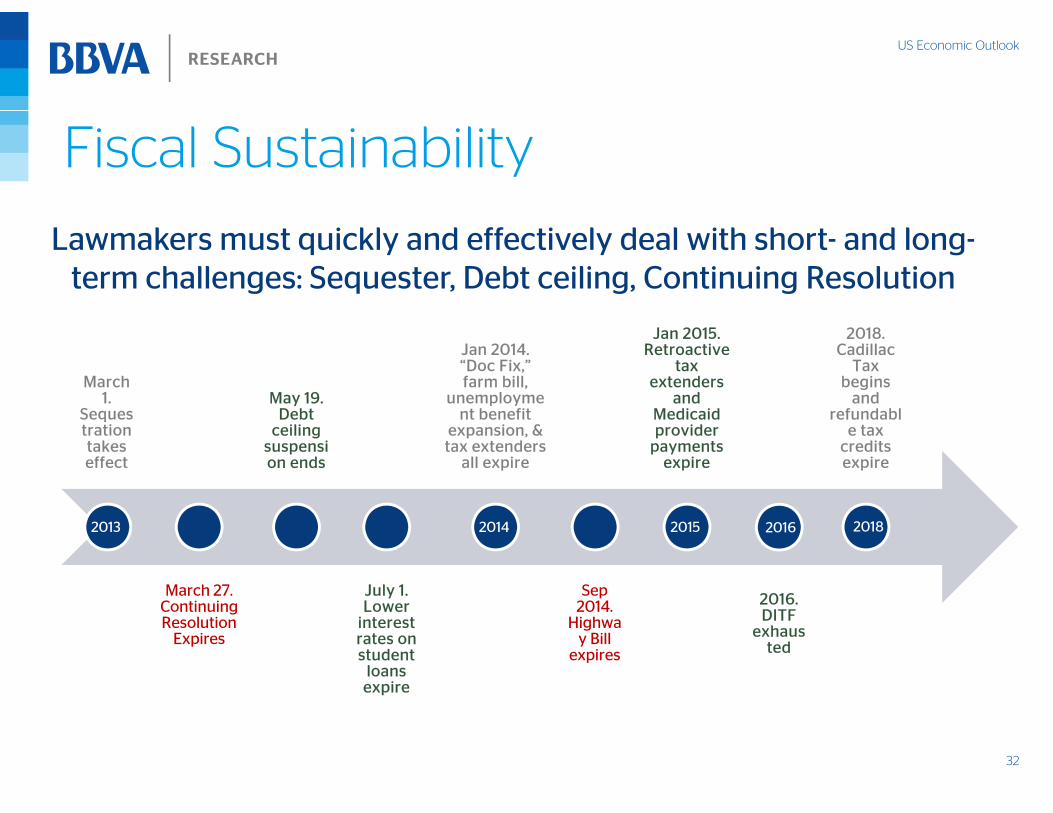
Fiscal Sustainability
Lawmakers must quickly and effectively deal with short- and long-term challenges: Sequester, Debt ceiling, Continuing Resolution
March 1. May 19.
Jan 2014. “Doc Fix,” farm bill,
unemployme
Jan 2015. Retroactive
tax extenders
and
2018. Cadillac
Tax begins
and Sequestration takes effect
Debt ceiling
suspension ends
nt benefit expansion, & tax extenders
all expire
Medicaid provider
payments expire
refundable tax
credits expire
March 27. Continuing
July 1. Lower
Sep 2014 2016.
2014 2015 20162013 2018
Continuing Resolution
Expires
Lower interest rates on student
loans expire
2014. Highwa
y Bill expires
2016. DITF
exhausted
32
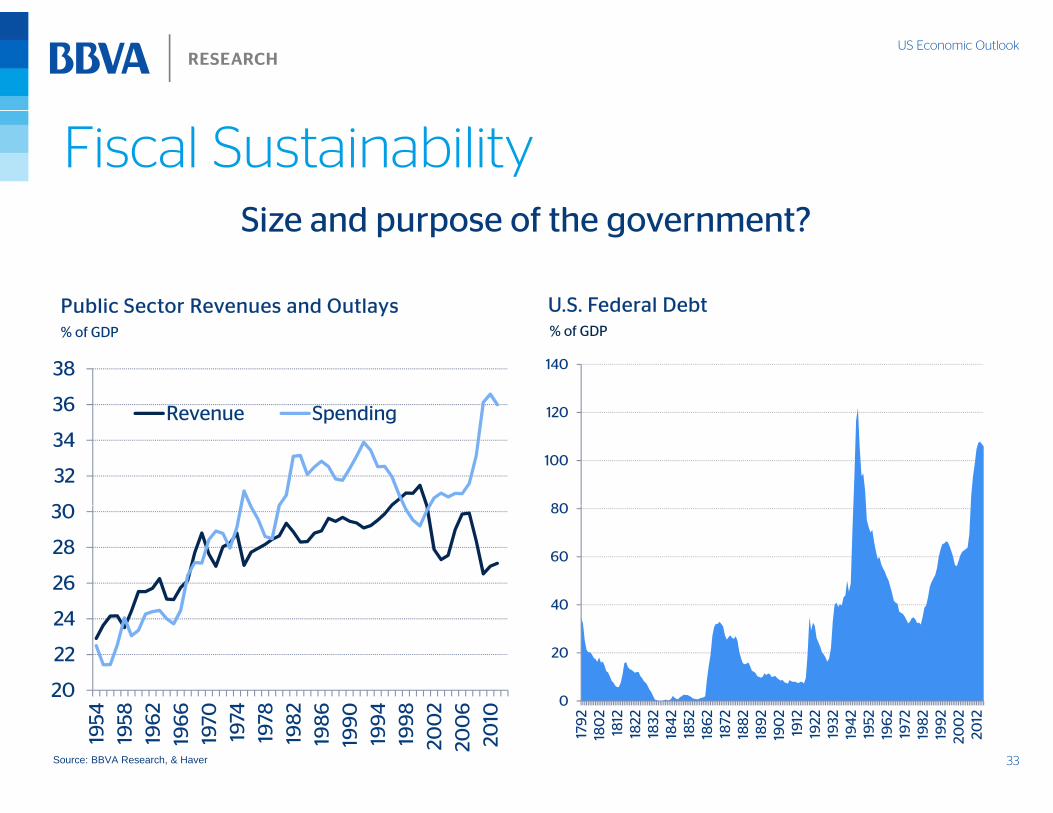
US Economic Outlook
Fiscal SustainabilitySi d f th t?
U S Federal DebtPublic Sector Revenues and Outlays
Size and purpose of the government?
U.S. Federal Debt% of GDP
Public Sector Revenues and Outlays% of GDP
36
38
R S di
140
30
32
34
36 Revenue Spending
80
100
120
26
28
30
40
60
80
20
22
24
0
20
40
33Source: BBVA Research, & Haver
1954
1958
196
219
66
1970
1974
1978
198
219
86
199
019
94
199
820
02
200
620
10
0
179
218
02
1812
1822
1832
184
218
5218
62
1872
188
218
92
190
219
1219
2219
3219
42
1952
196
219
7219
82
199
220
02
2012

US Economic Outlook
Fiscal SustainabilitySi d f th t?
State DebtGovernment Outlays
Size and purpose of the government?
State Debt% of GDP, ranking
Government Outlays% of GDP, CBO
35
Medicare/25
30
S. Security
aid
15
20
Other5
10
WorseBetter
34Source: BBVA Research, & Haver
012 22 32 42 52 62 72 82
WorseBetter
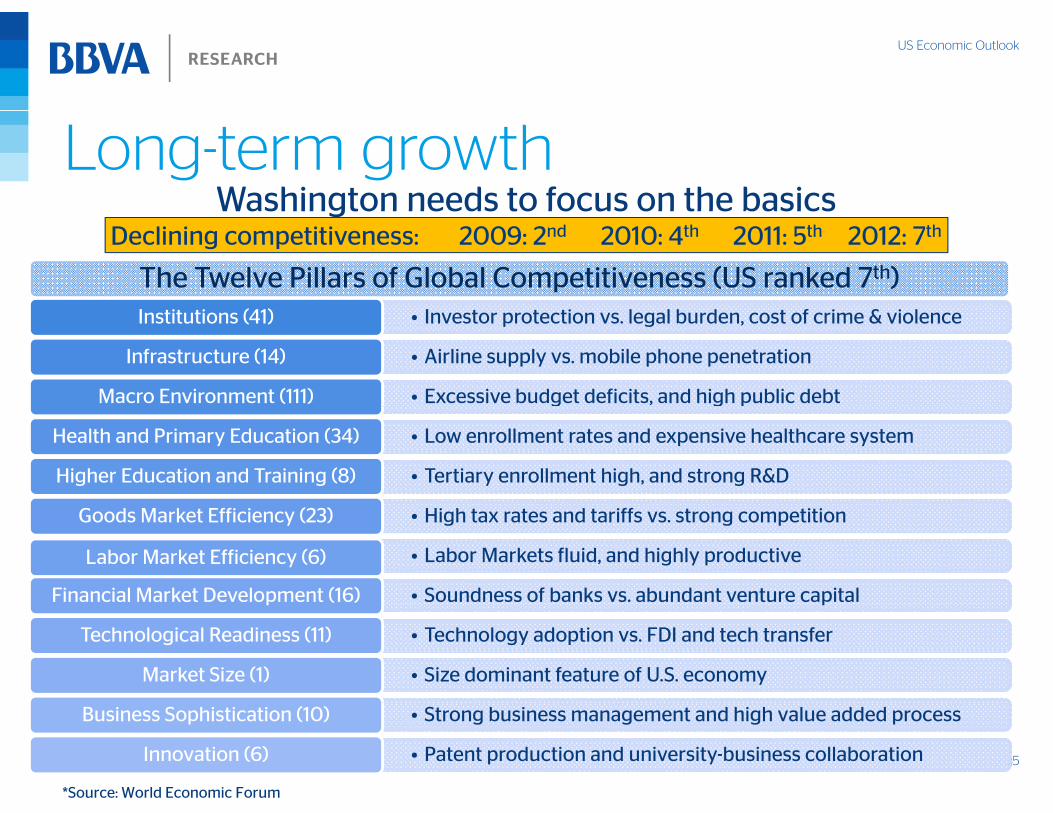
US Economic Outlook
Long-term growthWashington needs to focus on the basicsWashington needs to focus on the basics
Declining competitiveness: 2009: 2nd 2010: 4th 2011: 5th 2012: 7th
The Twelve Pillars of Global Competitiveness (US ranked 7th)• Investor protection vs. legal burden, cost of crime & violenceInstitutions (41)
• Airline supply vs. mobile phone penetrationInfrastructure (14)
• Excessive budget deficits, and high public debtMacro Environment (111)
• Low enrollment rates and expensive healthcare systemHealth and Primary Education (34)
• Tertiary enrollment high, and strong R&DHigher Education and Training (8)
• High tax rates and tariffs vs. strong competitionGoods Market Efficiency (23)
• Labor Markets fluid, and highly productiveLabor Market Efficiency (6)
• Soundness of banks vs. abundant venture capitalFinancial Market Development (16) pp
• Technology adoption vs. FDI and tech transferTechnological Readiness (11)
• Size dominant feature of U.S. economyMarket Size (1)
35
• Strong business management and high value added process Business Sophistication (10)
• Patent production and university-business collaborationInnovation (6)
*Source: World Economic Forum

US Economic Outlook
Long-term growthAdd i k b ttl k ill b t t ti l GDP
GDP per capita
Addressing key bottlenecks will boost potential GDP
Potential GDP GrowthGDP per capita2010 US$
Potential GDP GrowthYoy % change
70,0004.0
Population TFP Part RateCapital Hours NAIRUPotential
65,000
NoCrowdingOut
With Crowding Out2.5
3.0
3.5Potential
55,000
60,000
1.0
1.5
2.0
50,000
-0.5
0.0
0.5
36Source: BBVA Research & Haver
45,0002010 2016 2022 2028 2034
-1.080 84 88 92 96 00 04 08 12 16

US Economic Outlook
Polarization Political Polarization: House and Senate Polarization and Income Inequality% % & Index 0 to 1
0 90
1.00House Senate
0.44
0.49
0.90
1.00House SenateGini (rhs)
0.80
0.90
0 34
0.39
0.44
0 70
0.80
0.90
Polarization and Median AgePolarization and Foreign Born Population
0.70
1879
1887
189
519
03
1911
1919
1927
1935
194
319
5119
5919
67
1975
198
319
91
199
920
07
0.340.70
1947
1951
1955
1959
196
319
67
1971
1975
1979
198
319
8719
91
199
519
99
200
320
07
Polarization and Median Age% & years
Polarization and Foreign Born Population% & % of total Population
10
12
0 90
1.00HouseSenateForeign Born (rhs) 33
35
37
0 90
1.00House Senate Age (rhs)
4
6
8
0 70
0.80
0.90 Foreign Born (rhs)
27
29
31
33
0 70
0.80
0.90
37
40.70
1947
1951
1955
1959
196
319
67
1971
1975
1979
198
319
8719
91
199
519
99
200
320
07
270.70
1947
1951
1955
1959
196
319
67
1971
1975
1979
198
319
8719
91
199
519
99
200
320
07

US Economic Outlook
Opportunities: Energy RevolutionGeopolitical rebalancing higher employment CO emissions
Energy Trade BalanceEnergy Consumption
Geopolitical rebalancing, higher employment, CO emissions reduction & stronger economic growth
Energy Trade BalanceQuadrillion Btu
Energy Consumption Quadrillion Btu
120 5
C l 20Coal, 21
Other, 15Other, 21
80
100
-5
0
NaturalGas, 23
NaturalGas, 27
Coal, 20Coal, 21
40
60
-15
-10
Petroleum, 37
Petroleum, 36
0
20
-25
-20 Crude Oil OtherNatural Gas Liquid FuelsTotal
38
02009 2035
-25
200
9
2011
2013
2015
2017
2019
2021
2023
2025
2027
2029
2031
2033
2035
Source: BBVA Research , & EIA
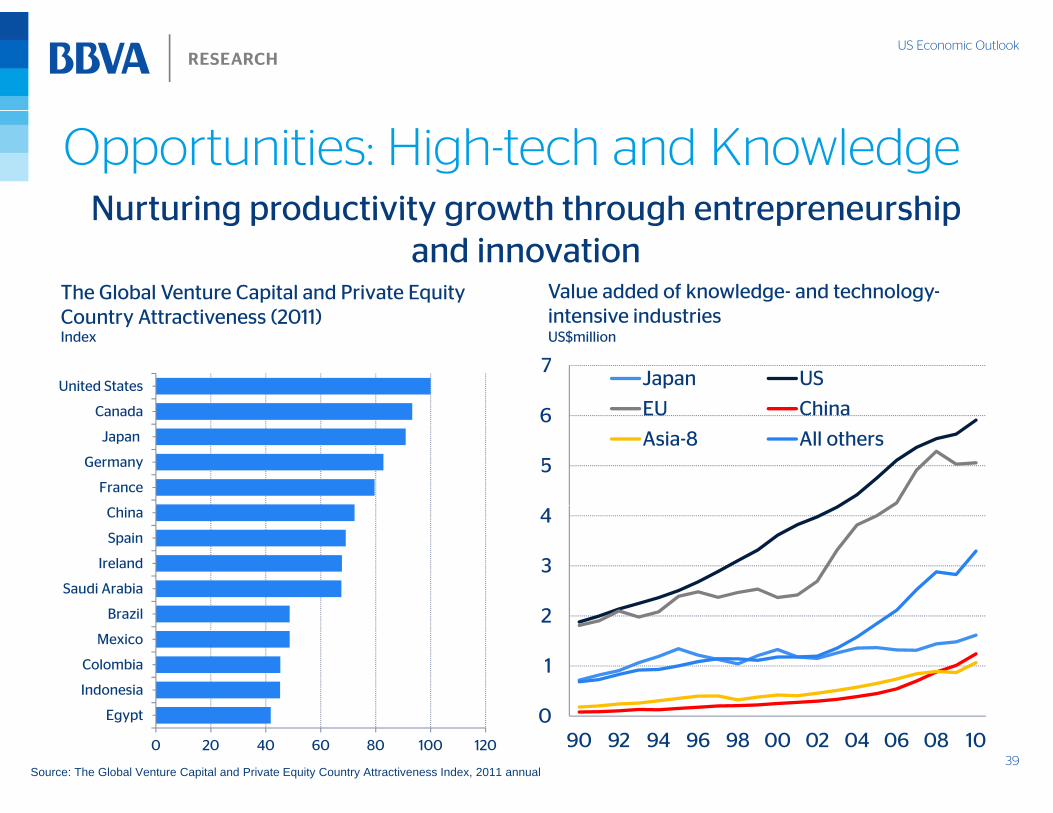
US Economic Outlook
Opportunities: High-tech and KnowledgeNurturing productivity growth through entrepreneurship
Value added of knowledge- and technology-The Global Venture Capital and Private Equity
Nurturing productivity growth through entrepreneurship and innovation
intensive industriesUS$million
Country Attractiveness (2011)Index
C d
United States7
Japan US
EU China
France
Germany
Japan
Canada
5
6 EU China
Asia-8 All others
Saudi Arabia
Ireland
Spain
China
3
4
Indonesia
Colombia
Mexico
Brazil
1
2
390 20 40 60 80 100 120
Egypt
Source: The Global Venture Capital and Private Equity Country Attractiveness Index, 2011 annual
090 92 94 96 98 00 02 04 06 08 10

US Economic Outlook
Opportunities: The Green EconomyRenewable resources and the clean economy
Employment Growth in Selected Clean Industries
Renewable resources and the clean economy offer huge upsides
Employment Growth in Selected Clean IndustriesAnnual average % growth 2003-2010
6 +39,668Absolute change
4
5
+754+79,401 +565,337
g
2
3
0
1+3,237
+87,000
40-1
US Average Recycled-Content Products
Recycling and Reuse
Waste-to-Energy Waste Management and
Treatment
Aggregate Clean Economy
Source: Brookings Institute and BLS

US Economic Outlook
Regional OutlookThe energy boom is boosting economic performance in
Home PricesUnemployment Rate
The energy boom is boosting economic performance in central states
% change 2007-12
p y%, Last
41
WorseBetterSource: BBVA Research & Haver

US Economic Outlook
Regional OutlookRegional risks automatic spending cuts could have
GDP Impact as % of State GDPEmployment losses as % of State Total
Regional risks: automatic spending cuts could have heterogeneous effects
pImpact from sequestration
p yImpact from sequestration
42
LowerHigherSource: BBVA Research & Haver

US Economic Outlook
AlabamaState Monthly Activity Index Housing Price Index (Purchase Only)3-Month Moving Average Year over Year % Change
0.20.40.6
5
10
15
-0 6-0.4-0.20.0
USAlabama -10
-5
0
5
USAlabama
Unemployment RateTotal Exports
-0.80.6
01 02 03 04 05 06 07 08 09 10 11Source: BLS / Haver Analytics
-15
10
01 02 03 04 05 06 07 08 09 10 11 12Source: BLS / Haver Analytics
Unemployment Rate%
Total ExportsYear over Year % Change, Moving Average
40
60
8 0
10.0
12.0
USAlabama
-20
0
20
US 2 0
4.0
6.0
8.0 Alabama
43
-40
20
01 02 03 04 05 06 07 08 09 10 11
USAlabama
Source: BLS / Haver Analytics
0.0
2.0
02 03 04 05 06 07 08 09 10 11 12Source: BLS / Haver Analytics

US Economic Outlook
AlabamaSolid growth in North America and strong demand for commodities
Alabama Value of ExportsAlabama Exports by Country
Solid growth in North America and strong demand for commodities will support exports and the local economy
Alabama Value of ExportsAnnual average, US$bn
Alabama Exports by CountryYoY % change, 4QMA
70
8.0 Transportation Chemicals
Minerals Metals125
150Canada
5.0
6.0
7.0 Minerals Metals
Machinery
75
100
125China
Germany
Mexico
3.0
4.0
25
50Other
0 0
1.0
2.0
-50
-25
0
44
0.02006-07 2010-11 2012
5007 08 09 10 11 12
Source: BBVA Research & Haver
US Economic Outlook
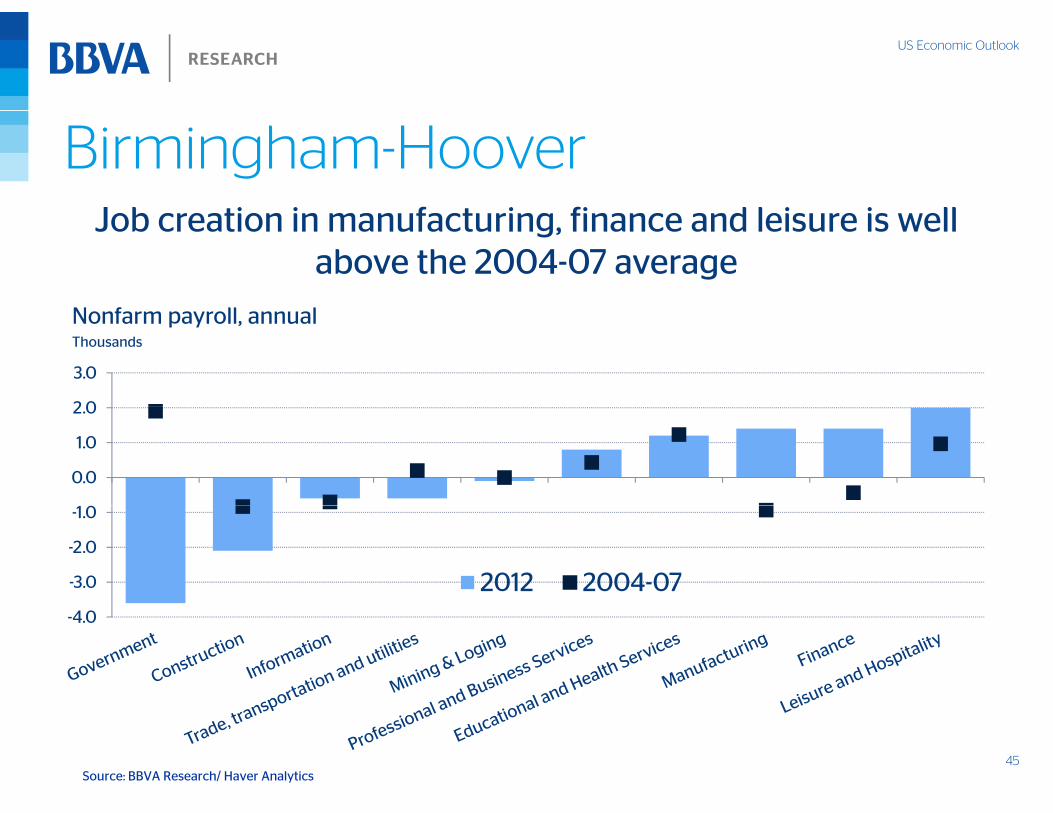
Birmingham-HooverJ b ti i f t i fi d l i i llJob creation in manufacturing, finance and leisure is well
above the 2004-07 average
N f ll lNonfarm payroll, annualThousands
2 0
3.0
0.0
1.0
2.0
-3.0
-2.0
-1.0
2012 2004-07-4.0
45Source: BBVA Research/ Haver Analytics
US Economic Outlook
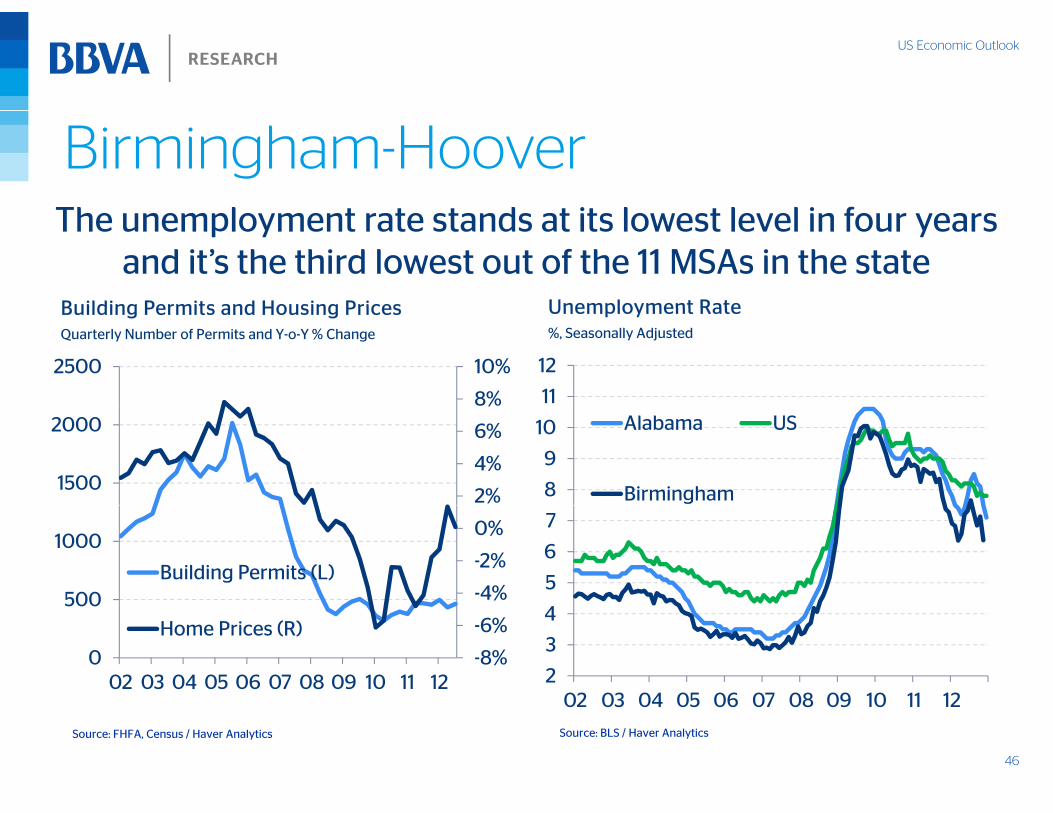
Birmingham-HooverTh l t t t d t it l t l l i f
Unemployment RateBuilding Permits and Housing Prices
The unemployment rate stands at its lowest level in four years and it’s the third lowest out of the 11 MSAs in the state
Unemployment Rate%, Seasonally Adjusted
Building Permits and Housing PricesQuarterly Number of Permits and Y-o-Y % Change
8%
10%2500
11
12
2%
4%
6%
1500
2000
8
9
10 Alabama US
Birmingham
-4%
-2%
0%
500
1000
Building Permits (L) 5
6
7
-8%
-6%
0
500
02 03 04 05 06 07 08 09 10 11 12
Home Prices (R)
2
3
4
02 03 04 05 06 07 08 09 10 11 12
46
Source: FHFA, Census / Haver Analytics
02 03 04 05 06 07 08 09 10 11 12
Source: BLS / Haver Analytics

US Economic Outlook
Key Messages
• Slow global recovery but with a lower probability of a tail risk scenario
•• The U.S. economy is closer to a selfThe U.S. economy is closer to a self--sustainable sustainable privateprivate--led expansion cycleled expansion cyclepp p yp y
•• Elevated policy uncertainty is limiting the pace of Elevated policy uncertainty is limiting the pace of the recoverythe recoverythe recoverythe recovery
•• Implementing structural reforms will boost longImplementing structural reforms will boost long--term potential growthterm potential growth
•• Economic conditions in Alabama and Economic conditions in Alabama and
47Birmingham will continue to improveBirmingham will continue to improve
US Economic Outlook
Thank you!Thank you!Let us know your opinion!
To receive our publications send us an email:
Follow us on Twitter: @BBVAresearchUSA
48
More information on the Web: www.bbvaresearch.com
US Economic Outlook
This document and the information integrity or correctness BBVA accepts the aforementioned securities or financial promotion order or (iii) are
DisclaimerThis document and the information,opinions, estimates and recommendationsexpressed herein, have been prepared byBanco Bilbao Vizcaya Argentaria, S.A.
(hereinafter called “BBVA”) to provide itscustomers with general informationregarding the date of issue of the report
integrity or correctness. BBVA acceptsno liability of any type for any direct orindirect losses arising from the use of thedocument or its contents. Investors shouldnote that the past performance ofsecurities or instruments or the historicalresults of investments do not guaranteefuture performance.
the aforementioned securities orinstruments or to companies relatedthereto or to their shareholders, executivesor employees, or may have interests orperform transactions in those securities orinstruments or related investments beforeor after the publication of this report, to theextent
financial promotion order, or (iii) arepersons to whom an invitation orinducement to engage in investmentactivity (within the meaning of section 21of the financial services and markets act2000) may otherwise lawfully becommunicated (all such persons togetherbeing referred to as “relevant persons”).
and are subject to changes without priornotice. BBVA is not liable for giving noticeof such changes or for updating thecontents hereof
This document and its contents do notconstitute an offer, invitation or solicitationto purchase or subscribe to any securities
The market prices of securities orinstruments or the results of investmentscould fluctuate against the interests ofinvestors. Investors should be aware thatthey could even face a loss of theirinvestment. Transactions in futures,options and securities or high-yield
permitted by the applicable law.
BBVA or any of its affiliates´ salespeople,traders, and other professionals mayprovide oral or written market commentaryor trading strategies to its clients thatreflect opinions that are contrary to theopinions expressed herein Furthermore
This document is directed only at relevantpersons and must not be acted on or reliedon by persons who are not relevantpersons. Any investment or investmentactivity to which this document relates isavailable only to relevant personsand will be engaged in only with relevantpersons The remuneration systemto purchase or subscribe to any securities
or other instruments, or to undertakeor divest investments. Neither shall thisdocument nor its contents form the basisof any contract, commitment or decision ofany kind.
Investors who have access to this
options and securities or high yieldsecurities can involve high risks and arenot appropriate for every investor. Indeed,in the case of some investments, thepotential losses may exceed the amount ofinitial investment and, in suchcircumstances, investors may be requiredto pay more money to support those
opinions expressed herein. Furthermore,BBVA or any of its affiliates’ proprietarytrading and investing businesses maymake investment decisions that areinconsistent with the recommendationsexpressed herein. No part of thisdocument may be (i) copied, photocopiedor duplicated by any other form or means
persons. The remuneration systemconcerning the analyst/s author/s of thisreport is based on multiple criteria,includingthe revenues obtained by BBVA and,indirectly, the results of BBVA Group in thefiscal year, which, in turn, include theresults generated by the investment
document should be aware that thesecurities, instruments or investments towhich it refers may not be appropriate forthemdue to their specific investment goals,financial positions or risk profiles, as thesehave not been taken into account toprepare this report Therefore investors
losses. Thus, before undertaking anytransaction with these instruments,
investors should be aware of theiroperation, as well as the rights, liabilitiesand risks implied by the same and theunderlying stocks. Investors should alsobe aware that secondary markets for the
(ii) redistributed or (iii) quoted, without theprior written consent of BBVA. No part ofthis report may be copied, conveyed,distributed or furnished to any person orentity in any country (or persons or entitiesin the same) in which its distribution isprohibited by law. Failure to comply withthese restrictions may breach the laws of
bankingbusiness; nevertheless, they do notreceive any remuneration based onrevenues from any specific transaction ininvestment banking.
BBVA is not a member of the FINRA andis not subject to the rules of disclosureprepare this report. Therefore, investors
should make their own investmentdecisions considering the saidcircumstances and obtaining suchspecialized advice as may be necessary.The contents of this document is basedupon information available to the publicthat has been obtained from sources
be aware that secondary markets for thesaid instruments may be limited or evennot exist.
BBVA or any of its affiliates, as well astheir respective executives andemployees, may have a position in any ofthe securities or instruments referred to,
these restrictions may breach the laws ofthe relevant jurisdiction.
In the United Kingdom, this document isdirected only at persons who (i) haveprofessional experience in matters relatingto investments falling within article 19(5) ofthe financial services and markets act
is not subject to the rules of disclosureaffecting such members.
“BBVA is subject to the BBVA Group Codeof Conduct for Security Market Operationswhich, among other regulations, includesrules to prevent and avoid conflicts ofinterests with the ratings given, including
49
considered to be reliable. However, suchinformation has notbeen independently verified by BBVA andtherefore no warranty, either express orimplicit, is given regarding its accuracy,
directly or indirectly, in this document, or inany other related thereto; they may tradefor their own account or for third-partyaccount in those securities, provideconsulting or other services to the issuer of
2000 (financial promotion) order 2005 (asamended, the “financial promotion order”),(ii) are persons falling within article 49(2)(a) to (d) (“high net worth companies,unincorporated associations, etc.”) Of the
information barriers. The BBVA GroupCode of Conduct for Security MarketOperations is available for reference at thefollowing web site:www.bbva.com / Corporate Governance”.

Economic OutlookEconomic Outlook
The Birmingham Estate PlanningThe Birmingham Estate Planning Council
Nathaniel KarpChi f U S E i tChief U.S. EconomistBBVA Research
Birmingham, AL February 7, 2013