economic impacts of natural hazards on vulnerable
TRANSCRIPT

Economic Impacts of Natural Hazards on Vulnerable Populations
in FIJI

2
List of abbreviations
Executive summary
Hazard and exposure 1.1. Overview of risks 1.2. Cyclones 1.3. Floods 1.4. Landslides 1.5. Droughts 1.6. Earthquakes, tsunamis, and volcanoes
Vulnerability and impacts 2.1. Economicprofile 2.2. Agricultureandfisheries 2.3. Tourism 2.4. Commerce and manufacturing 2.5. Housing and settlements 2.6. Low-income and informal workers 2.7. Gender 2.8. Youth
Coping mechanisms 3.1. Types of coping mechanisms 3.2. Adaptive social protection 3.3. Remittances 3.4. Financial inclusion 3.5. Insurance 3.6. Migration and relocation 3.7. Community-based support
Conclusions 4.1. Hazard, exposure, and vulnerability 4.2. Coping mechanisms
References
Contents
1
2
3
4
ii
1
2256677
889131415161721
2424262729303233
353535
39
i
3
List of abbreviations
ADB Asian Development Bank
CRED Centre for Research on the Epidemiology of Disasters
CSIRO CommonwealthScientificandIndustrialResearchOrganisation
EM-DAT Emergency Events Database
ESCAP EconomicandSocialCommissionforAsiaandthePacific
FAO Food and Agriculture Organization of the United Nations
FJD Fiji dollar
GDP Gross Domestic Product
GFDRR Global Facility for Disaster Reduction and Recovery
GIZ Deutsche Gesellschaft für Internationale Zusammenarbeit
IASC Inter-Agency Standing Committee Reference Group on Risk, Early Warning and Preparedness
IDMC Internal Displacement Monitoring Centre
IFRC International Federation of Red Cross and Red Crescent Societies
ILO International Labour Organization
IMF International Monetary Fund
INFORM Index for Risk Management
MSME Micro-, small-, and medium-sized enterprises
OCHA UnitedNationsOfficefortheCoordinationofHumanitarianAffairs
OECD Organisation for Economic Co-operation and Development
PCRAFI PacificCatastropheRiskAssessmentandFinancingInitiative
SPC SecretariatofthePacificCommunity
TC Tropical Cyclone
UNDP United Nations Development Programme
UNDRR UnitedNationsOfficeforDisasterRiskReduction
UNFPA United Nations Population Fund
UNICEF United Nations Childrens’ Fund
USD United States dollar
WASH Water, Sanitation and Hygiene
WFP World Food Programme
WTO World Trade Organization
ii
1
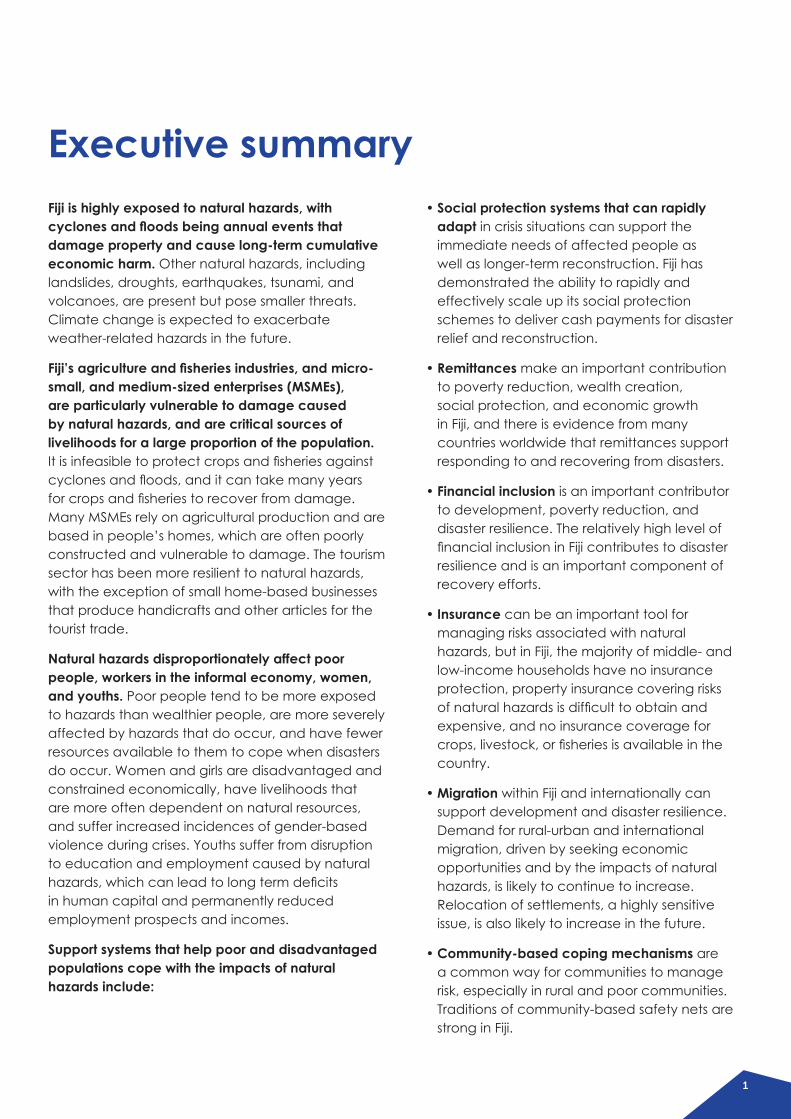
Fiji is highly exposed to natural hazards, with cyclones and floods being annual events that damage property and cause long-term cumulative economic harm. Other natural hazards, including landslides, droughts, earthquakes, tsunami, and volcanoes, are present but pose smaller threats. Climate change is expected to exacerbate weather-related hazards in the future.
Fiji’s agriculture and fisheries industries, and micro-small, and medium-sized enterprises (MSMEs), are particularly vulnerable to damage caused by natural hazards, and are critical sources of livelihoods for a large proportion of the population. Itisinfeasibletoprotectcropsandfisheriesagainstcyclonesandfloods,anditcantakemanyyearsforcropsandfisheriestorecoverfromdamage.Many MSMEs rely on agricultural production and are based in people’s homes, which are often poorly constructed and vulnerable to damage. The tourism sector has been more resilient to natural hazards, with the exception of small home-based businesses that produce handicrafts and other articles for the tourist trade.
Natural hazards disproportionately affect poor people, workers in the informal economy, women, and youths. Poor people tend to be more exposed to hazards than wealthier people, are more severely affected by hazards that do occur, and have fewer resources available to them to cope when disasters do occur. Women and girls are disadvantaged and constrained economically, have livelihoods that are more often dependent on natural resources, and suffer increased incidences of gender-based violence during crises. Youths suffer from disruption to education and employment caused by natural hazards,whichcanleadtolongtermdeficitsin human capital and permanently reduced employment prospects and incomes.
Support systems that help poor and disadvantaged populations cope with the impacts of natural hazards include:
Executive summary• Social protection systems that can rapidly
adapt in crisis situations can support the immediate needs of affected people as well as longer-term reconstruction. Fiji has demonstrated the ability to rapidly and effectively scale up its social protection schemes to deliver cash payments for disaster relief and reconstruction.
• Remittances make an important contribution to poverty reduction, wealth creation, social protection, and economic growth in Fiji, and there is evidence from many countries worldwide that remittances support responding to and recovering from disasters.
• Financial inclusion is an important contributor to development, poverty reduction, and disaster resilience. The relatively high level of financialinclusioninFijicontributestodisasterresilience and is an important component of recovery efforts.
• Insurance can be an important tool for managing risks associated with natural hazards, but in Fiji, the majority of middle- and low-income households have no insurance protection, property insurance covering risks ofnaturalhazardsisdifficulttoobtainandexpensive, and no insurance coverage for crops,livestock,orfisheriesisavailableinthecountry.
• Migration within Fiji and internationally can support development and disaster resilience. Demand for rural-urban and international migration, driven by seeking economic opportunities and by the impacts of natural hazards, is likely to continue to increase. Relocation of settlements, a highly sensitive issue, is also likely to increase in the future.
• Community-based coping mechanisms are a common way for communities to manage risk, especially in rural and poor communities. Traditions of community-based safety nets are strong in Fiji.
2
1. Hazard and exposure
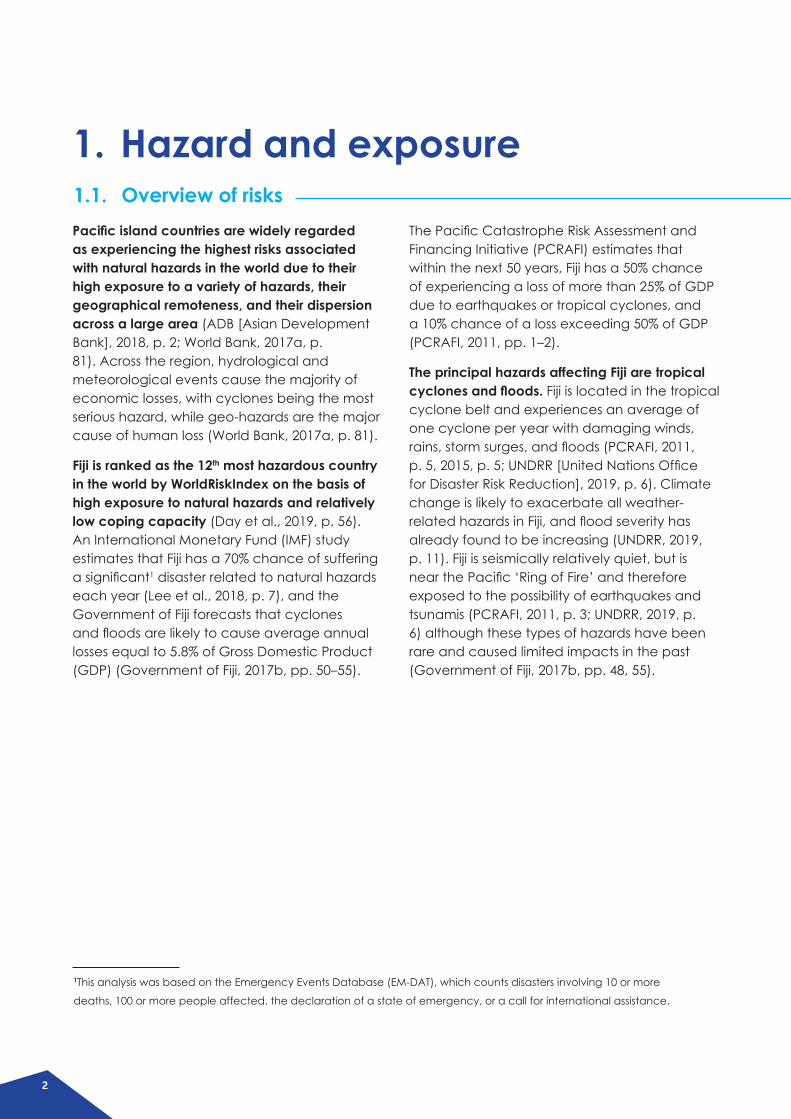
Pacific island countries are widely regarded as experiencing the highest risks associated with natural hazards in the world due to their high exposure to a variety of hazards, their geographical remoteness, and their dispersion across a large area (ADB [Asian Development Bank], 2018, p. 2; World Bank, 2017a, p. 81). Across the region, hydrological and meteorological events cause the majority of economic losses, with cyclones being the most serious hazard, while geo-hazards are the major cause of human loss (World Bank, 2017a, p. 81).
Fiji is ranked as the 12th most hazardous country in the world by WorldRiskIndex on the basis of high exposure to natural hazards and relatively low coping capacity (Day et al., 2019, p. 56). An International Monetary Fund (IMF) study estimates that Fiji has a 70% chance of suffering asignificant1 disaster related to natural hazards each year (Lee et al., 2018, p. 7), and the Government of Fiji forecasts that cyclones andfloodsarelikelytocauseaverageannuallosses equal to 5.8% of Gross Domestic Product (GDP) (Government of Fiji, 2017b, pp. 50–55).
1.1. Overview of risksThePacificCatastropheRiskAssessmentandFinancing Initiative (PCRAFI) estimates that within the next 50 years, Fiji has a 50% chance of experiencing a loss of more than 25% of GDP due to earthquakes or tropical cyclones, and a 10% chance of a loss exceeding 50% of GDP (PCRAFI, 2011, pp. 1–2).
The principal hazards affecting Fiji are tropical cyclones and floods. Fiji is located in the tropical cyclone belt and experiences an average of one cyclone per year with damaging winds, rains,stormsurges,andfloods(PCRAFI,2011,p.5,2015,p.5;UNDRR[UnitedNationsOfficefor Disaster Risk Reduction], 2019, p. 6). Climate change is likely to exacerbate all weather-relatedhazardsinFiji,andfloodseverityhasalready found to be increasing (UNDRR, 2019, p. 11). Fiji is seismically relatively quiet, but is nearthePacific‘RingofFire’andthereforeexposed to the possibility of earthquakes and tsunamis (PCRAFI, 2011, p. 3; UNDRR, 2019, p. 6) although these types of hazards have been rare and caused limited impacts in the past (Government of Fiji, 2017b, pp. 48, 55).
1This analysis was based on the Emergency Events Database (EM-DAT), which counts disasters involving 10 or more
deaths, 100 or more people affected, the declaration of a state of emergency, or a call for international assistance.

3
Different agencies, using different methodologies, provide different assessments of risk for Fiji.
• WorldRiskReport2 ranks Fiji as the 12th most hazardous country in the world due to high exposure to natural hazards and lack of coping capacities. The ranking process assigns countries scores ranging from 0 (least risk) to 100 (greatest risk) based on 27 indicators (Day et al., 2019, pp. 44, 56).
• INFORM (Index for Risk Management)3 assesses the relative risk of countries experiencing humanitarian crises, taking into account exposure to hazards, vulnerability of the population, and coping capacity. INFORM ranks Fiji 103rd out of 191 countries on exposure to natural hazards, implying a roughly average level of risk by global standards. It considers Fiji to have a particularly high risk of tsunamis and a low riskoffloods(IASC[Inter-AgencyStandingCommittee Reference Group on Risk, Early Warning and Preparedness], 2020).
• ThinkHazard4 provides an overview of natural hazards at national and local levels. It considers Fiji to have a high risk of most weather-related and geophysical hazards, but low risk of water scarcity and volcanic activity (GFDRR [Global Facility for Disaster Reduction and Recovery], 2020).
• The Government of Fiji, in its 2017 national climate vulnerability assessment, estimates thatcyclonesandfloodscauseaverageannual losses equal to 5.8% of GDP, and that earthquakes and tsunamis cause minimal average losses (Government of Fiji, 2017b, pp. 50–55).
Exposure
EpidemicDrought
Tropical CycloneTsunami
Lack of coping capacity
Flood
Vulnerability
Earthquake
Natural hazard & exposure
Relative risk compared with other countries worldwide(IASC, 2020)
(Day et al.,2019)
(IDMC, 2019)
(GFDRR, 2020)
38.43 Very High
Risk quintile
RiverfloodUrbanfloodCoastalfloodEarthquake
LandslideTsunamiCycloneWildfire
Risk score
High Risk
Medium Risk Extreme heatVolcanoWater scarcity
Low RiskVery low Risk
Vulnerability 46.41 MediumSusceptibility 21.54 MediumLack of coping capacity
78.76 High
Lack of adaptive capacity
38.93 Medium
WorldRiskReport
INFORM
ThinkHazard
Nat
ural
haza
rds
Ove
rall r
isk
Low High
2Developed by Ruhr University Bochum and Bündnis Entwicklung Hilft.3Developed by the Inter-Agency Standing Committee Reference Group on Risk, Early Warning and Preparedness and the European Commission4Developed by the Global Facility for Disaster Reduction and Recovery (GFDRR) managed by the World Bank
Storm surge
Average expected displacements per year
3,614Cyclonic wind 2,076Earthquake 75Tsunami 1
Internal Displacement Monitoring Centre
Figure 1: Natural Hazard Forecasts
(Government of Fiji, 2017b, pp. 50–55)
Tropical cyclones
Average annual asset losses
152 1.6%
% GDPFJD million
Fluvialfloods(rivers) 250 2.6%
Pluvialfloods(surface water)
154 1.6%
Earthquakes and tsunamis
5 <0.1%
Government of Fiji

4
• The Internal Displacement Monitoring Centre (IDMC)5 models the risk of future population displacements, and projects the greatest risks for Fiji to be related to cyclones and storm surges (IDMC, 2019).
Agencies that keep records of disasters agree that cyclones and floods have caused the greatest economic losses in Fiji. DesInventar6 and EM-DAT7 (Emergency Events Database) are the two main global datasets of disasters related to natural hazards. They use different inclusion criteria, data sources, and reporting practices, so they are not necessarily comparable. In particular,DesInventarincludessignificantlymore events than EM-DAT, especially high-frequency, low-impact events; EM-DAT tends to show lower estimates of impacts and to lack estimates of damages in smaller countries; data collection practices in both datasets appear to vary from one country to another and may not always be comparable between countries; andbothdatasetsappeartocoverfloodinginadequately (Edmonds & Noy, 2018, pp. 482–484). For Fiji, both datasets agree that cyclones andfloodsarethehazardsthathavecausedthe most damage or loss8, although they differ regarding the number of events and magnitude of damage or loss that they record (CRED [Centre for Research on the Epidemiology of Disasters], 2020; UNDRR, 2020). PCRAFI has also compiled a regional database of more than 600 disasters (PCRAFI, 2013, pp. 53–57), and of the 129 events recorded for Fiji, 55% were cyclones, withmostoftherestbeingfloodsorstorms;no disasters associated with tsunamis or storm surges were recorded (PCRAFI, 2013, p. 57).
5Part of the Norwegian Refugee Council, a humanitarian non-governmental organization (NGO)6OperatedbytheUnitedNationsOfficeforDisasterRiskReduction (UNDRR), drawing on data from partners around theworld;dataforthePacificregionareprovidedbytheSecretariatofthePacificCommunity(SPC)7Operated by the Centre for Research on the Epidemiology of Disasters (CRED), Catholic University of Louvain8EM-DATreportsdamagedefinedas“valueofalldamagesand economic losses directly or indirectly related to the disaster”;DesInventarreportslossesdefinedas“sumoflossesdirectly caused by the disaster” (https://public.emdat.be/about; https://www.desinventar.net/effects.html)
Volcanic activity
Tsunami
Cyclone
Flood
Earthquake
Drought
Damage in million USD
(CRED, 2020)
EM-DAT: Damage, 1990-2020
0 1000250 500 750
Figure 2: Historical Disasters
DroughtVolcano
Storm (local)Storm surge
LandslideTsunami
EarthquakeFlood
CycloneEpidemic
Losses in million USD
(UNDRR,2020)
Desinventar: Losses, 1990-2020
0 1000250 500 750
(PCRAFI, 2013, p.57)
PCRAFI: number of recorded disasters
Tropical cyclone
Flood
Earthquake
Severe local storm
Landslide
Storm surge
Tsunami
71
30
13
10
5
0
0
5
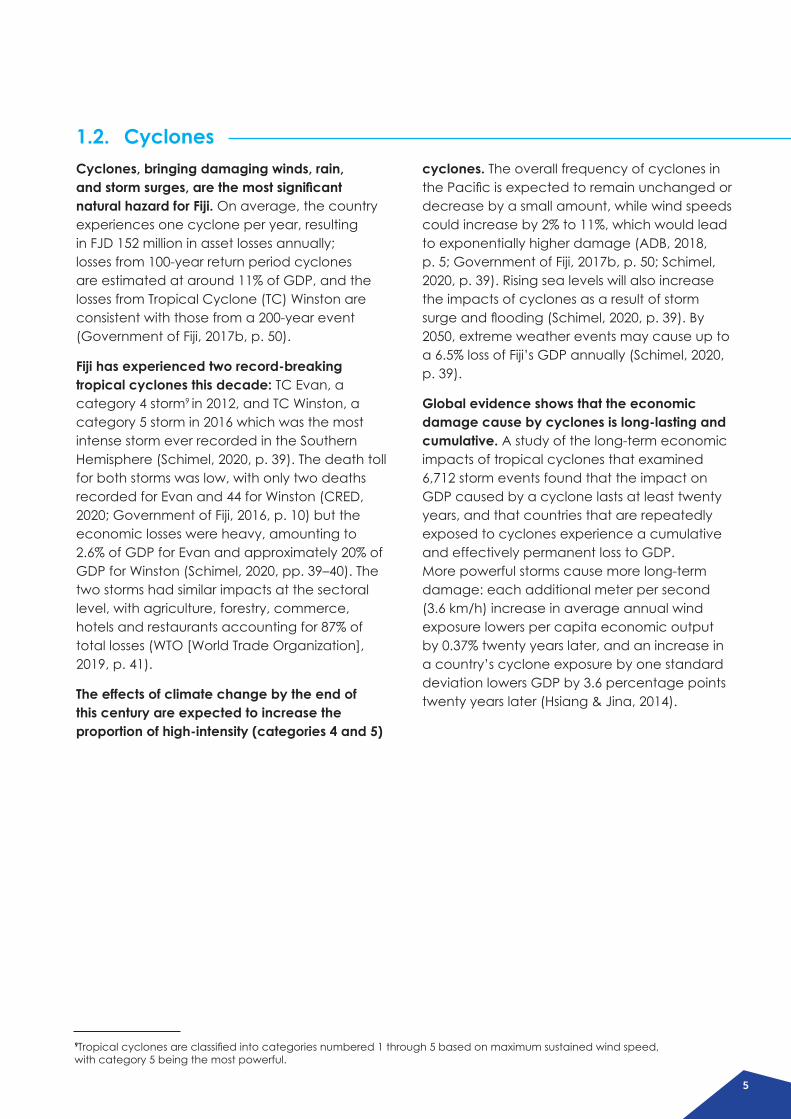
Cyclones, bringing damaging winds, rain, and storm surges, are the most significant natural hazard for Fiji. On average, the country experiences one cyclone per year, resulting in FJD 152 million in asset losses annually; losses from 100-year return period cyclones are estimated at around 11% of GDP, and the losses from Tropical Cyclone (TC) Winston are consistent with those from a 200-year event (Government of Fiji, 2017b, p. 50).
Fiji has experienced two record-breaking tropical cyclones this decade: TC Evan, a category 4 storm9 in 2012, and TC Winston, a category 5 storm in 2016 which was the most intense storm ever recorded in the Southern Hemisphere (Schimel, 2020, p. 39). The death toll for both storms was low, with only two deaths recorded for Evan and 44 for Winston (CRED, 2020; Government of Fiji, 2016, p. 10) but the economic losses were heavy, amounting to 2.6% of GDP for Evan and approximately 20% of GDP for Winston (Schimel, 2020, pp. 39–40). The two storms had similar impacts at the sectoral level, with agriculture, forestry, commerce, hotels and restaurants accounting for 87% of total losses (WTO [World Trade Organization], 2019, p. 41).
The effects of climate change by the end of this century are expected to increase the proportion of high-intensity (categories 4 and 5)
cyclones. The overall frequency of cyclones in thePacificisexpectedtoremainunchangedordecrease by a small amount, while wind speeds could increase by 2% to 11%, which would lead to exponentially higher damage (ADB, 2018, p. 5; Government of Fiji, 2017b, p. 50; Schimel, 2020, p. 39). Rising sea levels will also increase the impacts of cyclones as a result of storm surgeandflooding(Schimel,2020,p.39).By2050, extreme weather events may cause up to a 6.5% loss of Fiji’s GDP annually (Schimel, 2020, p. 39).
Global evidence shows that the economic damage cause by cyclones is long-lasting and cumulative. A study of the long-term economic impacts of tropical cyclones that examined 6,712 storm events found that the impact on GDP caused by a cyclone lasts at least twenty years, and that countries that are repeatedly exposed to cyclones experience a cumulative and effectively permanent loss to GDP. More powerful storms cause more long-term damage: each additional meter per second (3.6 km/h) increase in average annual wind exposure lowers per capita economic output by 0.37% twenty years later, and an increase in a country’s cyclone exposure by one standard deviation lowers GDP by 3.6 percentage points twenty years later (Hsiang & Jina, 2014).
1.2. Cyclones
9Tropicalcyclonesareclassifiedintocategoriesnumbered1through5basedonmaximumsustainedwindspeed,with category 5 being the most powerful.
6
Fiji is severely and regularly affected by floods that cause loss of life, damage to housing and infrastructure, and economic disruption. Coastalfloodsarearesultofacombinationof mean sea level, astronomical tides, storm surges due to low pressure and wind action, and wind-driven waves (Government of Fiji, 2017b,p.50).Inland,floodingcanoccurasaresultofcyclonesandotherstorms:fluvialfloodsoccur when rivers burst their banks as a result of sustainedorintenserainfall,andpluvialfloodsoccur when heavy precipitation saturates drainagesystems,particularlyinflatandurbanareas (Government of Fiji, 2017b, p. 51). Such floodsarearegularoccurrenceduringthemonsoon season (November to April), usually alongside cyclones and tropical storms which bring in high intensity rainfall (UNDRR, 2019, p. 11). Much of the country’s population lives onriverfloodplainssubjecttolong-durationfloodingandinsmallercatchmentspronetoflashflooding(GovernmentofFiji,2017b,p. 51). All major rivers that discharge to the ocean and delta areas can be affected by elevated sea levels during high tides or storm
surges (Government of Fiji, 2017b, p. 51). Fiji has experienced,onaverage,morethanonefloodeachyearforthepast40years.Asignificantfractionofthesefloodsarehigh-frequency,low-intensity events that may not be recorded in disaster databases but are frequent enough to generate large cumulative losses (Government ofFiji,2017b,p.51).Averageannualfloodlossesare estimated at more than FJD 400 million, or 4.2% of GDP (Government of Fiji, 2017b, p. 51).
Climate change is expected to increase both the frequency and intensity of extreme rainfall events by the end of the century. Rainfall events that occur once in 20 years may increase in magnitude by 5 to 7 mm by 2030 and by 6 to 36 mm by 2090, and what is currently a 20-year event may occur every 4 to 9 years by 2090, depending on CO2 emission levels (Government of Fiji, 2017b, p. 51). Without adaptation measures, asset losses would increase correspondingly, reaching 5% of GDP annuallyby2050.Theincreaseinfloodlossesarises more from the increase in the frequency of smaller events than from the rarer large floods(GovernmentofFiji,2017b,p.54).
1.3. Floods
Steep slopes, unstable volcanic soil, heavy precipitation, and high winds contribute to a significant risk of landslides in Fiji (Drazba et al., 2018; UNDRR, 2019, p. 6). There is a lack of data on landslide occurrences and impacts in Fiji, but they are often triggered by rainfall and are believed to pose a substantial threat
(Drazba et al., 2018, p. 1337; Government of Fiji, 2017b, p. 47). The frequency of landslides is likely to increase with climate change as a result of increased precipitation and more intense tropical cyclones, but land use, deforestation, and slope management are also contributing factors (Government of Fiji, 2017b, p. 54).
1.4. Landslides

7
Droughts in Fiji are infrequent, and usually short and seasonal, with an average duration of a few months or less (Government of Fiji, 2017b, p. 47,54). Almost all droughts are associated with the El Niño10 phenomenon, which have the potential to reduce annual rainfall by up to 50%, although not all El Niños lead to droughts (Government of Fiji, 2017b, p. 54; UNDRR, 2019, p. 11). Droughts are infrequent – only six major droughts were recorded between 1970 and 2016 (Government of Fiji, 2017b, p. 47) – but when they occur they affect an average of 20-30% of Fiji’s land area (Government of Fiji, 2017b, p. 54).
Impacts of droughts include decreased agricultural production, mortality of livestock, shortages of drinking water, forest fires, and
Fiji has relatively little seismic activity, but it is locatednearthePacific“RingofFire”andistherefore exposed to earthquakes and tsunamis (PCRAFI, 2011, p. 3; UNDRR, 2019, p. 6). There are two active volcanoes in the country (UNDRR, 2019, p. 10). Earthquakes and tsunamis have hadlittleimpactonFijiinthepastfiftyyears–the last major earthquake in a built-up area occurred in 1953 (PCRAFI, 2015, p. 17) – but such hazardscouldbesignificantwhentheyoccur.Studies have suggested a 20% to 40% chance of experiencingasignificantearthquakeatleastonceinthenextfiftyyears(GovernmentofFiji,
saline water intrusions as a result of reduced flows in rivers (Government of Fiji, 2017b, p. 54). In 1997-98, for example, one of the strongest El Niños on record led to widespread food and water shortages, school closures, a halving of the sugarcane harvest, and one of the worst recessions in Fiji’s history (OCHA [United Nations OfficefortheCoordinationofHumanitarianAffairs], 2015, p. 3). Another El Niño-induced drought in 2015 similarly led to about 13% of the population receiving emergency water deliveries and reduced harvests (OCHA, 2015).
The impact of climate change on the risk of drought is unclear. Different climate models project different changes in precipitation patterns and there does not appear to be a consensus around the implications for drought in Fiji (Government of Fiji, 2017b, p. 54).
2017b, pp. 47, 55; UNDRR, 2019, p. 10). Overall, Fiji is expected to incur an average of FJD 5 million per year in losses due to earthquakes and tsunami (Government of Fiji, 2017b, p. 55), making this a relatively small risk compared with other natural hazards. Climate change could potentially lead to increased tsunami risk, primarily through sea level rise but also through damage to coral reefs; there is evidence that these coastal ecosystems can offer some protection against tsunamis, depending on local conditions (Dilmen et al., 2015, p. 3570; Shao et al., 2019, p. 85).
1.5. Droughts
1.6. Earthquakes, tsunamis, and volcanoes
10ElNiñoisanaturalwarmingofsurfaceoceanwatersintheeasterntropicalPacificwhichoccurseverythreetosevenyears, and lasts from six months to two years (OCHA, 2015, p. 1)

8
2. Vulnerability and impacts
Fiji has a diversified economy with a particularly strong tourism industry and significant agriculture and textile industries. Fiji’s economy is the second-largestinthePacificafterPapuaNewGuinea, and its location enables it to serve asaregionalhubfortherestofthePacific(Government of Fiji, 2017b, p. 41; UNDRR, 2019, p. 6). Tourism is responsible for about 34% of GDP and contributes more than any other sector to foreign exchange earnings, with remittances, sugar, and textiles also being important foreign exchange earners (Government of Fiji, 2016, p. 19, 2017b, p. 41; Reserve Bank of Fiji, 2016, p. 9; World Bank, 2017b, p. 7; World Travel & Tourism Council, 2020). Economic growth has been strong during the last decade, with credit growth, remittances, improved labour market conditions, infrastructure spending, and the strong tourism industry contributing to growth (Government of Fiji, 2016, p. 19), alongside the return to democratic elections and normalisation of international relations in 2014 (World Bank, 2017b, p. 7). Fiji ranks 98th out of 189 countries on the Human Development Index andfallswithinthe‘highhumandevelopment’category (UNDP [United Nations Development Programme], 2019, p. 301).
Fiji has a low unemployment rate, but high informal employment, high underemployment, and a high level of subsistence activity (Government of Fiji, 2016, p. 29). As of 2016, 54% of the population participated in the labour market (71% for men and 37% for women) and the unemployment rate was only 8%, but 60% of the employed population (78% in rural areas and 37% in urban areas) were engaged
2.1 Economic profile
10
60
50
40
30
20
10
8
6
4
2
0
-2G
DP
grow
th (a
nnua
l %)
% o
f tot
al e
mpl
oym
ent
(World Bank, 2020)
(World Bank, 2020)
Figure 3: Fiji GDP annual change
Figure 4: Employment by sector19
9919
99
2001
2001
2003
2003
2005
2005
2007
2007
2009
2009
2011
2011
2013
2013
2015
2015
2017
2017
2019
2019
Services
Industry
Agriculture
in informal or subsistence activities (ILO [International Labour Organization], 2017a, pp. 4–5). Informal workers do not have secure employment contracts and lack workers’ benefits,socialprotection,andworkers’representation (ILO, 2017c). The unemployment rate for youths aged 15-24 is 14.8%, which is 3.6 times the overall unemployment rate (World Bank, 2020).
9
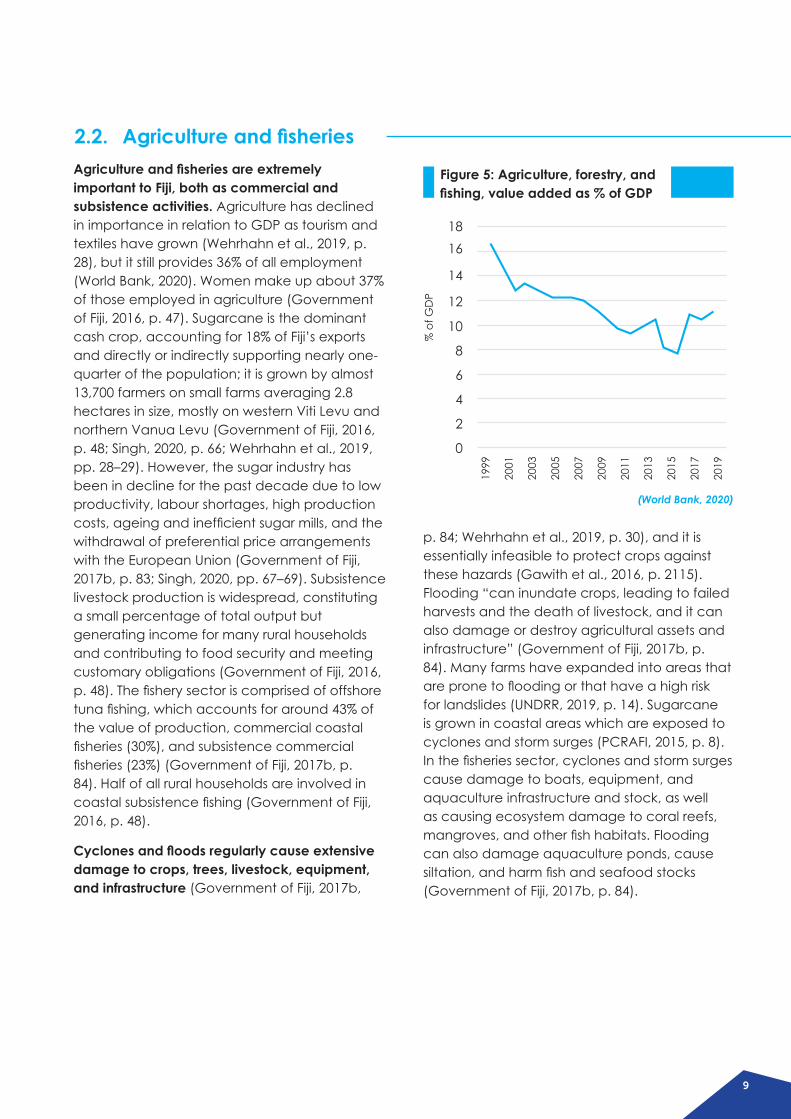
Agriculture and fisheries are extremely important to Fiji, both as commercial and subsistence activities. Agriculture has declined in importance in relation to GDP as tourism and textiles have grown (Wehrhahn et al., 2019, p. 28), but it still provides 36% of all employment (World Bank, 2020). Women make up about 37% of those employed in agriculture (Government of Fiji, 2016, p. 47). Sugarcane is the dominant cash crop, accounting for 18% of Fiji’s exports and directly or indirectly supporting nearly one-quarter of the population; it is grown by almost 13,700 farmers on small farms averaging 2.8 hectares in size, mostly on western Viti Levu and northern Vanua Levu (Government of Fiji, 2016, p. 48; Singh, 2020, p. 66; Wehrhahn et al., 2019, pp. 28–29). However, the sugar industry has been in decline for the past decade due to low productivity, labour shortages, high production costs,ageingandinefficientsugarmills,andthewithdrawal of preferential price arrangements with the European Union (Government of Fiji, 2017b, p. 83; Singh, 2020, pp. 67–69). Subsistence livestock production is widespread, constituting a small percentage of total output but generating income for many rural households and contributing to food security and meeting customary obligations (Government of Fiji, 2016, p.48).Thefisherysectoriscomprisedofoffshoretunafishing,whichaccountsforaround43%ofthe value of production, commercial coastal fisheries(30%),andsubsistencecommercialfisheries(23%)(GovernmentofFiji,2017b,p.84). Half of all rural households are involved in coastalsubsistencefishing(GovernmentofFiji,2016, p. 48).
Cyclones and floods regularly cause extensive damage to crops, trees, livestock, equipment, and infrastructure (Government of Fiji, 2017b,
2.2. Agriculture and fisheries
1816
14
12
10
8
6
4
2
0%
of G
DP
(World Bank, 2020)
Figure 5: Agriculture, forestry, and fishing, value added as % of GDP
1999
2001
2003
2005
2007
2009
2011
2013
2015
2017
2019
p. 84; Wehrhahn et al., 2019, p. 30), and it is essentially infeasible to protect crops against these hazards (Gawith et al., 2016, p. 2115). Flooding“caninundatecrops,leadingtofailedharvests and the death of livestock, and it can also damage or destroy agricultural assets and infrastructure” (Government of Fiji, 2017b, p. 84). Many farms have expanded into areas that arepronetofloodingorthathaveahighriskfor landslides (UNDRR, 2019, p. 14). Sugarcane is grown in coastal areas which are exposed to cyclones and storm surges (PCRAFI, 2015, p. 8). Inthefisheriessector,cyclonesandstormsurgescause damage to boats, equipment, and aquaculture infrastructure and stock, as well as causing ecosystem damage to coral reefs, mangroves,andotherfishhabitats.Floodingcan also damage aquaculture ponds, cause siltation,andharmfishandseafoodstocks(Government of Fiji, 2017b, p. 84).

10
Table 1: Expected impacts of climate change on crops, livestock, and forestry in Fiji
Table 2: Expected impacts of climate change on fisheries in Fiji
Hazard
Hazard
Expected impacts
Expected impacts
Changes in rainfall patterns
Increase in sea surface temperatures
Changes in temperature
Sea-level rise and sea flooding
• Disruptplanting,flowering,growth,andharvestingpatterns,whichmay affect productivity
• Heavy, concentrated rainfall can lead to waterlogging and a higher risk of diseases, and can also lead to erosion
• Coralbleachingmayleadtolossoffishhabitat
• Migration and spawning times may change for tuna and similar pelagicfish
• Demersalfishexpectedtobelessproductiveduetochangesinrecruitment
• Fewer areas suitable for seaweed aquaculture
• Survival/growth of ornamental products, oyster spat, and sea cucumbers may be reduced
• Growth rates for shrimp aquaculture may increase
• Existing cultivars of mango, papaya, and tomato can be adverselyaffectedbyhightemperaturesatspecificstagesoftheirdevelopment
• Incidence of pests and diseases may increase across a range of crops and livestock; increasing minimum nighttime temperatures have already been demonstrated to increase the spread of taro leaf blight, which poses a major risk for the important local taro industry
• Higher temperatures may increase stress for livestock
• Availability of maize- and soy-based animal feed could be affected by climate change, resulting in increased costs for poultry and pig industries, which are heavily dependent on imported feed
• Land available for agriculture may be reduced; the sugar industry has an estimated 5,000 ha of land under threat from saltwater intrusion
(Government of Fiji, 2017b, p. 86)

11
Table 2: Expected impacts of climate change on fisheries in Fiji (continued)
Hazard Expected impacts
Sea-level rise
Ocean acidification
Increased/more concentrated rainfall
Change to sea currents
Decreased nutrient availability
• Areaandproductivityofestuarinefisheriesmayincrease
• Fisheries infrastructure and communities may be forced to relocate
• Reduction in aragonite concentration expected to reduce productivity of invertebrates
• Areas suitable for seaweed aquaculture will be reduced
• Survival/growth of ornamental products, oyster spat, and sea cucumbers may be reduced
• Greater runoff may smother reefs if high levels of sediment persist
• Areaoffreshwaterfishhabitatsmayincrease,alongwithwateravailability for aquaculture
• Catchofskipjackandyellowfintunamayincrease;albacoretunamay decrease
• Nutrient availability (e.g., zooplankton biomass) may decrease due toincreasedstratificationandshallowermixedlayer
(Government of Fiji, 2017b, p. 87)

12
The impact of natural hazards on agriculture is intensified for poor people. Almost half of those living below the national poverty line11 rely on agriculture for at least part of their income (Government of Fiji, 2017b, p. 23). Most farms in Fiji are small – in 2009, 44% of all farms had an area of less than 1 hectare (Department of Agriculture, 2009, p. 33) – and more than 80% of thecountry’sfarmsareclassifiedassubsistencefarms (Ministry of Agriculture, 2018, cited in Wehrhahn et al., 2019, p. 30). Small-scale farmers (both commercial and subsistence) are vulnerable to natural hazards because they cannot achieve economies of scale or build up financialbufferstoabsorbeconomicshocks,solossesinflictedbynaturalhazardshavegreaterimpact than they would for larger-scale farmers (Wehrhahn et al., 2019, p. 30). In the aftermath ofextensivefloodingin2009,forexample,almost 50% of the affected farming families with livelihoods tied to sugar farming12 were expected to fall below the poverty line and 40% were estimated not to be able to meet basic nutritional needs; these farmers had reduced coping capacities because they were likely to have had pre-existing debts and limited savings, and their incomes were already reduced due to global market conditions for sugar (Lal, 2011, cited in UNDRR, 2019, p. 10).
TC Winston caused extensive damage, loss of production, and harm to livelihoods in the agriculture sector. Damage was valued at FJD 40.6 million, with additional future production losses estimated at FJD 241.2 million. Sugarcane accounted for 62% of the total damage and loss (Government of Fiji, 2016, p. 50). High winds, floodingandstormsurgescausedsubstantial
damage to permanent plantations which will need to be replanted, as well as damage to mangrove forests and coral reefs (Government of Fiji, 2016, p. 11). TC Winston also caused extensive damage to food crops, which seriously affected household income, food security and nutrition. Many poor households lost their own food supplies following the cyclone, and market prices for vegetables and rootcropsincreasedsignificantly–byasmuchas double in the case of cassava, a local staple (Government of Fiji, 2016, p. 50). In some cases, agricultural production will not return to pre-cyclonelevelsforfivetotenyears,depressingpeople’sincomesandlivelihoodssignificantlyin the affected areas (Government of Fiji, 2016, pp. 12, 50–51). The cyclone was estimated to cause personal income losses of FJD 351.6 million, 85% of which was in the agriculture sector. Across all sectors, women lost about half as much income as men (FJD 119.6 million and 232.0 million respectively), but this understates thesignificanceofthelosses,sincefewerwomen than men are employed and women’s incomes are lower to begin with (Government of Fiji, 2016, p. 102).
Figure 6: Personal income losses by sector due to TC Winston
Commerce:F$17.2 million
Manufacturing:F$18.5 million
Tourism & transport:F$17.7 million
Agriculture:F$298.2million
(Government of Fiji, 2016 p. 102)
11Fiji’s national poverty line, derived from the country’s 2013-14 Household Income and Expenditure Survey, is set at household income of FJD 29.89 per day in 2013-14 (Government of Fiji, 2017b, p. 41), or approximately USD 16.24 per day in2013.FijialsodefinespovertylinesforadultsatFJD7.87perdayforurbanareasandFJD7.07perdayforruralareas(Fiji Bureau of Statistics, 2015, p. 2), or approximately USD 4.28 and USD 3.84 per day respectively. These income levels are higher than the World Bank’s USD 1.90 per day international poverty line, and comparable with the World Bank’s USD 3.20 and 5.50 per day poverty lines for lower- and upper-middle-income countries.12Most sugarcane farmers are small-scale growers with an average landholding of 2.8 hectares (Insurance Holdings (Pacific)Limited2016,citedinWehrhahnetal.,2019,p.28),whoallocatethemajorityoftheirlandtosugarcaneanduseonly a small proportion of their land to grow other cash and food crops and raise subsistence livestock (Singh, 2020).

13
In the fisheries sector, TC Winston had major impacts on artisanal fisheries and commercial aquaculture through extensive damage to fisheriesassetsandtocoralreefs,mangroves,andotherfishhabitats(GovernmentofFiji,2016,p.47).Directdamagetothefisheriessector was estimated at FJD 40.7 million, with the value of lost production estimated at FJD 165.9 million; 72% of the losses are attributed tosubsistencefishing(GovernmentofFiji,2016, pp. 47–50). It was expected that the aquaculture sector would recover in one or two years, but that subsistence and commercial fisheriescouldtake12yearstoreturntopre-cyclone production levels, provided that good resource management practices are followed
and no other disasters occur in the meantime (Government of Fiji, 2016, p. 50). A study of mud crabfishersinBuaProvince,forexample,foundthat two to three months after the cyclone, 52% ofthefishershadstoppedharvestingcrabs,largely because fallen trees and other debris blocked access to mangroves, or because of bad weather, being busy with village repairs or babysitting, damage to mud crab habitat, or the declaration of a tabu (a temporary no-take area)(Thomasetal.,2019,p.702).Thefishersreported reduced seafood consumption at home as well as loss of income, and those who continuedfishingreportedcatchingfewerandsmaller crabs and harvesting less frequently (Thomas et al., 2019, pp. 703–704).
Fiji has a large tourism industry which attracts over 750,000 tourists a year and contributed 34% of total GDP in 2019 (Government of Fiji, 2017b, p. 93; World Travel & Tourism Council, 2020). Approximately 6% of people in poverty and 12% of people above the poverty line generate some part of their income from tourism (Government of Fiji, 2017b, p. 93). Tourism employmentisparticularlysignificantforwomen,with 12.8% of women working in the sector compared to 7.4% of men, but women are usually employed as housekeepers, receptionists and waitresses, with only one quarter of managerial and professional positions being held by women (Government of Fiji, 2016, p. 60).
The tourism industry is vulnerable to tourists’ perceptions of risk and to degradation of the natural environment. Tourists avoid destinations that they perceive as hazard-prone (ILO, 2019, p. 23). The tourism industry in Fiji relies heavily on coastal attractions, so is highly vulnerable to cyclones, storm surges, and disruptions to transportation (PCRAFI, 2015, p. 8), and to other longer-term risks related to climate change, including damage to environmental quality and ecosystems, increasing frequency of extreme temperatures, health risks associated with changes in the natural range and prevalence of diseases, and increases in travel costs which
2.3. Tourismmay occur as part of policy responses to climate change (Government of Fiji, 2017b, pp. 93–94).
Tropical cyclones Evan and Winston caused limited damage to tourist infrastructure, most of which is built to high standards. TC Evan (2012) caused limited structural damage to hotels and resorts, and most of the seriously affected hotels and resorts drew on insurance to repair or rebuild without relying on the Government for financialassistance(WTO,2019,p.44).Touristarrivals decreased by 2.5% following the storm, but the effect was temporary (Government of Fiji, 2017b, p. 93). TC Winston (2016) similarly had“minimalimpactonthetourismsector”(Government of Fiji, 2016, p. 27), which was partly due to good fortune in that the storm did not affect the most popular and productive tourism regions, although it did cause damage to at least 75 of the estimated 400 tourism businesses in the country. Damage to hotels and resorts was minimal due to the generally good standards to which they were built, with a very small proportion of properties reporting the majority of damage (Government of Fiji, 2016, p. 57). Most affected businesses intended to continue operating at reduced capacity or to reopen within a few months (Government of Fiji, 2016, p. 60). The tourism industry generally

14
recovered quickly following the cyclone and was successful in minimising negative reporting internationally,promotingastrong“businessasusual” message, and reinstating international flightsonlytwodaysafterthecyclone(Government of Fiji, 2016, pp. 57, 59). Businesses are estimated to have lost FJD 44 million through cancellations and lost bookings, but overall visitor numbers were only expected to decline by 0.5% (Government of Fiji, 2016, p. 58).
Micro- and small enterprises supplying the tourism industry were affected in the short term. Tourism provides an important market for micro-, small, and medium-sized enterprises (MSMEs) making handicrafts and supplying hotelsandspaswithflowers,artisanalproducts,and cosmetics (Government of Fiji, 2016, p. 60). Women’s handicraft groups in Ba Province, for example, reported their daily income declining by FJD 50 to FJD 140 in the aftermath of the cyclone (although it is not clear what proportion of their incomes this represented) (Government of Fiji, 2016, p. 60).
Fiji has a diversified economy with significant commerce and manufacturing sectors. The commerce subsector contributed 9.4% of total GDP in 2014 and includes vehicle trade, supermarkets, textile and clothes traders, hardware traders, book traders, fuel and oil traders, and other wholesale and retail product sales (Government of Fiji, 2016, p. 53). The manufacturing subsector in Fiji contributed 11.0% of total GDP in 2014 and includes food and beverage manufacturing, cigarettes, apparel, footwear, paper products, plastic and rubber products, furniture, basic metals, coachworks, concrete products, and timber and wood products (Government of Fiji, 2016, pp. 53–54). In both commerce and manufacturing, the labour force is two-thirds male and one-third female; in commerce, 55% of the women employed are in the retail sub-sector, and in manufacturing, 56% of the women employed are in the textile, clothing, and footwear industries (Government of Fiji, 2016, pp. 53–54).
The impacts of TC Winston on larger-scale commerce and manufacturing in Fiji have been fairly limited and short-term, although industries that depend on raw materials from agriculture, such as sugar and pearls, experienced larger and longer-term losses as a consequence of lost agricultural production
2.4. Commerce and manufacturingthat cannot be quickly recovered. Winston caused damage to premises, equipment, raw materials,andfinishedproductsincommerceand manufacturing industries, and caused disruption of production and sales as a result of the damage, workers’ absences, interruptions to electricity supplies, and problems with road access (Government of Fiji, 2016, p. 55). Damage has been estimated at a value of FJD 72.9 million, with economic losses estimated at FJD 69.9 million (Government of Fiji, 2016, p. 53). For larger businesses, disruptions were fairly minor: in the wholesale and retail commerce sector, sales were interrupted for an average of just four days, with some temporary lay-offs, and many larger retail outlets and the majority of wholesalers had insurance coverage (Government of Fiji, 2016, pp. 54–56). Job losses in the formal sector were also minimal and recovered quickly: the government’s post-disaster needs assessment reported only 554 job losses, which were reinstated once the electricity supply was fully restored (Government of Fiji, 2016, p. 55).
Micro-, small and medium-sized enterprises suffered damage to equipment and supplies as well as production losses as a result of TC Winston, particularly as a result of lost agricultural production (Government of Fiji,

15
2.5. Housing and settlements
2016, p. 55). Most micro-enterprises in the affected areas rely on agricultural production, and consist of activities such as food processing, handicrafts and weaving (Government of Fiji, 2016, p. 102). Many MSMEs are based in people’s homes, which are often poorly constructed and vulnerable to damage (see section 3.5). Informal sector small and medium-sized manufacturing reported FJD 3.4 million in damage and FJD 11.2 million in losses, which is relatively small compared with other sectors,
but 43% of all micro and small enterprises were affected (Government of Fiji, 2016, pp. 55–56) and since MSMEs have few assets and low turnovers, the effects of these losses are likely to be much more impactful than the dollar amounts suggest. Recovery for MSMEs and cooperatives is inhibited by limited access to loans, especially for women, who have greater difficultyaccessingfinancialservicesthanmen(Government of Fiji, 2016, p. 56).
The topography of Fiji leads 90% of the population to live in coastal regions that are exposed to flooding, cyclones and sea-level rise, and there is generally a lack of climate-resilient housing across the country (Government of Fiji, 2018b, p. 26; UNDRR, 2019, p. 14). More than half of the population (54% in 2017) is urban, concentrated in three rapidly growing urban corridors. Urban growth is driven by natural population growth and by migration from rural areas and the outer islands, which is primarily due to urban-rural household income differentials (Government of Fiji, 2017b, p. 41). There is a large backlog of provision of low-income housing in Fiji, and urban populations are overcrowding into existing housing stock, building illegally on vacant land, or entering into informal and insecure housing arrangements. About 20% of the urban population (10% of the total population of the country) lives in unplanned and rapidly growing urban and peri-urban informal settlements where land tenure is unregistered and insecure, housing stock is low quality, 13% of households had shared or no access to potable water and 28% had no
access to electricity, and vulnerability to natural hazards is high (Government of Fiji, 2017b, p. 56).
The two major tropical cyclones that hit Fiji in the past decade caused extensive damage to housing stock across the country. TC Evan destroyed about 1% of the country’s total housing stock and damaged another 4%, for a total value of FJD 50 million (Government of Fiji, 2013). TC Winston destroyed 7.5% of the total housing stock and damaged a further 6.3% percent of houses, for a total of FJD 751 million (Government of Fiji, 2016, p. 72). Most households had to bear the rebuilding cost themselves, which was a major challenge (WTO, 2019, p. 45); the government offered assistance through the Help for Homes program (see section 3.2), but the program’s budget was only one-sixth of the estimated amount of damage (Government of Fiji, 2016, p. 72). Households headed by women, the elderly,andpeoplewithdisabilitiesmayfinditparticularly challenging to repair or rebuild their houses independently (Government of Fiji, 2016, p. 76).

16
2.6. Low-income and informal workersWorldwide, poor and marginalized people are disproportionally exposed to natural hazards. Poor people often live in locations where they are more exposed to hazards (including frequent, low-intensity hazards) than wealthier people are. They lack resources to invest in disaster-resilient housing and other infrastructure, their employment and incomes are less secure, they often have less access to social protection schemes, and they have limited savings and limited access to insurance or affordable credit. When disaster strikes they are often forced to adopt coping strategies that have long-term negative impacts, such as taking children out of school, selling productive assets, or reducing food intake, and they often receive less post-disaster support, and less quickly (Hallegatte et al., 2017, p. 4; ILO, 2019, p. 4; Wehrhahn et al., 2019, p. 60; World Bank, 2017a, p. 90).
The effects of natural hazards are also disproportionately higher for poorer people. Damage to assets, or losses of income, reach a higher proportion of a poor person’s total wealth than a wealthier person’s, and have more serious implications (Government of Fiji, 2017b, p. 76; Wehrhahn et al., 2019, p. 60). A study in India, for example, showed that income lossesduetofloodsinMumbaiamountedto62% of annual income for the lowest-income quartile but only 19% of the highest-income quartile (Patankar, 2016, cited in Schaefer & Waters, 2016, secs. 35–36). The same loss affects poor people more severely than wealthy peoplebecause“theirlivelihoodsdependon fewer assets, their consumption is closer to subsistence levels, they cannot rely on savings to smooth the impacts, their health and education are at greater risk, and they may need more time to recover and rebuild” (Hallegatte et al., 2018, p. 4). The monetary value of damage to assets and losses to economic production doesnotfullyreflecttheimpactsonwell-being (Hallegatte et al., 2018, p. 4). Women, youth, children, the elderly, people living with disabilities, and people belonging to ethnic or religious minorities are also more severely
affected by natural hazards than people who have more wealth and power. Vulnerable people in all these groups tend to be overrepresented in the informal economy, more likely to be unemployed or in insecure work, and have less access to resources with which to restore their livelihoods or adapt to climate change (ILO, 2019, p. 12).
More than one-third of Fijians are below the national poverty line, and informal and subsistence livelihoods are common, but extreme poverty is rare. The World Bank reports that 2.3% of the population lives on less than USD 1.40 per day, and 15.1% live on less than USD 3.10 per day (World Bank, 2017b, p. 8). However, 35% of Fijians (26% in urban areas and 44% in rural areas) live below the national basic needs poverty line (Government of Fiji,2016,p.19).ManyFijianslivein“affluentsubsistence”:theyhavesufficientresourcesto meet most basic needs but have limited economic opportunities to move beyond that level (Wehrhahn et al., 2019, p. 41). About 18% of adults identify their primary economic activity as solely subsistence based (Singh-Peterson & Iranacolaivalu, 2018, p. 12), but 60% of the employed population (78% in rural areas and 37% in urban areas) engage in some form of informal or subsistence activities (ILO, 2017a, pp. 4–5).
TC Winston is expected to have a significant long-term effect on employment and livelihoods for people on lower incomes. The government’s post-disaster needs assessment noted that “mostcivilservantsandsalariedpeoplewillnotsuffer income loss as a result of TC Winston” but that less well-off people may be forced into the informal sector and to increase subsistence activities (Government of Fiji, 2016, p. 34). This will likely depress incomes and livelihoods for a long time: while some sectors of the economy were expected to recover within a few months, agricultural production in some areas may not returntopre-cyclonelevelsforfivetotenyears,andfisheriesinsomeareasforaslongas12years (Government of Fiji, 2016, pp. 12, 50).
17
2.7. GenderWorldwide, women and girls are disproportionately vulnerable to the effects of natural hazards and climate change (Bogdan et al., 2019; World Bank, 2017a, p. 90). Around the world, women and girls have less ability thanmentoinfluence,participatein,andbenefitfromdisasterriskreductionandrecoveryefforts, and from climate change mitigation and adaptation efforts (World Bank, 2017a, p. 90). They have less access than men to the resources necessary to cope with and respond to hazardous events, including information, employment opportunities, education, health, land,financialresourcesandothereconomicassets, and basic rights (Vincent et al., 2014, p. 105; World Bank, 2017a, p. 90). Women often have less access than men to early warning systems such as weather forecasts and warningsoffloodsandwaterlevels,andareoften less prepared to understand and act on the information, due to gender differences in literacy, mobility, access to public venues, work schedules, and preferences for and access to communication media (Bogdan et al., 2019, pp. 26–33; IFRC [International Federation of Red Cross and Red Crescent Societies], 2010, p. 32). Women’s livelihoods often depend on natural resources that are affected by natural hazards, and on assets that are vulnerable to disasters or to be sold as a negative coping strategy (Bogdan et al., 2019, pp. iv–v; ILO, 2019, p. 12). Socially constructed roles often limit women’s ability to diversify their livelihoods by taking up new occupations, and impose restrictive burdens such as housework and caring responsibilities that limit their ability to act in crises (Bogdan et al., 2019, p. 33; Thomas et al., 2019, p. 706). Worldwide, even fatality rates in disasters tend to be higher for women than for men13,“primarilyduetogendered
differences in support to cope with such events andinsufficientaccesstoinformationandearlywarnings” (Bogdan et al., 2019, p. 33; ILO, 2019, p. 12).
Gender also interacts with other social characteristics to affect how individuals are impacted by natural hazards (Bogdan et al., 2019, p. 4). Women in rural areas tend to be more vulnerable than those in urban areas (and in Fiji, women in low-lying areas were among the most vulnerable); older women and women with disabilities are more severely affected, because of a lack of accessible infrastructure and information; pregnant and lactating women are at higher risk because of inadequate health services following disasters; and widowed and divorced women tend to be more vulnerable (Bogdan et al., 2019, p. 23).
Gendered social norms mean that men suffer different risks compared to women, particularly physical and mental health risks and pressures for migration. Most research on the gendered impacts of climate-related hazards considers effectsonwomen,with“scarceevidence”available about impacts on men (Bogdan et al., 2019, p. iv). Social norms generally call for mentobe“braveandheroic,andengagein risky life-saving behaviors that increase their likelihood of mortality” (Bogdan et al., 2019, p. 25; Vincent et al., 2014, p. 106). They also have increased tendencies to suffer mental health issues from isolation and worry, including depression, and to use alcohol as a coping mechanism (Bogdan et al., 2019, p. 25). Men often migrate (from rural to urban areas) in search of new livelihoods, which can strain households and break up families (Bogdan et al., 2019, p. 25).
13AlthoughthiswasnotthecaseinFijifollowingTCWinston:44peoplediedasaresultofthecyclone,withnosignificantdifference in mortality rates between females and males (Government of Fiji, 2016, p. 101).

18
Table 3: Gendered impacts of climate change in Asia, the Pacific and Africa
Hazard Women Men
Physical
Material
• Higher mortality and morbidity rates in disasters
• Extra workloads (time and labor)
• Malnutrition
• Sexual and gender-based violence during and after disasters
• Loss of small household livestock
• Loss of livelihoods connected with natural resources, less time to re-establish them
• Loss of land because of inheritance issues
• Disparities in access to disaster relief and aid
• Mortality risks among men with heroic behavior and rescue workers
• Migration for livelihood diversification
• Other health issues, like rheumatism
• Loss of livestock and assets

19
Table 3: Gendered impacts of climate change in Asia, the Pacific and Africa (Continued)
Hazard Women Men
Psychological
Most affected groups
Gender relations
• Psychological issues associated mostly with fear of gender-based violence and feelings of shame during disasters and stress for providing food for the family
• Girls (early marriage) and adolescent girls (risk of sexual harassment)
• Rural women and women without access to resources
• Women living in low-lying areas
• Disabled and older women
• Widowed, divorced and single women
• Pregnant and lactating women
• Female-headed households
• Negative: weaker family structures, domestic violence
• Psychological impacts including social isolation, trauma, depression, stress that can lead to alcohol abuse and even suicide
• Rural and poor men
• Widowers
• Positive: change in household and community roles, women taking leadership
(Bogdan et al., 2019, p. 22)

20
In Fiji, gender inequality is a significant challenge, with social roles heavily influenced by traditional values (Charan et al., 2016, pp. 110–112). Traditional cultural norms among both of the principal ethnic groups in Fiji emphasize male authority and limit women’s participation in decision-making and rights to own property, although education is valued and women are able to participate in many types of employment (Chattier, 2015, pp. 180–181; Schoeffel, 2006, pp. 3–4). Women have limited participation in decision-making at the household, community, and national levels (Charan et al., 2016, p. 112; Taylor & Michael, 2013, p. 11). The labor force participation rate for women is 38.6%, which is half that of men (76.2%) (ILO, 2020). Women and girls are expected to take on heavy domestic responsibilities and are responsible for 74% of household work, compared to 26% for men (Government of Fiji, 2016, p. 51). They are often limited to working in the informal sector and in subsistence agriculture, which offer low income and little security (Government of Fiji, 2016, p. 99). The Government of Fiji has madesignificanteffortstointegrategenderin disaster and climate change policies, including undertaking gender-disaggregated vulnerability and capacity assessments or including gender considerations in post-disaster needs assessments, particularly in the needs assessments that followed TC Evan and TC Winston (Bogdan et al., 2019, p. 13).
Gender-based violence rates in Fiji are among the highest in the world, with 72% of women who have ever been in intimate relationships reporting physical, sexual, or emotional violence from an intimate partner (Fiji Women’s Crisis Centre, 2013, p. 2). During disasters, gender-based violence often increases, particularly when living in short-term emergency or shared accommodation which may have inadequate lighting and un-segregated sleeping arrangements and WASH facilities (Bogdan et al., 2019, p. 15; Government of Fiji, 2016, p. 76; UNDRR, 2019, p. 10; Vincent et al., 2014, p. 106). Increased stress, property
damage, lack of electricity and lighting, the use of alcohol by men as a coping mechanism, and the breakdown of normal community protection mechanisms are contributing factors (Bogdan et al., 2019, p. 15; Government of Fiji, 2016,p.103).Followingfloodsin2012andTCWinston in 2016, there were increased reports of domestic violence, and reports of men requesting sexual favors in exchange for food and supplies (Government of Fiji, 2016, pp. 102–103).
TC Winston may result in reduced economic opportunities for women, increasing dependence on subsistence activity, increasing time poverty, deepening poverty and widening gender inequality (Government of Fiji, 2016, p. 99). Immediately after the cyclone, electricity and water supply outages led women and girls to take up increased burdens of household chores such as fetching water and doing laundry, and curtailed their ability to engage in other productive and income-generating activities (Government of Fiji, 2016, p. 103). Women are often home-based workers, and many women engaged in home-based production lost income, materials, and equipment when their homes were damaged or destroyed (Government of Fiji, 2016, p. 76). Women’s livelihoods are also often connected to natural resources which are vulnerable to natural hazards. Many women work at basket and mat weaving, which rely on voivoi (pandanus leaves) which were heavily affected by the cyclone (Bogdan et al., 2019, p. 15), while in coastal areas of Bua province, storm damagepreventedfemalemud-crabfishersfrom accessing mangrove areas or damaged theirfishingequipment,leavingthemwithfewalternative income opportunities (Thomas et al., 2019). Women’s ability to contribute to household subsistence was also more deeply affected than men’s: 71% of the livestock killed as a result of the storm were small animals like poultry, pigs and beehives, which are usually under the control of women (Bogdan et al., 2019, p. 15), and vegetables were the most badly affected type of crop, which again are largely cultivated by women (Government of

21
Fiji,2016,p.51).Women“arepoorer,earnlessincome, are more dependent on subsistence economies, and, therefore, have fewer options to cope with the disaster impact than their male counterparts” (Government of Fiji, 2016, p. 102). Conversely, however, disruptions caused
by climate change may also force women and men to take on new activities and roles in the family and the community, and may create opportunities for women to take on new leadership roles as they engage in alternative livelihoods and income-generating activities (Bogdan et al., 2019, p. 33).
2.8. YouthThe Pacific has a relatively young population that is growing, marginalized, and experiencing challenges accessing quality education and employment. Across the region, youths aged 15-24 make up 19.7% of the population, compared with the global average of 15.5% (Clarke & Azzopardi, 2019, p. 6; United Nations Population Division, 2019). Fiji’s population is olderthanmostotherPacificislandcountries,and its youth population is 16.4% of the total, which is closer to the world average. Youth development is a major concern across the region, particularly in relation to educational quality and relevance, employment and entrepreneurship, health (particularly non-communicable diseases, sexual and reproductive health, and mental health), civic and political representation and participation, protection from abuse and exploitation, gender equality, and equality for young people with disabilities (Clarke & Azzopardi, 2019, pp. vi–viii; SPC[SecretariatofthePacificCommunity],2015, pp. 5–6, 18–19). There is, however, a general lack of statistical data disaggregated by age in areas such as education, health, and employment,whichmakesitdifficulttoidentifypriorities and evaluate progress (Clarke & Azzopardi, 2019, p. vi; SPC, 2015, pp. 6, 11).
25%
Palau
20%
Niue
15%
Cook Isl.
10%
Fiji
5%
Tuvalu
0%
Tokelau
Kiribati
FSM
Vanuatu
Tonga
PNG
Nauru
Solomon Isl.
Samoa
Marshall Isl.0 5 10 15 20 25 30 35 40
GD
P gr
owth
(ann
ual %
)
(United Nations Population Division, 2019)
(UNFPA, 2014, p. 100)
Figure 7: Fiji youth population (ages 15-24) as a percentage of total population
Figure 8: Median ages for Pacific Region Countries
1999
2001
2003
2005
2007
2009
2011
2013
2015
2017
2019
22
2.8.1. Education
Globally, evidence shows that natural hazards can disrupt education with long-term consequences for young people. In the Philippines, for example, one year after Typhoon Washi (2011), 23% of families in one of the most severely-affected cities said their children had permanently dropped out of school (Barber, 2014,p.11),andinAustraliaresearchfiveyearsafterthe‘BlackSaturday’bushfiresinVictoria state (2009) found that children in some affected areas were suffering developmental delaysofbetweenoneandfiveyears(Hubbard,B., 2014, cited in Barber, 2014, p. 10). Disasters often exacerbate existing inequalities, notably gender inequality, and in many countries girls are more likely than boys to be pulled out of school during crises, and many do not return (Barber, 2014, p. 11).
In Fiji, floods and cyclones have disrupted education, but there is limited evidence about events prior to 2016. Widespreadfloodinginthe Western Division of Fiji in 2012 forced more than 15,000 people from their homes and affected about 150,000 people, and although there are no systematic data on school closures or attendance14, there were reports of some rural residents being displaced to informal settlements where children lacked access to education (Ravesloot & Sobir, 2017, p. 12). Following TC Evan, also in 2012, assessments reported damage to 118 primary and 32 secondary schools, but similarly no data were available on disruption to education (Ravesloot & Sobir, 2017, p. 12). A study in Cakaudrove Province, a rural area where traditional, non-mechanized farming practices are used, showed that boys from households affected by Cyclone Ami (2003) had a greater tendency than girls to drop out of school and take up farm work if housing aid was not provided, but that where housing aid was delivered within two years of the cyclone, dropout rates were
reduced and the gender gap in schooling was eliminated (Takasaki, 2017, pp. 75–76).
TC Winston caused considerable damage to school infrastructure and led to reduced academic performance in the year following the storm. Mostschoolsofficiallyreopenedwithin two weeks of the cyclone, although the firstweekortwowastypicallyoccupiedwithcleaning up debris and providing psycho-social support, with regular teaching only resuming in the third or fourth week (Ravesloot & Sobir, 2017, pp. 13, 18). Very few schools closed entirely, and where necessary students were reassigned and transported to other schools (Ravesloot & Sobir, 2017, p. 17). Repairs have been slow, however, and even seven months after the cyclone many schools were still using tents as temporary teaching facilities because“thebulkofthereconstructionandrehabilitation of affected school infrastructure had not begun” (Ravesloot & Sobir, 2017, pp. 17–19). School attendance dropped by more than half immediately after the cyclone, as teachers, students and families prioritised repairing property damage and cleaning up debris, waited for transport links to be restored, or coped with injury, illness, or death in the family; attendance returned to normal after about three months (Ravesloot & Sobir, 2017, pp. 16–17). Teachers reported that students, especially younger students, showed decreased participation and concentration, and increased behavioural and emotional problems, in the months following the cyclone (Ravesloot & Sobir, 2017, p. 18). Students’ academicperformancedroppedsignificantlyin the two terms following the cyclone in both primary and secondary schools, with slower learnersandthoseinthefinalyearofhighschoolbeingparticularlydisadvantaged,“thelatter because their performance will account for future eligibility for scholarships for higher education” (Ravesloot & Sobir, 2017, p. 31).
14Ravesloot&Sobir(2017,p.11)notethat:“Otherthandamageassessmentinformation,quantitativeandqualitativeinformationwerenotreadilyavailableontheimpactoffloodsandCycloneEvan.AsFEMIS[FijiEducationManagementInformationSystem]wasnotyetfullyfunctionalatthattime,therewasnotsufficientdatacollectedand/orconsolidatedon all relevant EiE/CSS indicators (e.g. for how many days schools were closed).”
23
2.8.2. Employment
Across the Pacific region, youth employment and employability are significant concerns and there is evidence that youths are particularly vulnerable to the impacts of economic crises and natural hazards. Manyyouthsexperiencedifficultymakingthe school-to-work transition, job opportunities in the formal economy are limited and economic growth is low, the number of youth reaching working age is large, and there is a mismatch between the skills taught by education and training institutions and employers’ needs (Clarke & Azzopardi, 2019, pp. 95–108; ILO, 2017a, p. 7).
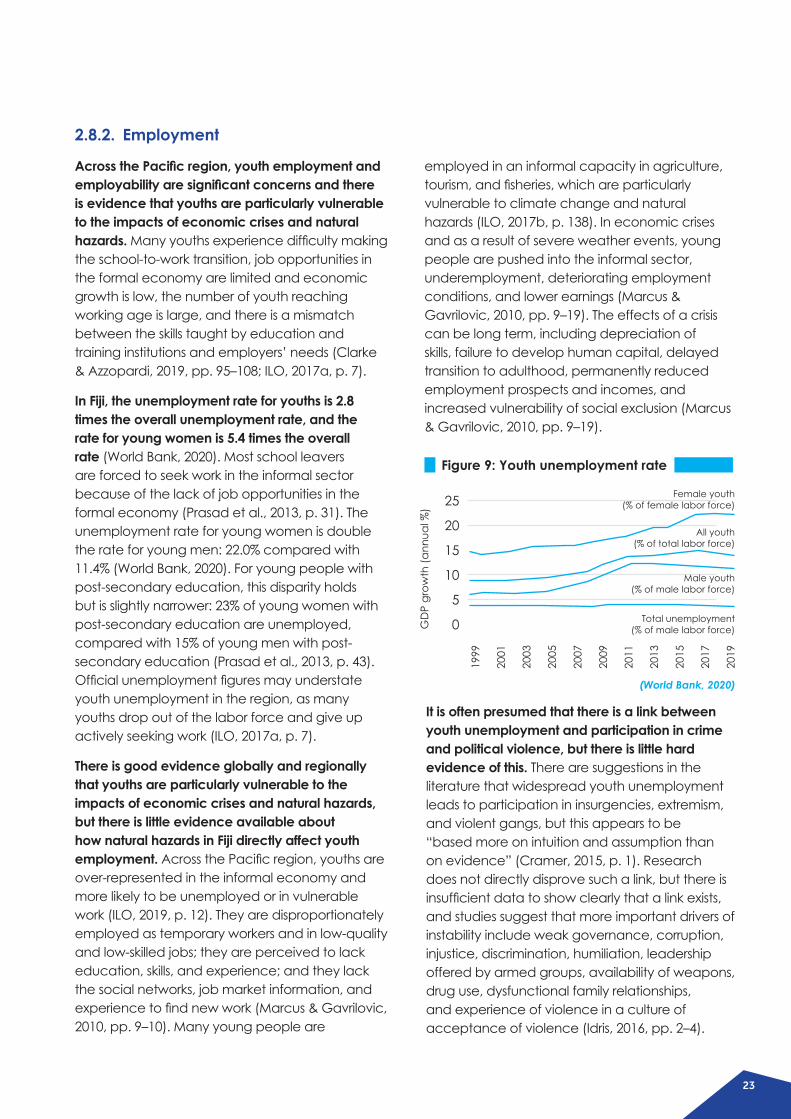
In Fiji, the unemployment rate for youths is 2.8 times the overall unemployment rate, and the rate for young women is 5.4 times the overall rate (World Bank, 2020). Most school leavers are forced to seek work in the informal sector because of the lack of job opportunities in the formal economy (Prasad et al., 2013, p. 31). The unemployment rate for young women is double the rate for young men: 22.0% compared with 11.4% (World Bank, 2020). For young people with post-secondary education, this disparity holds but is slightly narrower: 23% of young women with post-secondary education are unemployed, compared with 15% of young men with post-secondary education (Prasad et al., 2013, p. 43). Officialunemploymentfiguresmayunderstateyouth unemployment in the region, as many youths drop out of the labor force and give up actively seeking work (ILO, 2017a, p. 7).
There is good evidence globally and regionally that youths are particularly vulnerable to the impacts of economic crises and natural hazards, but there is little evidence available about how natural hazards in Fiji directly affect youth employment.AcrossthePacificregion,youthsareover-represented in the informal economy and more likely to be unemployed or in vulnerable work (ILO, 2019, p. 12). They are disproportionately employed as temporary workers and in low-quality and low-skilled jobs; they are perceived to lack education, skills, and experience; and they lack the social networks, job market information, and experiencetofindnewwork(Marcus&Gavrilovic,2010, pp. 9–10). Many young people are
employed in an informal capacity in agriculture, tourism,andfisheries,whichareparticularlyvulnerable to climate change and natural hazards (ILO, 2017b, p. 138). In economic crises and as a result of severe weather events, young people are pushed into the informal sector, underemployment, deteriorating employment conditions, and lower earnings (Marcus & Gavrilovic, 2010, pp. 9–19). The effects of a crisis can be long term, including depreciation of skills, failure to develop human capital, delayed transition to adulthood, permanently reduced employment prospects and incomes, and increased vulnerability of social exclusion (Marcus & Gavrilovic, 2010, pp. 9–19).
25
20
15
10
5
0GD
P gr
owth
(ann
ual %
)
Figure 9: Youth unemployment rate19
99
2001
2003
2005
2007
2009
2011
2013
2015
2017
2019
Female youth(% of female labor force)
All youth(% of total labor force)
Male youth(% of male labor force)
Total unemployment(% of male labor force)
(World Bank, 2020)
It is often presumed that there is a link between youth unemployment and participation in crime and political violence, but there is little hard evidence of this. There are suggestions in the literature that widespread youth unemployment leads to participation in insurgencies, extremism, and violent gangs, but this appears to be “basedmoreonintuitionandassumptionthanon evidence” (Cramer, 2015, p. 1). Research does not directly disprove such a link, but there is insufficientdatatoshowclearlythatalinkexists,and studies suggest that more important drivers of instability include weak governance, corruption, injustice, discrimination, humiliation, leadership offered by armed groups, availability of weapons, drug use, dysfunctional family relationships, and experience of violence in a culture of acceptance of violence (Idris, 2016, pp. 2–4).

24
3. Coping mechanisms
The Global Facility for Disaster Reduction and Recovery outlines four broad types of financial mechanisms for helping households cope with disaster risk (Hallegatte et al., 2017, pp. 11–13):
• Revenue diversification including cash transfers from social programs and remittances from family members abroad can help households at all wealth levels cope with relatively small shocks;
• Adaptive social protection, or scaling up social safety nets, can protect poor households against larger shocks if targeting and delivery areflexibleandcanrespondquicklytoneed;
• Financial inclusion enables people to save in ways that are less vulnerable to hazards than property like livestock and housing, and enables them to access credit which can accelerate recovery and reconstruction, although poor people’s own resources are likelytobeinsufficienttomanagetheimpactsof larger shocks; and
• Market insurance can protect against larger losses, but efforts to provide universal access to insurance face challenges of weak institutional and legal capacity, affordability, and high transaction costs, especially for the poor.
Two other disaster resilience mechanisms that are particularly relevant are:
• Migration, including rural-urban migration, international migration, and the relocation of entire settlements, is also a widely used adaptation strategy in response to natural hazards and environmental change (Melde & Laczko, 2017, p. 85); and
3.1. Types of coping mechanismsFigure 10: Financial coping mechanisms
• Community-based support systems and strong traditions of informal social protection and resource-sharing, which are common across thePacific(Hobbs&Jackson,2016,p.23).Following TC Evan, for example, half of the households affected reported that they relied on“unconditionalhelpfromrelatives/friends”,which was by far the most frequent response; relying on government assistance was only mentioned half as often (Government of Fiji, 2017b, p. 67).
Market insurance
Financial inclusion, savings credit
Adaptive social protection
Revenuediversification,socialprotection, remittances
More severe events
Less severe events
Poorer households Wealthier households
(Hallegatte et al., 2016, p. 2017, pp. 11-13)

25
Figure 11: Coping mechanisms used by households in Fiji following TC Evan
Sold land/building
0% 10% 20% 30% 40% 50%
Rented out land/building
Household member(s) migrated
Sent children to live elsewhere
Transfer children to a different school
Distress sales of animal stock
Take children out of a school
Skipped days without eating
Sold durable house hold assets (agriculture or non-agricultural
Household memeber(s) took on more farm wage employment
Household memeber(s) took on more non-farm (wage or self employment)
Obtained credit
Reduce expenditures on health and education
Other
Changed cropping practices (crop choices or technology)
Reduced the proportion or number of meals per day
Unconditional help provided by government
Relied on less preferred food options
Relied on savings
Unconditional help from relatives/friends
Sold livestock
(Government of Fiji, 2017b, p. 67)

26
Scaling up social protection schemes quickly by providing cash payments or vouchers to people affected by humanitarian crises has become increasingly common worldwide (Idris, 2017a, pp. 1–2; Save the Children and ACAPS, 2018, p. 12). Experience has shown that cash-based responseisefficientandeffective,itenablesrecipients to identify and prioritize their own needs, it supports dignity of recipients, it can bemoretimelyandflexiblethanothertypesofassistance, and it supports the recovery of local markets (Fabre, 2017, p. 3; Save the Children and ACAPS, 2018, p. 12). Concerns about cash-based programming leading to risks of theft, diversion, corruption, security, targeting, misuse bybeneficiaries,inflation,anddisempowermentof women have not been shown to be significantinpractice,andthereisconsensusthat the risks of cash-based programming are no greater than those associated with in-kind assistance (Fabre, 2017, p. 9; Idris, 2017b).
In the Pacific, cash-based programming has not been widely used until quite recently but it is now becoming more accepted (Hobbs & Jackson, 2016, p. 11; Save the Children and ACAPS, 2018, p. 12). Lessons learned after TC Pam (2015) and TC Winston (2016) demonstrated some of the weaknesses of in-kind aid, including the challenges of dealing with unnecessary or inappropriate donations which delayed distribution of relief and imposed costs for storage and disposal: half of the food items sent to Vanuatu, for example, were expired by the time they were accessed and had to be destroyed (WTO, 2019, p. 2). Cash transfers in crisis situations are more feasible in countries with prior experience of cash transfers through social protection programs and remittances, and with well-developedfinancialservicesandahigh
3.2. Adaptive social protectiondegreeoffinancialinclusion,althoughcountry-specificsocial,culturalandgender-relatedissues also affect feasibility (Hobbs & Jackson, 2016, pp. 8–9).
In the aftermath of TC Winston, the government of Fiji leveraged the existing social protection system to provide support to the affected population, rapidly adapting three major programs15 to provide existing beneficiaries with top-up payments equivalent to three months’ worthoftheirregularbenefits(GovernmentofFiji, 2017b, p. 68; Wehrhahn et al., 2019, p. 19). Supplementswerepaidtoallbeneficiaries,irrespective of whether they resided in the affected areas (Government of Fiji, 2017b, p. 68), and were followed up by two additional months of food voucher top-up payments in partnership with the World Food Programme for people living in the most badly affected areas (Government of Fiji, 2016, p. 34, 2017b, p. 69). Recipients spent their top-up payments on general consumption, transportation, and buying seedlings, livestock, tools, and equipment (Mansur et al., 2018, p. 28). An evaluationofthePovertyBenefitSchemetop-ups found that three months after the cyclone, households that had received support were 8% to 10% more likely to report having repaired housing damage than those that had not received the additional payments (Mansur et al., 2018, p. 28). One challenge of cash-based programming in other humanitarian contexts has been the challenge of coordination among multiple relief agencies (Idris, 2017a), but in Fiji relief has been coordinated by the government through its own programs. Two other major social protection programs were launched or adapted to provide support following TC Winston:
15ThePovertyBenefitScheme,targetingpoorfamilies;theSocialPensionScheme,providingincomesupporttotheelderly, and the Care and Protection Scheme / Child Protection Allowance, for children.

27
Remittances – money and goods sent by migrants back to their country of origin – are an important source of income for many low-income countries, both in normal times and following disasters (Pairama & Le Dé, 2018, p. 331). Worldwide, remittances have been increasing in recent years and currently amount to more than three and a half times the total valueofofficialdevelopmentassistance,withunrecorded remittances sent through informal channels possibly even greater (Pairama & Le Dé, 2018, p. 332). Remittances tend to be more stable than other international financialflows,andarecountercyclical,oftenincreasing to compensate for income shocks in migrants’ home countries (Brown et al., 2014, p. 434). A study of remittances sent by migrants working in Italy to 107 developing countries found that even when negative shocks occur in both the source and recipient countries, remittances remain countercyclical with respect to the recipient country (Bettin et al.,2014).Remittancessignificantlyincreasefollowing disasters, contributing to reconstruction andsubstitutingforlocalfinancialsystemswhich are not able to provide local credit
3.3. Remittances
• A new Help for Homes program was launched to assist with housing repair and reconstruction. Households earning less than FJD 50,000 received electronic cards pre-loaded with funds that could be spent on hardware and construction materials in approved hardware stores; the amount of funds each household received depended on the amount of damage suffered (Wehrhahn et al., 2019, p. 13). A total of FJD 120 million was distributed to almost 50,000 households under this scheme (Wehrhahn et al., 2019, p. 59), but this is only 16% of the estimated FJD 751 million damage caused by the cyclone (Government of Fiji, 2016, p. 72). The program also partnered with humanitarian agencies to provide training and advice in resilient building techniques to support building back stronger (Government of Fiji, 2017b, p. 69; Hallegatte et al., 2018, p. 19).
• The Fiji National Provident Fund, the principal national contributory pension scheme, allowed members to withdraw a portion of their pension funds (up to FJD 1,000, plus an additional FJD 5,000 for property owners in affected areas) if they had been affected by TC Winston; at least 170,000 people took advantage of this opportunity (Mansur et al., 2018, pp. 12–13). This released FJD 275.5 million into the economy (equivalent to 2.7% of GDP) quickly, although at the cost of reduced future pensions for individuals taking advantage of the facility (Government of Fiji, 2016, p. 34, 2017b, p. 69; Prochaska et al., 2018, p. 10; Wehrhahn et al., 2019, pp. 59–60).
(Bettin & Zazzaro, 2018, pp. 481–482, 497). Remittances can also take the form of goods and commodities – for example, non-perishable food, water, clothing, and footwear were priority items collected for Tonga after TC Winston (Pairama & Le Dé, 2018, p. 335). However, sending cash is often considered to be more useful than sending goods: in one study of migrants in New Zealand collecting goodstosendtovariousPacificislandsinresponse to disasters, half of the donated goods were unusable or unnecessary, an experience which is supported by other studies (Pairama & Le Dé, 2018, p. 336). It is unclear how well remittances support disaster preparedness: onestudylookingat98countriesfindsthattheycontributesignificantly(Bettin&Zazzaro,2018, pp. 491, 497), while other authors argue that there is little evidence of this and that remittances are more often spent on basic needs such as food than on investments in adaptive capacity (Melde & Laczko, 2017, p. 86; Pairama & Le Dé, 2018, pp. 340–341). Remittances contribute to macroeconomic stability following disasters, except in a very few cases where they reach very high levels,

28
in excess of 17% of GDP, where they can be destabilisingbycausinginflationandcreatingmoral hazard (Ebeke & Combes, 2013).
Evidence from many countries worldwide shows that households that receive remittances are better able to respond to and recover from disasters than those that do not receive them, including rebuilding more quickly and avoiding negative coping strategies (Bettin & Zazzaro, 2018, p. 483; Le Dé, Gaillard, & Friesen, 2015, p. 538). Remittances help maintain consumption during crises by drawing on sources of support outside the crisis area, and contribute positively to local economic activity (El-Zoghbi et al., 2017, p. 15; Jack & Suri, 2014, p. 185). For example, in Samoa, remittances following a tsunami in 2009 and TC Evan in 2012 were used to rebuild housing, recover agricultural production, and rebuild community facilities (Le Dé, Gaillard, & Wardlow, 2015, p. 3). There is debate in the literature regarding the degree to which remittances contribute to reproducing existing inequalities: in the past, remittances have been more often received by middle- and upper-income families with better education and with funds to pay for transportation and visas, who can then invest further in these assets, but some evidence suggests that migration has become cheaper and more accessible to the extent that income inequality has diminished (Connell, 2015, p. 139; Le Dé, Gaillard, & Wardlow, 2015, p. 2).
Fiji receives substantial funds from remittances, which contribute to poverty reduction, wealth creation, social protection, and economic growth. The total value of remittances received in Fiji was 5.2% of GDP in 2019 (World Bank, 2020),whichislowerthanotherPacificislandcountries as a percentage of GDP, but higher in dollar terms. Almost a quarter (23%) of adult Fijians receive remittances, with more women (28%) than men (19%) receiving them (Reserve Bank of Fiji, 2015, p. 28). At the household level, a survey carried out in 2005 indicated that 42% of all households in Fiji receive remittances, and also noted that migrants send remittances to households other than their own (20% of
households without any migrants received remittances) as well as to churches and other community organizations (Brown et al., 2014, p. 441). There is evidence from Fiji that remittances support poverty alleviation, wealth accumulation, and economic growth, particularly among poorer households. One study, for example, found that remittances are used for education and housing expenditures, and that they are associated with crop diversificationandincreasesinproductionofcash crops (Xing, 2018, pp. 42–43). A study that attempted to quantify the impact of remittances in Fiji estimated that without remittances, poverty rates would likely increase from 34% to 42.9%, and found a strong positive impact on the relative wealth of households that receive remittances compared with those that do not (Brown et al., 2014, pp. 446–448); another estimated that at the national aggregate level, a 1% rise in remittances as a percentage of GDP would increase per capita output by 0.12% (Jayaraman et al., 2011, p. 537).
Although there is good evidence that remittances provide resources to help recipients manage economic shocks, there is a lack of information about exactly how remittances have been used for disaster relief and recovery in Fiji. Post-disaster needs assessment reports in generaltermsthat“followingadisasterpeoplein Fiji help themselves with the assistance of family/community (either those at home or abroad with cash remittances)” (Government
8
6
4
2
0
Pers
onal
rem
ittan
ces
rece
ived
(% o
f GD
P)
(World Bank, 2020)
Figure 12: Remittances received in Fiji
1999
2001
2003
2005
2007
2009
2011
2013
2015
2017
2019

29
of Fiji, 2013), that repairing and rebuilding housingrelieson“acombinationofgovernmentsupport, household savings, family remittances and local credit” (Government of Fiji, 2016, p.120),andthat“privatesectorworkersandthose dependent on remittances were least likely to have been impacted by the cyclone” (Fiji Food Security and Livelihoods Cluster, 2016,
Worldwide, financial inclusion is an important contributor to development, poverty reduction, and disaster resilience.Accesstofinancialservices enables and incentivizes people to accumulate savings and smooth consumption over time, obtain loans, start businesses, receive remittances and other payments, obtain insurance,andimproveresiliencetofinancialshocks while reducing reliance on negative coping strategies and predatory lending (ESCAP [Economic and Social Commission for Asia and thePacific],2019,pp.6–9).Financialinclusionalso helps people save in forms that are less vulnerable to natural hazards than physical property, and to preserve resources to help with recovery and reconstruction (Hallegatte et al., 2017, pp. 135–137). Evidence from multiple countriesworldwideshowsthatfinancialinclusion contributes to poverty reduction, increased use of agricultural inputs and increased agricultural production, improving food security, and smoothing consumption in response to income shocks (Brune et al., 2015, p. 2; Kinnan & Townsend, 2012, pp. 291–293; Klapper et al., 2016, p. 2). Evidence about the impacts of microcredit, however, shows little or no improvement to household welfare through lending to individuals, although better results are observed when lending to small businesses (Dimble & Mobarak, 2019; Klapper et al., 2016, p. 8).
p.5).However,specificdataonthevalueofremittances received following disasters and how these funds are used do not appear to be available. This is generally true across the Pacific:mostresearchonremittanceshaslooked at their impacts on development, but very little work has been done on the role of remittances in disaster resilience (Campbell & Warrick, 2014, p. 31).
3.4. Financial inclusion
Financial inclusion in Fiji is high compared with other Pacific island countries, and is comparable with other upper-middle-income countries. In Fiji, 77% of adults have a formal bank account (Reserve Bank of Fiji, 2019a, p. 32). Some reports suggest that many people only use bank accounts to receive payments, and routinely withdraw all funds in cash as soon as possible (Hobbs & Jackson, 2016, p. 104), but the Reserve Bank of Fiji indicates that the proportion of Fijians who save money, either in bank accounts or through informal means like savings clubs, is higher than average for upper-middle income countries: 71% in Fiji compared with an average group of 63% (Reserve Bank of Fiji,2015,pp.21–31).Severalfinancialinclusionindicatorshaveincreasedsignificantlyfrom2015 to 2019: the proportion of adults using formal credit products has increased from 6.9%
2,000 SamoaFijiTonga
Vanuatu
Papua New Guinea
1,500
1,000
500
0Dep
osit
acco
unts
per
1,
000
adul
ts
(IMF, 2020)
Figure 13: Number of deposit accounts with commercial banks per 1,000 adults
2010
2011
2012
2013
2014
2015
2016
2017
2018
Solomon Islands

30
to 15.3%, the proportion holding any type of insurance product has increased from 12.0% to 41.0%, and the proportion actively using a mobile money account has increased from 2.2% to 24.2% (Reserve Bank of Fiji, 2019a, p. 33). Mainstream commercial banks offer microfinanceproducts,andonlyonespecialistmicrofinanceinstitution16 is operating in Fiji as of 2018 (Wehrhahn et al., 2019, p. 42). Savings and loan cooperatives, sugarcane cooperatives and other farming cooperatives, and communal cooperatives operate in the country, but many cooperatives that were originally set up as development initiatives have lost ground as infrastructure development has improved access to commercial markets (Wehrhahn et al., 2019, p. 42).
Worldwide, insurance is recognized as an important tool for managing risks associated with natural hazards (Le Quesne et al., 2017, p. 11), but the Pacific region is “one of the least insured regions in the world” (Leith & Subramanian, 2013, p. 9). The insurance penetration rate17 in the region is 3.6% (Leith & Subramanian, 2013, p. 9), which is well below the average of 8.9% in Organisation for Economic Co-operation and Development (OECD) countries (OECD, 2020). Barriers to uptake include affordability, inadequate disasterriskmitigationmeasures,insufficientbaseline information for designing insurance products, limited availability of reinsurance, consumer awareness and cultural issues, lack
3.5. Insurance
16SouthPacificBusinessDevelopmentMicrofinanceLtd.,witharound6,900activeloanclients,mostlywomen,andaloanportfolio of FJD 46 million (Wehrhahn et al., 2019, p. 42).17An indicator of insurance industry development, calculated as the ratio of total insurance premiums to GDP.
of trust, inadequate building codes and certificationmechanisms,lackofpublicasset registers, aid dependence, and weak mechanisms for distributing pay-outs (Lucas, 2015, pp. 4–5). There is limited demand for, availability of, and access to insurance products across the region generally (ADB, 2018, p. 18).
In Fiji, the majority of middle- and low-income households have no insurance protection of any kind, including against natural hazards (PCRAFI, 2015, p. 17; Wehrhahn et al., 2019, p. 37). Fiji’s insurance penetration rate was 3.4% in 2018 (Reserve Bank of Fiji, 2019b, p. 12), and only about 6% of households and
The relatively high level of financial inclusion in Fiji contributes to disaster resilience and is an important component of recovery efforts. The national climate vulnerability assessment notes, for example, that the fact that a large proportion of households had access to formal banking played an important role in coping and recovery following TC Evan in 2012 (Government of Fiji, 2017b, p. 66). Following TC Winston, 98% of recipients of emergency top-up funds distributed by the government through thePovertyBenefitSchemereceivedtheirfundselectronically (Mansur et al., 2018, p. 24). The government also used Vodafone’s M-PAiSA mobile money platform to pay emergency relief into recipients’ mobile phone wallets and bank accounts through the Help for Homes program following TC Winston in 2016, and the Care for Fiji Initiative following TC Josie and TC Keni in 2018 (Prochaska et al., 2018, pp. 9–10).

31
18MicroinsurancefromFijiCare(http://www.fijicare.com.fj/Pages/MicroInsurance)andMicrolifefromLifeInsuranceCorporationofIndia(http://www.licifiji.com/pages.cfm/products/microinsurance)areavailable,butthethirdprovider,BIMA(https://www.bima.com.fj),hascloseditsoperationsinFiji.FijiCarewasdevelopedinpartnershipwiththePacificFinancial Inclusion Programme.
17% of commercial properties have any type of property insurance (Mahul et al., 2015, p. 52) – and these rates are for basic coverage that does not necessarily provide protection against major disasters. Cyclone insurance is only available as an extension to basic property coverageandrequirescertificationbyaqualifiedengineer,whichisabarrierthatmakesmany homes uninsurable, and earthquake and tsunami coverage are also optional extras (PCRAFI, 2015, p. 18; Wehrhahn et al., 2019, p. 26). Property insurance rates for cyclone cover are therefore only 0.3%, and for earthquakes 0.08% (PCRAFI, 2015, p. 18). Insurance coverage is more common among larger businesses and in the tourism industry, but very low among low- and middle-income households (Wehrhahn et al., 2019, p. 37). Fiji’s insurance industry is small, has limited capacity, and tends to be conservative compared with international norms (Wehrhahn et al., 2019, pp. 25–26). Low standards in the construction industry, including weaktrainingandcertificationsystemsfortradespeople, are also a barrier to insuring properties (Wehrhahn et al., 2019, p. 27).
Microinsurance products currently available in Fiji do not cover property damage arising from natural hazards. Three microinsurance products were available as of 201918 providing various combinations of life insurance, funeral benefit,personalaccidentcover,firecover,and hospitalization cover (Wehrhahn et al., 2019, pp. 52–53), but these products do not include protection against natural hazards suchascyclones,floods,ordroughts,anddo not include crop insurance (Prochaska et al., 2018, p. 8). Microinsurance has generally been considered unsuitable for covering risks associated with natural hazards, which affect many people simultaneously, because of the
large capital reserves required and the high cost of assessing claims (Ramachandran & Masood, 2019, p. 11); Fiji’s insurance market doesnotcurrentlyhavethefinancialcapacityor expertise to underwrite such risks (Prochaska et al., 2018, p. 8). Insurance may not be cost-effective for the poorest of the poor, and is not an appropriate approach for frequently recurring events or for slow-onset, highly predictable events (Germanwatch, 2020, pp. 18–19; Schaefer & Waters, 2016, pp. 50–51; Warner et al., 2012, p. 13).
Fiji does not have any form of agricultural insurance (FAO, 2014, cited in Martyn & Rogers, 2016, p. 62; Wehrhahn et al., 2019, p. 27). Agricultural insurance can help manage risks due to natural hazards, especially extreme weather events and plant disease outbreaks by helping individual farmers smooth consumption and protect incomes, stabilizing businesses that supply agricultural inputs, and supporting relief and early recovery in the aftermath of disasters. Agricultural insurance also increases access to farm credit by reducing lending risks and encourages investment in modernization (Wehrhahn et al., 2019, p. 31). However, no agricultural insurance products are available in Fiji. The government has provided some funds to farmers to support rehabilitation of agriculture in response to past disasters, but FAO estimates that this has only covered 3% of the value of the losses suffered (FAO, 2014, cited in Martyn & Rogers, 2016, p. 62). One example of ad hoc support that was offered to sugarcane farmers following TC Winston was that the Sugar Cane Growers’ Fund, which lends money for working capital and investment purposes, restructured loans and offered grants of up to FJD 10,000 to almost 4,000 growers (Wehrhahn et al., 2019, p. 31).

32
Globally, migration both within a country and internationally is recognised as a positive adaptation strategy in response to natural hazards and environmental change (Melde & Laczko, 2017, p. 85). Voluntary, well-managed migration of individuals and communities can enhance the adaptive capacity of the migrant-sending community through the generation of remittances, reduced population pressures, and the transfer of knowledge and skills (Campbell & Warrick, 2014, p. 3). In one study offivecountriesaroundtheworld,migrationinresponse to environmental change was linked to positive impacts on income and employment and a higher likelihood of adopting future preventive measures including using better building materials (Melde & Laczko, 2017, p. 86). However, studies consistently show that there is psychological or political resistance to climate change-related migration, with many economic, social, cultural and psychological costs associated with both internal and international relocation, including risks such as loss of tradition, language, identity, livelihoods and community cohesion (Campbell & Warrick, 2014, pp. 3, 24).
Across the Pacific region and in Fiji, demand for international and internal (rural-urban) migration is likely to increase, driven by economic pressures and climate change (Campbell & Warrick, 2014, p. 3). The primary reasons for individuals to migrate are to seek economic opportunities and to strengthen kinship ties; climate change impacts are only a major driver of migration when they cause damagingeventssuchasseverefloodingorcyclones, or undermine livelihoods (Campbell & Warrick, 2014, p. 10; ILO, 2019, p. 16). However, although the media and international community sometimes focus on extreme climate change scenarios that anticipate large-scale international population movements, such scenarios are not yet a reality and Pacificislandersrejecttheimageof“climaterefugees”, preferring instead to emphasise
3.6. Migration and relocationpositive adaptation strategies (Campbell & Warrick,2014,p.9).InFiji,“therateofoutwardmigration has steadily declined and further declines are anticipated based on current trends” (Government of Fiji, 2017a, p. 12). Rural-urban migration trends are strong across the region and are expected to increase, with climate change expected to accelerate the growth of towns and cities, which could strain the capacity of urban areas to cope with the impacts of climate change and lead in turn to increase demand for international migration (Campbell & Warrick, 2014, pp. 2, 28). In Fiji, 54% of the population is located in three main urban areas, and the urban population is expected to rise to 61% in the next twenty years (Government of Fiji, 2017b, p. 41, 2017a, p. 12). Rural-urban migration is driven primarily by income differentials: average urban household income is approximately double average rural household income (Government of Fiji, 2017b, p. 41).
Relocation of settlements at extreme risk due to natural hazards is considered a last resort, with potentially severe social and cultural impacts. Global experience with planned relocationofsettlementshasidentifiedmanyrisks, including landlessness, unemployment, homelessness, social marginalization, reduced access to common-property resources, food insecurity, increased morbidity and community disarticulation (Cernea, 1997, cited in Campbell & Warrick, 2014, p. 24). Across thePacific,particularrisksrelatetoland,including loss of identity, culture, family ties andcommunity,andconflictandgovernanceissues around customary land rights (Boege, 2011; Campbell, 2010; cited in Campbell & Warrick, 2014, p. 24). Except in communities that already face severe coastal erosion orfloodingduetosubsidence,residentstypically prefer adaptation and sustainable management practices to relocation (Beyerl et al., 2018, p. 26).

33
Community-based informal coping mechanisms are a common way to reduce risk in rural and poor communities (Germanwatch, 2020, p. 5; UNDRR, 2019, p. 14). Community-based mechanisms rely on reciprocal exchange and trust in tight-knit social networks, and are well-suited to coping with relatively small-
3.7. Community-based supportscale natural hazards that affect only a few community members at a time. However, community-based mechanisms may be overwhelmed by large-scale, long-term, or frequent events (Germanwatch, 2020, pp. 5–13).
Fiji has undertaken several small-scale village relocations, and the government expects relocation to become more common in the future (Government of Fiji, 2018a, p. 5). In 2017, thegovernmentidentified830communitiesas being in need of relocation due to climate-related impacts, with 48 of these being in urgent need (Government of Fiji, 2017a, p. 102). The village of Vunidogoloa (population approximately 140), in Cakaudrove Province, wasthefirstentirevillagetobecompletelyrelocated, in 2014; Denimanu (population approximately 170) and Vunisavisavi (population approximately 100), also in Cakaudrove Province, were partially relocated in 2012 and 2015 respectively; and Narikoso (population approximately 105), in Kadavu Province, is now in the process of planning for partial retreat and is undertaking earthworks (McMichael et al., 2019, pp. 325–329; Piggott-McKellar et al., 2019, p. 5). In the cases of Vunidogoloa, Vunisavisavi, and Narikoso, relocation was determined to be necessary due to coastal erosion, higher tides,flooding,stormsurges,andsaltwaterintrusion, after other efforts such as seawalls, wave breaks, and mangrove regeneration had failed (McMichael et al., 2019, pp. 330–331). In Denimanu, relocation was a response to the destruction of 19 houses, constituting half
of the village, by TC Evan in 2012 (Piggott-McKellar et al., 2019, p. 5). The relocations were funded primarily by the government and international agencies with some contributions from villagers, and were short-distance moves within customary land, so villagers were able tocontinuetraditionalfarmingandfishingpractices (McMichael et al., 2019, pp. 332–333). While the relocations resulted in improved housing and village facilities, there were also reports of unwelcome disruptions to traditional culture and complaints that some works werenotfinishedaspromisedorwerenotcompleted to desired standards (McMichael et al., 2019, pp. 333–334; Piggott-McKellar et al., 2019, p. 8). Relocation of a village is a highly sensitive undertaking, and different studies do not fully agree in their assessment of the process in relation to community participation. The Vunidogoloa relocation, for example, hasbeendescribedbyonestudyas“anexemplary precedent” with full participation of the residents (Tronquet, 2015, p. 140), while other studies argue that the government applied pressure on the community and that community decision-making processes were manipulated to force decisions (Bertana, 2020), or that the process was consultative but not genuinely participatory (Piggott-McKellar et al., 2019, p. 13).

34
Table 4: Strengths and weaknesses of informal/community-based risk-sharing arrangements
Strengths Challenges
Adapted to local conditions: Local knowledge of environmental conditions and understanding of needs, capacities and gaps
Suitable for idiosyncratic risks affecting a small number of individuals at a time
Low transaction costs: easier to determine the risk and impacts of shocks to a group member or household as well as the resulting needs
Trust: Emphasis on trust and reciprocity; strong relationships and extensive information-sharing in small communities lowers risk of fraud
Affordability: Flexible and affordable for the poorest members of the community
Suitability: Traditional coping strategies areoftenonlysuitablefor“familiar”andidiosyncratic natural events
Traditional values and structures: Not necessarily inclusive; may manifest and strengthen existing power structures
Limited coverage of risks: unable to deal with systemic risks that affect the whole community
Put under stress by climate change: increasingly frequent extreme weather events can push arrangements to their capacity limits
Migration: climate change can cause long-term migration of community members for work, which can lead to weakening ties, reducing trust, and weakening coping mechanisms
(Germanwatch, 2020, p. 13)
In Fiji, rural communities often support their own members as well as neighbouring communities following extreme weather events. Community-basedagriculturalandfishingtraditionsandtraditional safety nets provide a reliable source of assistance for many shocks (Government of Fiji, 2016, p. 30). A study of farming and semi-subsistence communities on western Viti Levu, for example, noted that people made preparations in advance to provide rice and shelter to neighbours during the cyclone season, and people affected by disasters sought refuge in neighbouring communities before receiving government assistance (Singh-Peterson & Iranacolaivalu, 2018, p. 16). Another study in Cakaudrove Province in northern Fiji found that, after Cyclone Ami in 2003, people whose houses werenotdamagedintensifiedtheirfishingtohelp kin-group members with housing repair or construction (Takasaki, 2015, pp. 55–56). Following TC Evan in 2012, more than half of
the affected households reported that they reliedon“unconditionalhelpfromrelatives/friends” (see section 3.1), making this by far the most commonly-mentioned coping strategy; relying on help provided by government was mentioned only half as often as relying on friends and relatives (Government of Fiji, 2017b, p. 67).
Community resilience is most effective when plenty of advance warning is available, and when the impacts of an event are relatively limited. A study comparing the impacts of weather-related disasters in 2012 on Viti Levu showed, for example, that community resilience was more effective for TC Evan, for which communities had two days’ warning during which people could make preparations for themselves and assist neighbors, compared withriverfloodingearlierthatyear,whichcamewithonlyfivehours’warning(Gawithetal.,2016, pp. 2102–2107).

35
4. Conclusions
Fiji is highly exposed to natural hazards, with cyclones and floods being annual events that damage property and cause long-term cumulative economic harm. Other natural hazards, including landslides, droughts, earthquakes, tsunami, and volcanoes, are present but pose smaller threats. Climate change is expected to exacerbate weather-related hazards in the future.
Fiji’s agriculture and fisheries industries, and micro-small, and medium-sized enterprises, are particularly vulnerable to damage caused by natural hazards. These sectors are critical sources of livelihoods for a large proportion of the population: 36% of all employment is in agriculture (World Bank, 2020), half of all rural households have some involvement in subsistencefishing(GovernmentofFiji,2016,p.48), and 60% of employment across all sectors is in MSMEs (Paul, 2016, p. 22). Damage to crops andfisheriescantakemanyyearstorecover:following TC Winston, agricultural production in some areas was not expected to return to pre-cyclonelevelsforfivetotenyears,andsomefisheriescouldtake12yearstorecover(Government of Fiji, 2016, pp. 12, 50–51). Many MSMEs, such as food processing, handicrafts,
Recovering from disasters can offer opportunities to not just repair damage and restore pre-existing conditions, but to “build back better” to improve future resilience if coping mechanisms are designed appropriately (United Nations, 2015, para. 32). The Global Facility for Disaster Reduction and Recovery (GFDRR), managed bytheWorldBank,identifiesthreeimportantelements to building back better (Hallegatte et al., 2018):
4.1. Hazard, exposure, and vulnerability
4.2. Coping mechanisms
weaving, and tourism-related products, rely on agricultural production, and many are home-based businesses that suffered when homes were damaged or destroyed (Government of Fiji, 2016, pp. 60, 76, 102). The tourism sector is more resilient to natural hazards, apart from the small, often home-based, businesses that produce handicrafts and other articles for the tourist trade (Government of Fiji, 2016, p. 60).
Natural hazards disproportionately affect poor people, workers in the informal economy, women, and youths. Poor people tend to be more exposed to hazards than wealthier people, are more severely affected by hazards, and have fewer resources available to them to cope when disasters do occur. Women and girls are disadvantaged and constrained economically, have less access to early warning systems, more often have livelihoods that depend on natural resources, and suffer increased incidences of gender-based violence during crises. Youths suffer long-term ill effects from disruption to education and employment caused by natural hazards, which can lead to long term failure to develop human capital and permanently reduced employment prospects and incomes.
• Building back stronger ensures that repaired and reconstructed assets are more robust and resilient, better adapted to current and future needs, and use the best available and most productive technologies.
• Building back faster restores assets and incomes of affected populations sooner, reduces cumulative losses, and reduces the resources needed to support affected

36
populations through the recovery period. This requiresrecoveryplans,agreements,financialarrangements, and materials to be put in place in advance of disasters occurring.
• Building back more inclusively ensures that post-disaster support reaches all affected population groups, including the poor and marginalized, and particularly including women and girls, who are the most vulnerable to natural hazards and who experience the most serious consequences when disasters strike. This requires the development of adaptive social safety nets that can react to shocks, with delivery mechanisms that cover vulnerable populations.
Social protection schemes that can rapidly scale up in crisis situations can support the immediate needs of people affected as well as longer-term reconstruction. Fiji has demonstrated the ability to scale up its social protection schemes to deliver cash payments for disaster relief, and various agencies recommend continuing to use these mechanisms to respond to future disasters and to further formalize and institutionalize them by developing standard operating procedures and guidelines and ensuring that existing policies and legislation are supportive (Government of Fiji, 2017b, p. 119; Hobbs & Jackson, 2016, p. 10; Mansur et al., 2017, pp. 48–49; Save the Children and ACAPS, 2018, pp. 7–8). There may be opportunities to update and extend existing social protection databases to enable geographictargeting,extendingbenefitsto“near-poor”householdsthatarejustoutsidepoverty thresholds of existing programs, or providingvaryinglevelsofbenefitsdependingon recipients’ income levels, special needs, or the severity of particular disasters (Government of Fiji, 2017b, pp. 72, 120; Mansur et al., 2017, p. 50; Save the Children and ACAPS, 2018, p. 7).Paymentofcashbenefitsisefficientandeffective, but may need to be complemented by strategies to provide other forms of temporary emergency support where markets are not operational, and to pre-position key
supplies in advance of the cyclone season to ensure availability in case of need (Mansur et al., 2017, p. 50; Save the Children and ACAPS, 2018, pp. 7–8). Experience from TC Winston suggests that there is a need to improve public communication about social protection programs so that recipients are aware of the support available and how to access it (Mansur et al., 2017, p. 51; Save the Children and ACAPS, 2018, p. 8).
Remittances make an important contribution to poverty reduction, wealth creation, social protection, and economic growth in Fiji, and there is evidence from many countries worldwide that remittances support responding to and recovering from disasters. The cost of sendingremittancesinthePacificregionishighby global standards, and many authorities have called for costs to be reduced, particularly during and after crises (Bettin et al., 2014, p. 17; Hahm et al., 2019, p. 24; Le Dé, Gaillard, Friesen, et al., 2015, p. 5; Melde & Laczko, 2017, p. 88). Remittances require functioning financialandcommunicationssystems,soitshould be a high priority to ensure that these systems are operational as soon as possible after a disaster (Ebeke & Combes, 2013, p. 2251; Le Dé, Gaillard, Friesen, et al., 2015, p. 4). Some authorities recommend offering training to migrants and to recipients of remittances to encourage greater use of remittances for longer-term investment, including encouraging recipientstodepositfundsinfinancialinstitutionsto accumulate savings (Ebeke & Combes, 2013, p. 2252; Jayaraman et al., 2011, p. 538; Le Dé, Gaillard, Friesen, et al., 2015, p. 6). Other measures that can help support remittances in disaster situations include increasing migrants’ accesstofinancialservicesinhostcountries(Bettin et al., 2014, p. 17), ensuring that systems are in place to enable people to identify themselves,includingtemporaryidentificationpapers if needed (Le Dé, Gaillard, Friesen, et al., 2015, p. 5), and supporting tracing and contacting family members affected by disasters (Le Dé, Gaillard, Friesen, et al., 2015, p. 5).

37
The relatively high level of financial inclusion in Fiji contributes to disaster resilience and is an important component of recovery efforts. GloballyandacrossthePacificregion,variousexperts recommend continuing to promote greateraccesstoanduseoffinancialservicesincluding developing more access points, agent networks, digital payment platforms, and mobile money (El-Zoghbi et al., 2017, p. 27; ESCAP, 2019, p. 24; Klapper et al., 2016, p. 9). In the longer term, efforts could be made toincreasefinancialliteracyandawareness,especially among marginalized populations (ESCAP, 2019, p. 23; Reserve Bank of Fiji, 2015, p. 32); develop a regulatory framework that accommodates poorer households and incorporates consumer protection policies to increasetrustinthefinancialsystem(ESCAP,2019, p. 23); and incentivize the private sector todevelopfinancialservicesthatareresilientincrisis environments (El-Zoghbi et al., 2017, p. 27).
In Fiji, the majority of middle- and low-income households have no insurance protection, households and businesses have limited access to insurance against natural hazards, and no agricultural insurance products are available. Demand for insurance products could potentially be increased through public awarenesscampaignsandfinancialliteracy(Schaefer & Waters, 2016, p. 99; Wehrhahn et al., 2019, pp. 46, 65), improved regulations to raise publictrustandconfidence(Wehrhahnetal.,2019, p. 65), improving access to international insurance markets (Wehrhahn et al., 2019, p. 67),andincreasingaccesstofinancialservicesthrough alternative channels such as mobile phones (ADB, 2018, p. 18). The poorest and most vulnerable people cannot afford insurance at market prices, and may require some form of support (Schaefer & Waters, 2016, pp. 92–93) or a mechanism to enable wider pooling of risk (Wehrhahn et al., 2019, p. 33). Globally, insurers often fail to target the MSME sector and insurance products are often not well-adapted to the needs of MSMEs (Chatterjee & Wehrhahn, 2017, p. 3; GIZ [Deutsche Gesellschaft für Internationale Zusammenarbeit], 2019, p. 1); in Fiji, the high cost of insurance has been noted
as a particular barrier for MSMEs (Naidu & Chand, 2012). The insurance industry would benefitfromsupporttodevelopnewproducts(for homeowners and for businesses) tailored to local market conditions, which could involve changes to underwriting standards (ADB, 2018, p. 18; Wehrhahn et al., 2019, pp. 46, 64), improving the availability and use of local risk data (ADB, 2018, p. 18), or improving insurance companies’financialreservesandmechanismsfor pooling or reinsuring risk (Wehrhahn et al., 2019, pp. 47, 64–65). Parametric or index-based insurance, or hybrids of index-based and indemnity-based coverage, could potentially be simpler, more transparent, and cheaper than indemnity insurance (Wehrhahn et al., 2019, p. 65) but require considerable technical capacity, data, communications capacity, and public awareness and education (ESCAP, 2015, pp. 17–19). Conventional agricultural insurance products would be unaffordable for farmers in Fiji, and while index-based insurance may have potential, there is a lack of agricultural and weather data necessary to develop risk models (Maher & McCaffrey, 2012). A feasibility study on agriculture insurance in Fiji in 2017 recommended that an index-based insurance productcoveringwind,flood,anddroughtrisks for sugarcane, dalo, cassava, ginger, coconut, and pineapple could be feasible, but recommended subsidizing premiums to make the product affordable (Fiji Crop and Livestock Council, 2017, cited in Wehrhahn et al., 2019, p. 52).
Migration within Fiji and internationally has the potential to support development and disaster resilience. Various authorities argue that migration should generally be supported and managed, and integrated into environmental, climate change, and urban planning policies (Campbell & Warrick, 2014, p. 30; Government of Fiji, 2018b, pp. 15, 52, 72; Melde & Laczko, 2017, pp. 87–89, 93). There is a lack of knowledge about migration andclimatechangeacrossthePacificandaneed for better information about international and internal migration trends, the economic and social characteristics of migrants and
38
vulnerable populations, and the links among climate change, adaptation options, and migration policy, and gender implications are of particular concern (Campbell & Warrick, 2014, p. 30; Melde & Laczko, 2017, pp. 89–92). Relocation of settlements is a highly sensitive undertaking, and national guidelines as well as independent studies emphasise the importance of full and genuine community participation and respect for rights, empowerment, culture, and livelihoods (Bertana, 2020; Government of Fiji, 2018a; Piggott-McKellar et al., 2019; Tronquet, 2015, p. 140).
Informal coping mechanisms are a common way for communities to manage risk, especially in rural and poor communities, and traditions of community-based safety nets are strong in Fiji. To support community resilience, traditional practices should be valued and the systems sustaining the mechanisms should be protected (UNDRR, 2019, p. 14). Effective early warning systems are helpful in giving communities time to respond to hazards (Gawith et al., 2016, p. 2102). Policy interventions can, in principle, complement community mechanisms, but these are likely to be highly context-dependent (Takasaki, 2015, p. 75).

39
ReferencesADB. (2018). Economic and Fiscal Impacts of Disasters in the Pacific. Asian Development Bank. https://www.adb.org/sites/default/files/publication/415601/economic-fiscal-impacts-disasters-pacific.pdf
Barber, R. (2014). No Child Left Behind: Education in Crisis in the Asia-Pacific Region. Save the Children Australia. https://protectingeducation.org/wp-content/uploads/documents/documents_save_the_children_australia_-_no_child_left_behind.pdf
Bertana, A. (2020). The role of power in community participation: Relocation as climate change adaptation in Fiji. Environment and Planning C: Politics and Space, 239965442090939. https://doi.org/10.1177/2399654420909394
Bettin, G., Presbitero, A. F., & Spatafora, N. L. (2014). Remittances and Vulnerability in Developing Countries (IMF Working Paper WP/14/13). https://www.imf.org/external/pubs/ft/wp/2014/wp1413.pdf
Bettin, G., & Zazzaro, A. (2018). The Impact of Natural Disasters on Remittances to Low- and Middle-Income Countries. Journal of Development Studies, 54(3), 481–500. https://doi.org/10.1080/00220388.2017.1303672
Bogdan, O., McPherlain, C. C., & Yoon, S. (2019). Gendered Impacts of Weather and Climate: Evidence from Asia, Pacific and Africa. World Meteorological Organization. https://library.wmo.int/doc_num.php?explnum_id=10106
Brown, R. P. C., Connell, J., & Jimenez-Soto, E. V. (2014). Migrants’ Remittances, Poverty and Social ProtectionintheSouthPacific:FijiandTonga.Population, Space and Place, 20(5), 434–454. https://doi.org/10.1002/psp.1765
Brune, L., Giné, X., Goldberg, J., & Yang, D. (2015). Facilitating Savings for Agriculture: Field Experimental Evidence from Malawi (NBER Working Paper Series 20946). http://www.nber.org/papers/w20946
Campbell, J., & Warrick, O. (2014). Climate Change and Migration Issues in the Pacific. United NationsEconomicandSocialCommissionforAsiaandthePacific.https://disasterdisplacement.org/wp-content/uploads/2015/03/2.-Climate-Change-and-Migration-Issues-in-the-Pacific.pdf
Charan, D., Kaur, M., & Singh, P. (2016). Indigenous Fijian Women’s Role in Disaster Risk Management and Climate Change Adaptation. Pacific Asia Inquiry, 7(1), 106–122. https://www.uog.edu/schools-and-colleges/college-of-liberal-arts-and-social-sciences/pacific-asia-inquiry/V7.php
Chatterjee, A., & Wehrhahn, R. (2017). Insurance for Micro, Small, and Medium-sized Enterprises (ADBBriefsNo.78).AsianDevelopmentBank.https://www.adb.org/sites/default/files/publication/298101/insurance-msmes.pdf
Chattier, P. (2015). Women in the House (of Parliament) in Fiji: What’s Gender Got to Do with It? Round Table, 104(2), 177–188. https://doi.org/10.1080/00358533.2015.1017253
Clarke, D., & Azzopardi, P. (2019). State of Pacific Youth 2017. United Nations Population Fund. https://pacific.unfpa.org/en/publications/state-pacific-youth-2017

40
Cramer, C. (2015). Jobs, Unemployment and Violence (GSDRC Professional Development Reading Pack No. 10.). University of Birmingham, Governance and Social Development Resource Centre. http://gsdrc.org/docs/open/reading-packs/jobsunemploymentviolencerp.pdf
CRED. (2020). EM-DAT, The International Disaster Database. https://public.emdat.be/
Day, S. J., Forster, T., Himmelsbach, J., Korte, L., Mucke, P., Radtke, K., Thielbörger, P., & Weller, D. (2019). WorldRiskReport 2019 Focus: Water Supply. https://weltrisikobericht.de/english/
Department of Agriculture. (2009). Report on the Fiji National Agricultural Census 2009. Government ofFiji,DepartmentofAgriculture.http://www.fao.org/fileadmin/templates/ess/ess_test_folder/World_Census_Agriculture/Country_info_2010/Reports/Reports_3/FJI_ENG_REP_2009.pdf
Dilmen, D. I., Titov, V. V., & Roe, G. H. (2015). Evaluation of the Relationship Between Coral Damage and Tsunami Dynamics; Case Study: 2009 Samoa Tsunami. Pure and Applied Geophysics, 172(12), 3557–3572. https://doi.org/10.1007/s00024-015-1158-y
Dimble, V., & Mobarak, A. M. (2019). Saving microfinance through innovative lending (IGC Growth BriefSeriesNo.17).https://www.theigc.org/reader/saving-microfinance-through-innovative-lending/citation/
Drazba, M. C., Yan-Richards, A., & Wilkinson, S. (2018). Landslide Hazards in Fiji, managing the risk and not the disaster, a literature review. Procedia Engineering, 212(2017), 1334–1338. https://doi.org/10.1016/j.proeng.2018.01.172
Ebeke, C., & Combes, J. L. (2013). Do remittances dampen the effect of natural disasters on output growth volatility in developing countries? Applied Economics, 45(16), 2241–2254. https://doi.org/10.1080/00036846.2012.659347
Edmonds,C.,&Noy,I.(2018).TheeconomicsofdisasterrisksandimpactsinthePacific. Disaster Prevention and Management: An International Journal, 27(5), 478–494. https://doi.org/10.1108/DPM-02-2018-0057
El-Zoghbi, M., Chehade, N., McConaghy, P., & Soursourian, M. (2017). The Role of Financial Services in Humanitarian Crises. Consultative Group to Assist the Poor, State and Peace-Building Fund, and WorldBank.https://www.cgap.org/research/publication/role-financial-services-humanitarian-crises
ESCAP. (2015). Financing Disaster Risk Reduction for Sustainable Development in Asia and the Pacific.EconomicandSocialCommissionforAsiaandthePacific.https://www.unescap.org/sites/default/files/8-ESCAP_FfD_FinancingDisaster_24April2015.pdf
ESCAP. (2019). Inequality of Opportunity in Asia and the Pacific: Financial Inclusion. United Nations EconomicandSocialCommissionforAsiaandthePacific.https://www.unescap.org/sites/default/files/Financial-Inclusion-report.pdf
Fabre, C. (2017). Cash-Based Response. Organization for Economic Co-operation and Development. https://www.oecd.org/development/humanitarian-donors/docs/cashbasedresponse.pdf
Fiji Bureau of Statistics. (2015). 2013-14 Household Income and Expenditure Survey Preliminary Findings-Release1.FijiBureauofStatistics.https://microdata.pacificdata.org/index.php/catalog/314/related-materials
41
Fiji Food Security and Livelihoods Cluster. (2016). Tropical Cyclone Winston: Food Security and Livelihoods Recovery Needs Assessment, November 2016. Fiji Food Security and Livelihoods Cluster and Fiji Ministry of Agriculture. https://cop23.com.fj/wp-content/uploads/2017/06/Fiji_FSL-Recovery-Needs-Assessment_DRAFT_finalcompressed-1.pdf
Fiji Women’s Crisis Centre. (2013). Somebody’s Life, Everybody’s Business! National Research on Women’s Health and Life Experiences in Fiji (2010/2011): A survey exploring the prevalence, incidence and attitudes to intimate partner violence in Fiji. Fiji Women’s Crisis Centre. https://pacificwomen.org/wp-content/uploads/2017/09/FWCC-National-Research-on-Womens-Health-Fiji.pdf
Gawith, D., Daigneault, A., & Brown, P. (2016). Does community resilience mitigate loss and damage from climate-related disasters? Evidence based on survey data. Journal of Environmental Planning and Management, 59(12), 2102–2123. https://doi.org/10.1080/09640568.2015.1126241
Germanwatch. (2020). Climate Risk Insurance And Informal-Risk Sharing. Munich Climate Insurance Initiative. https://climate-insurance.org/wp-content/uploads/2020/05/Climate_risk_insurance_and_ISRA_Discussion_Paper_No_4_FINAL-2.pdf
GFDRR. (2020). Fiji. Global Facility for Disaster Reduction and Recovery (GFDRR), World Bank. http://thinkhazard.org/en/report/83-fiji
GIZ. (2019). Insurance for Micro, Small and Medium Enterprise Development (Inclusive Insurance Factsheet Series). Deutsche Gesellschaft für Internationale Zusammenarbeit (GIZ) GmbH. https://www.giz.de/fachexpertise/downloads/giz2019-en-factsheet_insurance_msme.pdf
Government of Fiji. (2013). Fiji Post-Disaster Needs Assessment: Tropical Cyclone Evan, 17th December 2012.GovernmentofFiji.https://www.gfdrr.org/en/publication/fiji-post-disaster-needs-assessment-tropical-cyclone-evan-december-17th-2012
Government of Fiji. (2016). Fiji Post-Disaster Needs Assessment: Tropical Cyclone Winston, February 20, 2016.GovernmentofFiji.https://www.gfdrr.org/sites/default/files/publication/PostDisasterNeeds Assessments CYCLONE WINSTON Fiji 2016 (Online Version).pdf
Government of Fiji. (2017a). 5-Year & 20-Year National Development Plan. Ministry of Economy, RepublicofFiji.https://www.fiji.gov.fj/getattachment/15b0ba03-825e-47f7-bf69-094ad33004dd/5-Year---20-Year-NATIONAL-DEVELOPMENT-PLAN.aspx
Government of Fiji. (2017b). Climate Vulnerability Assessment: Making Fiji Climate Resilient. Government of Fiji, World Bank, and Global Facility for Disaster Reduction and Recovery. http://documents.worldbank.org/curated/en/163081509454340771/pdf/120756-WP-PUBLIC-nov-9-12p-WB-Report-FA01-SP.pdf
Government of Fiji. (2018a). Planned Relocation Guidelines: A framework to undertake climate change related relocation. MinistryofEconomy,GovernmentofFiji.http://fijiclimatechangeportal.gov.fj/document/planned-relocation-guidelines-framework-undertake-climate-change-related-relocation
Government of Fiji. (2018b). Republic of Fiji National Adaptation Plan: A pathway towards climate resilience. Government of the Republic of Fiji and National Adaptation Plan (NAP) Global Network. https://www4.unfccc.int/sites/NAPC/Documents/Parties/National Adaptation Plan_Fiji.pdf

42
Hahm, H., Subhanij, T., & Almeida, R. (2019). Finteching remittances in Paradise: a path to sustainable development (Macroeconomic Policy and Financing for Development DivisionWorking PaperSeriesWP/19/08).https://www.unescap.org/sites/default/files/publications/WP-19-08Fintechand Remittance Paper.pdf
Hallegatte, S., Bangalore, M., Bonzanigo, L., Fay, M., Kane, T., Narloch, U., Rozenberg, J., Treguer, D., & Vogt-Schilb, A. (2016). Shock Waves: Managing the Impacts of Climate Change on Poverty. The World Bank. https://openknowledge.worldbank.org/bitstream/handle/10986/22787/9781464806735.pdf?sequence=13&isAllowed=y
Hallegatte, S., Rentschler, J., & Walsh, B. (2018). Building Back Better: Achieving resilience through stronger, faster, and more inclusive post-disaster reconstruction. https://openknowledge.worldbank.org/bitstream/handle/10986/29867/127215.pdf
Hallegatte, S., Vogt-Schilb, A., Bangalore, M., & Rozenberg, J. (2017). Unbreakable: Building the Resilience of the Poor in the Face of Natural Disasters. World Bank. https://openknowledge.worldbank.org/handle/10986/25335
Hobbs, C., & Jackson, R. (2016). Cash Transfer Programming in the Pacific: a Feasibility Scoping Study. The Cash Learning Partnership. https://www.calpnetwork.org/wp-content/uploads/2020/01/calp-pacific-scoping-study-web.pdf
Hsiang, S. M., & Jina, A. S. (2014). The Causal Effect of Environmental Catastrophe on Long-Run Economic Growth: Evidence from 6,700 Cyclones (NBER Working Paper 20352). http://www.nber.org/papers/w20352
IASC. (2020). INFORM Global Risk Index Mid2020. https://drmkc.jrc.ec.europa.eu/inform-index/
IDMC. (2019). Fiji. Internal Displacement Monitoring Centre. https://www.internal-displacement.org/countries/fiji
Idris, I. (2016). Youth unemployment and violence: Rapid literature review. University of Birmingham, Governance and Social Development Resource Centre (GSDRC). https://gsdrc.org/wp-content/uploads/2016/11/YouthUnemployment_Violence.pdf
Idris, I. (2017a). Cash transfer platforms in humanitarian contexts (Helpdesk Research Report 1416). University of Birmingham, Governance and Social Development Resource Centre (GSDRC). https://gsdrc.org/publications/cash-transfer-platforms-in-humanitarian-contexts/
Idris, I. (2017b). Conflict-sensitive cash transfers: unintended negative consequences (K4D Helpdesk Report200).https://gsdrc.org/publications/conflict-sensitive-cash-transfers-unintended-negative-consequences/
IFRC. (2010). A Practical Guide to Gender-Sensitive Approaches for Disaster Management. International Federation of Red Cross and Red Crescent Societies. https://www.ifrc.org/PageFiles/96532/A Guide for Gender-sensitive approach to DM.pdf
ILO. (2017a). A Study on the Future of Work in the Pacific. International Labour Organization, ILOOfficeforPacificIslandCountries.https://www.ilo.org/wcmsp5/groups/public/---asia/---ro-bangkok/---ilo-suva/documents/publication/wcms_553880.pdf
ILO. (2017b). Improving Labour Market Outcomes in the Pacific: Policy Challenges and Priorities. International Labour Organization. https://www.ilo.org/wcmsp5/groups/public/---asia/---ro-bangkok/---ilo-suva/documents/publication/wcms_559066.pdf

43
ILO. (2017c). Informal economy workers. Minimum Wage Policy Guide. https://www.ilo.org/global/topics/wages/minimum-wages/beneficiaries/WCMS_436492/lang--en/index.htm
ILO. (2019). Future of Work for Climate Resilience in the Pacific Islands. https://www.ilo.org/suva/publications/WCMS_712546/lang--en/index.htm
ILO. (2020). ILOSTAT database. International Labour Organization. https://ilostat.ilo.org/data/
IMF. (2020). Financial Access Survey. IMF Data. https://data.imf.org/?sk=E5DCAB7E-A5CA-4892-A6EA-598B5463A34C
Jack, W., & Suri, T. (2014). American Economic Association Risk Sharing and Transactions Costs : Evidence from Kenya ’ s Mobile Money Revolution Author ( s ): William Jack and Tavneet Suri Source : The American Economic Review , Vol . 104 , No . 1 ( JANUARY 2014 ), pp . 183-223 Publi. American Economic Association Risk, 104(1), 183–223. https://doi.org/10.1257/aer.l04.1.183
Jayaraman,T.K.,Choong,C.K.,&Kumar,R.(2011).RoleofremittancesinsmallPacificIslandeconomies: an empirical study of Fiji. International Journal of Economics and Business Research, 3(5), 526. https://doi.org/10.1504/IJEBR.2011.042316
Kinnan,C.,&Townsend,R.(2012).Kinshipandfinancialnetworks,formalfinancialaccess,andrisk reduction. American Economic Review: Papers & Proceedings, 102(3), 289–293. https://doi.org/10.1257/aer.102.3.289
Klapper, L., El-Zoghbi, M., & Hess, J. (2016). Achieving the Sustainable Development Goals: The Role of Financial Inclusion.https://www.cgap.org/sites/default/files/Working-Paper-Achieving-Sustainable-Development-Goals-Apr-2016_0.pdf
Le Dé, L., Gaillard, J. C., & Friesen, W. (2015). Poverty and Disasters: Do Remittances Reproduce Vulnerability? The Journal of Development Studies, 51(5), 538–553. https://doi.org/10.1080/00220388.2014.989995
Le Dé, L., Gaillard, J. C., Friesen, W., & Smith, F. M. (2015). Remittances in the face of disasters: a case study of rural Samoa. Environment, Development and Sustainability, 17(3), 653–672. https://doi.org/10.1007/s10668-014-9559-0
Le Dé, L., Gaillard, J. C., & Wardlow, F. (2015). Remittances and disaster: Policy implications for disaster risk management. International Organization for Migration. https://publications.iom.int/system/files/pdf/policy_brief_series_issue2.pdf
Le Quesne, F., Tollmann, J., Range, M., Balogun, K., Zissener, M., Bohl, D., Souvignet, M., Schuster, S., Zwick, S., Phillips, J., Wehnert, B., & Kreft, S. (2017). The Role of Insurance in Integrated Disaster & Climate Risk Management: Evidence and Lessons Learned. Munich Climate Insurance Initiative, United Nations University, Institute for Environment and Human Security (UNU-EHS). https://climate-insurance.org/wp-content/uploads/2020/05/ACRI__2017_Role_of_Insurance_in_ICRM_online-2.pdf
Lee, D., Zhang, H., & Nguyen, C. (2018). The Economic Impact of Natural Disasters in Pacific Island Countries: Adaptation and Preparedness (IMF Working Paper WP/18/108). https://www.imf.org/en/Publications/WP/Issues/2018/05/10/The-Economic-Impact-of-Natural-Disasters-in-Pacific-Island-Countries-Adaptation-and-45826
Leith, R., & Subramanian, R. (2013). Building supervisory capacity to create inclusive insurance markets in the Pacific. PacificFinancialInclusionProgramme.http://www.microinsurancecentre.org/resources/documents/building-supervisory-capacity-to-create-inclusive-insurance-markets-in-the-pacific/download.html

44
Lucas, B. (2015). Disaster risk financing and insurance in the Pacific (Helpdesk Research Report 1314). University of Birmingham, Governance and Social Development Resource Centre (GSDRC). https://gsdrc.org/publications/disaster-risk-financing-and-insurance-in-the-pacific/
Maher, B., & McCaffrey, M. (2012). Weather Index-Based Insurance in Fiji: Brief on Initial Scoping (No.5;FocusNotes).PacificFinancialInclusionProgramme.http://www.pfip.org/wp-content/uploads/2016/08/PFIP-focus-weather-index-based-insurance-in-Fiji.pdf
Mahul, O., Cook, S., & Bailey, B. (2015). Advancing Disaster Risk Financing & Insurance In The Pacific. WorldBank.https://www.gfdrr.org/sites/default/files/publication/2015.06.25_PCRAFI_Combined-%5BCompressed%5D-rev-0.9.pdf
Mansur, A., Doyle, J., & Ivaschenko, O. (2017). Social Protection and Humanitarian Assistance Nexus for Disaster Response: Lessons Learnt from Fiji’ s Tropical Cyclone Winston. World Bank, 1701, 56. https://doi.org/10.1596/26408
Mansur, A., Doyle, J., & Ivaschenko, O. (2018). Cash Transfers for Disaster Response: Lessons from Tropical Cyclone Winston. Australian National University. https://doi.org/10.2139/ssrn.3143459
Marcus, R., & Gavrilovic, M. (2010). The Impacts of the Economic Crisis on Youth: Review of Evidence. Overseas Development Institute. https://assets.publishing.service.gov.uk/media/57a08b1740f0b64974000970/60828_Youth-Evidence-Review-Final.pdf
Martyn, T., & Rogers, S. (2016). Food matters: Policy measures for strengthening food and nutrition security in the Pacific island countries. Food and Agriculture Organization of the United Nations, Sub-regionalOfficeforthePacific.http://www.fao.org/3/a-i6605e.pdf
McMichael, C., Katonivualiku, M., & Powell, T. (2019). Planned relocation and everyday agency in low‐lying coastal villages in Fiji. The Geographical Journal, 185(3), 325–337. https://doi.org/10.1111/geoj.12312
Melde, S., & Laczko, F. (2017). Conclusion: Implications for policy. In S. Melde, F. Laczko, & F. Gemenne (Eds.), Making Mobility Work for Adaptation: Results from the MECLEP Global Research. International Organization for Migration. https://collections.unu.edu/eserv/UNU:6261/meclep_comparative_report.pdf
Naidu,S.,&Chand,A.(2012).Acomparativestudyofthefinancialproblemsfacedbymicro,smalland medium enterprises in the manufacturing sector of Fiji and Tonga. International Journal of Emerging Markets, 7(3), 245–262. https://doi.org/10.1108/17468801211236974
OCHA. (2015). El Niño in the Pacific.UnitedNationsOfficefortheCoordinationofHumanitarianAffairs(OCHA).https://www.humanitarianresponse.info/sites/www.humanitarianresponse.info/files/documents/files/rop_hb_nov18.pdf
OECD. (2020). OECD.Stat. OECD.Stat. https://stats.oecd.org/
Pairama,J.,&LeDé,L.(2018).RemittancesforDisasterRiskManagement:PerspectivesfromPacificIsland Migrants Living in New Zealand. International Journal of Disaster Risk Science, 9, 331–343. https://doi.org/10.1007/s13753-018-0183-8
Paul, S. (2016). Fiji National Employment Policy – Draft Framework.UniversityoftheSouthPacificandUniversity of Western Sydney. https://www.researchgate.net/publication/322538468_Fiji_National_Employment_Policy-Draft_Framework
45
PCRAFI. (2011). Country Risk Profile: Fiji.WorldBank,SecretariatofthePacificCommunity,andAsianDevelopmentBank.https://www.pacificclimatechange.net/sites/default/files/PCRAFI_country-risk-profile_Fiji.pdf
PCRAFI. (2013). Catastrophe Risk Assessment Methodology.WorldBank,SecretariatofthePacificCommunity,andAsianDevelopmentBank.https://www.gfdrr.org/sites/default/files/publication/PCRAFI_Catastrophe_Risk_Assessment_Methodology.pdf
PCRAFI. (2015). Country Note: Fiji.WorldBank.http://pcrafi.spc.int/documents/193
Piggott-McKellar, A. E., McNamara, K. E., Nunn, P. D., & Sekinini, S. T. (2019). Moving people in a changing climate: Lessons from two case studies in Fiji. Social Sciences, 8(5). https://doi.org/10.3390/socsci8050133
Prasad, B., Chen, H., & Singh, B. (2013). An analysis of employment prospects in Fiji’s urban area. The Journal of Pacific Studies, 33(2), 30–47. http://repository.usp.ac.fj/7648/1/An_Analysis_of_Employment_prospects_in_Fiji’s_Urban_Area.pdf
Prochaska, K., Levula, V., & Levula, A. (2018). Reserve Bank of Fiji’s Experience with Financial Inclusion and Climate Change.AllianceforFinancialInclusion.https://www.afi-global.org/sites/default/files/publications/2018-11/AFIFICC_Fiji_casestudy_AW_digital.pdf
Ramachandran, V., & Masood, J. S. (2019). Are the Pacific Islands Insurable? Challenges and Opportunities for Disaster Risk Finance (Working Paper 516). https://www.cgdev.org/publication/are-pacific-islands-insurable-challenges-opportunities-disaster-risk-finance
Ravesloot, B., & Sobir, R. (2017). Post-Disaster Educational Continuity in Fiji and the Impact of Disaster Risk Reduction and Education in Emergencies Programming. Tango International and Save the Children.https://resourcecentre.savethechildren.net/node/14173/pdf/fiji_post_winston_edu_continuity_report_eng_2017.pdf
Reserve Bank of Fiji. (2015). Financial Services Demand Side Survey: Republic of Fiji. Reserve Bank of Fiji.http://www.pfip.org/wp-content/uploads/2016/08/Fianancial-Services.pdf
Reserve Bank of Fiji. (2016). National Financial Inclusion Strategic Plan 2016–2020. Reserve Bank of Fiji.http://www.pfip.org/wp-content/uploads/2016/09/2016-2020-Fiji-FI-Strategy-Aug26.pdf
Reserve Bank of Fiji. (2019a). 2019 Financial Inclusion Report. Reserve Bank of Fiji.http://www.nfitfiji.com/wp-content/uploads/Fiji-Financial-Inclusion-Annual-report-2019_final.pdf
Reserve Bank of Fiji. (2019b). Insurance Annual Report 2018. Reserve Bank of Fiji. http://www.parliament.gov.fj/wp-content/uploads/2019/08/Reserve-Bank-of-Fiji-2018-Insurance-Annual-Report-1.pdf
Save the Children and ACAPS. (2018). Introductory Research on the Feasibility of Cash and Voucher Assistance in Rural Fiji.SavetheChildrenandACAPS.https://reliefweb.int/report/fiji/introductory-research-feasibility-cash-and-voucher-assistance-rural-fiji
Schaefer, L., & Waters, E. (2016). Climate Risk Insurance for the Poor & Vulnerable: How to Effectively Implement the Pro-Poor Focus of Insuresilience. Munich Climate Risk Insurance Initiative (MCII). https://collections.unu.edu/eserv/UNU:5956/MCII_CRI_for_the_Poor_and_Vulnerable_meta.pdf
Schimel, A. (2020). Fiji. In P. Barnes (Ed.), A Pacific disaster prevention review. Australian Strategic PolicyInstituteLimited.https://www.aspi.org.au/report/pacific-disaster-prevention-review

46
Schoeffel, P. (2006). Country Gender Assessment: Republic of the Fiji Islands. Asian Development Bank.https://www.adb.org/sites/default/files/institutional-document/32240/cga-fiji.pdf
Shao,K.,Liu,W.,Gao,Y.,&Ning,Y.(2019).Theinfluenceofclimatechangeontsunami-likesolitarywave inundation over fringing reefs. Journal of Integrative Environmental Sciences, 16(1), 71–88. https://doi.org/10.1080/1943815X.2019.1614071
Singh-Peterson, L., & Iranacolaivalu, M. (2018). Barriers to market for subsistence farmers in Fiji – A gendered perspective. Journal of Rural Studies, 60, 11–20. https://doi.org/10.1016/j.jrurstud.2018.03.001
Singh,A.(2020).BenefitsofcropdiversificationinFiji’ssugarcanefarming.Asia & the Pacific Policy Studies, 7(1), 65–80. https://doi.org/10.1002/app5.291
SPC. (2015). The Pacific Youth Development Framework 2014–2023: A coordinated approach to youth-centred development in the Pacific.SecretariatofthePacificCommunity.https://www.spc.int/sites/default/files/resources/2018-05/Pacific_Youth_Development_Framework.pdf
Takasaki, Y. (2015). Learning from disaster: community-based marine protected areas in Fiji. Environment and Development Economics, 21(1), 53–77. https://doi.org/10.1017/S1355770X15000108
Takasaki, Y. (2017). Do Natural Disasters Decrease the Gender Gap in Schooling? World Development, 94(SI), 75–89. https://doi.org/10.1016/j.worlddev.2016.12.041
Taylor, C., & Michael, S. (2013). Gender domestic violence and its big bite on small island states- Fiji, Solomon Islands and Vanuatu. 14th Annual Global Development Network Conference: Inequality, Social Protection and Inclusive Growth.http://www.gdn.int/admin/uploads/editor/files/2013Conf_Papers/CharlotteTaylor_paper.pdf
Thomas, A. S., Mangubhai, S., Vandervord, C., Fox, M., & Nand, Y. (2019). Impact of Tropical CycloneWinstononwomenmudcrabfishersinFiji.Climate and Development, 11(8), 699–709. https://doi.org/10.1080/17565529.2018.1547677
Tronquet, C. (2015). From Vunidogoloa to Kenani: An insight into successful relocation. The State of Environmental Migration, 121–142. http://labos.ulg.ac.be/hugo/wp-content/uploads/sites/38/2017/11/The-State-of-Environmental-Migration-2015-121-142.pdf
UNDP. (2019). Human Development Report 2019. United Nations Development Programme. http://hdr.undp.org/sites/default/files/hdr2019.pdf
UNDRR. (2019). Disaster Risk Reduction in the Republic of Fiji: Status Report 2019.UNOfficeforDisasterRiskReductionandAsianDisasterPreparednessCenter.https://reliefweb.int/report/fiji/disaster-risk-reduction-republic-fiji-status-report-july-2019
UNDRR. (2020). DesInventar Pacific Islands dataset.UnitedNationsOfficeforDisasterRiskReduction(UNDRR). https://www.desinventar.net/DesInventar/main.jsp
United Nations. (2015). Sendai Framework for Disaster Risk Reduction 2015-2030 (Third UN World Conference on Disaster Risk Reduction, Sendai, Japan, March 18, 2015). United Nations. https://www.preventionweb.net/files/43291_sendaiframeworkfordrren.pdf
United Nations Population Division. (2019). World Population Prospects 2019. World Population Prospects 2019. https://population.un.org/wpp/Download/Standard/Population
47
Vincent, K., Tschakert, P., Barnett, J., Rivera-Ferre, M. G., & Woodward, A. (2014). Gender and Climate Change. In C. B. Field, V. R. Barros, D. J. Dokken, K. J. Mach, M. D. Mastrandrea, T. E. Bilir, M. Chatterjee, K. L. Ebi, Y. O. Estrada, R. C. Genova, B. Girma, E. S. Kissel, A. N. Levy, S. MacCracken, P. R. Mastrandrea, & L. L. White (Eds.), Climate Change 2014: Impacts, Adaptation, and Vulnerability. Part A: Global and Sectoral Aspects. Contribution of Working Group II to the Fifth Assessment Report of the Intergovernmental Panel on Climate Change (pp. 105–107). Cambridge University Press. https://www.ipcc.ch/site/assets/uploads/2018/02/WGIIAR5-PartA_FINAL.pdf
Warner, K., Kreft, S., Zissener, M., Höppe, P., Bals, C., Loster, T., Linnerooth-Bayer, J., Tschudi, S., Gurenko, E., Haas, A., Young, S., Kovacs, P., Dlugolecki, A., & Oxley, A. (2012). Insurance solutions in the context of climate change-related loss and damage: Needs, gaps, and roles of the Convention in addressing loss and damage. Munich Climate Insurance Initiative. https://collections.unu.edu/eserv/UNU:1835/pdf10573.pdf
Wehrhahn, R., Oza, A., Savage, L., Walsh, R., Veisamasama, G., & Pascual, M. C. (2019). The Enabling Environment for Disaster Risk Financing in Fiji: Country Diagnostics Assessment. Asian DevelopmentBank.https://www.adb.org/publications/fiji-environment-disaster-risk-financing
World Bank. (2017a). Pacific Possible: Long-term Economic Opportunities and Challenges for Pacific Island Countries. World Bank. http://documents1.worldbank.org/curated/en/168951503668157320/pdf/ACS22308-PUBLIC-P154324-ADD-SERIES-PPFullReportFINALscreen.pdf
World Bank. (2017b). Republic of Fiji: Systematic Country Diagnostic. World Bank. http://documents1.worldbank.org/curated/en/668391506585108864/pdf/120106-SCD-P160757-PUBLIC-FijiSCDpostDecisionclean.pdf
World Bank. (2020). World Bank Open Data. https://data.worldbank.org/
World Travel & Tourism Council. (2020). Fiji. World Travel & Tourism Council. https://wttc.org/Research/Economic-Impact
WTO.(2019).Pacificstudy(focusingonFiji,TongaandVanuatu).InThird Symposium on Natural Disasters and Trade. World Trade Organization. https://www.wto.org/english/tratop_e/devel_e/study_1_pacific_country_annex_18_april_draft_final.pdf
Xing, Z. (2018). Development Impacts of Remittances in Agricultural Households: Fiji Experience. Remittances Review, 3(1), 19–49. https://doi.org/10.33182/rr.v3i1.425
Check out our websitewww.uncdf.org
Twitter@UNCDFdigital
Facebook@UNCDFdigital
This publication is brought to you by the United Nations Capital Development Fund (UNCDF) aspartofitsfoundationalworkunderthePacificInsuranceandClimateAdaptationProgramme being implemented jointly with the United Nations University, Institute for Environment and Human Security (UNU-EHS) and the United Nations Development
Programme (UNDP). Brian Lucas is the author of this literature review report.
Copyright December 2020 @UN Capital Development Fund.
The views expressed in this publication are the author(s) alone and are not necessarily
the views of the New Zealand Aid Programme, the Australian Government, the
United Nations, including UNCDF, or their member states.
Supported by the Governments of New Zealand and Australia.