change related impacts and vulnerable groups
TRANSCRIPT

TIPS is a research
organisation that
facilitates policy
development and
dialogue across three
focus areas: Trade
and Industrial Policy,
Inequality and
Economic Inclusion,
and Sustainable
Growth
[email protected] +27 12 433 9340 www.tips.org.za
TRADE & INDUSTRIAL POLICY STRATEGIES
National Employment
Vulnerability Assessment:
Analysis of potential climate-
change related impacts
and vulnerable groups
October 2019
Neva Makgetla,
Nokwanda Maseko,
Gaylor Montmasson-Clair,
and Muhammed Patel

ii
Table of content
Table of content ......................................................................................................................... ii
Executive summary .................................................................................................................... v
1 Aims and methodology ...................................................................................................... v
2 The coal value chain ........................................................................................................... v
3 The metals value chain ..................................................................................................... vi
4 Petroleum-based transport ............................................................................................ viii
5 Agriculture ......................................................................................................................... x
6 Tourism ............................................................................................................................. xi
Analysis of potential impacts and vulnerable groups in each value chain ................................ 1
1 Background and aims ......................................................................................................... 1
2 Analysing vulnerability ....................................................................................................... 2
3 The coal value chain ........................................................................................................... 4
3.1 Scope ........................................................................................................................... 5
3.2 Major trends in the value chain .................................................................................. 8
3.2.1 Sales, value add and exports ............................................................................... 8
3.2.2 Profitability ........................................................................................................... 9
3.2.3 Employment ....................................................................................................... 11
3.2.4 Ownership and control ...................................................................................... 12
3.3 Impacts ...................................................................................................................... 13
3.3.1 Coal importers reduce demand for coal by switching to alternate fuel options
14
3.3.2 International trade pressure .............................................................................. 16
3.3.3 Consumers reduce demand for grid-based, coal-fuelled electricity ................. 16
3.3.4 Domestic energy policy turns away from coal ................................................... 17
3.3.5 Outcomes ........................................................................................................... 17
3.4 Vulnerability Analysis ................................................................................................ 18
3.4.1 Affected municipalities ...................................................................................... 18
3.4.2 The extent of vulnerability ................................................................................. 22
3.4.3 Financial Capital ................................................................................................. 23
3.4.4 Human Capital .................................................................................................... 25
3.4.5 Social Capital ...................................................................................................... 27
4 The metals value chain .................................................................................................... 31
4.1 Scope ......................................................................................................................... 31
4.2 Major trends in the value chain ................................................................................ 32
4.2.1 Production .......................................................................................................... 32
4.2.2 Value add ........................................................................................................... 38
4.2.3 Employment ....................................................................................................... 39
4.2.4 Ownership and control ...................................................................................... 40
4.2.5 Energy dependence ........................................................................................... 41
4.3 Dimensions of climate-change related impacts ........................................................ 43

iii
4.3.1 Type of risks ....................................................................................................... 43
4.3.2 Impact of risks .................................................................................................... 47
4.3.3 Existing responses .............................................................................................. 49
4.3.4 Key implications ................................................................................................. 50
4.4 Vulnerable groups ..................................................................................................... 51
4.4.1 Workers .............................................................................................................. 51
4.4.2 Communities ...................................................................................................... 60
5 Petroleum-based transport ............................................................................................. 69
5.1 Scope of the value chain ........................................................................................... 69
5.2 Major trends in the value chain ................................................................................ 69
5.2.1 Production .......................................................................................................... 70
5.2.2 Employment ....................................................................................................... 72
5.2.3 Spatial distribution of employment ................................................................... 73
5.2.4 Structure of ownership ...................................................................................... 74
5.3 Dimensions of climate-change related impacts ........................................................ 75
5.3.1 Changes in vehicle technology and fuels ........................................................... 76
5.3.2 Petrol stations .................................................................................................... 77
5.3.3 Repairs and maintenance .................................................................................. 78
5.3.4 Transport services .............................................................................................. 78
5.3.5 The auto industry ............................................................................................... 80
5.4 Vulnerable groups ..................................................................................................... 81
5.4.1 Petrol station attendants ................................................................................... 83
5.4.2 Auto mechanics .................................................................................................. 85
5.4.3 Small transport businesses ................................................................................ 88
5.4.4 The auto industry ............................................................................................... 91
6 Agriculture ....................................................................................................................... 94
6.1 Trends in the agricultural value chain ....................................................................... 94
6.1.1 The structure of ownership and employment ................................................... 94
6.1.2 Scope of the agricultural value chain ................................................................. 96
6.1.3 Trends in production ........................................................................................ 101
6.1.4 Employment ..................................................................................................... 105
6.2 Dimensions of climate-change related impacts ...................................................... 106
6.2.1 Direct impacts .................................................................................................. 106
6.2.2 Policy impacts .................................................................................................. 109
6.2.3 The impact on farmworkers............................................................................. 112
6.2.4 Farmers and gardeners in the historic labour-sending regions....................... 113
6.3 Vulnerable groups ................................................................................................... 118
6.3.1 Farmworkers .................................................................................................... 118
6.3.2 Farmworkers’ resources .................................................................................. 119
6.4 Farmers and gardeners in the historic labour-sending regions .............................. 128
6.5 Farming communities .............................................................................................. 138
7 Tourism value chain ....................................................................................................... 141
iv
7.1 Scope ....................................................................................................................... 141
7.2 Overview of the value chain .................................................................................... 141
7.2.1 Production ........................................................................................................ 141
7.2.2 Employment ..................................................................................................... 144
7.2.3 Spatial distribution ........................................................................................... 146
7.3 Dimensions of impact .............................................................................................. 147
7.4 Vulnerable groups in tourism .................................................................................. 149
7.4.1 Financial resources .......................................................................................... 149
7.4.2 Human capital .................................................................................................. 149
7.4.3 Social capital .................................................................................................... 150
References ............................................................................................................................. 151

v
Executive summary
1 Aims and methodology
This report provides a detailed analysis of the capacity of vulnerable communities, workers and businesses to adjust to climate-change related impacts. For the development of resilience plans, it indicates both where developments warrant a programmatic response, and the needs of vulnerable groups as they seek a viable adjustment.
A review of the literature on vulnerability in South Africa suggests that vulnerability should be evaluated in terms of financial resources, including income and savings; physical assets, which encompasses housing and productive resources; human capital in the form of education and skills; and social capital, which covers social networks at work and in the community. This report provides an initial review of the available data primarily for the affected workers and, where relevant, communities and small businesses.
In practice, control over all these resources generally aligns not only with class but also with race and gender. In this study, however, several vulnerable groups, including for instance farmworkers and ordinary miners, include virtually no white people. Several also have few women members, as in the case of mechanics and miners.
The study draws primarily on data from the General Household Survey and the Labour Market Dynamics Survey as well as interviews with a variety of informants, from employers to union organisers to government officials and researchers.
2 The coal value chain
The main climate-change related impacts on the coal value chain derive from a decline in demand at home and abroad, as countries seek to reduce their GHG emissions especially from electricity but also from other uses. The impacts are, however, difficult to distinguish in some cases from the effects of the slowdown in the South African and global economy over the past five years. The downturn has been particularly marked in metals refining, a major source of demand for electricity in South Africa.
The coal value chain has been central to South Africa’s development, especially for energy, petro-chemicals and metals refineries, for over a century. It is the main input for electricity and basic chemicals, and an important export. Coal mining employs almost 80 000 people, Eskom generation 12 000 and Sasol, 26 000. Some 80% of the production of coal mining is located in two districts in Mpumalanga - eMalahleni (formerly Witbank) and Gert Sibande. Eskom historically located its plants near the mines, although Medupi is in Limpopo near newly opened coal fields there.
Coal sales declined by approximately 4% between 2012 and 2017. Both domestically and internationally, electricity generation is shifting away from coal, and Sasol aims to shift to natural gas from Mozambique as its main feedstock. Coal employment fell from a high of 90 000 in 2013 to under 80 000 in 2015, then essentially levelled out.
Five companies account for over 80% of coal capacity in South Africa - Anglo Coal, BHP Billiton/ South32/SAEC, Sasol, Exxaro and Xstrata – while a cluster of much smaller companies

vi
supplies the remainder. Anglo American, Exxaro Resources, Glencore and South32 together supply between 70% and 80% of Eskom’s coal consumption.
The vulnerability analysis for coal focuses on the coal-dependent municipalities in Mpumalanga and on miners.
Four municipalities in Mpumalanga have highly undiversified economies that rely heavily on coal mining – eMalahleni (Witbank), Steve Tshwete (Middelburg), Govan Mbeki and Msukaligwa (Ermelo). Coal accounts for 44% of the economy in eMalahleni, and around 34% in Steve Tswhete and Msukaligwa. In eMalahleni, Steve Tshwete, Msukaligwa and Govan Mbeki, coal mining accounts for 26%, 17%, 14% and 11% of total employment respectively. Miners in these four local municipalities account for approximately 76% of total coal employment in South Africa.
Information on workers’ pay, pension funds and unemployment insurance are available, but not on physical assets. Workers in the coal value chain (where under 15% were women) typically compare well with other formal workers, especially given relatively low formal qualifications. In coal mining and heavy chemicals, the median pay was over R10 000 a month, compared to just over R5000 for other formal workers. In the electricity industry, median pay was closer to R15 000 a month. Some 80% of workers in the coal value chain had retirement funds in 2017, compared to less than 60% of other formal workers. Similarly, the coal value chain has a greater level of participation in the UIF than the rest of the economy, ranging from over 90% in coal to around 75% in basic chemicals.
Education levels in coal mining were however slightly behind the norm for other formal workers. Workers with matric or less comprised 80% of the coal labour force in 2017, compared to 74% for formal workers outside of the value chain, 73% for heavy chemicals and plastics workers, and just 53% in electricity.
The available information on social capital relates principally to the workplace, in terms of union membership and labour rights. Over 70% of miners are union members, as are 67% of workers in electricity generation and 45% in basic chemicals. In the formal economy as a whole, the figure is just 35%. Workers in the value chain are also more likely than most to see their positions as permanent (although the mining companies themselves report a high level of contract labour). Most workers also report that they get leave and have written contracts in line with labour law requirements.
3 The metals value chain
The transition to a low-carbon world will reshape the metals value chain, from shifting demand for specific metals to the methods of production to access to essential inputs, such as energy and water. In South Africa, reliance on coal-fuelled electricity will require substantial changes as domestic and foreign policies require internalisation of the costs of GHG emissions. Electricity accounts for just over 10% of costs in most of the value chain. It is however 5% or less in open-pit mines and machinery production, but exceeds half of total costs for electric smelters. Some activities, such as primary steelmaking, are moreover inherently carbon-intensive (due to the chemical reactions at play).
At the mining stage, South Africa’s metals value chain is heavily dominated by gold, PGMs, iron, manganese and chrome. Sales for all metals were heavily affected by the end of the global metals boom that lasted from around 2002 to 2011. In 2011, prices reached 30-year

vii
peaks, then dropped by between half and two thirds in dollar terms. South Africa gold has faced a longer term decline from the 1980s. PGMs are now seeing falling demand as recycling increases and auto manufacturers reduce the amount of platinum used in catalytic converters. In contrast, iron ore and manganese sales climbed rapidly from the early 2000s, largely to supply the Chinese steel boom.
The metals value chain directly employed around 740 000 people in 2018. Miners made up half the jobs, with the rest equally divided between refineries and downstream machinery production. The value chain had shrunk from over 900 000 in 1993, mostly due to downsizing in gold and to a lesser extent the metals refineries. The losses were partially offset by growth in PGMs, iron ore and machinery production.
Because mining and refining are highly concentrated, they are dominated largely by a few companies. The machinery sector, in contrast, is relatively diverse, with a number of smaller specialist firms as well as large subsidiaries of foreign original equipment manufacturers (OEMs).
As with coal mining, the most vulnerable groups comprise miners, their communities, and small businesses that supply goods and services to the dominant companies or to miners’ households. Close to 90% of workers are men.
Nine districts display a particularly high share of value added from the metals value chain, especially mining, and would be hard-hit by a decline in the industries. They are John Taolo Gaetsewe (iron ore) and Namakwa (copper) in the Northern Cape; Bojanala (PGMs) and Dr Kenneth Kaunda (gold) in the North West; the Waterberg (iron ore), Sekhukhune (PGMs) and Mopani (copper) in Limpopo; Lejweleputswa (gold) in the Free State; and the West Rand (gold) in Gauteng.
This concentration has deep consequences for the communities relying on such activities, particularly rural towns that depend on mining. They include Thabazimbi in Limpopo, with 50% employment in mining in 2018; Rustenburg in the North West with 49%; and Moses Kotane (also in the North West) with 38%. In Greater Tubatse in Limpopo, mining plus metals accounts for 31% of employment.
As with coal, workers in the mines are well paid relative to their qualifications, which may make it more difficult to find alternative jobs. In 2017, the median pay for miners came to R11 000 a month. The median for workers in refineries and downstream manufactures, in contrast, was around R5000, more or less the same as earnings for other formal workers. Miners were also more likely than other workers to have pension funds and UIF protection.
In terms of physical assets, case studies of the platinum belt suggested that small rural towns often do not provide land for miners to build houses. Instead, many miners said they lived in informal slums while constructing housing in other regions.
Employees in mining and refining have lower levels of education than other formal workers. Between 45% and 50% of workers in these industries do not have matric, compared to under 40% for other formal employees. Most of the rest have matric, while 12% to 13% have a diploma or degree. In machinery and equipment, in contrast, education is generally higher than for other formal workers. The share of employees with a higher education (diploma or degree) is about a third, compared to a quarter for formal workers in other industries.
Workplace relations again serve as an indicator of social capital. As with coal, miners were more likely to belong to unions, have pension funds and UIF membership than other workers.

viii
In contrast, in the metals and machinery industries, union membership, access to pension funds and UIF membership were in line with other formal workers.
4 Petroleum-based transport
Efforts to reduce GHG emissions from transport will most likely affect employment through a shift away from internal combustion engine (ICE) vehicles to electric and hybrid vehicles. The affected workers include petrol station attendants; mechanics, due to more infrequent service requirements; minibus taxi owners; and employees in the auto industry.
The effects on employment will depend in part on the time required to move to electric vehicles in South Africa and abroad. There is little certainty about timeframes, in part because the change depends on government support and incentives. In this context, government measures to promote electric vehicle assembly in South Africa and to assist taxi drivers to procure electric or hybrid minibuses will affect the extent of job losses.
In 2017, there were 625 000 workers in personal and freight road transport services; 250 000 in auto maintenance and repairs; 130 000 in petrol stations; 140 000 in auto sales; and 80 000 in auto assembly. The figure for transport services included 200 000 minibus taxi drivers, 160 000 other taxi and van drivers, and 90 000 formal freight drivers.
The share of small businesses – employers and self-employed – in employment in the value chain is relatively high, mostly because of the relatively large informal sector in transport services and maintenance. Small businesses in the value chain are often informal and precarious, providing low incomes and no benefits. Some 30% of mechanics are informal employers or self employed, as are 10% of minibus taxi drivers and 16% of others employed in road transport. The 4600 petrol stations are owned by the major petroleum giants but operated as franchises.
Except in the case of auto manufacturing, which is centred in the metros of Gauteng, the Eastern Cape and KwaZulu Natal, the impact is likely to be dispersed across the country.
For petrol station attendants, incomes are set by regulation at R29 an hour, compared to the national minimum wage of R20 an hour. In 2017, women, who made up almost a third of all petrol attendants, had a median income of R4000 a month, while the median for men was R4120. Only half of petrol attendants had a retirement fund, but they were somewhat more likely than other workers to belong to the UIF.
Like other retail workers, petrol station attendants generally had to have matric, but only 5% had a post-secondary diploma or degree, compared to 25% of other formal workers. Employers argued that attendants saw the work as a stepping stone to other employment, which would facilitate adjustment to downsizing. Only 10% of petrol attendants were union members, compared to the 35% average for formal workers. They had written contracts and leave in line with other employees, but worked a median 48-hour week compared to the norm of 40 hours in other industries.
Mechanics’ resourcing varied significantly between the formal and informal sector. Formally employed mechanics had a median wage of R4400 a month in 2017, compared to R3250 a month for those in the informal sector. In the formal sector, employers’ monthly pay came to R12 000 a month; in the informal sector, where most business owners worked alone, it was R5000. But employers and self-employed people, as well as informal employees, do not get employer-supported retirement funds or unemployment insurance. In 2017 only half of all

ix
waged auto mechanics in the formal sector had a retirement fund. Mechanics in micro businesses had some physical assets, usually premises and some equipment. There are however no data available on their value.
Relatively few mechanics have completed formal artisanships, and they have low levels of schooling particularly in the informal sector. In the formal sector, only half had matric or more; in the informal sector, the share fell to a third. Still, they had significant practical skills that should in theory help them adapt, especially if they could be certified.
In terms of social capital, virtually no self-employed mechanic in the informal sector belongs to a business association, compared to 36% of mechanics with businesses in the formal sector. Similarly, only 1% of waged mechanics in the informal sector said they were union members in 2017, while for formal employees, the figure was only 19%. Auto mechanics’ median age is 48, more than a decade older than the median for other workers. Arguably that makes it more difficult for them to find new opportunities, although they likely have stronger social networks and experience.
In transport services, the most vulnerable were the 270 000 businesspeople and workers in micro businesses, most of whom were taxi owners or drivers. Of these, 85 000 were self-employed and six out of seven were in the informal sector.
Informal business owners in transport services earned around R4000 a month and their employees earned a median of R2500 a month. The employees were less likely than those in other industries to have retirement funds or UIF. Four out of five taxi owners have a single taxi, and their earnings are insufficient to replace it without a government subsidy.
Around a third of employers and two thirds of employees in very small road transport enterprises did not have matric, and almost none had proceeded beyond secondary school. That was round the same as in other small businesses, but lower than for larger enterprises. Most worked as drivers, which counts as semi-skilled work.
In terms of social capital, the taxi industry was notable for the strength of business associations. In 2017, 60% of small business owners in the road transport industry belonged to a business association, compared to 20% in the rest of the economy, in part because association approval was needed to get a legal route. In contrast, few employees were union members, and only a tenth said they had a permanent position, a written contract, or access to any kind of leave. That was lower than workers in similarly sized businesses in other industries. The median hours of work for employees came to 60 hours a week; for taxi owners, to 50 hours.
Finally, auto workers had relatively stable, formal and well-paid work. The median employee earned R7200 a month. Four out of five belonged to a retirement fund, and over nine in ten to the UIF. A relatively large number had matric, although fewer auto workers had post-secondary education than in other industries. The industry had a tradition of recognising skills, with a fifth of its employees counting as skilled production workers compared to a tenth in the rest of manufacturing. Half of workers in auto were union members, with the attendant respect for their legal rights.

x
5 Agriculture
The agricultural value chain is, by definition, heavily affected by changes in the climate, especially by increased heat and the associated rise in droughts and by more tempestuous rainfall. By region, droughts have become more likely in the Western Cape and Limpopo over the past 50 years, while temperatures have risen twice as fast in inland provinces as along the coast.
Agriculture remains one of the most unequal areas of the economy. The ability to adapt to the climate crisis differs substantially between workers and their communities in the formal agro-industrial value chain, on the one hand, and households in the historic labour-sending regions on the other for which gardening and livestock constitute a subordinate component in complex livelihood strategies. In addition, the impacts of the climate crisis and the nature of vulnerability vary substantially between horticulture, field crops and livestock farming.
In 2017, 785 000 people were employed in industrial agriculture, 300 000 in food processing, and 80 000 in the production of wine and other alcoholic beverages. Industrial agriculture contributed 5% of total employment and food processing 2% (but over a quarter of manufacturing jobs). Employment in industrial agriculture and food processing climbed by around a quarter from 2010 to 2018, after shedding jobs fairly steadily from the 1980s.
If droughts or higher temperatures lead to farm closures or consolidation, they would typically result in job losses for farmworkers and a loss of anticipated employment for seasonal workers. The prolonged drought in the Western Cape saw a net loss of around 40 000 farm jobs, or around a fifth of the total in horticulture, field crops and mixed farming.
Farmworkers had remarkably limited resources to respond to job losses. Median earnings for farmworkers came to R2500 a month for women in 2017, and R2800 for men. Only 15% of women farmworkers and 18% of men had a retirement fund although they belonged to the UIF at the same rate as other formal workers.
Farmworkers’ lack of resources emerged in the fact that around 9% of other workers, but only 5% of farmworkers, relied in part on savings to tide them over while unemployed. Just 0,7% of former farmworkers said they received support from the UIF, compared to 1,7% of other jobless workers. For both farmworkers and other workers, the main source of support for jobless people was household members.
The main physical asset for most low-income South African households is their homes, since very few own land or capital. Farmworkers, however, mostly lived in housing that was tied to their work. They could not buy their homes and, if they lost their jobs, could be evicted after 30 days’ notice.
Farmworkers had far lower levels of formal education than other formal workers. Fewer than one in seven had matric or more. Over a third had only primary, and half had some secondary. As a result, although farmworkers comprised just 6% of all formal workers, they made up over a third of those without primary schooling.
Farmworkers appear more weakly integrated into society than other formal workers as a result of both lower levels of education and because they live on farms. Their limited ties appear in unstable employment relations, low levels of organisation, and inadequate observance of labour rights. For instance, less than 60% of farmworkers say they get sick leave and only around half have permanent jobs. In addition, an unusually large share of farmworkers – over half - live in one or two person households, and they have unusually low

xi
levels of communications technology services. Farmworkers also have comparatively limited access to social services, social grants and remittances, which underscores comparatively weak social support.
The direct effects of climate change will likely be harshest on households that have farms or food gardens in the former labour-sending regions. They will mostly take the form of reduced access to water and deteriorating food security as household produce fails, rather than loss of employment, since most do not rely primarily on farming for income or food.
“Woman-headed” households, irrespective of their farming activities, had median cash incomes of under R2400 a month in 2018. The median incomes of “man-headed” households ranged from almost R5000 a month for those that did not farm at all, to R3700 for households that did some gardening, to R3400 a month for households that depended on farming as their main source of food or income. For comparison, in other parts of the country, the median income of “woman-headed” households was R5700 a month, and for “man-headed” households it was R10 000. Farming and gardening households tended to be more dependent on social grants and less on paid employment than other households.
In the historic labour-sending regions, access to land for farming did not, in most cases, mean that households had a disposable asset. The vast majority farmed in their yards, which meant they could not simply sell their farmland. Moreover, only around half of the total, and two thirds of those who depended primarily on farming for a livelihood, actually owned the land. In terms of housing, 80% of households in the historic labour-sending regions owned their homes, but three quarters said their house was worth less than R100 000, compared to two fifths in other regions. Only just over one in ten houses in the historic labour-sending regions was valued at over R2 million, compared to one in four in the rest of the country.
Over two thirds of people aged 18 to 64 in the historic labour-sending regions had less than matric, and only between 1% and 2% had a university degree.
Around nine out of ten households with gardens in the historic labour-sending regions received social grants. That in itself would cushion them against some of the effects of climate change. Social grants were the main source of income for half of “woman headed” gardening households in 2018, and for two out of five of those “headed” by a man. Relatively few households, however, got an old age pension or disability grant, which was at a level to lift two people out of poverty. They were more likely to get the child support pension, which was enough to support half a person at the poverty line.
6 Tourism
The SJRP will focus on tourism as usually understood, that is as relating to recreational travel rather than business, health and education. Tourism however is not a category in the standard industrial classification, which means that there is generally less data, and less reliable data, on the value chain than other industries.
The impact of climate change and efforts to mitigate it on tourism for South Africa relate to both supply and demand for tourism services. In particular, on the supply side the changing environment affects nature-based tourism sites and, in the Western Cape, accommodation capacity. In terms of demand, efforts to limit emissions from long-distance travel especially by air could affect both international and domestic travel.

xii
Statistics South Africa estimates total employment from tourism in South Africa at around 700 000, or 4,5% of all jobs in the country. The bulk of the jobs were in accommodation and catering, which generated 450 000 positions in 2017. Other tourism jobs were mostly in road transport and retail. Tourism accounted for less than a tenth of jobs in retail, however, and only just over a third of those in road transport and food services. For this reason, the analysis of resources available to workers in tourism focuses on workers in food service and accommodation.
Tourism contributed just under 3% of the GDP. Its comparatively larger share in total employment reflects the importance of labour-intensive activities in tourism. Since the 2010 World Cup, tourism employment has grown at the same rate as the rest of the economy.
Because of the importance of nature-based tourism in South Africa’s tourism profile, it was important in a number of rural areas with few other economic opportunities. Still, it was centred primarily in Cape Town, Durban and Johannesburg. Gauteng, KwaZulu-Natal and the Western Cape accounted for two thirds of employment in accommodation and food services.
In terms of resourcing, most tourism workers fell into the lower half of formal workers. Almost two thirds of employees in accommodation and food services are women, compared to two fifths of those in the rest of the formal sector. In 2017, their median income was R3200 a month; for men in the industry, it was R3800. In the informal sector of catering and accommodation, the median pay for women came to R2000 a month, compared to R2900 for men.
Catering and accommodation workers were less likely than other formal workers to have a retirement fund. In 2017, 40% of men and 35% of women in formal jobs in the industry had a pension or provident fund. Close to 80% of both men and women paid into the UIF, however, which was a somewhat higher share than in other formal industries.
In accommodation, workers’ education level was somewhat lower than the national norm. In food service, it was closer to the norm, as 45% of workers did not have matric, a similar number did, and the rest had some form of post-secondary education.
One in seven formal workers in the industry, both women and men, belonged to a union. Almost 70% said they were permanent, close was the norm for the formal sector, in 2017. In the informal sector, however, only between 20% and 30% of workers said they were had permanent positions. Formal catering and accommodation workers were substantially less likely than other formal workers to have vacation and family leave, however, although they were almost as likely as other formal workers to get paid sick leave, however.

1
Analysis of potential impacts and vulnerable groups in each value chain
1 Background and aims
This report provides a detailed analysis of each priority value chain in terms of climate-change related impacts and the capacity of vulnerable communities, workers and businesses. It incorporates initial interviews with key informants as well as drawing on the available data.
The report contributes to Sector Jobs Resilience Plans (SJRPs) by indicating both where developments warrant a programmatic response, and the needs of vulnerable groups as they seek a viable adjustment. Later milestones will build on this information to identify viable and effective programmes to mitigate the impacts of the climate crisis on employment in the selected value chains.
The report starts with a discussion of the approach used to evaluate vulnerability. It identifies four key dimensions: income and financial assets; physical assets; human capital; and social capital. It then presents findings on each value chain, indicating the following in each case.
Each value-chain analysis starts by describing the scope of the value chain and some key economic performance indicators. This makes it possible to explore potential impacts around climate change as well as to identify vulnerable groups within the value chain.
A second subsection reviews the risks faced from climate change as well as policies aimed at mitigating it. That in turn requires analysis of the potential impacts on the value chain and where in the value chain they are likely to materialise; when they are likely to materialise; and the number, nature and location of livelihoods that stand to be threatened as a result. In practice, it is often difficult to disentangle the effects of the climate crisis and associated policy decisions from other economic trends. Moreover, in many cases, the timing and in some cases the location of impacts proves difficult to define with any precision. As a result, a core focus of the SJRPs will be to anticipate and improve responses to changing conditions rather than providing fixed plans.
The final subsection identifies the vulnerable groups within the value chain and analyses their scope in responding to potential effects on their jobs and businesses. The next section discusses the approach used in this analysis.

2
2 Analysing vulnerability
Various approaches have emerged to analyse individual, group and community vulnerability in the face of crises, including climate change. Most of these research agendas centre on the effects of natural disasters. In contrast, the analysis here aims in most cases to understand the ability of the various groups to adjust to economic changes that result from longer term, often fairly gradual developments.
A critical review of various studies in South Africa (See to Gbetibouo and Ringler 2009; Fraser et al. 2011) suggested the following dimensions are critical at the individual, household and community level.
Financial resources are defined principally by earned income and savings, including access to retirement funds and insurance as well as financial investments.
Physical capital for most working class South Africans includes housing and infrastructure and in some cases cars. In farming areas, it may include access to land and water as well as investments in cattle, trees and other developments. For business, it may refer to equipment and buildings.
Human capital is used here in the sense of skills and education, but also relates to age and physical ability to work. In the case of small farmers, it may incorporate the number of family members able to farm.
Social capital refers to family and local networks as well as the ability to leverage rights as a worker and a citizen.
In practice, control over all these resources aligns largely not only with class but also with race and gender. Differences in resourcing by race and gender are indicated where relevant. In several cases, however, the vulnerable groups - for instance farmworkers and ordinary miners - include virtually no white people. Several value chains also employ very few women, as in the case of taxi drivers and miners.
In addition to individual and household resources, community resources depend both on access to funds and the nature and capacity of institutions. (See Fraser et al. 2011:3; Gbetibouo and Ringler 2009:10-11) These dimensions will be analysed in future reports as part of the process of developing policy proposals.
The various household surveys undertaken by Statistics South Africa help in providing a systematic overview of the resources of the various groups. They have been supplemented by interviews as well as academic research and policy papers. The following table indicates the relevant series from the Labour Market Dynamics and General Household Survey.

3
Table 1. Series from the Labour Market Dynamics 2017 and General Household Survey 2018 that relate to vulnerability
Dimension Labour Market Dynamics General Household Survey
Scope Individual workers by industry, region and income level
Households by region and income level
Financial Median income of employers and employees (due to steep inequalities in wages, the average overstates the norm for most groups)
Contribution to a retirement fund
Contribution to the Unemployment Insurance Fund (UIF), which acts as a form of savings in case of retrenchment
Household members’ ownership of bank accounts, investment accounts, informal savings accounts or pension funds
Household sources of income in addition to wages and business income, such as social grants, remittances and pensions
Physical Home and car ownership, including rough value of house and nature of tenure
Access to infrastructure by region
Ownership of land (including nature of tenure) and irrigation
Human Education level
Skills level (reflected in occupation)
Household size and number of other earners, if any
Disability
Social Union membership
Workplace power reflected in ability to claim rights under labour laws (written contract, leave) and whether get an annual increment as well as how pay is set
UIF membership (as a form of social insurance)
Whether have a partner or not
Access to social grants and other forms of social support
Access to cellphone, internet and media (radio and television)
Distance from amenities
Source: Statistics South Africa. Labour Market Dynamics 2017 and General Household Survey 2018. Interactive datasets. Downloaded from Nesstar facility at www.statssa.gov.za in September 2019.
Note: The General Household Survey does not provide information by industry but only by income level and region. Some of its findings may however be extrapolated to groups of workers based on their income level, education, gender and location.
4
3 The coal value chain
The coal value chain has been central to South Africa’s development, especially for energy, petro-chemicals and metals refineries, for over a century. The following facts underscore its importance for South Africa.
Coal fuels the bulk of South Africa’s current electricity generation supply.
Coal is the feed for liquid fuels and petrochemical production, which supplies a number of important downstream industries (notably the plastics, fertilizer and explosives industries) with key inputs for which there is limited domestic substitutes available.
The value chain is a substantial employer. Coal mining alone employed approximately 87 000 employees in 2018 (Coal Mining Matters, 2019). Eskom’s generation workforce employs over 12 000 employees (Eskom, 2018a). Sasol has approximately 26 000 workers in South Africa (Sasol, 2018). In aggregate, this presents a total estimate of 125 000 total jobs that stand to be directly or indirectly affected by a transition away from coal. Stakeholders are to provide further detailed information on the workers directly related to coal in overall coal value chain and electricity and petrochemical sub value chains.
The value chain is a substantial tax contributor. Sasol alone contributed R1,3 billion to the national fiscus in 2018. The coal mining industry paid R1,6 billion in royalties in 2018 (Coal Mining Matters, 2019).
The coal value chain, including coal mining, electricity generation, and petrochemical production, is highly localised to Mpumalanga. These economic activities are concentrated in a handful of municipalities in the province. Their economies are centred on coal, while adjacent economic activities such as retail, food and accommodation (beyond the coal value chain) are largely supported by coal value chain activities.
Based on these facts, climate change risks, whether initiated within the country or due to broader macroeconomic impacts, threaten the economic contributions of the value chain. While more powerful stakeholders such as mining firms, state-owned entities, and skilled workers, such as managers and engineers, may be able to withstand these shocks and find alternate employment, the most vulnerable in the value chain – miners and other low- or semi-skilled employees, small businesses in small mining towns that directly or indirectly rely on coal mining, and communities in these towns – could be devastated.
This risk is widely acknowledged in the coal transition literature. In other countries, such as the UK and Poland, that have reformed the coal sector, former coal mining towns still lag economically and socially as a result of insufficient support to these vulnerable groups. The economic impact on the affected mining towns is devastating compared to more diversified local economies, given that they have limited economic alternatives to coal mining (World Bank, 2018).
The literature on mine closure and coal transitions identifies certain mining town traits that exacerbate the socioeconomic impact of declining coal employment. The local economies where coal mining is concentrated in South Africa display these mix of traits. Specifically, these mining towns:
have a narrow economic base that is highly dependent on coal,
are isolated geographically to some degree,

5
have a coal mining “identity” where successive generations of coal miners tend to stay in coal mining, and where remuneration for working in the coal sector pays relatively well compared to other economic opportunities for the same level of education (World Bank, 2018).
This section first outlines the scope of the value chain in South Africa. It then indicates the likely impacts of climate change and measures to mitigate it. The final section identifies vulnerable groups within the value chain and their resources for responding to a downturn in coal.
3.1 Scope
The following figure illustrates the coal value chain in South Africa. It starts with coal, which is both consumed domestically and exported. Domestically, coal goes principally for generating electricity, for chemicals and liquid fuel production, and to metal refineries.
Figure 1. The coal value chain
Coal mining and electricity generation are concentrated in Mpumalanga, where 80% of the production of coal occurs. The eMalahleni (formerly Witbank) and Highveld coalfields account for 75% of coal production in South Africa (DoE, n.d.). Coal mining also occurs in Ermelo, which is in the Gert Sibande district municipality. The map below indicates the locations of the major producers of coal – Anglo, South32/BHP/SAEC, Exxaro, Glencore, and Sasol.

6
Figure 2. Location of coal mines, 2018
Source: Author, based on Google Maps and DMR
Coal is extracted via two methods – surface (opencast) and underground mining. In South Africa, approximately 51% of coal is mined underground, while the remaining 49% is mined via open-pit methods (DoE, n.d., p. 4). Surface mining is associated with comparatively lower capital expenditure, lower operating costs, higher efficiency in mineral extraction, and higher labour productivity. Underground mining in contrast generates higher employment but also has higher energy requirements and greater occupational/safety hazards. In evaluating the impact of climate change, it is important to identify which mines are the major employers, which would likely correspond to underground mining activities.
Around 40% of coal is exported directly by the mining companies. Almost two thirds of the rest are used for electricity generation, with Sasol accounting for close to a quarter. (Graph 1)
Graph 1. Downstream consumers of coal
Source: (DoE, 2018). Coal Resources – Overview. Accessed at http://www.energy.gov.za/files/coal_frame.html on 1 May 2019
7
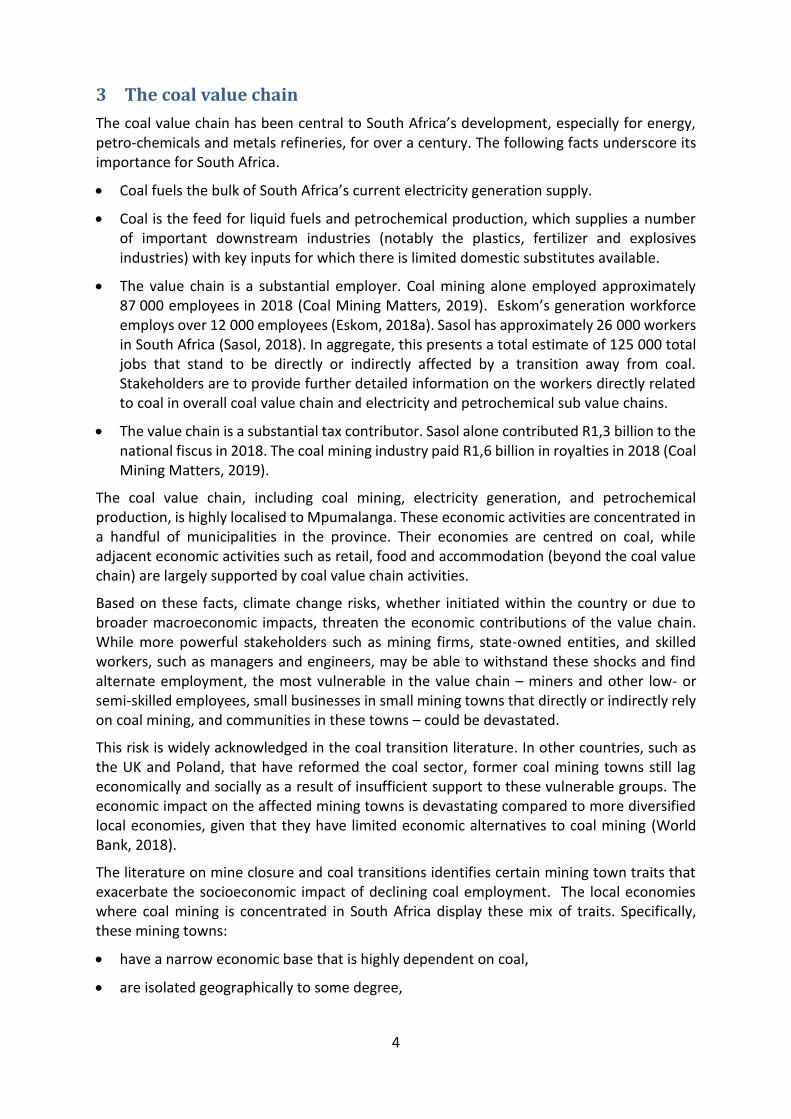
Most of Eskom’s coal-fired plants are located in Mpumalanga to be near the mines. (See Figure 3.) As a result, changes in demand for coal can affect employment and growth in these districts through downsizing in both mining and generation. The newest plant, Kusile, is located just outside of eMalahleni. One of its newer plants, Medupi, is close to more recently developed coal mines in Limpopo.
Figure 3. Location of Eskom plants by type
Source: (Eskom, 2018a). Integrated Annual Report 2018. Pp. 147. Accessed at http://www.eskom.co.za/IR2018/Documents/Eskom2018IntegratedReport.pdf on 19 April 2019
8
3.2 Major trends in the value chain
3.2.1 Sales, value add and exports
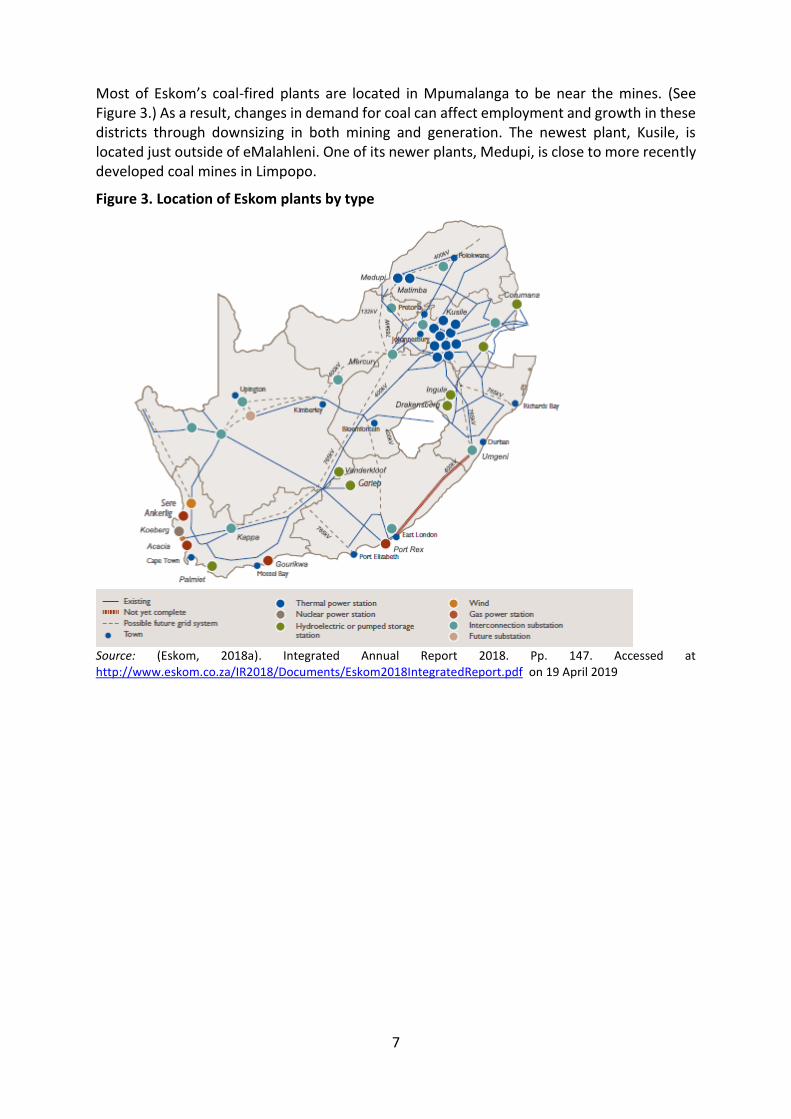
South African sales of coal are indicated below, in volume and value terms. Coal sales declined by approximately 4% between 2012 and 2017.
Graph 2. Production volume and value in thousands of current rand of coal, 2007 to 2017
Source: Calculated from(Minerals Council South Africa, 2018, p. 44). Accessed at https://www.mineralscouncil.org.za/ on 27 April 2019.
Exports of coal in constant rand terms have slowed since the end of the commodity boom, falling from average annual growth of 4,4% a year between 2002 and 2012 to just 1,8% a year from 2012 to 2018. In volume terms, however, the average annual rate of growth remained virtually unchanged at just under 1% a year from 2002 to 2018. As a result, the share of coal in South Africa’s total exports has remained essentially unchanged at around 7% (calculated from Quantec trade series at HS 6 digit).
Eskom’s sales have declined steadily in the past five years, as Graph 3 shows. The fall in electricity sales resulted from a number of factors. They include relatively slow economic growth in recent years as well as the closure of energy-intensive smelters as the price of electricity has increased rapidly in real terms, which also encouraged electricity efficiency by consumers. In addition, Eskom’s sales have been affected by a shift to renewable energy both on the national grid and off it. The largest declines in sales (in GWh) over the 2013/14-2017/18 period occurred amongst industrial consumers, who decreased electricity consumption by 12% (Eskom, 2018b).

9
Graph 3: Eskom electricity sales by consumer type (GWh)
Source: Eskom Annual Reports for relevant years.
3.2.2 Profitability
Profitability for coal mining can be assessed using figures for the gross operating surplus for the industry (see Graph 4). Between 2002 and 2011, surpluses in coal grew on the back of the global commodity boom, which saw high dollar prices for coal. After 2011, surpluses declined through 2015 and then recovered somewhat.
Graph 4. Gross operating surpluses in coal mining, 2002, 2008 and 2015 to 2017.
Source: Calculated from Quantec. EasyData. Interactive dataset. Downloaded from www.quantec.co.za in May 2019.
Eskom has faced substantial losses in the past two years. The losses arise fundamentally from its inability to manage down its costs as demand has declined (Eskom, 2018a). The process is however mediated by the fact that Eskom’s prices are set by a regulator, the National Energy Regulator of South Africa (Nersa). Nersa is legally required to set prices that permit an adequate rate of return if Eskom uses its resources efficiently. When the regulator finds that

10
Eskom could do more to cut costs, however, it can give Eskom less than it has requested, resulting in losses unless the National Treasury provides a cash injection of some kind, which diverts from other national priorities.
Graph 5. Eskom profits and losses, 2014 to 2018
Source: Calculated from Eskom Annual Integrated Reports (2015 – 2018)
Like Eskom, Sasol has seen a decline in production in recent years, as the following graphs show. In addition, it plans to shift from coal to gas, imported from Mozambique, in order to reduce its emissions intensity. Both of these trends are likely to reduce its demand for coal, should additional gas supply be secured and an effective regulatory framework implemented.
Graph 6. Sasol chemical sales
A. Base chemicals

11
B. Performance chemicals
Source: Sasol Integrated reports for relevant years.
3.2.3 Employment
The coal mining sector employed around 89 000 people in 2018, accounting for 20% of all mining jobs (Graph 7) Employment has been volatile since 2013, with a fall of around 15% between 2013 and 2016 followed by a recovery in the next two years.
Graph 7. Employment in coal mining, 2007 to 2018
Source: Calculated from MCSA. 2019. Page 13. Accessed at https://www.mineralscouncil.org.za/ on 17 October 2019.
In 2018, Eskom employed almost 50 000 workers, around 40% more than a decade earlier. Management argued that it was overstaffed by around 15 000 positions. Virtually all of the excess jobs were in distribution, customer and auxiliary services, with only 4% in generation (Calculated from Eskom 2018a, pp. 110-1)
Sasol employs around 30 000 workers directly in its international operations, of which approximately 26 000 are located in South Africa.
65,48470,791
74,02578,58
83,24488,039 86,106
77,747 77,25982,372
89,647
0
10
20
30
40
50
60
70
80
90
100
2008 2009 2010 2011 2012 2013 2014 2015 2016 2017 2018

12
3.2.4 Ownership and control
a. Coal mining
The coal mining industry is highly concentrated with a handful of firms sharing majority of the market. Five firms account for over 80% of coal capacity in the country – Anglo Coal, BHP Billiton/South32/SAEC, Sasol, Exxaro and Xstrata (Fossil Fuel Foundation, 2011, p. 33) A cluster of much smaller firms account for the rest of production. They include Optimum Coal, Umcebo Mining, Shanduka, Eyethu, Anker Coal, Coal of Africa, Eyesizwe Coal, Sudor Coal and Riversdale.
Graph 8. Coal Mining Market Shares by Capacity
Source: (Fossil Fuel Foundation, 2011, p. 33). Accessed at http://www.fossilfuel.co.za on 2 May 2019
b. Electricity and petrochemicals
The electricity and petrochemical sub-value chains are dominated by Eskom and Sasol respectively. Eskom’s electricity is mainly sold to municipalities, who in-turn sell electricity to households, businesses and the public sector. About 40% is sold directly to large industrial customers -mostly mines and metal refineries. Sasol owns its own coal mines that almost entirely supply its coal-to-liquids operations. It produces both liquid fuels and a diverse array of chemicals that form inputs to a variety of downstream markets, most notably plastics, fertilizer and explosives industries, as well as the basic and speciality chemicals industries. Sasol also exports basic and speciality chemicals regionally and internationally.
Anglo American, Exxaro Resources, Glencore and South32 together supply between 70% and 80% of Eskom’s coal consumption, which ranges between 106 and 120 million tonnes a year.
c. Coal transport
The means of transport used for coal largely depends on its destination. Only 10% of coal is transported by rail, mostly for export, while 60% is moved by conveyor systems to nearby electricity plants, and 30% is transported by road (Engineering News, 2019).
Engagements with coal transporters have revealed that the coal trucker market is segmented, with small, black, and sometimes female truck companies; larger trucking companies; and single-truck operators. Smaller truckers possess between 15 to 20 trucks per company, own a total of approximately 700 trucks, and focus exclusively on coal. A ratio of two drivers per

13
truck is preferred to operate an efficient fleet. Large trucking companies tend to have a fleet of a 100 trucks or more per company and own a total fleet of approximately 2000 trucks in total. Most transport coal along with other bulk commodities and other products. Not much is known about single truck operators but these tend to be entrepreneurs who only own one truck and access a lucrative contract. A single truck and tipping trailer costs in excess of R2 million and trucking companies also have to purchase land to park their trucks.
Figure 4. Market share of coal transporters
Representatives of the coal transporters estimated that they employ a total of approximately 4000 workers. That would give a ratio of almost six workers per truck and is likely overstated. Truck drivers are generally sourced from the locality and earn a total income of approximately R20 000 a month, of which R12 000 is taken home after the deduction of benefits such as UIF and pension. Truck drivers are required to have a Code 14 driver’s license and coal transporter’s prefer to have experienced drivers (over three years) as the insurance costs are lower. Beyond these requirements, truck drivers do not need to possess a specific level of education.
For power generation, there are two transport arrangements with Eskom. The first is a Free Carrier Arrangement (FCA) which involves transporters that are directly contracted to Eskom. Some 58 of these transporters were contracted under a four-year deal from 2014 to 2018. The other arrangement is referred to as Delivered (DEL), where the mines contract with transporters directly (IOL 2017).
Additional information will have to be derived from engagement with the relevant business associations and, if relevant, transport workers’ unions. The small size and limited capital of certain coal transporter segments makes them vulnerable to downsizing.
3.3 Impacts
This section outlines the likely impacts of climate change on the coal value chain and provide some indication of when they are to materialise. At the current stage interviews with informants are ongoing, which will provide further detail on the likely impacts, their timing and the extent of the employment threat.
1,2 million tonnes/month;
(17%)
6 million tonnes/month;
(83%)
Small coal transporters Large coal transporters

14
The table below provides a summary of the likely impacts considered in this section, the elements of the value chain that stand to be impacted, their likely probability and a provisional view on the expected timeframe.
Table 2. Potential impacts affecting the coal value chain
Risk Impact of value chain Proba-bility
Timeframe
Foreign policy risk: importers curb use of South African coal
High impact: Coal mining TFR (Transnet) Coal transporters Small Businesses RBCT Eskom (potential) Low impact: Sasol (self-owned mines)
High Longer term (> 10 years)
Foreign policy risk: global pressure
High impact: Coal mining Sasol Eskom TFR RBCT Coal transporters
Uncertain Longer term (>10 years)
Domestic market risk: consumers reduce demand for coal-based electricity through efficiency and renewables
High impact: Coal mining Eskom Coal transporters Small Businesses
High (already occurring)
Medium to long term (> 5 – 10 years)
Domestic policy risk: Lower carbon intensity in electricity generation
High impact: Eskom Coal transporters Small Businesses Coal mining
High Medium to long term (>5 – 10 years)
3.3.1 Coal importers reduce demand for coal by switching to alternate fuel options
Over the past decade, increasing attention has been placed on the deleterious impact of coal on the environment. Currently, there is a global shift away from coal that manifests acutely in the Western developed nations (World Bank, 2018). Developing nations such as China are also curbing emissions and that country has recently embarked on a cap-and-trade policy, which foresees reduced dependency on coal. Other emerging economies such as India, Pakistan, Bangladesh, Philippines, and Viet Nam appear to have favoured coal-based growth, primarily in electricity generation, to fuel their future economic growth.
Approximately 65% in volume terms of coal exported from South Africa in 2017 was exported to just three countries – India (44%), Pakistan (11%) and South Korea (10%) (Trade Map, 2018). In the short- to medium term, up until 2023, coal exports are forecast to remain fairly stable and possibly increase to these main export partners. While a number of domestic and broader macroeconomic impacts may affect the ability of South Africa to export to these countries in the future, an important determinant of future export demand depends on the national energy policy dynamics in these countries.

15
India is South Africa’s dominant export partner. While the Indian Government has committed to curbing thermal coal imports, it has proven slow in increasing domestic coal production and other generation activities, such as renewables. India’s thermal coal imports are therefore forecast to expand from 119 Mtce in 2017 to 135 Mtce in 2023 at an average annual growth rate of 2.2% (IEA, 2018).
Graph 9. Projected Indian imports and estimated South African share (a), 2016 to 2023, Mtce
Note: (a.) The five-year historic share (2014-2018) of South African thermal coal exports to India is assumed constant for the purposes of the analysis. This share amounts to approximately 16% of total thermal coal imports into India. Source: Calculated from IEA. IEA Coal forecast. 2019
Assuming the historic share of South Africa’s thermal coal exports as a proportion of India’s total imports in volume terms remains constant, South Africa’s exports to India are forecast to increase till 2023. This represents a volume increase of approximately 28% from 2016 to 2023. Despite this projection, the IEA has acknowledged considerable uncertainty around Indian imports, and policy measures shifting towards internal coal production may narrow import demand considerably.
Pakistan, which follows India as the second largest importer from South Africa, is also forecast to increase import coal demand until 2023. Strong growth in coal-fired power generation is expected to double Pakistan’s demand for coal from 12 Mtce in 2017 to 24 Mtce in 2023. With an ambitious coal build programme, the country will rely heavily on imported coal for up to one third of new capacity build after 2018. The remaining demand for coal is expected to be satisfied with domestic coal.
Finally, the Korean Government has embarked on an energy policy pathway that sees a limited future for coal and nuclear generation due to the environmental issues associated with these technologies. Thermal coal imports into Korea are projected to peak at 96 Mtce in 2020 and then to decline to 91 Mtce by 2023. A further threat to coal exports arises from new regulations that include a coal tax and a law that empowers local authorities to shut down highly polluting plants.
This picture does not point to pessimism in bulk of South Africa’s coal exports. Still, various factors may affect these projections:
16,3818,57 19,19 20,13 21,06
0
20
40
60
80
100
120
140
160
180
2016 2017 2019 2021 2023
Mtc
e
South African share

16
The government of India has committed to reduce thermal coal imports and this policy position still remains a goal of the state over the longer run. If it succeeds in growing domestic coal production, installing renewables capacity and improving generation efficiencies, coal export to India from South Africa are likely ultimately to decline some time beyond 2023.
Finance for coal projects globally are increasingly becoming difficult to access due to large financiers including donor funders, development banks and commercial banks begin to divert funds principally due to concerns about climate change but also because of its declining competitiveness with gas.
While the entire country has not become a member, in October 2018, the South Chungcheong province in Korea announced that it was joining the Powering Past Coal Alliance, which includes countries that pledge to end unabated coal-fired power by 2030. The province is currently the largest coal consumer in the Alliance. While Korea as a whole has not joined, it may soon do so, which would further jeopardise exports to that country.
3.3.2 International trade pressure
As a signatory to the 2015 Paris Agreement, South has committed to contributing its fair share in mitigating emissions of greenhouse gases through its committed Nationally Determined Contribution. A failure to transform the energy sector could, in the longer run, put the country at risk for trade barriers and even sanctions in the event that South Africa fails to meet its commitments to the Paris Agreement.
South Africa is simultaneously highly reliant on coal for electricity and in the production of liquid fuels and petrochemicals. Coal combustion is the largest contributing source of greenhouse gas emissions internationally in terms of its greenhouse gas emissions profile. According to the 2015 Greenhouse Gas Inventory for South Africa, fuel combustion activities have contributed 77.6% of the total emissions in the energy sector. The energy sector is the highest contributing source at 79.5% of the overall emissions in South Africa, pointing to the deleterious impact that coal combustion contributes.
If trade barriers were effected by trading partners in an effort to reduce GHG emissions, they would likely affect a wide range of South African products that use coal-based grid electricity, not just those directly related to coal. While the Paris Agreement itself does not include sanctions on the basis of a lack of mitigation or adaptation, trade risks beyond the Paris Agreement have emerged and are likely to intensify. For example, discussions in one of South Africa’s major export partners, the EU, are increasingly seeing momentum towards border carbon adjustments (Euractive, 2019; Government Europa, 2019).
3.3.3 Consumers reduce demand for grid-based, coal-fuelled electricity
With high and escalating tariffs, consumers have already begun to increase electricity efficiency, and rely more on alternative energy supply options such as natural gas for cooking, and renewable generation options such as solar. Switching consumers are likely to be those that can afford to. These customers have been cross-subsidising the poorer customers, and the switch to off-grid solutions places an additional burden on poorer consumers and Eskom.
Stagnant domestic demand for coal-based and grid electricity threatens Eskom, which is already plagued by high debt costs and excess capacity. In response, Eskom has argued that it cannot reduce its fixed costs and therefore must increase its tariffs to recoup them. As a

17
result, it has requested price increases at around twice the rate of inflation for the coming two years. This trend is likely to see even further declines in demand for grid electricity. That would ultimately accelerate plant closures and job losses both in Eskom and in its coal suppliers.
3.3.4 Domestic energy policy turns away from coal
Due to evolving energy policy, reduced planned investments in coal power station infrastructure reduces the future demand for coal for electricity generation, which is the primary consumer of coal domestically. The independent coal power stations, Thabametsi and Khanyisa projects, planned for completion in 2023/24, and included in the latest August 2018 draft iteration of the Independent Resource Plan, are already under threat with major commercial banks withdrawing their funding support from these projects. Other policy measures such as carbon taxes, which in the current phase are lenient but may escalate in later phases, also stand to impact on coal demand through inflationary impacts on electricity generation, chemicals production and other energy-intensive products.
3.3.5 Outcomes
All of these impacts effectively reduce domestic or export demand for South African coal producers, although the timeframes remain somewhat unclear. That in turn would likely lead to job losses along the value chain, especially in mining but potentially also in Transnet and Eskom.
Export demand is especially important for the South African coal mining industry because it generates a disproportionate share of its profits, since exports involve higher grades and higher-margin coal. Exports constitute approximately 50% of coal revenues, although they only account for approximately 30% of exports in volume terms.
Reduced coal sales, whether domestic or foreign, would impact heavily on South African coal miners and the effects will ripple throughout the value chain. A global decline in coal demand or reduced purchases by Eskom would in turn squeeze investments and jobs in coal mining and the associated communities and suppliers. Falling exports could also increase prices for domestic coal consumers, which in turn would likely lead to higher electricity prices and might also squeeze Sasol and downstream chemicals producers’ profits through rising energy costs.
The immediate impacts of a decline in coal production and/or coal-based electricity will be felt by the most vulnerable in the value chain. Communities and municipalities that are highly dependent on coal mining and on Eskom plants, such as eMalahleni in Mpumalanga, stand to be severely hit with rising unemployment and reduced economic activity.
Reduced demand for coal exports will also affect Transnet, which provides the rail and ports infrastructure for the transport of coal. If these infrastructure assets cannot be readily mobilised for alternate economic activities, Transnet stands to be stranded with assets that cannot generate a return on investment, reducing its profitability and potentially leading to higher costs for its other customers.
18
3.4 Vulnerability Analysis
3.4.1 Affected municipalities
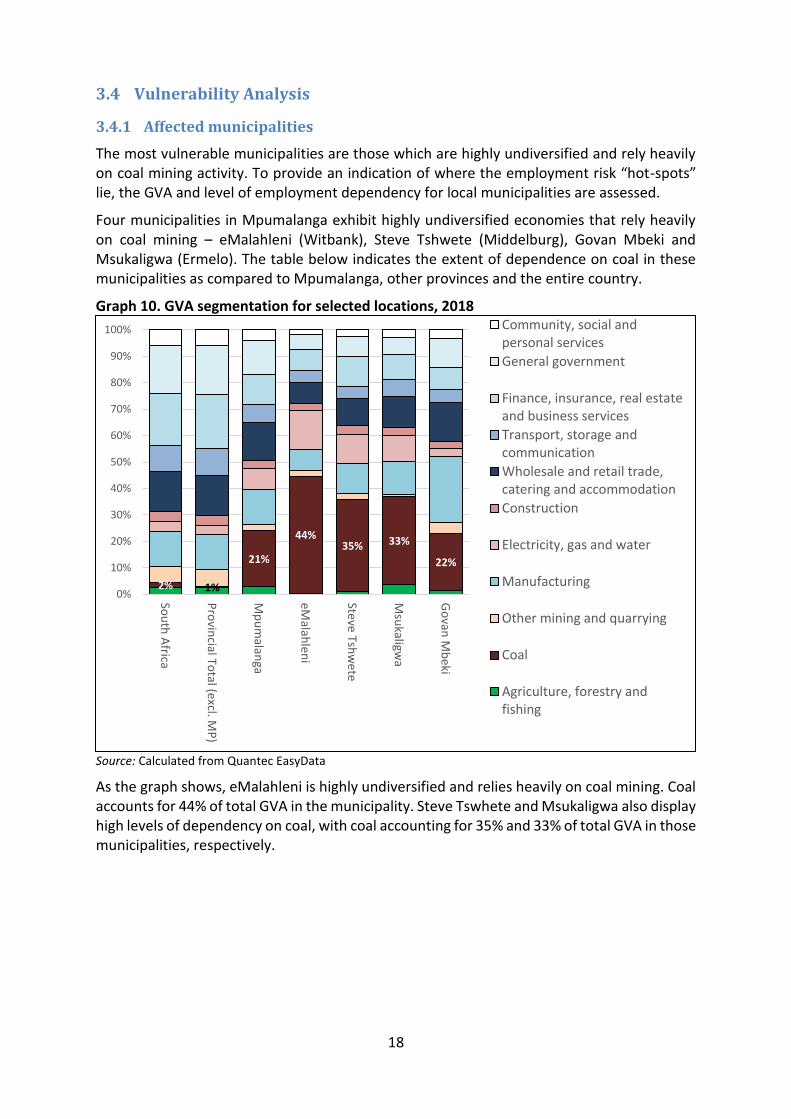
The most vulnerable municipalities are those which are highly undiversified and rely heavily on coal mining activity. To provide an indication of where the employment risk “hot-spots” lie, the GVA and level of employment dependency for local municipalities are assessed.
Four municipalities in Mpumalanga exhibit highly undiversified economies that rely heavily on coal mining – eMalahleni (Witbank), Steve Tshwete (Middelburg), Govan Mbeki and Msukaligwa (Ermelo). The table below indicates the extent of dependence on coal in these municipalities as compared to Mpumalanga, other provinces and the entire country.
Graph 10. GVA segmentation for selected locations, 2018
Source: Calculated from Quantec EasyData
As the graph shows, eMalahleni is highly undiversified and relies heavily on coal mining. Coal accounts for 44% of total GVA in the municipality. Steve Tswhete and Msukaligwa also display high levels of dependency on coal, with coal accounting for 35% and 33% of total GVA in those municipalities, respectively.
2% 1%
21%
44%35% 33%
22%
0%
10%
20%
30%
40%
50%
60%
70%
80%
90%
100%
Sou
th A
frica
Pro
vincial To
tal (excl. M
P)
Mp
um
alanga
eMalah
leni
Steve
Tshw
ete
Msu
kaligwa
Go
van M
beki
Community, social andpersonal services
General government
Finance, insurance, real estateand business services
Transport, storage andcommunication
Wholesale and retail trade,catering and accommodation
Construction
Electricity, gas and water
Manufacturing
Other mining and quarrying
Coal
Agriculture, forestry andfishing

19
Case: Eskom Hendrina Power Station1
Hendrina Power Station, along with the Komati and Grootvlei power stations, is one of the first that will be decommissioned due to age. It came into operation between June 1970 and December 1976. It is located 40km south of Middelburg in Mpumalanga. With the first four out of ten generation units already being switched off, the remaining units are expected to go offline over between 2020 and 2025.
Decommissioning is expected to lead to job losses for lower level staff. Eskom is expected to provide social and labour plans for workers in these circumstances, but details are not available.
The plant employs approximately 500 permanent workers. Approximately 40% of the workforce at the power station is semi-skilled. These occupations mostly cover plant operators and maintenance staff. In terms of recruitment requirements, these workers are only required to have a grade 10 education and are trained by Eskom to perform in their roles. Managements seeks to source workers within an approximate radius of 50km. Workers tend to come from Pullenshope (13%), Hendrina (10%) and Middelburg (52%) (KPMG, 2017).
The plant also employs around 500 contractors. Contractors tend to have links to the local communities as formal businesses sub-contract informally to people from the community. Contractors are vulnerable in that they are not Eskom employees, which means they do not get a retrenchment package or benefit from other measures designed to shield workers who lose their jobs.
The impact of the closure will go far beyond the direct job losses. KPMG undertook a study in 2017 on the contribution of the Hendrina power station to the local economy. KPMG estimated the total impact on jobs from Hendrina at 6085, which accounted for 6.5% of employment in the municipality. The power station was estimated to support approximately 10 000 jobs indirectly in Mpumalanga, and contribute R1,3 billion to households in the province (KPMG, 2017).
1 Information in this section is from a site visit and interviews with management in October 2019 unless otherwise noted.

20
The area was already affected heavily by the retrenchment of some 400 workers that were employed at the adjacent Optimum Mine, which stopped operating when it went into business rescue. The closure was partly offset since trucked-in coal replaced the supply to Hendrina via conveyor belt, increasing the use of coal truckers. In busy times, coal deliveries can peak at 230 deliveries per day.
Still, unemployment in the surrounding communities creates an environment of pessimism, where community members feel that there are limited economic opportunities in the area. Small businesses argue that Eskom should assist them, but Eskom managers noted they also priced goods and services exorbitantly in order to win a once-off lucrative tender, so they were often turned away.
The environment of unemployment is further demonstrated by informal congregations of low-skilled job-seekers that gather at the entrance of the power station seeking work from time to time when news spreads that the power station needs maintenance or repair work. These workers are typically turned away. That does not, however, stop them from collecting there. Eskom management believes that many of these job-seekers originate from outside of the municipality.
KPMG also found that the Hendrina power station contributed R2 billion to the municipal GDP, accounting for 4.3% of municipality GDP. Eskom provides the community with a landfill site as well as water and sanitation services. The municipality is unable to afford these costs and once the Hendrina power station is decommissioned, it is unclear who will fund these public services.
In addition, Eskom owns the only petrol station and store in the locality, which farmers, small businesses and the general community rely on. It is unclear as to who will fund and own this infrastructure once the power station is decommissioned.
While the decommissioning of the power station is not a result of climate change,2 Eskom’s plans to cushion the workforce is instructive for the SJRPs. Based on interactions with managers at the site visit, employees that are up for promotion to other plants will be promoted and relocated to those plants. Those that do not fit into that category and are not near retirement will be redeployed to the new coal plants – Medupi and Kusile. Finally, those workers that are close to retirement will be provided with an early retirement package.
Alternate economic opportunities for current plant workers and the unemployed have been identified in the circular economy, where spent ash that is combusted in power stations and stacked in mounds may yield future employment opportunities. In theory, fly ash can be recycled to produce cement, and bottom ash can be used to produce bricks. Despite a lot of interest and research in these opportunities, the present barriers to the economic viability of these processes are the distance (and associated transport costs) to centres of demand for products and the current regulations around waste in the Waste Act, which in the view of the industry at least prevent use of by-products from mine dumps.
Measures of employment also reflect these municipality dynamics. Based on employment, the smaller local municipalities where coal activity occurs exhibit high dependencies on coal
2 The closure of Hendrina is motivated by economic reasons. Specifically, the power station is old and utilises spares and parts that are becoming increasingly
difficult to procure due to their obsoleteness. Further, extending the life of the plant in line with safety standards would require significant investment into the
power plants which are not economically viable for Eskom.

21
for employment. In eMalahleni, Steve Tshwete, Msukaligwa and Govan Mbeki, coal employment accounts for 26%, 17%, 14% and 11% respectively. In absolute terms, employment in these four local municipalities account for approximately 76% of total employment in coal in the country. What emerges from this analysis are four municipalities that require close scrutiny with respect to the impact that negative coal dynamics will have on the. eMalahleni is most at risk, followed by Steve Tshwete, Msukaligwa and Govan Mbeki.
Similar dynamics also emerge around employment in these municipalities, which disproportionate direct dependence on employment in coal mining. In eMalahleni, Steve Tshwete, Msukaligwa and Govan Mbeki, coal employment accounts for 26%, 17%, 14% and 11% respectively. In absolute terms, employment in these four local municipalities accounts for approximately 76% of all coal jobs in the country. What emerges from this analysis are four municipalities that require close scrutiny with respect to the impact that negative coal dynamics will have on them. Most at risk is eMalahleni, followed by Steve Tshwete, Msukaligwa and Govan Mbeki.
Graph 11. Employment by industry in selected municipalities, 2018
Source: Calculated from Quantec EasyData
In moving the vulnerability analysis forward, we focus on three heavily affected groups – workers, small businesses, and communities.
Workers relate to employees directly employed in the coal value chain. In the upstream, the largest direct employers are coal mining firms, Eskom and Sasol.
Small businesses refer to those businesses that are direct participants in the coal value chain. Direct participants may appear throughout the value chain and include businesses that supply goods and services to coal mines, Eskom, Sasol, Transnet, and Richard’s Bay Coal Terminal, among others. To identify and assess the size and nature of these
1% 0%
8% 26% 17%
14%
11%
0%
10%
20%
30%
40%
50%
60%
70%
80%
90%
100%
Sou
th A
frica
Pro
vincial to
tal (Excl. MP
)
Mp
um
alanga
Emalah
len
i
Steve Tshw
ete
Msu
kaligwa
Go
van M
beki
Community, social andpersonal servicesGeneral government
Finance, insurance, real estateand business servicesTransport, storage andcommunicationWholesale and retail trade,catering and accommodationConstruction
Electricity, gas and water
Manufacturing
Other mining
Coal
Agriculture, forestry andfishing

22
businesses involves accessing the correct data from the principal stakeholders. The analysis for this section will be updated once this data is received from stakeholder and informant interviews, specifically from mining firms, Sasol, Eskom, Transnet and chambers of commerce.
Finally, communities refer to residents of mining towns that are impacted indirectly. These include the partners and families of workers in the coal value chain; informal and formal businesses that provide goods and services to workers, managers and their families. These businesses can include food, accommodation, and other retail services that cater to the population of the small mining towns.
There are around 200 small coal transporting enterprises who collectively appear to employ between 2000 and 4000 workers. The group is far too small to appear in national household surveys, so they are not analysed here. If downsizing meant that owners had to find new opportunities, coal trucks can in theory either transport other types of bulk commodities such as iron ore or manganese or, if repurposed, bulk goods and groceries or even liquid fuels. The small coal transporters do not currently transport other bulk commodities or other goods as they regard these markets as highly competitive and argue that potential customers are already “blocked off” by larger trucking companies. In addition, the cost of switching to these alternatives is often substantial. Repurposing the truck to a flat bed, capable of transporting goods like cement. costs in the region of R200 000 – R300 000 per truck, while converting a truck to transport liquid fuels is substantially higher, on the order of millions, due to the safety and hazard requirements.
In the final draft, more information will be provided on population of the mining towns in terms of their skill levels, age and assets, drawing principally on the 2016 Community Survey. The Community Survey covers most of the issues in the General Household Survey but used a larger sample, so it provides more detail on municipalities.
3.4.2 The extent of vulnerability
To develop and tailor employment mitigation plans for the identified impacts requires an understanding of the resources as well as the needs of the most vulnerable. Profiling these stakeholders allows for a more specific and practical assessment of who they are and what they need. Once these are assessed, the implementation plans can then be constructed to shield them as far as possible. As noted above, this section will review the resources of those affected in terms of their financial, social, and human capital assets.
Vulnerability is highly affected by gender. In the event, the value chain has not provided many opportunities for women. Coal and gold mining have the lowest proportion of women employees of any major South African industry. Women account for approximately 13% of total coal employment and tend to be in professionally qualified and middle management or in skilled technical professions, rather than in production or senior management positions (Minerals Council South Africa, n.d.). The gender dimension in coal employment is acknowledged in the international transition literature. Some programmes focus only on miners, excluding “above-ground” (generally women) (World Bank, 2018).

23
Graph 12. Gender distribution of employment in coal compared to other industries, 2017
Source: Calculated from Statistics South Africa. Labour Market Dynamics 2017. Electronic dataset. Downloaded from Nesstar facility at www.statssa.gov.za in September 2019.
Downstream industries such as electricity generation and petroleum and basic chemicals have somewhat higher shares of women workers than coal mining, at 25% and 31% women respectively. Despite a higher proportion of women in these downstream industries, the figure is still lower than in the rest of the economy.
3.4.3 Financial Capital
In terms of financial resources, workers in the coal value chain typically compare well with other formal workers, especially in light of relatively low levels of formal qualifications. In 2017, as Graph 13 shows, median pay along the coal value chain was substantially higher than in most of the rest of the formal economy. In coal mining, the median pay was over R10 000 a month, compared to just over R5000 for other formal workers. Women lagged far behind in coal, however, as the median wage for men was approximately R12 000 per month, compared to only R8 000 per month for women. In the electricity industry, median pay was closer to R15 000 a month, and the disparity between men and women diminished. In petroleum and basic chemicals, women actually earned more than men and the median monthly pay was also around R10 000.
43%
11%21% 25%
10% 12%31%
22%14% 11%
35%
0%
10%
20%
30%
40%
50%
60%
70%
80%
90%
100%
Sou
th A
frica
No
nferro
us m
inin
g
Iron
ore
Electricity generatio
nan
d d
istribu
tion
Go
ld m
inin
g
Co
al
Pe
troleu
m an
d b
asicch
emicals
Mach
inery an
d cap
italeq
uip
men
t
Me
tals
No
nm
etallic m
inerals
man
ufactu
ring
Agricu
lture
Men Women

24
Graph 13. Coal value chain monthly earnings compared to formal workers in other sectors
Source: Calculated from Statistics South Africa. Labour Market Dynamics 2017. Electronic dataset. Downloaded from Nesstar facility at www.statssa.gov.za in September 2019.
Some 80% of workers in the coal value chain had retirement funds in 2017. That compared to less than 60% of other formal workers. The gender disparity in this regard was small.
Graph 14. Percentage of employees that make contributions toward retirement funds
Source: Calculated from Statistics South Africa. Labour Market Dynamics 2017. Electronic dataset. Downloaded from Nesstar facility at www.statssa.gov.za in September 2019.
-
5 000
10 000
15 000
20 000
25 000
30 000
35 000
30th
per
cen
tile
Med
ian
80
th p
erce
nti
le
30
th p
erce
nti
le
Med
ian
80
th p
erce
nti
le
30
th p
erce
nti
le
Med
ian
80
th p
erce
nti
le
30
th p
erce
nti
le
Med
ian
80
th p
erce
nti
le
Coal Electricitygeneration and
distribution
Petroleum andbasic chemicals
Other sectors
Ran
ds
Men Women
0%
10%
20%
30%
40%
50%
60%
70%
80%
90%
100%
Coal Electricity Petroleum andbasic chemicals
Other sectors
Men Women

25
The percentage of employees that contribute towards unemployment insurance provides a final indicator of the protection of employees in case of dismissal. Relative to the rest of the economy, the coal value chain has a greater level of participation in the UIF than the rest of the economy across genders (particularly for coal mining an electricity generation and distribution). Again, the gender disparity is small.
Graph 15. Percentage of workers contributing to UIF
Source: Calculated from Statistics South Africa. Labour Market Dynamics 2017. Electronic dataset. Downloaded from Nesstar facility at www.statssa.gov.za in September 2019.
3.4.4 Human Capital
The skills mix in the coal value chain differs from the rest of the economy. It is characterized by a relatively high reliance on semi-skilled workers, with fewer unskilled and skilled workers. According to Quantec data, 90% of those employed in the coal industry in Mpumalanga are semi-skilled (74%) or low-skilled (17%) workers3.
3 This information is based on labour data in South African the Quarterly Employment Statistics (QES) and the Quarterly Labour Force Survey (QLFS) published by Statistics South Africa (Stats SA). It used the standard international categorisations. Skilled employment consists of: professional; semi-professional and technical occupations; managerial, executive and administrative occupations; and certain transport occupations, e.g. pilot navigator. Semi-skilled employment consists: clerical occupations; sales occupations; transport, delivery and communications occupations; Services occupations; Farmer and farm managers; artisan, apprentice and related occupations; and production foreman and production supervisor. Low-skilled employment consists of: Low skilled employment consists of: elementary workers; domestic workers; and all occupations not elsewhere classified.
0%
10%
20%
30%
40%
50%
60%
70%
80%
90%
100%
Coal Electricity Petroleum andbasic chemicals
Other sectors
Men Women
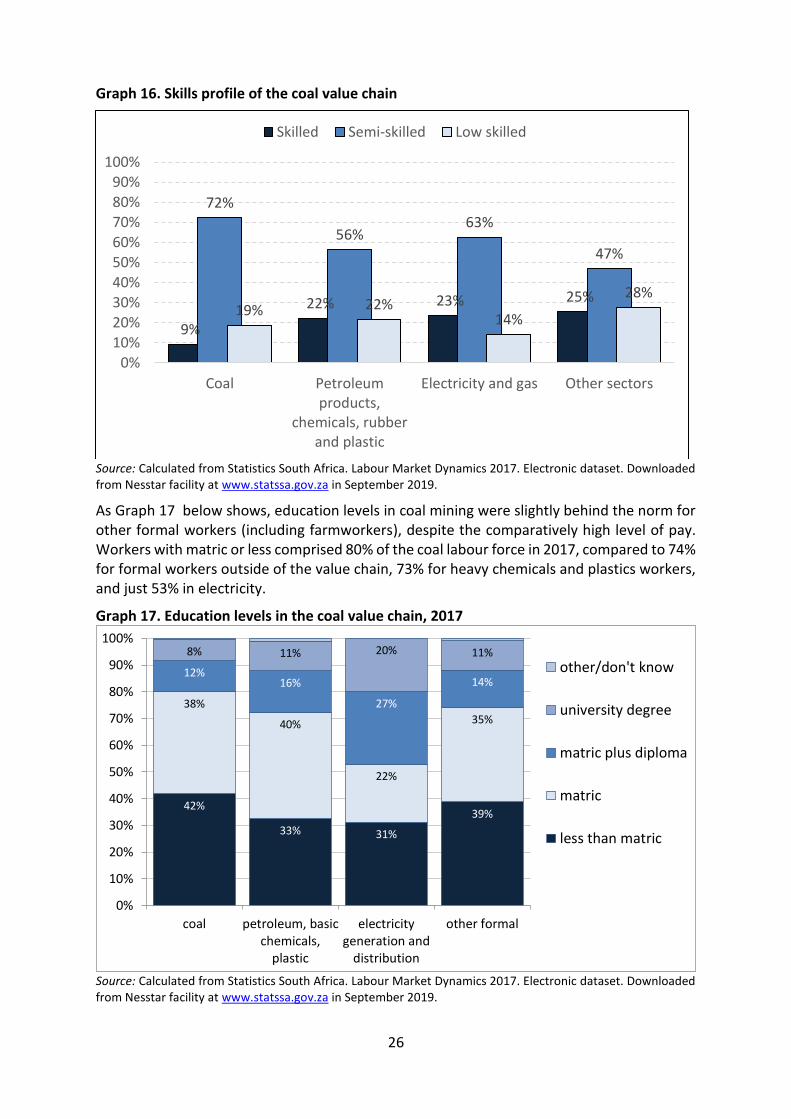
26
Graph 16. Skills profile of the coal value chain
Source: Calculated from Statistics South Africa. Labour Market Dynamics 2017. Electronic dataset. Downloaded from Nesstar facility at www.statssa.gov.za in September 2019.
As Graph 17 below shows, education levels in coal mining were slightly behind the norm for other formal workers (including farmworkers), despite the comparatively high level of pay. Workers with matric or less comprised 80% of the coal labour force in 2017, compared to 74% for formal workers outside of the value chain, 73% for heavy chemicals and plastics workers, and just 53% in electricity.
Graph 17. Education levels in the coal value chain, 2017
Source: Calculated from Statistics South Africa. Labour Market Dynamics 2017. Electronic dataset. Downloaded from Nesstar facility at www.statssa.gov.za in September 2019.
9%
22% 23% 25%
72%
56%63%
47%
19% 22%14%
28%
0%
10%
20%
30%
40%
50%
60%
70%
80%
90%
100%
Coal Petroleumproducts,
chemicals, rubberand plastic
Electricity and gas Other sectors
Skilled Semi-skilled Low skilled
42%
33% 31%
39%
38%
40%
22%
35%
12%16%
27%
14%
8% 11% 20% 11%
0%
10%
20%
30%
40%
50%
60%
70%
80%
90%
100%
coal petroleum, basicchemicals,
plastic
electricitygeneration and
distribution
other formal
other/don't know
university degree
matric plus diploma
matric
less than matric

27
The relatively high pay for coal miners with secondary education or less makes it difficult for them to find equivalent employment if they are retrenched. In 2017, the median earnings for coal miners with matric or less was more than twice as high as for other workers with the same formal education. (Calculated from Statistics South Africa 2017)
3.4.5 Social Capital
This section reviews social capital as reflected in the available indicators, in particular union membership and employment relations. Additional information will be included in the final draft on community networks in the main coal-mining towns.
Workers in the coal value chain, as in heavy industry in general, have a high level of union membership compared to other formal workers. Mining is particularly well organised, which in part explains why pay has improved rapidly over the past two decades. Over 70% of employees are union members, which is around twice the average for the formal economy. The share falls to 67% in electricity and around 45% in petrochemicals.
Graph 18. Percentage of employees that belong to a union, 2017
Source: Calculated from Statistics South Africa. Labour Market Dynamics 2017. Electronic dataset. Downloaded from Nesstar facility at www.statssa.gov.za in September 2019.
The data also allow for an evaluation of workplace relationships. The figures below represent the permanency of employment, the number of hours worked in a week, the incidence of formal written contracts, and the incidence of benefits such as paid vacation leave and maternity/paternity leave.
Workers in the coal mining value chain are less likely to report that they have temporary status than those the rest of the formal economy. The mines themselves, however, report somewhat higher shares of contract workers, who may see themselves as permanent nonetheless. Still, the fact that workers see themselves as permanent both underscores their dependence on the job, and their perception that they have a comparatively stable position in the workplace.
0%
10%
20%
30%
40%
50%
60%
70%
80%
90%
100%
Coal Electricity Petroleum andbasic chemicals
Other sectors
Men Women

28
Figure 5. Percentage of employees that reports having a permanent position, 2017
Source: Calculated from Statistics South Africa. Labour Market Dynamics 2017. Electronic dataset. Downloaded from Nesstar facility at www.statssa.gov.za in September 2019.
The law requires that all employees have a written contract and be granted paid vacation and family leave. Again, almost all workers in the coal value chain – in contrast to many farm and retail employees as well as all self-employed people – in fact get these conditions, as the following graphs show.
81%
90%
82%
71%
81%87%
91%
69%
0%
10%
20%
30%
40%
50%
60%
70%
80%
90%
100%
Coal Electricity Petroleum and basicchemicals
Other sectors
Men Women

29
Graph 19. Share of workers in the coal value chain who say they get basic conditions of employment, 2017
A. Written contract
B. Paid vacation leave
99% 99% 98%
89%96% 99% 98% 95%
0%
10%
20%
30%
40%
50%
60%
70%
80%
90%
100%
Coal Electricity Petroleum and basicchemicals
Other sectors
Men Women
74%
89%84%
67%
85% 82%87%
67%
0%
10%
20%
30%
40%
50%
60%
70%
80%
90%
100%
Coal Electricity Petroleum andbasic chemicals
Other sectors
Men Women

30
C. Maternity/paternity leave
Source: Calculated from Statistics South Africa. Labour Market Dynamics 2017. Electronic dataset. Downloaded from Nesstar facility at www.statssa.gov.za in September 2019.
81%89% 87%
64%
87%91%
85%
71%
0%
10%
20%
30%
40%
50%
60%
70%
80%
90%
100%
Coal Electricity Petroleum andbasic chemicals
Other sectors
Men Women

31
4 The metals value chain
The transition to a low-carbon world will reshape the metals value chain, from shifting demand for specific metals to the methods of production to access to essential inputs, such as energy and water. South Africa’s metals value chain developed on the back of cheap, coal-based electricity supply. Eskom’s top energy-intensive users are essentially mining and large mineral processing industrial giants. The Energy Intensive Users Group of Southern Africa, which comprises 28 companies in the fields of mining, minerals beneficiation and materials manufacturing, consumes more than 40% of the country’s electricity. Some activities, such as primary steelmaking, are moreover inherently carbon-intensive (due to the chemical reactions at play), generating a large amount of process GHG emissions as a result of their production process.
While this research aims to analyse climate-change related dynamics impacting the metals value chain, the impacts of the climate crisis cannot be fully isolated from other factors at play in the value chain. Some industries, such as gold mining, are for instance on the decline in South Africa due to factors beyond climate change (the maturing of the gold mines in this case). Others face a cyclical downturn as a result of global dynamics (notably the end of the commodity boom combined with an oversupply of steel and aluminium from China), and will likely recover in the medium term.
4.1 Scope
South Africa’s metals value chain consists of a diversity of sub-value chains structured around particular mineral ores and metals production. While they follow a common structure from mining to beneficiation and fabrication, depicted in Figure 6, they vary in size, scope and nature, essentially depending on the characteristics of mining and manufacturing (beneficiation) activities and the extent to which they take place in South Africa or outside the country.
Figure 6. South Africa’s metals value chain
Key differences are:
Local mining (most value chains) vs imported ore (alumina from Australia).
Opencast (iron ore, manganese) vs underground (PGMs, gold) mining, which has key implications for energy consumption as well as employment characteristics. Underground mines rely heavily on electricity while opencast mines have a higher reliance on petroleum

32
(essentially diesel) due to the use of trucks. As noted in the section on coal, underground mining is generally more labour- and skills-intensive than opencast mining.
Local vs foreign beneficiation and fabrication. While all ores mined in South Africa undergo a degree of local beneficiation, a large share of the fabrication occurs outside of the country, highlighting the key role of export markets.
Precious (gold, PGMs) vs bulk commodities (iron ore, manganese, copper). While freight costs are critical for bulk commodities, they are a marginal issue for precious metals.
The main metals sub-value chains4 in South Africa are:
The PGMs value chain: an extensive value chain from mining and refining (for domestic use and exports), to the fabrication of catalytic converters and other PGM-based products;
The gold value chain: an extensive value chain from mining, to refining, to manufacturing;
The iron and steel value chain: an extensive value chain from iron ore and manganese mining, to local steelmaking for domestic use and exports (both primary and secondary production), to the manufacturing of steel products and ferroalloys (ferrochrome and ferromanganese essentially);
The aluminium value chain: a manufacturing value chain from smelting (based on alumina imported from Australia for primary production as well as scrap for secondary production) to the manufacturing of aluminium product for construction and general use.
4.2 Major trends in the value chain
4.2.1 Production
At the mining stage, South Africa’s metals value chain is heavily dominated by a limited group of ores, namely gold, PGMs, iron, manganese and chrome. Table 3 lists South Africa’s reserves and production of key minerals. South Africa is in a quasi-monopolistic position for the production of PGMs, holding more than 90% of global reserves. The country also disposes large amount of chrome and manganese and is part of a small oligopoly of countries. In addition, South Africa is a key player in the production of zirconium, vanadium and titanium. While historically leading gold production, declining reserves have pushed South Africa to a second-tier producer.
4 Value chains associated with non-metallic products, such as energy (coal, oil, gas), precious stones (diamonds) and industrial minerals (sand, lime, etc.), are excluded from the scope of analysis. Fossil fuels, i.e. coal, oil and gas, are covered in part in Section 0 (on the coal value chain) and Section 4 (on the petroleum-based road transport value chain).
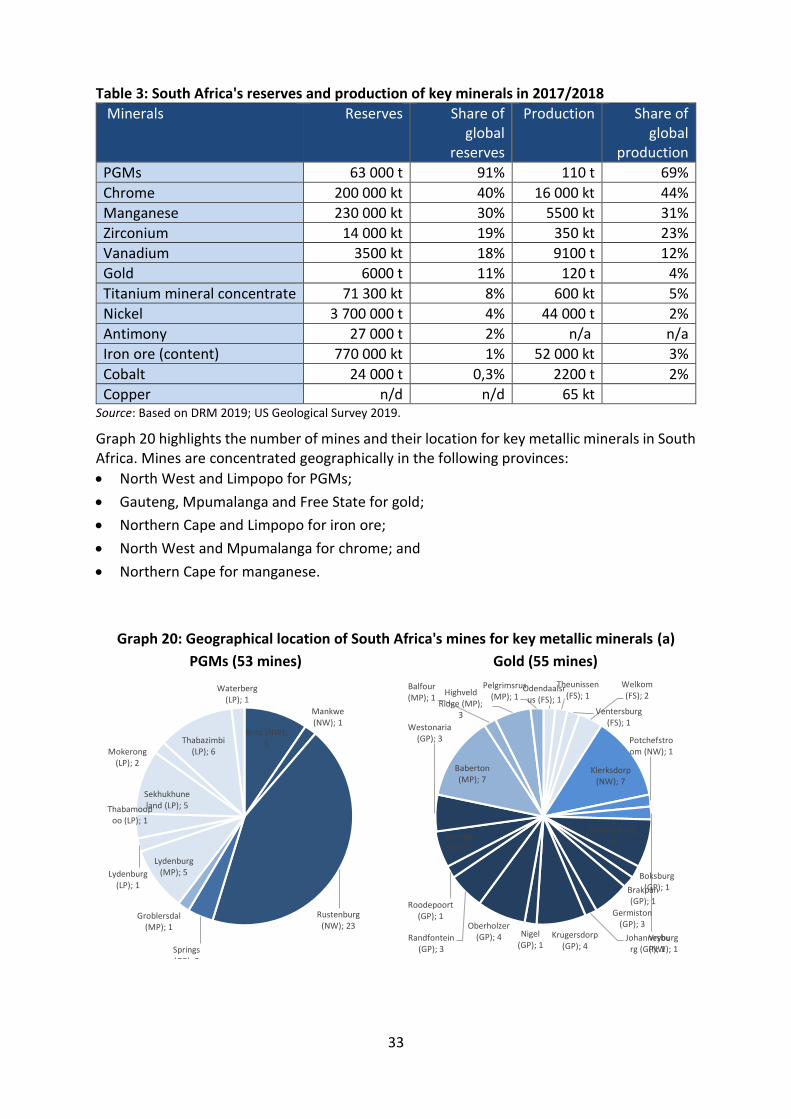
33
Table 3: South Africa's reserves and production of key minerals in 2017/2018
Minerals Reserves Share of global
reserves
Production Share of global
production
PGMs 63 000 t 91% 110 t 69%
Chrome 200 000 kt 40% 16 000 kt 44%
Manganese 230 000 kt 30% 5500 kt 31%
Zirconium 14 000 kt 19% 350 kt 23%
Vanadium 3500 kt 18% 9100 t 12%
Gold 6000 t 11% 120 t 4%
Titanium mineral concentrate 71 300 kt 8% 600 kt 5%
Nickel 3 700 000 t 4% 44 000 t 2%
Antimony 27 000 t 2% n/a n/a
Iron ore (content) 770 000 kt 1% 52 000 kt 3%
Cobalt 24 000 t 0,3% 2200 t 2%
Copper n/d n/d 65 kt Source: Based on DRM 2019; US Geological Survey 2019.
Graph 20 highlights the number of mines and their location for key metallic minerals in South Africa. Mines are concentrated geographically in the following provinces:
North West and Limpopo for PGMs;
Gauteng, Mpumalanga and Free State for gold;
Northern Cape and Limpopo for iron ore;
North West and Mpumalanga for chrome; and
Northern Cape for manganese.
Graph 20: Geographical location of South Africa's mines for key metallic minerals (a)
PGMs (53 mines) Gold (55 mines)
Brits (NW); 5
Mankwe (NW); 1
Rustenburg (NW); 23
Springs (GP); 2
Groblersdal (MP); 1
Lydenburg (MP); 5Lydenburg
(LP); 1
Mokerong (LP); 2
Sekhukhuneland (LP); 5Thabamoop
oo (LP); 1
Thabazimbi (LP); 6
Waterberg (LP); 1
Odendaalsrus (FS); 1
Theunissen (FS); 1
Ventersburg (FS); 1
Welkom (FS); 2
Klerksdorp (NW); 7
Potchefstroom (NW); 1
Vryburg (NW); 1
Benoni (GP); 4
Boksburg (GP); 1Brakpan
(GP); 1
Germiston (GP); 3
Johannesburg (GP); 1
Krugersdorp (GP); 4
Nigel (GP); 1
Oberholzer (GP); 4Randfontein
(GP); 3
Roodepoort (GP); 1
Springs (GP); 3
Westonaria (GP); 3
Baberton (MP); 7
Balfour (MP); 1
Highveld Ridge (MP);
3
Pelgrimsrus (MP); 1

34
Iron ore (17 mines) Chrome (48 mines)
Manganese (30 mines) Copper (2 mines)
Vanadium (3 mines) Titanium (7 mines)
Hay (NC); 4
Kuruman (NC); 1
Postmasburg (NC); 7
Brits (NW); 1
Phalaborwa (LP); 1
Potgietersrus (LP); 1
Thabazimbi (LP); 2 Brits (NW);
8Madikwe (NW); 2
Mankwe (NW); 4
Rustenburg (NW); 12
Belfast (MP); 1
Lydenburg (MP); 15
Middelburg Mp (MP); 1
Witbank (MP); 1
Lydenburg (LP); 1
Sekhukhuneland (LP);
1
Thabazimbi (LP); 2
Swellendam (WC); 1
Kimberley (NC); 1
Kuruman (NC); 21
Camperdown (KZN);
1
Ventersdorp (NW); 2
Vereeniging (GP); 1
Nelspruit (MP); 1
Pelgrimsrus (MP); 1
Witbank (MP); 1
Namakwaland (NC);
1Phalaborwa (LP); 1
Ga Rankuwa (NW); 2
Witbank (MP); 1
Vredendal (WC); 1
Lower Umfolozi (KZN); 2
Mtunzini (KZN); 2
Letaba (LP); 1
Phalaborwa (LP); 1

35
Zirconium (2 mines) Antimony (2 mines)
Source: Calculated from Quantec. EasyData. Interactive database. DMR data on Operating Mines by Type of Mine
and Commodities at District Level. Accessed at www.quantec.co.za in September 2019.
In value, mining is similarly concentrated around a few key minerals. As shown in Graph 21,
gold sales have progressively decreased due to declining ore quality and depleting mines
(leading to the need to reach deeper and costlier deposits). PGMs sales have grown steadily
on the back of growing demand but have now stabilised due to increased recycling in the
global industry and reduced use by automotive manufacturers. The main source of growth
for South Africa in the past decade has been iron ore, largely driven, largely driven by the
(Chinese) boom in demand for steel. Manganese ore sales have also progressed, on the back
of growing global demand (for steel essentially) and South Africa being home to more than
70% of the world's highest grade manganese.
Graph 21. South Africa’s sales of metallic minerals (in 2018 constant Rands)
Source: Calculated from DMR Minerals Statistics, downloaded from http://www.dmr.gov.za in April 2019.
Deflated using annual average PPI from Statistics South Africa and rebased to 2018, downloaded from
http://www.statssa.gov.za in April 2019.
Vanrhynsdorp
(WC); 1Phalaborwa (LP); 1
Springs (GP); 1
Phalaborwa (LP); 1

36
A similar pattern emerges from figures for exports in Graph 22, which also highlights the key role played by global demand dynamics.
Graph 22. South Africa's exports of metallic minerals, metals and metal products (a) (in US$
billions and as a share of total exports)
Note: (a) Gold exports are only reported from 2011. Source: Calculated from ITC. TradeMap. Interactive dataset.
Downloaded from www.trademap.org in May 2019.
In addition to geology and domestic conditions, global dynamics drive the production of metals. South Africa is the leading producer of PGMs globally, as shown in Graph 23, as well as chrome and manganese. The industry also boasts a dominant position in zirconium (2nd) and vanadium (3rd). South Africa is furthermore a large producer of titanium (5th for the sum of ilmenite and rutile), iron ore (6th in content), tellurium (6th), gold (9th) and nickel (12th). In other cases, such as steel and aluminium (see Graph 24 and Graph 25), South Africa remains a very marginal producer at the global level.

37
Graph 23. Platinum supply and demand from 1975 to 2018 (000 troy ounces)
Source: Calculated from data from Johnson Matthey. Market Data Tables and PGM Market Reports. downloaded
from http://www.platinum.matthey.com in May 2019.
Graph 24. World production of crude
steel (in thousand tonnes)
Graph 25. World primary aluminium
production (in million tonnes)
Source: Calculated from World Steel Association
downloaded from https://www.worldsteel.org in
August 2019
Source: Calculated from British Geological Survey
downloaded from
https://www.bgs.ac.uk/products/minerals/statistics.ht
ml in August 2019
A. Supply B. Demand
0
200000
400000
600000
800000
1000000
1200000
1400000
1600000
1800000
2000000
China Japan
India United States
Russia South Korea
South Africa Rest of the world
0
10 000 000
20 000 000
30 000 000
40 000 000
50 000 000
60 000 000
19
92
19
94
19
96
19
98
20
00
20
02
20
04
20
06
20
08
20
10
20
12
20
14
20
16
China Russia Canada
India UAE Australia
Norway South Africa Rest of World

38
In addition, due to the export of a large share of South Africa’s minerals, the country’s metals
value chain is directly impacted by global supply and demand trends. Global prices (Graph
26), as an expression of global supply and demand dynamics, reflect the current downward
trend in the industry overall since the end of the commodity boom in 2011. In addition to low
demand growth, some metals face a global supply glut. This is for instance the case of steel
and aluminium as a result of China’s overproduction.
Graph 26: Price indices of South Africa's key exported mineral
Source: Calculated from World Bank Commodity Markets, Monthly Prices, accessed at https://www.worldbank.org/en/research/commodity-markets in September 2019.
4.2.2 Value add
The overall contribution of the metals value chain to South Africa’s value added declined from 10% in 2008, before the global financial crisis of 2008/2009 and the end of the commodity boom in 2011, to 7% in 2017. (Graph 27)
The fall was primarily driven by the heavy decline in value added from gold mining in recent years. The share of gross operating surplus in the sector’s value added, which stood at only 13% over the 2015-2017 period (compared to 84% for employees’ compensation) underscores the difficulties in the sector.
Other metallic minerals, while diverse in nature, face more favourable circumstances. Gross operating surplus accounted for 58% of the sector’s value added from 2015-2017, against 41% for employees’ compensation. From a peak in the midst of the commodity boom, value added from metal production has stabilised since 2011. Machinery and equipment dominate the fabrication stage (37% of value added downstream from mining over the 2015-2017 period), followed by structural metals and other fabricated products (26%) and basic iron and steel (24%).
0
50
100
150
200
250
Jan
-90
Feb
-91
Mar
-92
Ap
r-9
3
May
-94
Jun
-95
Jul-
96
Au
g-9
7
Sep
-98
Oct
-99
No
v-0
0
Dec
-01
Jan
-03
Feb
-04
Mar
-05
Ap
r-0
6
May
-07
Jun
-08
Jul-
09
Au
g-1
0
Sep
-11
Oct
-12
No
v-1
3
Dec
-14
Jan
-16
Feb
-17
Mar
-18
Ap
r-1
9
Au
gust
20
19
= 1
00
Aluminium Iron ore Gold Platinum

39
Graph 27. Value added from the metals value chain in South Africa
Source: Calculated from Quantec. EasyData. Interactive database. Accessed at www.quantec.co.za in May 2019.
4.2.3 Employment
The metals value chain directly employed around 740 000 people in 2018, down from more than 950 000 in 1993. Half of the employment is located in mining activities. Metals and metal products as well as machinery and equipment respectively account for a quarter of the employment in the value chain (see Graph 28). A large share of the historical decline is linked to the gold mining industry which shrank from 410 000 in 1993 to 110 000 in 2018. The metals refineries account for the remainder, sliding from 260 000 in 1993 to 190 000 in 2018. By contrast, employment in other metallic minerals mining, essentially PGMs and iron ore, has grown from 135 000 to 250 000 in the same period. Employment in machinery and equipment has also progressed from 145 000 to 190 000.
Graph 28. Employment in South Africa’s metals value chain
Source: Calculated from Quantec. EasyData. Interactive database. Accessed at www.quantec.co.za in May 2019.
-
100 000
200 000
300 000
400 000
500 000
600 000
700 000
800 000
900 000
1000 000
19
93
19
94
19
95
19
96
19
97
19
98
19
99
20
00
20
01
20
02
20
03
20
04
20
05
20
06
20
07
20
08
20
09
20
10
20
11
20
12
20
13
20
14
20
15
20
16
20
17
20
18
Gold mining Other metallic minerals mining Metals and metal products Machinery and equipment

40
4.2.4 Ownership and control
The metals value chain, due its high capital intensity, is heavily dominated by a limited number of large firms in each sub-sector. Table 4 below lists the main players in each of the key commodities considered in this section.
Table 4: Ownership of leading firms in South Africa’s metals value chain
Sub-sector Mining Manufacturing
Iron and steel
Iron ore mining is dominated by Kumba Iron Ore, part of global conglomerate Anglo American (owned at 13% by the PIC), and Assmang, part of Assore (listed on the Johannesburg Stock Exchange). Chinese International Resources Limited, who acquired Evraz Highveld Steel and Vanadium's Mapochs mine, and Anglo-Australian conglomerate Rio Tinto also have local operations.
Primary production is essentially conducted by ArcelorMittal South Africa, part of the global eponym conglomerate. Secondary production is led by Scaw (26% owned by IDC) and Cape Gate (family-owned). Columbus, part of the Spanish group Acerinox (74% ownership, the remainder being held by the IDC), is the only stainless steel manufacturer in the country. In addition, 79 small- to medium-sized ferrous foundries (2016), largely family-owned operate in the country. The IDC has also supported the development of six new foundries in the country.
Aluminium No bauxite mining occurs in South Africa. The alumina is imported from Australia by South32.
Primary production is exclusively conducted by South32, part of global conglomerate BHP Billiton, in smelters based in Richards Bay. Secondary producers include Zimalco, Metalite Alloys and Future Alloys and a number of small foundries (Hayes Lemmerz, Borbet, Autocast). Fabrication is dominated by Zimalco and Hulamin.
Gold Gold mining is dominated by AngloGold Ashanti (publicly listed on the JSE and owned at 44% by the US Bank of New York Mellon), Gold Fields (publicly listed on the JSE and owned at 7% by the GEPF), Harmony Gold (publicly listed and owned at 14% by African Rainbow Minerals), Pan African Resources (primarily listed on the LSE), Gold One (Australian), Sibanye-Stillwater (primarily listed on the JSE, with Gold One owning 20%), Village Main Reef (China-owned).
Rand Refinery, privately owned by AngloGold Ashanti (42%), Sibanye Gold (33%), DRDGold (11%), Avgold (10%) and GoldFields (3%), is the only primary gold refiner in South Africa.
Small recyclers process gold for local jewellery manufacturing.

41
Sub-sector Mining Manufacturing
PGMs Dominated by AngloAmerican Platinum, part of global conglomerate Anglo American (owned at 13% by the PIC), Impala Platinum (listed on the JSE and owned at 14% by the GEPF) and Lonmin (owned by Sibanye-Stillwater, which is publicly listed and owned at 20% by Australian Gold One International). Other players include Aquarius, Northam, RBHPlats, Jubilee, Wesizwe and Pallinghurst.
Dominated by the production of catalytic converters by a limited number of foreign-owned companies operating in South Africa (Johnson Matthey, Umicore, BASF, Cataler, Benteler, Bosal, Cummins, Faurecia, Eberspaecher, Tenneco). Ceramic monoliths required for production are provided by foreign-owned NGK Ceramics and Corning.
Source: Who Owns Whom
In addition to large, established mining houses, the sector hosts numerous artisanal and small-scale mining (ASM) operations. In 2011, the number of registered small-scale mines was estimated to 1030 by the Mine Health and Safety Council (MHSC), employing anywhere between 10 000 and 30 000 people. Most ASM takes place in the industrial minerals and construction materials sub-sector, particularly in Northern Cape, North West, Limpopo, and Eastern Cape provinces. (Ledwaba 2017)
4.2.5 Energy dependence
Production costs in the value chain, as depicted in Graph 29, illustrate the varying role of energy in the industry. In mining, energy-related costs oscillate from 4-5% for opencast mines (which rely more on diesel for trucks) to 7-11% for underground mining (which rely more on electricity), and are secondary to labour costs. Energy costs are much more significant for smelting. For largely electricity-based smelting operations, energy costs reach up to 48% of production costs. The dependency is less pronounced for coal-based operations, such as primary steelmaking, where energy accounts for 12-14% of costs. At the subsequent refining stage, energy costs represent 11-12% of production costs.

42
Graph 29: Production costs of various companies in South Africa’s metals value chain
Source: Derived from the 2019, 2018 and 2017 Annual Financial Statements for relevant companies (Kumba Iron Ore, Impala Platinum, AngloAmerican Platinum and ArcelorMittal South Africa).
Graph 30 confirms this dichotomy. Mining relies essentially on electricity and petroleum products, depending on the type of mines. In turn, iron and steel rely almost equally on electricity, coal and gas, reflecting the diversity of product processes operating in South Africa with blast oxygen furnaces (coal-based), electric arc furnaces (electricity-based) and the gas-based Saldanha Corex-Midrex facility. Non-ferrous metals rely heavily on coal. Other activities, such as machinery, are far less energy intensive and generally use electricity.
Graph 30: Energy consumption by the metals value chain and the industrial sector in 2015
Source: Calculated from South Africa’s Commodity Flows and Energy Balances, accessed from the Department
of Mineral Resources and Energy at http://www.energy.gov.za/files/media/Energy_Balances.html in September
2019.
0% 10% 20% 30% 40% 50% 60% 70% 80% 90% 100%
South Africa
Industry
Iron and Steel
Non-Ferrous Metals
Machinery
Mining and Quarrying
Coal Petroleum products Gas
Geothermal, solar, etc. Renewables & Waste Electricity

43
4.3 Dimensions of climate-change related impacts
This section unpacks climate-change related risks and impacts faced by the metals value chain in South Africa. It considers the type of risks and their likely impacts, before analysing how firms in the value chain have addressed such impacts to date. Lastly, it discusses key implications for the value chain.
4.3.1 Type of risks
Metals value chains are subject to a diversity of climate-change related risks, on both the supply and demand sides. Transition risks are generally more relevant to South Africa’s metals value chains than physical risks linked to climatic events, although these latter may become increasingly relevant over time.
On the supply side, the operations of firms operating in the metals value chains may essentially be impacted by a variety of transition risks:
Direct domestic policy risk: government may exert pressure to reduce GHG emissions, notably by improving the energy and carbon efficiency of operations. This is particularly an issue for refining and smelting operations, such as aluminium and steel smelters, gold and platinum refineries and ferroalloy foundries. The manufacturing of metal products accounts for the largest share of industrial GHG emissions in South Africa (74% in 2015), with the production of iron and steel as well as ferroalloys leading the pack (DEA 2018)5.
The introduction of carbon pricing (from June 2019) as well as mandatory carbon budgets (from 2020) will have a direct impact on the firms in the value chain. Modelling exercises (see Promethium Carbon and Urban-Econ Development Economists 2018; Alton et al. 2012; Ward et al. 2016) have highlighted that carbon pricing could generate job losses in some sectors, notably in the metals value chain (mining operations, iron and steel production and the manufacturing of structural metals and machinery essentially). The estimates should however be treated with caution because they underestimate or exclude:
employment that would be created as the carbon tax incentivises new (low-carbon) economic opportunities,
the recycling of carbon tax revenues into the economy, and
jobs that could be lost if South Africa does not reduce carbon intensity.
Indirect domestic policy risk: South Africa is of one of the most carbon-intensive economies in the world. Government’s efforts to reduce the carbon intensity of the South African economy, by decarbonising the energy sector (i.e. reducing the role of coal-fired electricity and fossil fuels as well as using taxes and tighter environmental regulations) will, in the short term, compound the ongoing energy price increases. South Africa’s average electricity prices more than tripled in constant rand over the 2008-2018 decade as a result of massive capital expenditure into new large-scale coal-fired power plants and long-term mismanagement.
These price increases triggered material improvements in energy efficiency. They have, however, negatively affected the competitiveness of firms in the metals value chain. Graph 32, for instance, shows the rapid decline of secondary, electricity-based steelmaking in South Africa, essentially as a result of rising electricity prices in the country. Further price increases
5 Importantly, GHG emissions from industrial processes and product use only accounted for 8% of South Africa’s net GHG emissions in 2015, compared to 84% for energy (DEA, 2017).
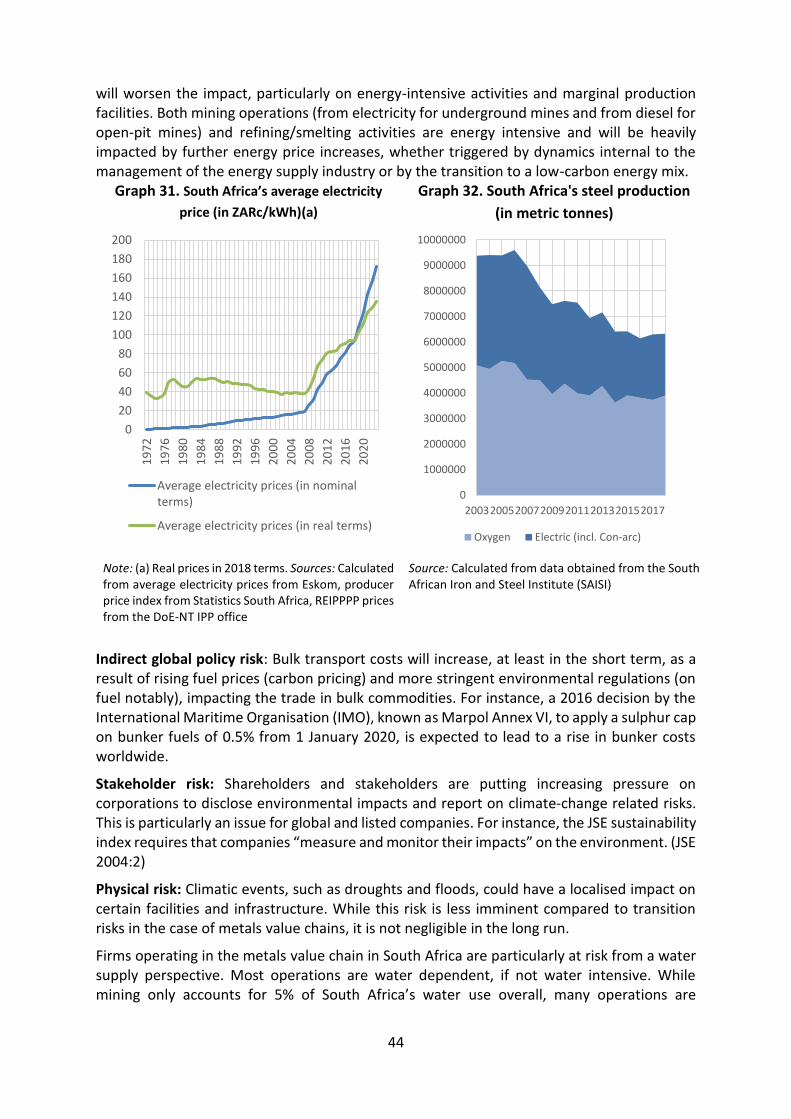
44
will worsen the impact, particularly on energy-intensive activities and marginal production facilities. Both mining operations (from electricity for underground mines and from diesel for open-pit mines) and refining/smelting activities are energy intensive and will be heavily impacted by further energy price increases, whether triggered by dynamics internal to the management of the energy supply industry or by the transition to a low-carbon energy mix.
Graph 31. South Africa’s average electricity
price (in ZARc/kWh)(a)
Graph 32. South Africa's steel production
(in metric tonnes)
Note: (a) Real prices in 2018 terms. Sources: Calculated from average electricity prices from Eskom, producer price index from Statistics South Africa, REIPPPP prices from the DoE-NT IPP office
Source: Calculated from data obtained from the South African Iron and Steel Institute (SAISI)
Indirect global policy risk: Bulk transport costs will increase, at least in the short term, as a result of rising fuel prices (carbon pricing) and more stringent environmental regulations (on fuel notably), impacting the trade in bulk commodities. For instance, a 2016 decision by the International Maritime Organisation (IMO), known as Marpol Annex VI, to apply a sulphur cap on bunker fuels of 0.5% from 1 January 2020, is expected to lead to a rise in bunker costs worldwide.
Stakeholder risk: Shareholders and stakeholders are putting increasing pressure on corporations to disclose environmental impacts and report on climate-change related risks. This is particularly an issue for global and listed companies. For instance, the JSE sustainability index requires that companies “measure and monitor their impacts” on the environment. (JSE 2004:2)
Physical risk: Climatic events, such as droughts and floods, could have a localised impact on certain facilities and infrastructure. While this risk is less imminent compared to transition risks in the case of metals value chains, it is not negligible in the long run.
Firms operating in the metals value chain in South Africa are particularly at risk from a water supply perspective. Most operations are water dependent, if not water intensive. While mining only accounts for 5% of South Africa’s water use overall, many operations are
0
20
40
60
80
100
120
140
160
180
200
19
72
19
76
19
80
19
84
19
88
19
92
19
96
20
00
20
04
20
08
20
12
20
16
20
20
Average electricity prices (in nominalterms)
Average electricity prices (in real terms)
0
1000000
2000000
3000000
4000000
5000000
6000000
7000000
8000000
9000000
10000000
20032005200720092011201320152017
Oxygen Electric (incl. Con-arc)

45
concentrated in water-stressed areas, as shown in Figure 7. Water quality is furthermore problematic in many instances, as a result of pollution (such as acid mine drainage) itself resulting from operations from the metals value chain.
Figure 7. Projected gap between water supply and demand in 2030 (in percentage of 2030 demand)
Source: Addams et al. 2009.
On the demand side, the following transition risks predominate.
Market risk: Customers are increasingly moving away from carbon-intensive products and/or jurisdictions. Although many of South Africa’s facilities operate according to global standards in terms of resource efficiency, this is a critical issue for all industries in the country, given South Africa’s carbon-intensive (coal-based) electricity supply. South Africa is one of the most carbon-intensive economies (see Graph 33). Border taxes may be introduced by some of South Africa’s trading partners, such as the European Union and the United States of America to level the playing field for their domestic industries in terms of carbon pricing.
Modelling exercises show that non-ferrous metals (such as gold, platinum, copper, aluminium and cobalt) as well as iron and steel would be South Africa’s primary victims of a change in trade patterns and the implementation of border carbon adjustments (Cosbey and Wooders 2011; Jooste et al. 2009). As illustrated in Graph 34, this risk is clear in the case of aluminium. South Africa’s primary aluminium production is historically reliant on coal-fired electricity. With the exception of China (which produces 60% of global supply, essentially for domestic consumption), the main producers rely heavily on hydropower and to some extent natural gas to power aluminium smelting operations.

46
Graph 33. Carbon intensity per country (in kilogramme of carbon dioxide-equivalent per GDP (2011 USD) based on purchasing
power parity)
Graph 34. Energy mix of aluminium smelting per region
Source: Derived from World Bank, downloaded from https://data.worldbank.org/indicator/EN.ATM.CO2E.PP.GD in May 2019.
Source: Derived from World Aluminium Statistics, downloaded from http://www.world-aluminium.org/statistics/ in July 2019
Technological risk: Innovation and technological change may jeopardise demand for certain minerals and metals. This is particularly evident in the case of PGMs with the decline in demand for catalytic converters (linked to the shifting away from internal-combustion vehicles as well as the reduced use of platinum for each converter) and the rise of platinum recycling, as shown in Graph 23 above. However, other South African value chains, such as steel (wind turbines, lightweight vehicles), manganese (fuel cells), copper (electrification), or even PGMs (fuel cells), may in the long run experience an increase in demand due to the transition to low-carbon technologies, as shown in Graph 35 (World Bank 2017).
South Africa
0,0
0,2
0,4
0,6
0,8
1,0
1,2
1,4
Ch
ad
Sri L
anka
Swed
en
Sin
gap
ore
Co
te d
'Ivo
ire
Ph
ilip
pin
es
Au
stri
a
Do
min
ican
Rep
ub
lic
Ind
on
esia
New
Zea
lan
d
Geo
rgia
Slo
ven
ia
Seyc
hel
les
Un
ite
d S
tate
s
Mal
aysi
a
Ton
ga
Esto
nia 0,0%
10,0%
20,0%
30,0%
40,0%
50,0%
60,0%
70,0%
80,0%
90,0%
100,0%
Sou
th A
fric
aA
fric
aN
ort
h A
mer
ica
Sou
th A
me
rica
Asi
a (e
x C
hin
a)Eu
rop
eO
cean
iaG
CC
Ch
ina
Other non-renewable
Otherrenewable
Nuclear
Natural Gas
Oil
Coal
Hydro
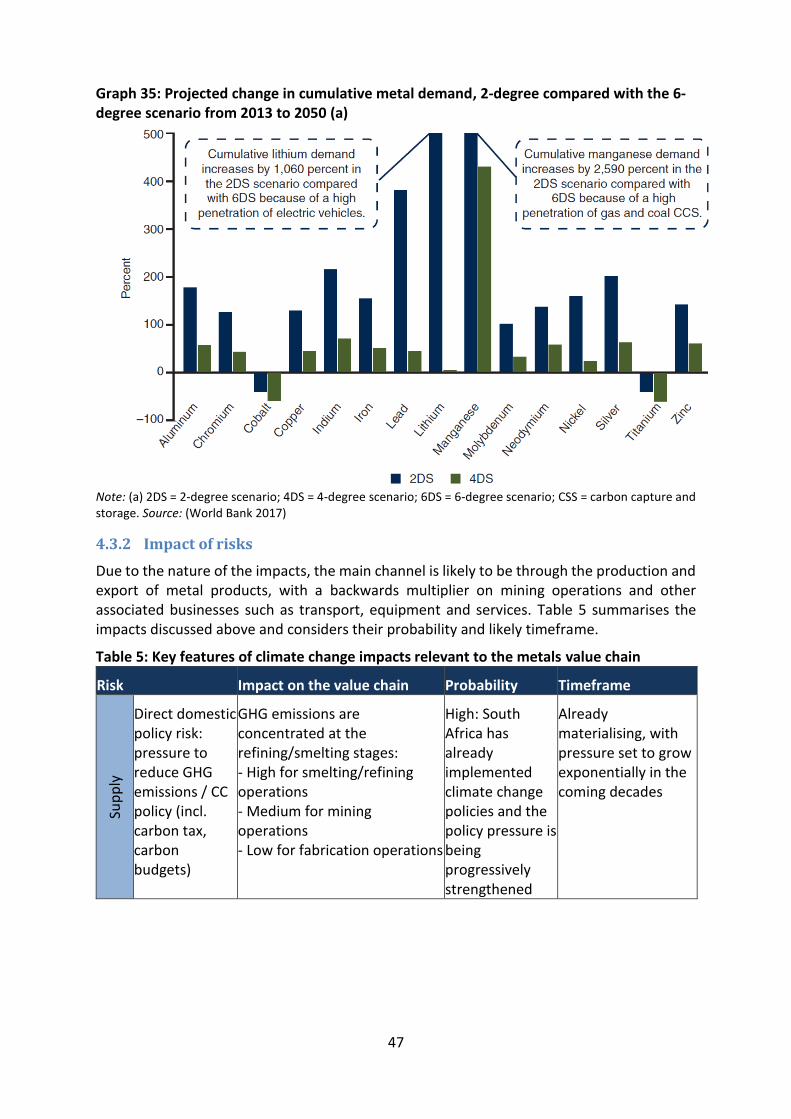
47
Graph 35: Projected change in cumulative metal demand, 2-degree compared with the 6-degree scenario from 2013 to 2050 (a)
Note: (a) 2DS = 2-degree scenario; 4DS = 4-degree scenario; 6DS = 6-degree scenario; CSS = carbon capture and storage. Source: (World Bank 2017)
4.3.2 Impact of risks
Due to the nature of the impacts, the main channel is likely to be through the production and export of metal products, with a backwards multiplier on mining operations and other associated businesses such as transport, equipment and services. Table 5 summarises the impacts discussed above and considers their probability and likely timeframe.
Table 5: Key features of climate change impacts relevant to the metals value chain
Risk Impact on the value chain Probability Timeframe
Sup
ply
Direct domestic policy risk: pressure to reduce GHG emissions / CC policy (incl. carbon tax, carbon budgets)
GHG emissions are concentrated at the refining/smelting stages: - High for smelting/refining operations - Medium for mining operations - Low for fabrication operations
High: South Africa has already implemented climate change policies and the policy pressure is being progressively strengthened
Already materialising, with pressure set to grow exponentially in the coming decades

48
Risk Impact on the value chain Probability Timeframe
Indirect domestic policy risk: rising energy prices
Underground mining relies on electricity while open pit mining is more dependent on trucks; refining/smelting is energy-intensive: - High for underground mining and refining/smelting operations - Medium for open pit mining - Low to medium for manufacturing operations depending on their energy intensity
High: pressure to move away from fossil fuels is increasing both locally and globally
Already materialising, with pressure set to grow in the foreseeable future. New low-carbon technologies are likely to provide low-carbon alternatives.
Indirect global policy risk: rising bulk transport costs
Low for high-value, precious commodities High for bulk commodities
Medium Short (<10 years). New low-carbon technologies are likely to provide low-carbon alternatives.
Stakeholder risk: increased pressure to disclose risks
None for privately-owned firms Low for publicly-traded firms and state-owned enterprises
High Already materialising, with pressure set to grow exponentially in the coming decades
Physical risks: climatic events
Highly disruptive for water-dependent operations Impact on exports due to water security risks
Possible climatic impacts on rail and port infrastructure due to sea-level rise as well as extreme weather events
High Medium to long (>10 years)
Dem
and
Market risk: move away from carbon-intensive products and/or jurisdictions
High due to South Africa's high carbon intensity
Low for mining operations when South Africa has a monopolistic position High for beneficiation operations
Medium to long (>10 years). May be countered by increased overall demand for minerals

49
Risk Impact on the value chain Probability Timeframe
Technological risk: reduction in demand for metals due to new technological trends
Variable per metals depending on technological trends, climate change adaptation focus, scale of recycling Many metals are expected to see increased demand in the long turn
PGMs appear to be the major metal group at risk.
High Medium to long (>10 years) as well as likely to materialise through incremental change
Graph 36 illustrates how each stage of the metals value chain could be impacted by supply- and demand-side impacts. It shows that supply-side impacts are likely to be negative across the board, largely due to increased input and regulatory costs. On the demand side, impacts are mostly positive as many metals would benefit from increased demand in the future as a result of the transition to a low-carbon, climate-resilience world. The uncertain situation of PGMs is however notable.
Graph 36: Climate-change related impacts on South Africa's metals value chain
Note: ranking is relative and the size of the bubble indicates the relative domestic employment
A. Supply dynamics B. Demand dynamics
4.3.3 Existing responses
In light of the risks and dynamics from the climate crisis, and particularly the negative supply-side impacts, firms in the various sub-value chains have explored avenues to reduce their vulnerability: load shifting; alternative fossil fuel-based energy supply; resource efficiency; renewable energy technologies (Montmasson-Clair and Ryan 2014)
First, companies have implemented no-cost load-shifting initiatives. Load-shifting, as carried out by deep-shaft PGM and gold mining operations as well as beneficiation ensures that energy-intensive operations are carried out during the most inexpensive power phases, at the same time concentrating operational activity with the most energy-efficient infrastructure during the relatively more expensive power phases. This does not reduce the use of energy
PGMsGold
Iron ore
Aluminium
Steel
Cobalt
ManganeseCopper
Machinery and
equipmentChrome
Nickel
Titanium
Vanadium
ZirconiumAntimony
Clim
ate
chan
ge im
pac
ts (
sup
ply
)N
egat
ive
imp
act
<--
----
----
----
----
-->
Po
siti
ve im
pac
t
Economic situation (domestic)Negative situation <--------------------------> Positive situation
PGMs (high)
Gold
Iron ore
Aluminium
PGMs (low)
Steel
Cobalt
ManganeseCopper
Machinery and
equipment
ChromeNickel
Titanium
Vanadium
Zirconium
Antimony
Clim
ate
chan
ge im
pac
ts (
dem
and
) N
egat
ive
imp
act
<--
----
----
----
----
-> P
osi
tive
imp
act
Economic situation (domestic)Negative situation <--------------------------------> Positive situation

50
and is only a short-term measure to reduce electricity costs, and an immediate response to the rising electricity prices.
Second, in order to decrease their exposure to supply concerns, companies have been investing in alternative fossil fuel-based energy sources. Most companies, such as Kumba and ArcelorMittal South Africa, have invested in diesel-run back-up or emergency generators as a contingency measure against electricity outages.6 Beyond emergency measures, some companies have invested in independent generation capacity to reduce their reliance on Eskom. For example, Braemore Platinum (a subsidiary of Jubilee Platinum) supplies the entirety of the electricity requirements at its Middelburg smelter in Mpumalanga through an on-site 11-MW gas-fired plant (Matthews, 2013). Similarly, ArcelorMittal South Africa has explored the commissioning of an 800-MW compressed natural gas power plant at tier Saldanha smelter.
Third, driven by rising electricity and more recently water prices and some support from the South African government, companies have progressively turned their focus towards resource efficiency improvements. Material progress has been made in various directions both to reduce resource use and to mobilise back-up supplies in case of interruptions.
4.3.4 Key implications
Climate-change related impacts have deep implications for the metals value chain, both on the demand and supply sides.
On the supply side, the ability of the value chain to decarbonise is, at the moment, limited by technology, the energy mix and, in some cases, chemistry. Pushed by rising inputs costs, the industry, particularly large firms, has largely exhausted low-hanging fruits to reduce its vulnerability to such supply-side risks. More options are available but are hampered by policy, technological and/or financial considerations at the moment. Additional solutions will also arise in the future, notably as ongoing and future R&D delivers new technologies and innovations, but these remain uncertain.
On the demand side, the South African industry is essentially dependent on global dynamics and has little to no control on possible impacts. Demand is primarily driven by global policy trends and technological developments. With the notable exception of PGMs where South Africa is a quasi-monopolistic supplier, South Africa’s influence on global market is limited, even when it is a leading supplier, as in the case of chrome, manganese and zirconium. South African operations are secondary (gold, vanadium) or marginal producers (aluminium, iron ore, steel) in other cases. As such, they have little influence on the market. And, even in the case of PGMs, the reduced demand for new product has materially weakened the market power of South African PGMs producers.
The channels through which impacts are likely to materialise and travel through the stages of the various value chains are multiple and complex. While sub-value chains are largely independent of each other, stages within each sub-value chain are highly interlinked. Demand-side impacts will enter the value chains through a shift of demand for metals. This will then have repercussions for mining operations, downstream beneficiation activities as well as businesses supplying goods and services into them. Supply-side impacts are more
6 However, these are not to sustain production, but only to ensure workers’ health and safety and prevent loss or damage of equipment (critical cooling and exhaust systems).

51
cross-cutting and will affect each stages independently through their energy use as well as GHG emissions.
Negative impacts on some stages may have deep repercussions on other stages. Besides the employment and socio-economic drawbacks, the closure of iron, steel as well as aluminium smelting operations would have negative impacts on downstream fabrication activities which in some cases cannot easily replace local inputs with imports. Columbus Steel is, for example, South Africa's only producer of stainless steel flat products. ArcelorMittal South Africa owns the only facility in the region capable of producing heavy structural steel which is essential for railway lines. In a similar vein, South32 operates the only primary aluminium smelter in South Africa (along its smelter in Mozambique), on which Hulamin, which produces ultra-high-end aluminium products, directly depends.
4.4 Vulnerable groups
Vulnerable groups in the metals value chain are multi-faceted. They range from workers who are directly employed in the value chain, to people employed in peripheral activities, such as suppliers, to the (low-income) communities which rely on such activities for their livelihood, either through relatives working in the value chain or by servicing the population.
Workers in the metals value chains may face retrenchment. Mining, particularly underground operations, employs the largest number of workers in the metals value chains, while opencast mines and even more so beneficiation activities are more capital intensive. Job losses may therefore be more numerous in mining than beneficiation, even though, as raised above, refining and smelting activities are likely to be hit first. Cost pressures may furthermore lead to increased mechanisation, resulting in additional redundancies.
Activities in the value chain are geographically concentrated in dispersed areas of the country, making relocation for redundant workers potentially more difficult. In addition, as raised below, communities where firms in the metals value chain are located often rely on one mine or refinery, severely constraining the possibility of finding alternative employment in the same area.
Small businesses servicing all facilities in the value chain, from mines to smelters and factories, may lose out if the value chain enters a decline and customers close down. Small businesses operating in the industry often rely on one or a limited number of customers and could be irreversibly impacted. They provide a variety of goods and services to the value chain, such as maintenance and repair services, ancillary services (food, cleaning, security) and transport (trucking).
Communities where firms in the metals value chain are located are very vulnerable, particularly when they are relatively small and rural. Many are heavily reliant on a single mine or refinery for employment, economic activities and even public services. When it closes a community may face a broad decline.
4.4.1 Workers
Employment in the metals value chain is concentrated in five municipalities for mining, nine municipalities for metal products and eight municipalities for machinery and equipment, as shown in Graph 37. Four areas (Bojanala in the North West, Lejweleputswa in the Free State, Dr Kenneth Kaunda in the North West and the West Rand in Gauteng) and five metropolitan

52
areas (Johannesburg, Ekurhuleni, Tshwane, eThekwini and Cape Town) host the bulk of the value chain. The key spilt is between:
The large metros (Johannesburg, Ekurhuleni, Cape town and Tshwane) which host employment in metals and mineral products as well as machinery and equipment; and
Bojanala (NW), Lejweleputswa (FS), Dr Kenneth Kaunda (NW) and West Rand (GP) which host the mining employment.
Graph 37. Employment in South Africa's metals value chain by municipality, 1993 to 2018 (a)
A. Total employment in the value chain (mining, beneficiation and fabrication)

53
B. Employment in mining of metallic minerals
C. Employment in manufacturing of metals and metal products (b)

54
D. Employment in manufacturing of machinery and equipment (c)
Notes: (a) Figures before 2002 are estimates based on available surveys, which were not fully reliable. (b) b.
Includes the manufacturing of basic iron and steel, structural metals, other fabricated metals and non-ferrous
metals. Excludes the manufacturing of non-metallic products. c. Includes machinery and equipment as well as
electrical machinery. Source: Calculated from Quantec. EasyData. Interactive database. Accessed at
www.quantec.co.za in May 2019.
In addition to direct employment, activities servicing the core mining and manufacturing industries indirectly employ a large number of people. They include power, transport, industrial services (such as maintenance) and ancillary services (such as catering, security and cleaning).
Transnet employed 55 700 people in April 2017, including 28 400 people through rail and 8 800 people through port activities. A dedicated 861-kilometre railway line, known as the Sishen-Saldanha line or the Ore Export Line, connects the iron ore mines in the Northern Cape to port facilities in the Western Cape. Transnet also has dedicated facilitated for manganese exports. More than 92% of Transnet employees are permanent and about 89% of total employees (81% of permanent employees) are represented by collective bargaining (Transnet 2018). A decline in iron ore and/or manganese exports would affect these jobs as well as Transnet’s business model, which relies heavily on low-cost, high-profit bulk lines serving the mines.
The metals value chain is also a central source of demand for energy and electricity in particular. While the share has fallen in the past 15 years, it remains the largest electricity user in the country. In 2017/18, around 3 000 mines and refineries used 37% of South Africa’s national electricity, down from 44% in 2003/04, as Graph 38 shows. As noted above, Eskom employed 48 000 people in 2016, with around 84% covered by collective bargaining agreements.

55
Graph 38. Energy and electricity consumption from the metals value chain in South Africa (in TJ and share of total final energy/electricity consumption)
A. Energy B. Electricity
Source: Calculated from South Africa’s Commodity Flows and Energy Balances, accessed from the Department of Mineral Resources and Energy at http://www.energy.gov.za/files/media/Energy_Balances.html in September 2019.
Men dominate employment in the metals value chain, accounting for 88%, 86% and 78% in the mining, metals and machinery/equipment stages of the value chain respectively, compared to 56% in other formal employment (Graph 39). As noted in the case of coal mining, a risk is that because women generally work in auxiliary activities, they may be effectively excluded from measures to assist workers in adjusting to the effects of climate change.
Graph 39: Gender distribution in the metals value chain
Source: Calculated from Statistics South Africa. Labour Market Dynamics Survey 2017. Electronic database. Downloaded from Nesstar facility at www.statssa.gov.za in September 2019.
a. Financial resources
As in the coal value chain, workers in the metals value chain are generally better paid than other formal workers, especially if we take education into account (see Graph 40). The
0%
5%
10%
15%
20%
25%
30%
0
100 000
200 000
300 000
400 000
500 000
600 000
700 0001
992
19
94
19
96
19
98
20
00
20
02
20
04
20
06
20
08
20
10
20
12
20
14
Mining and Quarrying
Machinery
Non-Ferrous Metals
Iron and Steel
Metals value chain (share of total)
0%
5%
10%
15%
20%
25%
30%
35%
40%
45%
0
50 000
100 000
150 000
200 000
250 000
300 000
19
92
19
94
19
96
19
98
20
00
20
02
20
04
20
06
20
08
20
10
20
12
20
14
Mining and Quarrying
Machinery
Non-Ferrous Metals
Iron and Steel
Metals value chain (share of total)
0%
20%
40%
60%
80%
100%
Mining Metals Machinery andequipment
Other sectors
Men Women

56
exception is metal workers, who often have relatively small employers. Median pay in metalwork for men – the vast majority of workers in the industry – is lower than the median for other formal workers. Overall, mining provides the highest median earning for formal workers in the value chain, at around R11 000 per month for both men and women.
Graph 40: Earnings in the metals value chain
Source: Calculated from Statistics South Africa. Labour Market Dynamics Survey 2017. Electronic database. Downloaded from Nesstar facility at www.statssa.gov.za in September 2019.
Workers in the value chain also have a higher access to retirement fund and UIF than formal workers in the rest of the economy, as shown in the graphs below. This is particularly the case for the mining sector.
Graph 41: Contribution to a retirement fund in the metals value chain
Graph 42: Contribution to UIF in the metals value chain
Source: Calculated from Statistics South Africa. Labour Market Dynamics Survey 2017. Electronic database. Downloaded from Nesstar facility at www.statssa.gov.za in September 2019.
-
5 000
10 000
15 000
20 000
25 000
30th
per
cen
tile
Med
ian
80th
per
cen
tile
30th
per
cen
tile
Med
ian
80th
per
cen
tile
30th
per
cen
tile
Med
ian
80th
per
cen
tile
30th
per
cen
tile
Med
ian
80th
per
cen
tile
Mining Metals Machinery andequipment
Other sectors
Men Women
0%
10%
20%
30%
40%
50%
60%
70%
80%
90%
100%
Mining Metals Machineryand
equipment
Othersectors
Men Women
0%
10%
20%
30%
40%
50%
60%
70%
80%
90%
100%
Mining Metals Machineryand
equipment
Othersectors
Men Women

57
b. Physical assets
Information on physical assets is not available by occupation. Case studies of the platinum belt, however, suggested that small rural towns often do not provide land for miners to own decent houses. In the platinum belt, even relatively well-paid miners ended up living in informal slums, in conditions far behind what other people with those incomes would typically have. That said, many miners said they were building better housing in other regions, where they had family members. (See Makgetla and Levin 2016)
c. Human capital
Employees in mining and refining have lower levels of education than other formal workers. Between 45% and 50% of workers in these industries do not have matric, compared to under 40% for other formal employees. Most of the rest have matric, while 12% to 13% have a diploma or degree. In machinery and equipment, in contrast, education is generally higher than for other formal workers. The share of employees with a higher education (diploma or degree) is about a third, compared to a quarter for formal workers outside of the metals value chain. (Graph 43) Graph 43. Levels of education in South Africa's metals value chain in 2017
Source: Calculated from Statistics South Africa. Labour Market Dynamics Survey 2017. Electronic database. Downloaded from Nesstar facility at www.statssa.gov.za in September 2019.
This trend is confirmed when looking at the type of occupations in the value chain. Generally, the skills level is the highest in the manufacturing of machinery and equipment, followed by the manufacturing of metals and metal products. Mining displays the lowest skills profile. Notably, the machinery and equipment manufacturing sector has a much higher share of the highly-skilled employees (about a third) than the rest of the value chain (13% of metals and 8% in mining)
0%
10%
20%
30%
40%
50%
60%
70%
80%
90%
100%
other formal mining metals machinery
don't know
other
university degree
matric plus diploma
matric
less than matric

58
Graph 44. Occupations in South Africa's metals value chain
Source: Calculated from Statistics South Africa. Labour Market Dynamics Survey 2017. Electronic database. Downloaded from Nesstar facility at www.statssa.gov.za in September 2019.
As with coal miners, the median pay for most workers in the metals value chain was higher than for other formal workers with the same level of education. The disparity was lowest for metals refineries and greatest for mining. As with coal miners, it did not hold for the relatively small share of workers with secondary plus a diploma, which would include artisans.
Graph 45. Median monthly pay for workers in the metals value chain and other formal workers by education level, 2017
Source: Calculated from Statistics South Africa. Labour Market Dynamics Survey 2017. Electronic database. Downloaded from Nesstar facility at www.statssa.gov.za in September 2019.
d. Social capital
As with coal miners, the main information available on social capital relates to workplace relations.
9 000 10 500
18 000
30 000
4 875
7 000 6 400
18 000
6 000
8 500
13 000
27 800
3 000 4 500
10 000
18 000
-
5 000
10 000
15 000
20 000
25 000
30 000
35 000
less than matric matric matric plus diploma university degree
ran
d p
er m
on
th
metals mining metals refineries machinery mfg all other industries

59
Union membership is much stronger in the metals value chain than for other formal workers (see Graph 46). This is particularly striking for mining, in which, as in coal, 88% of the workforce is unionised. The percentage is materially higher than in other sectors. Unionisation rates fall to 40% in the metals industry and 29% in the machinery and equipment sector, while it stands at 33% in other formal industries, including commercial farming. Overall, while the mining value chain makes up 6% of all formal employees in South Africa, it accounts for 11% of South Africa’s unionised workers. Metals mining alone contributes around 3% of total formal employment, but 7% of union members.
High levels of worker organisation in mining mean that workers virtually invariably get an annual raise. Moreover, salaries are more likely to be negotiated between employers and unions than in other industries (see Graph 47). In contrast, metal refineries and manufacturing are essentially in line with the rest of the formal economy.
Graph 46. Union membership in South Africa's metals value chain
Graph 47. Mechanism to determine annual salary increment in South Africa's metals value chain
Source: Calculated from Statistics South Africa. Labour Market Dynamics Survey 2017. Electronic database. Downloaded from Nesstar facility at www.statssa.gov.za in September 2019.
In line with the above, employees in the metals value chain have better protection under the labour laws, with a higher degree of written contracts as well as permanent employment (see Graph 48 and Graph 49). Once again, workers in the mining sector fare better than those in other stages of the metals value chain as well as the rest of the economy.
0%
10%
20%
30%
40%
50%
60%
70%
80%
90%
100%
Mining Metals Machineryand
equipment
Othersectors
Men Women
0%10%20%30%40%50%60%70%80%90%
Emp
loye
r se
t u
nila
tera
lly
Neg
oti
atio
n b
etw
een
un
ion
an
dem
plo
yer
Emp
loye
r se
t u
nila
tera
lly
Neg
oti
atio
n b
etw
een
un
ion
an
dem
plo
yer
Emp
loye
r se
t u
nila
tera
lly
Neg
oti
atio
n b
etw
een
un
ion
an
dem
plo
yer
Emp
loye
r se
t u
nila
tera
lly
Neg
oti
atio
n b
etw
een
un
ion
an
dem
plo
yer
Mining Metals Machineryand
equipment
Other sectors
Men Women

60
Graph 48. Share of written contracts in South Africa's metals value chain
Graph 49. Share of permanent contracts in South Africa's metals value chain
Source: Calculated from Statistics South Africa. Labour Market Dynamics Survey 2017. Electronic database. Downloaded from Nesstar facility at www.statssa.gov.za in September 2019.
As depicted the following graphs show, employees across the metals value chain have relatively strong access to paid leave of all kinds, which is a legal requirement. Workers in the metals sector appear less protected in this regard than their peers in mining and in machinery and equipment.
Graph 50. Access to paid leave in the metals value chain, 2017
A. Sick leave B. Family leave C. Vacation leave
Source: Calculated from Statistics South Africa. Labour Market Dynamics Survey 2017. Electronic database. Downloaded from Nesstar facility at www.statssa.gov.za in September 2019.
4.4.2 Communities
Besides employees in the value chain, a host of other people rely on it directly or indirectly for their livelihoods. In many rural mining and refining communities, if the dominant producer
0%
10%
20%
30%
40%
50%
60%
70%
80%
90%
100%
Mining Metals Machineryand
equipment
Othersectors
Men Women
0%
10%
20%
30%
40%
50%
60%
70%
80%
90%
100%
Mining Metals Machineryand
equipment
Othersectors
Men Women
0%10%20%30%40%50%60%70%80%90%
100%M
inin
g
Metals
Mach
inery an
deq
uip
men
t
Oth
er secto
rs
Men Women
0%10%20%30%40%50%60%70%80%90%
100%
Min
ing
Metals
Mach
inery an
deq
uip
men
t
Oth
er secto
rs
Men Women
0%10%20%30%40%50%60%70%80%90%
100%
Min
ing
Metals
Mach
inery an
deq
uip
men
t
Oth
er secto
rs
Men Women

61
downsizes, they will see a general economic decline affecting the small businesses that depend on sales to the company or its workers.
Value added from the metals value chain is concentrated in a few localities. At the mining stage, the Free State (47% in 2017) and Gauteng (37%) account for the lion’s share of the value added from gold mining, as shown in Graph 53. Other metals mining is essentially spilt between the North West province (40% in 2017) on the one hand, which is dominated by PGM mining, and the Limpopo (38%) and Northern Cape (11%) provinces, which are dominated by iron ore.
Graph 51. Value added from mining of metallic minerals in South Africa by province (in millions of constant 2010 rand)
Source: Calculated from Quantec. EasyData. Interactive database. Accessed at www.quantec.co.za in May 2019.
Value added from the manufacturing of metals and metal products (Graph 52) is less spatially concentrated than mining due to the diversity of products. Still, Gauteng accounted for 37% of the total in 2017, essentially from the manufacture of machinery and equipment as well as structural and other fabricated metal products. KwaZulu-Natal accounted for 16% of the value added from the production of metals and metal production, primarily due to aluminium smelting and fabrication in Richards Bay.

62
Graph 52. Value added from the production of metal products in South Africa (in millions of constant 2010 rand)
Source: Calculated from Quantec. EasyData. Interactive database. Accessed at www.quantec.co.za in May 2019.
As noted above, the value added from the metals value chain is geographically concentrated. Nine municipalities display particularly high share of value added from the value chain, especially mining, and would be hard-hit by a decline in the industries. As illustrated in Graph 53, these municipalities include:
Northern Cape: John Taolo Gaetsewe (iron ore) and Namakwa (copper);
North West: Bojanala (PGMs) and Dr Kenneth Kaunda (gold);
Limpopo: Waterberg (iron ore), Sekhukhune (PGMs) and Mopani (copper);
Free State: Lejweleputswa (gold); and
Gauteng: West Rand (gold).

63
Graph 53. Municipalities with high shares of value added in the metals value chain
Source: Calculated from Quantec. EasyData. Interactive database. Dataset on Regional Output and GVA at basic prices by industry and 2011 local municipal/ward-based metro region level, Accessed at www.quantec.co.za in May 2019.
This concentration has deep consequences for the communities relying on such activities, particularly rural areas depending on mining operations. Some municipalities have a disproportionately high share of employment in the metals value chain, essentially in mining. It is particularly significant for Thabazimbi (in the Waterberg in Limpopo) with 50% in 2018, Rustenburg (in Bojanala in North West) with 49% and Moses Kotane (also in Bojanala) with 38%. Greater Tubatse (in Sekhukhune in Limpopo) is also notable with 31%, including 7% in metals and metal products – the highest recorded share for downstream metals for any municipality in 2018.7 Other towns with a high share of employment in the metals value chain (above 15% in 2018) include Joe Morolong (in the Northern Cape), Masilonyana and Matjhabeng (in the Free State), Westonaria and Merafong City in Gauteng, City of Matlosana and Madibeng in the North West, and Ba-Phalaborwa in Limpopo.
In most of the smaller towns in the metals value chain, particularly outside Gauteng, virtually all economic activity ultimately depends on the metals value chain. Government and private services, transport and retail activities are essentially serving the people (and their households) that work in the metals value chain. Agriculture and other manufacturing activities are virtually non-existent, as illustrated by Graph 54 for a selected number of municipalities. By contrast, the picture of uMhlathuze, which hosts Richards Bay’s aluminium smelter but has limited mining activity, displays a more diversified gross value added.
7 Historically, some municipalities have had higher shares of employment from metals and metal products, such as Emfuleni (17% in 1993), Sedibeng (14% in 1993 and 1994), uMhlathuze (9% from 1993-1996), Newcastle (10% in 1993), but those have all seen a sharp decline in these shares over the last two decades.

64
Graph 54: Gross value added in selected municipalities (in R millions constant 2010 prices)
PGMs: Rustenburg (Bojanala, NW) PGMs: Greater Tubatse (Sekhukhune, LP)
PGMs: Moses Kotane (Bojanala, NW)
PGMs: Madibeng (Bojanala – NW)
-
10 000
20 000
30 000
40 000
50 000
60 000
70 000
19
93
19
95
19
97
19
99
20
01
20
03
20
05
20
07
20
09
20
11
20
13
20
15
20
17
-
2 000
4 000
6 000
8 000
10 000
12 000
14 000
16 000
18 000
20 000
19
93
19
95
19
97
19
99
20
01
20
03
20
05
20
07
20
09
20
11
20
13
20
15
20
17
-
2 000
4 000
6 000
8 000
10 000
12 000
19
93
19
95
19
97
19
99
20
01
20
03
20
05
20
07
20
09
20
11
20
13
20
15
20
17
-
5 000
10 000
15 000
20 000
25 000
30 000
19
93
19
95
19
97
19
99
20
01
20
03
20
05
20
07
20
09
20
11
20
13
20
15
20
17

65
Iron ore: Joe Morolong (John Taolo Gaetsewe - NC)
Iron ore: Thabazimbi (Waterberg – LP)
Iron ore: Gamagara (John Taolo Gaetsewe
- NC)
Aluminium: uMhlathuze (King Cetshwayo -
KZN)
Source: Calculated from Quantec. EasyData. Interactive database. Dataset on Regional Output and GVA at basic
prices by industry and 2011 local municipal/ward-based metro region level, Accessed at www.quantec.co.za in
August 2019.
As with value added, the concentration of the activities in the metals value chain is reflected by the location of employment in a relatively small number of municipalities. Graph 55 shows the centres for iron ore, gold mining, PGM and copper mining.
-
500
1 000
1 500
2 000
2 500
3 000
3 500
4 000
4 5001
99
3
19
95
19
97
19
99
20
01
20
03
20
05
20
07
20
09
20
11
20
13
20
15
20
17
-
5 000
10 000
15 000
20 000
25 000
30 000
19
93
19
95
19
97
19
99
20
01
20
03
20
05
20
07
20
09
20
11
20
13
20
15
20
17
-
1 000
2 000
3 000
4 000
5 000
6 000
7 000
8 000
9 000
19
93
19
95
19
97
19
99
20
01
20
03
20
05
20
07
20
09
20
11
20
13
20
15
20
17
-
5 000
10 000
15 000
20 000
25 000
19
93
19
95
19
97
19
99
20
01
20
03
20
05
20
07
20
09
20
11
20
13
20
15
20
17

66
Graph 55. Municipalities with high shares of employment in mining, 1995 to 2017 (percentage of employment by stage in the value chain (left axis) and total employment (right axis)) A. Iron ore
B. Gold
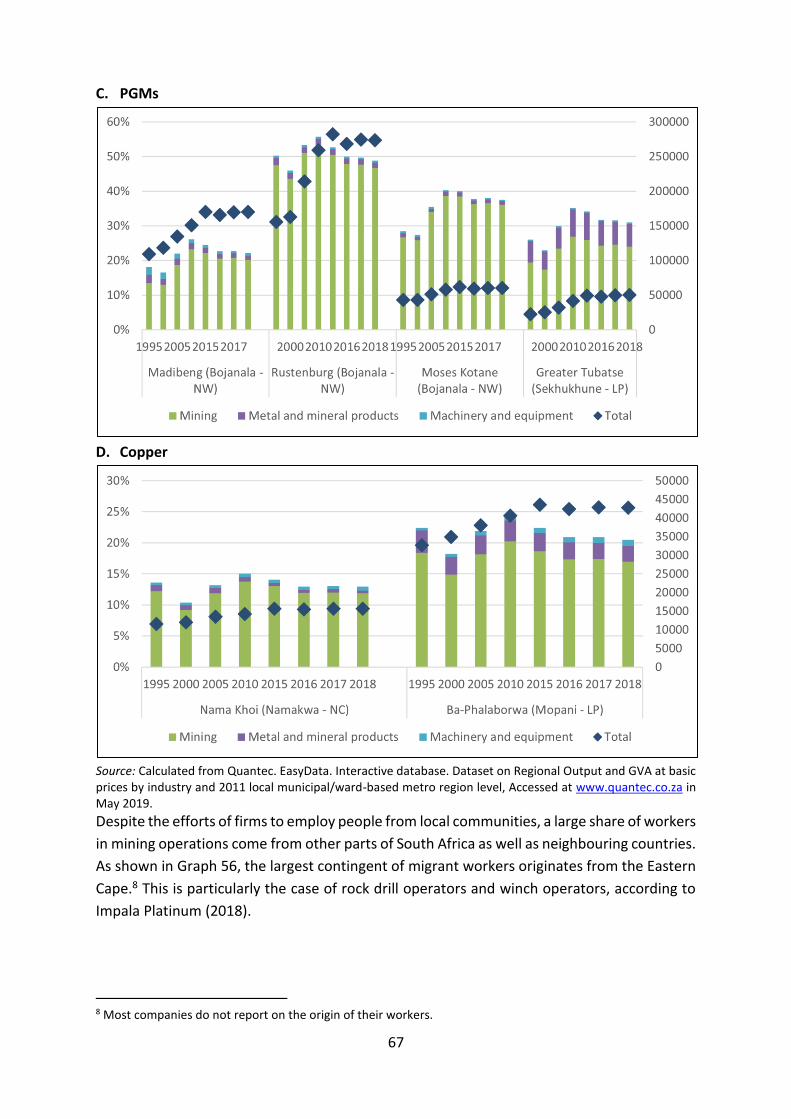
67
C. PGMs
D. Copper
Source: Calculated from Quantec. EasyData. Interactive database. Dataset on Regional Output and GVA at basic prices by industry and 2011 local municipal/ward-based metro region level, Accessed at www.quantec.co.za in May 2019.
Despite the efforts of firms to employ people from local communities, a large share of workers
in mining operations come from other parts of South Africa as well as neighbouring countries.
As shown in Graph 56, the largest contingent of migrant workers originates from the Eastern
Cape.8 This is particularly the case of rock drill operators and winch operators, according to
Impala Platinum (2018).
8 Most companies do not report on the origin of their workers.

68
Graph 56. Origin of workers in Sibanye-Stillwater and Lonmin in 2018 (a)
Note: Non-South African are essentially from Mozambique and Lesotho. Source: Sibanye Stillwater 2018 and Lonmin 2018.

69
5 Petroleum-based transport
Efforts to reduce GHG emissions from transport will most likely affect employment through a shift away from internal combustion engine (ICE) vehicles to electric and hybrid vehicles. Specific measures have included promoting a move away from internal combustion engine (ICE) vehicles to electric vehicles. For instance, major European countries, Japan and China, amongst others, have targeted the elimination of ICE vehicles between 2030 and 2050. In South Africa, efforts have emerged both to promote dual fuel natural gas and diesel for public transport and to encourage electric vehicles.
For jobs in South Africa, these technological shifts have two major implications.
First, a transition to electric vehicles in South Africa itself could affect employment in various segments of the value chain. They include freight and taxi businesses, which employ around 625 000 people; the petrol stations, with around 130 000 jobs; and repairs and maintenance, where around 250 000 people work. The actual impacts would depend both on the rate of change in car technology and on how adaptation is managed.
Second, if there is a significant shift to electric vehicles overseas, the South African auto industry, which has around 100 000 workers, would have to adapt or lose key markets. Currently around over half of autos assembled in South Africa are exported, with half going to Europe. The risk is that if the industry delays adaptation, as it already has with the move to cleaner petroleum, production would contract.
5.1 Scope of the value chain
The petroleum-based transport value chain is depicted in Figure 8 below. The employment-rich sections of the value chain include the manufacture of vehicles; petrol stations; maintenance; and provision of freight and passenger services.
Figure 8: Petroleum-based transport value chain
Providers of personal and freight services are largely small and often informal. In contrast, the auto and petroleum producers are very large, formal businesses, and mostly foreign owned.
5.2 Major trends in the value chain
Economic data are generally less detailed for services than for production of goods. For several elements of the transport value chain, limited disaggregation is available, especially on production trends.
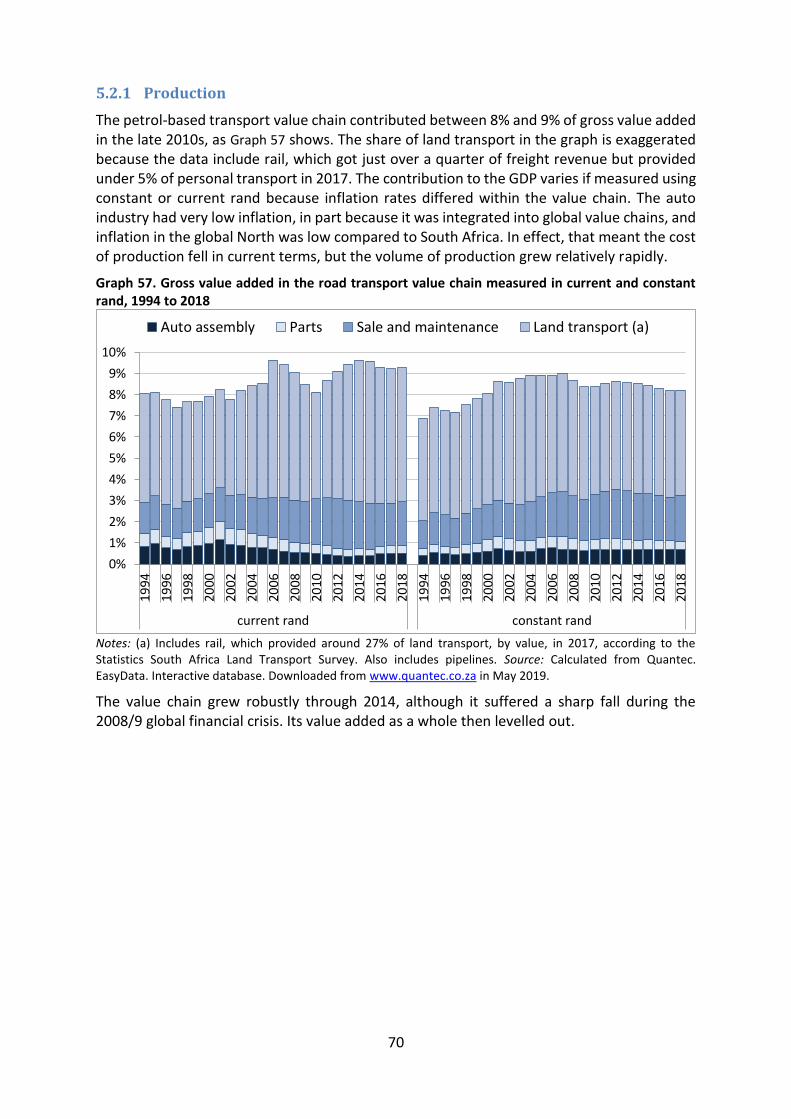
70
5.2.1 Production
The petrol-based transport value chain contributed between 8% and 9% of gross value added in the late 2010s, as Graph 57 shows. The share of land transport in the graph is exaggerated because the data include rail, which got just over a quarter of freight revenue but provided under 5% of personal transport in 2017. The contribution to the GDP varies if measured using constant or current rand because inflation rates differed within the value chain. The auto industry had very low inflation, in part because it was integrated into global value chains, and inflation in the global North was low compared to South Africa. In effect, that meant the cost of production fell in current terms, but the volume of production grew relatively rapidly.
Graph 57. Gross value added in the road transport value chain measured in current and constant rand, 1994 to 2018
Notes: (a) Includes rail, which provided around 27% of land transport, by value, in 2017, according to the Statistics South Africa Land Transport Survey. Also includes pipelines. Source: Calculated from Quantec. EasyData. Interactive database. Downloaded from www.quantec.co.za in May 2019.
The value chain grew robustly through 2014, although it suffered a sharp fall during the 2008/9 global financial crisis. Its value added as a whole then levelled out.
0%
1%
2%
3%
4%
5%
6%
7%
8%
9%
10%
1994
1996
1998
2000
2002
2004
2006
2008
2010
2012
2014
2016
2018
1994
1996
1998
2000
2002
2004
2006
2008
2010
2012
2014
2016
2018
current rand constant rand
Auto assembly Parts Sale and maintenance Land transport (a)

71
Graph 58. Gross value added in the road transport value chain, 1994 to 2018, in billions of constant (2018) rand (a)
Notes: (a) Reflated using GDP deflator, calculated using figures for GVA in constant and current rand and rebased to 2018. (b) Includes rail, which provided around 27% of land transport, by value, in 2017, according to the Statistics South Africa Land Transport Survey. Also includes pipelines. Source: Calculated from Quantec. EasyData. Interactive database. Downloaded from www.quantec.co.za in May 2019.
Within transport services, the bulk of revenue was generated by freight, although, as discussed in the next section, personal transport was far more important for employment and small business. According to Statistics South Africa’s Road Transport Survey, freight consistently accounted for just over 90% of income for road freight in the past decade.
Although it remained relatively small in terms of value add, auto assembly was the fastest growing phase of the value chain from 1994 to 2018. Except in the past four years, it expanded more rapidly than the economy as a whole in constant rand. According to Lamprecht (2019, p.19), exports accounted for over half of the 610 000 units produced in 2018, and two thirds of exports were passenger cars. In contrast to auto assembly, production of parts declined, mostly because it was dominated by catalytic converters. As discussed in the section on the metals value chain, the value of catalytic converters dropped both because of a shift toward electric vehicles and because the amount of new platinum used declined over the past decade.
-
50
100
150
200
250
300
350
400
450
19
94
19
96
19
98
20
00
20
02
20
04
20
06
20
08
20
10
20
12
20
14
20
16
20
18
Land transport (b)
Sale and maintenance
Parts
Auto assembly

72
Graph 59. Average annual growth rates along the road transport value chain in different phases of the growth cycle, 1994 to 2018
Notes: (a) Includes rail, which provided around 27% of land transport, by value, in 2017, according to the Statistics South Africa Land Transport Survey. Also includes pipelines. Source: Calculated from Quantec. EasyData. Interactive database. Downloaded from www.quantec.co.za in May 2019.
5.2.2 Employment
Employment in road transport and supporting services fluctuated between 7% and 8% of total employment over the past decade. It grew fairly in this period, rising from one million in 2008 to 1,2 million in 2017. Transport services accounted for half of employment in the value chain, followed by maintenance and repairs with around a fifth and petrol stations with over a tenth.
Graph 60. Employment in the road transport value chain
Source: Calculated from Statistics South Africa. Labour Market Dynamics Survey 2017. Electronic database. Downloaded from Nesstar facility at www.statssa.gov.za in December 2018.
The share of small businesses – employers and self-employed – in employment in the value chain is relatively high, mostly because of the relatively large informal sector in transport services and maintenance. In maintenance, employers and the self-employed constituted
-4.0%
-2.0%
0.0%
2.0%
4.0%
6.0%
8.0%
10.0%
12.0%
Auto assembly Parts Sale andmaintenance
Land transport (a) all otherindustries
1994 to 2002 2002 to 2011 2011 to 2014 2014 to 2018
480 495 485 490 535 530
555 580
625 100 105 130 135
135 135 110 125
130 225 220
230 255
235 235 215 225
250
135 135 130 140 130 150
135
155
140
115 110 130
110 105 115
90
85 80
-
200
400
600
800
1 000
1 200
1 400
2009 2010 2011 2012 2013 2014 2015 2016 2017
A. In thousands
46% 47%44% 43%
47% 46%
50% 49% 51%
10% 10% 12% 12%12%
11%10% 11% 11%
21% 21% 21% 23% 21%20%
20% 19%20%
13% 13% 12%12% 11% 13% 12% 13% 12%
11% 10% 12% 10% 9% 10% 8% 7% 7%
0%
10%
20%
30%
40%
50%
60%
70%
80%
90%
100%
2009 2010 2011 2012 2013 2014 2015 2016 2017
B. % of total
Assembly and inputs
Sales
Maintenance
Petrol stations
Road transport services

73
over a third of total employment in 2017, compared to around 15% for the national economy. In transport services, the figure was close to a quarter, up from under a fifth a decade earlier.
Graph 61. Employers and self-employed in maintenance and transport services, in thousands and as a percentage of employment in the industry
Source: Calculated from Statistics South Africa. Labour Market Dynamics Survey 2017. Electronic database. Downloaded from Nesstar facility at www.statssa.gov.za in December 2018.
In 2017, the labour force surveys found 200 000 minibus taxi drivers, 160 000 other bus, van and taxi drivers, and 90 000 formal freight drivers in the transport industry. (Calculated from Statistics South Africa 2017) That said, there were over 370 000 heavy vehicles registered for South African roads, suggesting that the figure may be an underestimate. (WOW 2018b, p. 6) In 2018, there were 135 000 registered minibus taxis and perhaps 100 000 more unregistered vehicles (see SA Taxi 2018:5), which aligns reasonably well with the employment findings. Estimates suggested a total of 1,8 people were employed per taxi. (SA Taxi 2018:49)
5.2.3 Spatial distribution of employment
Data on value added by province are not available for most of the industries in the value chain. Employment data, however, show that manufacturing is concentrated in three provinces – Gauteng, the Eastern Cape and KwaZulu-Natal. In contrast, transport services are distributed more in line with the overall population, although Gauteng has a disproportionately large share in virtually every industry in the value chain. In small towns, petrol stations and repair shops are often important parts of the economy.
31%
27%30% 31%
41%
34% 34%
37%40%
37%
19% 19%22% 23% 23% 24%
20%22% 23% 24%
0%
5%
10%
15%
20%
25%
30%
35%
40%
45%
-
20
40
60
80
100
120
140
160
2008
2009
2010
2011
2012
2013
2014
2015
2016
2017
2008
2009
2010
2011
2012
2013
2014
2015
2016
2017
maintenance road transport services
tho
usa
nd
s
self employed
employers
employers & self employed as % of total employment (right axis)

74
Graph 62. Employment in the road transport value chain by province, 2017
Note: (a) Aged 18 to 64. Source: Calculated from Statistics South Africa. Labour Market Dynamics Survey 2017. Electronic database. Downloaded from Nesstar facility at www.statssa.gov.za in December 2018.
5.2.4 Structure of ownership
The structure of ownership in the road-transport value chain is highly diverse, ranging from multinational giants in production to informal self-employed people in maintenance and transport services.
Public transport by road is split between some highly formalised large companies and a host of smaller, semi-formal and informal enterprises. Half of all businesses in road transport in 2017 had under four workers. In contrast, this size enterprise was virtually non-existent in auto manufacturing and constituted around a seventh of businesses in car sales. (Calculated from Statistics South Africa 2017) As discussed below, it appears that most small businesses were minibus taxis.
Almost 90% of the 4 600 petrol stations in South Africa are owned by the major petroleum companies, although there are some smaller regional chains. On average, they earn between 20% and 50% more from sales of on-site grocery stores and fast-food sites. They only sell around half of petrol products, however, as the rest are supplied directly to farmers, government agencies and other major companies by the petroleum refineries. (WOW 2018c, p. 14)
0%
10%
20%
30%
40%
50%
60%
70%
80%
90%
100%
Man
ufactu
re
Sales
Main
ten
ance
/rep
airs
Pe
trol
station
s
Ro
adtran
spo
rt
oth
er e
mp
loye
d
wo
rking-age
po
pu
lation
(a)
Northern Cape
Free State
North West
Mpumalanga
Limpopo
Eastern Cape
Western Cape
KwaZulu-Natal
Gauteng
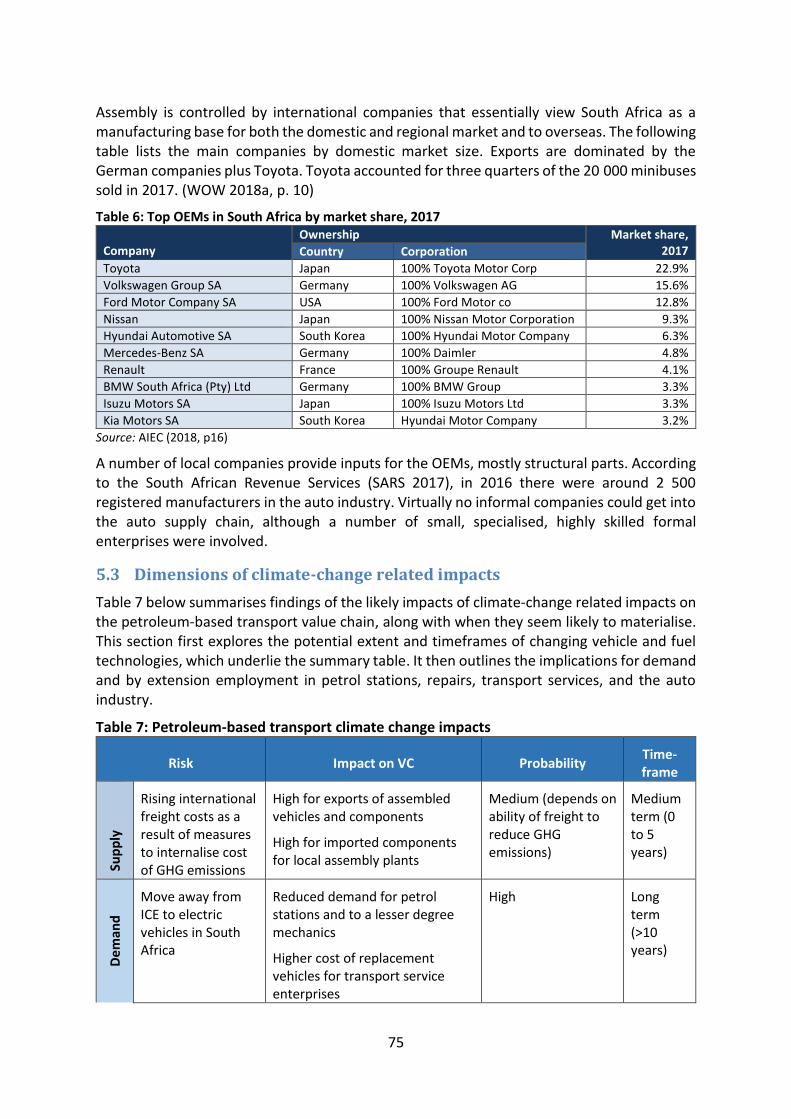
75
Assembly is controlled by international companies that essentially view South Africa as a manufacturing base for both the domestic and regional market and to overseas. The following table lists the main companies by domestic market size. Exports are dominated by the German companies plus Toyota. Toyota accounted for three quarters of the 20 000 minibuses sold in 2017. (WOW 2018a, p. 10)
Table 6: Top OEMs in South Africa by market share, 2017 Company
Ownership Market share, 2017 Country Corporation
Toyota Japan 100% Toyota Motor Corp 22.9%
Volkswagen Group SA Germany 100% Volkswagen AG 15.6%
Ford Motor Company SA USA 100% Ford Motor co 12.8%
Nissan Japan 100% Nissan Motor Corporation 9.3%
Hyundai Automotive SA South Korea 100% Hyundai Motor Company 6.3%
Mercedes-Benz SA Germany 100% Daimler 4.8%
Renault France 100% Groupe Renault 4.1%
BMW South Africa (Pty) Ltd Germany 100% BMW Group 3.3%
Isuzu Motors SA Japan 100% Isuzu Motors Ltd 3.3%
Kia Motors SA South Korea Hyundai Motor Company 3.2%
Source: AIEC (2018, p16)
A number of local companies provide inputs for the OEMs, mostly structural parts. According to the South African Revenue Services (SARS 2017), in 2016 there were around 2 500 registered manufacturers in the auto industry. Virtually no informal companies could get into the auto supply chain, although a number of small, specialised, highly skilled formal enterprises were involved.
5.3 Dimensions of climate-change related impacts
Table 7 below summarises findings of the likely impacts of climate-change related impacts on the petroleum-based transport value chain, along with when they seem likely to materialise. This section first explores the potential extent and timeframes of changing vehicle and fuel technologies, which underlie the summary table. It then outlines the implications for demand and by extension employment in petrol stations, repairs, transport services, and the auto industry.
Table 7: Petroleum-based transport climate change impacts
Risk Impact on VC Probability Time-frame
Sup
ply
Rising international freight costs as a result of measures to internalise cost of GHG emissions
High for exports of assembled vehicles and components
High for imported components for local assembly plants
Medium (depends on ability of freight to reduce GHG emissions)
Medium term (0 to 5 years)
De
man
d
Move away from ICE to electric vehicles in South Africa
Reduced demand for petrol stations and to a lesser degree mechanics
Higher cost of replacement vehicles for transport service enterprises
High Long term (>10 years)

76
Risk Impact on VC Probability Time-frame
Move away from ICE to electric vehicles overseas
Local assembly companies and component producers have to shift to electric vehicles or see decline in exports and production
High Long term (>10 years)
Move toward cleaner fuels internationally
Unless South African refineries invest to meet new standards, which is costly, car exports could be constrained and new models would not be useable in South Africa.
High Already happen-ing
5.3.1 Changes in vehicle technology and fuels
The shift to electric vehicles is most likely to affect employment in transport services and auto manufacturing unless measures are taken to mitigate the effects on demand. That said, the effects of failing to adapt to rising international fuel standards is already having an impact on the local industry.
a. The introduction of electric vehicles
Internationally, efforts to reduce GHG emissions from transport in the long run have focused increasingly on the shift from ICE vehicles to electric vehicles. While specific measures are not always in place, the effort by states especially in Europe and Asia to reduce the share of petroleum and diesel vehicles will undoubtedly have measurable effects by 2030. Countries that have set targets for eliminating auto emissions include: by 2020, South Korea; by 2030, India, the Netherlands, Denmark, Ireland and Slovenia; by 2040, the U.K., China and Spain; and by 2050, Germany. Japan and the U.S. state of California have also committed to ending emissions from cars in the medium term, as have a number of major cities internationally (including Cape Town).
South Africa however lags behind on electric vehicles. According to the former Minister of Transport Blade Nzimande (quoted in Business Tech, 2019), the number of electric vehicles in South Africa rose to 867 in March 2019, an insignificant number compared to the total vehicle population of over 12 million, although the total vehicle figure includes some hybrid vehicles.
Interviews with informants in the auto value chain pointed to debates around when South Africa will shift from ICE to electric vehicles. According to Department of Transport (2018, p.6), South Africa committed to invest US$513 billion between 2010 and 2050 in electric vehicles if adequate financial support is avialable. It also made a commitment to have about 2,9 milion electric vehicles on the road by 2050 (Kings:2017) Interviews with SAPIA and the National Association of Automobile Manufacturers of South Africa (NAAMSA) suggested that South Africa won’t be able to phase out ICE vehicles within the next ten to 15 years unless there are stronger government incentives. SAPIA is of the view that electric vehicles won’t take over the local vehicle market until at least 2030, and probably later.
According to industry paritcipants, the high price of electric vehicles could cause a delay in adopting them. It is compounded by a 23% import tariff on electric vehicles compared to the

77
sliding scale applied on ICE vehicles, with an 18% import tariff on vehicles from the European Union.
A further concern is the mileage range of electric vehicles and the lack of charging infrastructure across the country. South Africa has low population density by international standards, and the relatively long distances between settlements may prove a challenge for electric vehicles, which typically have a limited travel radius compared to ICE.
b. Cleaner fuels
There has been a long-standing move toward higher fuel standards internationally that enable reduced emissions. South Africa has not kept up with these standards, which is becoming a problem for new model cars both for domestic users and for export.
At present, South African refineries produce EU2 enabling petrol and diesel whereas international standards are EU5 or EU6 (Transport Policy, 2019). For local refineries to produce EU5 enabling fuels or as referred to in South Africa, “CF2” for Cleaner Fuels 2, they would need to undergo significant and expensive hardware upgrades, costing on the order of R40 billion (Ihekwoaba:2019). Naamsa argues that South Africa is 15 years behind the global North on fuel standards (Quoted in WOW 2018a, p. 35). According to the Department of Transport (2018, p. 50), only Sasol currently offers fuel at the new standard of sulfur levels below 10 parts per million (ppm).
Low fuel standards domestically already make it more difficult for local manufacturers to export, as vehicles for export require fuel systems able to utilise higher-grade brands. They also force car manufacturers to retrofit vehicles imported to South Africa to operate at the lower fuel standard (WOW 2018a, p. 35).
Although regulations relating to the shift to CF2 were gazetted in June 2012, which the aim of refinery upgrades by July 2017, the deadlines have been postponed indefinitely with no agreement on the cost recovery model. The South African Petroleum Industry Association (SAPIA) had put forward a proposal for a $0.01 fuel levy on each litre of petrol and diesel over a ten year period to allow for the refineries to recoup the cost of upgrades, but the proposal has apparently not gone forward (Oirere, 2017). The National Department of Transport’s Green Transport Strategy offers no other information on cleaner fuels except to say that the Department of Energy is the department mandated to draft the relevant regulations.
The Green Transport Strategy proposes moving especially public transport to natural gas, building on limited existing private-sector efforts to transform taxis into dual-fuel vehicles. It notes that although natural gas is not as clean as renewable energy or pure biogas, it releases less emissions than other fossil fuels. It appears to view this initiative as part of the strategy to grow the biogas industry.
5.3.2 Petrol stations
As use of electric vehicles increases, petrol stations inevitably lose demand. They now make much of their revenue from the attached retail and food outlets, but they still depend on petrol sales to attract customers in the first place.
Even if petrol stations were to provide electric outlets for cars, most electric-vehicle owners currently prefer to charge them at home overnight. Fast chargers, which cut charging time to 30 minutes from at least four hours at home, could mitigate the decline in customers. So could

78
charging stations along long-distance routes. Still, even highly efficient chargers are unlikely to attract customers on the scale of petrol sales for ICE vehicles.
Virtually all petrol stations are franchises of the dominant petroleum companies. Interviews with managers of petrol stations in 2019 clarified that the infrastructure is owned by the holding company. As a result, upgrading the infrastructure is the decision of the holding company. Franchisees essentially have no power to make decisions that could mitigate against job losses. In early 2019, Shell South Africa announced plans to install charging stations at its garages, with the number of installed chargers based on demand (Cokayne, 2019).
In any case, the shift in demand from petrol to electric vehicles is likely to take well over ten years. If the economy maintains a reasonable rate of growth, the normal process of churn in the labour market should permit a gradual movement of people and business owners into different productive activities.
Unlike automotive production, petrol stations are distributed across the country, although urban areas and cities tend to have more petrol stations per square mile compared to rural and township areas. This suggests that job losses will not have a focused impact on any particular communities.
5.3.3 Repairs and maintenance
Electric vehicles require much less maintenance than petrol cars. The reduced costs should increase the efficiency of logistics and moderate prices for commuters. But the maintenance industry, which combines both large formal chains and small informal mechanics, will see a sharp decline in business.
Auto body repair shops not be affected by a move to electric vehicles. They largely form a separate segment of the business from mechanical repairs. Interviews with mechanics indicated that they only deal with mechanical issues, so they would not be cushioned by panel beating work.
As with petrol stations, the relatively long time frame expected for a shift to electric vehicles should give mechanics some time to adapt. As discussed below, a critical question will be the extent to which their relatively high level of skills can be adapted to other industries.
5.3.4 Transport services
Depending on how it is managed, a large-scale shift to electric vehicles will impose costs on providers of both commuter and freight transport. Small and especially very small informal businesses in the industry often do not earn enough for depreciation, making it difficult for them to replace their vehicles under any circumstances. The relatively high price of electric vehicles aggravates this challenge, since it means there is a higher up-front cost even though it is largely offset over time due to lower maintenance costs and longer vehicle life.
As the following graph shows, small business owners in transport services generally earned under R10 000 a month in 2017. There were around 125 000 businesses with fewer than five employees, making up 90% of enterprises in the sector. Around 50 000 were formal and the remaining 70 000 were informal, mostly self-employed. The formal small businesses in transport had median pay of R9000 a month; for the informal sector, the figure was R6000 a month for employers but only R4300 a month for self-employed people. Taken together,

79
these small businesses employed 150 000 people, or around a third of all waged workers in road transport. Another 80 000 worked in companies with between five and 20 employees.
Graph 63. Median earnings and employment of business owners and paid employees in transport services by number of employees, 2017
Source: Calculated from Statistics South Africa. Labour Market Dynamics Survey 2017. Electronic database. Downloaded from Nesstar facility at www.statssa.gov.za in December 2018.
The effects of a move toward electric vehicles on self-employed and small transporters, whether in freight or personal transport, will depend on:
The combination of incentives and sanctions that affect small transport businesses, for instance the effects of the carbon tax, availability of subsidies, regulation of transport vehicles, as well as trends in demand and the price of petrol and electricity;
The time frames involved, as it will be more difficult for businesses to shift rapidly unless initial funding is easily available; and
The clarity of policy and its responsiveness to the economics of the industry, which are fairly murky especially for informal micro enterprises.
The taxi recapitalisation programme points to some of the difficulties involved in promoting a shift in fleet technology for small, largely informal businesses. From 2005 to 2019, the programme partially financed the replacement of 72 000 vehicles, around half the original target. Given a fleet of between 135 000 and 250 000 taxis, that means at most 5% a year were replaced under the programme, which in turn suggests that the average age of vehicles would not have declined at all, although the new taxis are larger and safer. (See SA Taxi 2018:16) In 2019, a new phase of the programme was going to target vehicles that were made before 2007, suggesting that the average age remains around 13 years.
The challenges facing the taxi recapitalisation programme included the following.
9000
12000
4333
6000 60006300 6000
16002600
260035
15
75
10 2
5
300
45
100
25
-
50
100
150
200
250
300
350
0
2000
4000
6000
8000
10000
12000
14000
0 to 4 workers over 4 workers 0 to 1 worker 2 to 4 workers over 4 workers
formal informal
tho
usan
ds
ran
d p
er
mo
nth
owners median earnings employees median earnings
owners (000s, right axis) employees (000s, right axis)

80
There is limited pressure from consumers or costs on taxis to purchase newer, safer vehicles.
Many owners argue that the subsidy, at R120 000 a vehicle in 2019 or around a quarter of the purchase cost, was insufficient to warrant the new investment.
Taxi owners have thin margins because barriers to entry are effectively low, so they often do not earn enough to afford or finance a new vehicle. The monthly instalment on a new vehicle after the initial deposit – often less than 10%, or well below the recapitalisation subsidy level in 2019 - came to almost R15 000 a month over 69 months in 2018, with interest typically running close to 25%. Less than half of applicants were able to access finance from SA Taxi, a dedicated lender (SA Taxi 2018:24 ff).
The Department of Transport also aims to convert taxis to dual natural gas/diesel systems. As with the taxi recapitalisation, it recognises that the shift will have to be financed at least in part by the state, (Department of Transport 2018:37) as taxi drivers have very thin margins and cannot afford the conversion process. In addition, natural gas is cheaper than other fuels. As of early 2019, 1200 taxis or between 0,5% and 1% of the total had been converted to dual-fuel systems. (Frost 2019)
If incentives to promote cleaner energy do not enable adjustment by taxi owners and very small transport enterprises, some job shedding is likely, with a degree of consolidation into larger businesses. But neither the end-state technology nor the combination of subsidies and sanctions has yet been defined. In these circumstances, it is difficult to project either the extent or the potential timeframe of any employment implications.
5.3.5 The auto industry
The decision to build electric vehicles in South Africa will ultimately be taken by the main foreign brands, known as “original equipment manufacturers” or OEMs, rather than by the government. The state can however incentivise and smooth the adjustment, through the carbon tax and other measures that promote domestic demand for electric vehicles as well as through targeted reforms to the overall incentive system for the auto industry.
As the following graph shows, the bulk of South African auto exports go to European countries, many of which have decided to phase out electric vehicles. If the OEMs currently manufacturing in South Africa decide not to upgrade their production lines, South Africa stands to lose export markets especially in the E.U., with little scope for reaching as similar scale in other regions. Additionally, OEMs would likely downsize the production of ICE vehicles in South Africa as the market for these vehicles declines in Souh Africa’s major export destinations.

81
Graph 64. South African exports of cars and goods vehicles by destination, 2018
Source: Calculated from Quantec. RSA Trade HS 8-digit. Interactive database. Downloaded from www.easydata.co.za in October 2019.
Unlike public transportation, automotive manufacturing is fairly concentrated in three provinces - Gauteng, the Eastern Cape and KwaZulu-Natal. The municipalities where the plants are located – mostly Tshwane, Johannesburg, eThekwini, Nelson Mandela Bay and Buffalo City – would likely bear the brunt of plant closures.
The OEMs have not provided public information regarding their intentions. Discussions with Mabasa (2019) suggested that they are yet to make a decision, though the Executive Director of NAAMSA did indicate that they are in the process of producing a position paper on electric vehicles. He also noted that increased exports into the rest of Africa were considered as an option to replace lost markets in Europe and other countries. However, the size of the African vehicle market remains too small to sustain any significant business, and the saturation of second-hand vehicles will pose a challenge.
5.4 Vulnerable groups
The main vulnerable groups in the value chain are employees and small businesspeople in petrol retail, repairs and sale and the transport industry, as well as taxi drivers and auto workers. Except in the case of auto manufacturing, the impact is likely to be dispersed across the country, rather than being focused on a few communities.
The transport value chain has very limited opportunities for women, as the following graph shows. Women constitute just 3% of taxi drivers, 14% of other transport workers, 8% of
Africa 14%
US 4%
Japan 6%
Germany 34%UK 12%
Belgium 8%
Spain 5%
France 2%
other Europe 4% other regions11%

82
mechanics, and between 22% and 33% of transport equipment manufacturing and petrol retail. In contrast, they make up 46% of formal and informal workers in other industries.
Graph 65. Share of women in major components of the passenger transport value chain compared to all other formal and informal employed people, 2017
Source: Calculated from Statistics South Africa. Labour Market Dynamics Survey 2017. Electronic database. Downloaded from Nesstar facility at www.statssa.gov.za in September 2019.
Parts of the value chain – especially minibus taxis and mechanics – are also characterised by a high share of self-employment, mostly in the informal sector. Often these enterprises provide relatively precarious livelihoods, usually poorly paid and low on benefits. As the
33%
22%
14%
8%
3%
46%
0%
5%
10%
15%
20%
25%
30%
35%
40%
45%
50%
petrol retail transportequipment mfg
other roadtransport
auto mechanics informal taxidrivers
other formaland informal
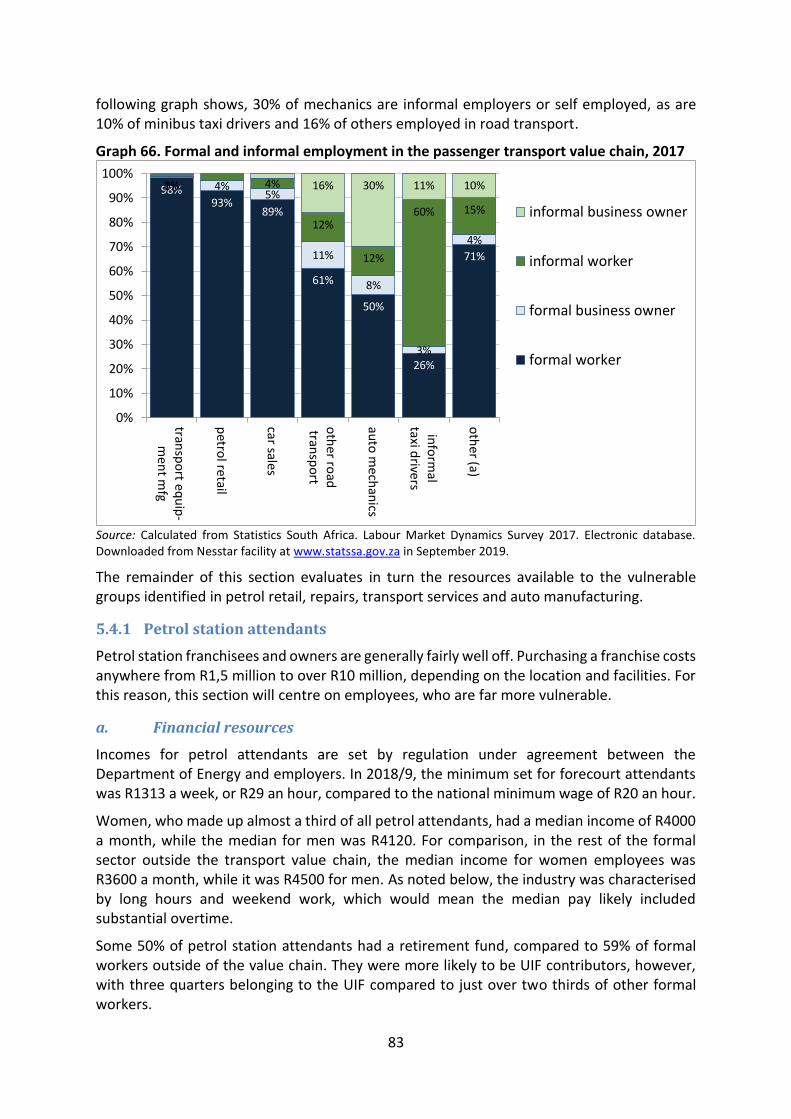
83
following graph shows, 30% of mechanics are informal employers or self employed, as are 10% of minibus taxi drivers and 16% of others employed in road transport.
Graph 66. Formal and informal employment in the passenger transport value chain, 2017
Source: Calculated from Statistics South Africa. Labour Market Dynamics Survey 2017. Electronic database. Downloaded from Nesstar facility at www.statssa.gov.za in September 2019.
The remainder of this section evaluates in turn the resources available to the vulnerable groups identified in petrol retail, repairs, transport services and auto manufacturing.
5.4.1 Petrol station attendants
Petrol station franchisees and owners are generally fairly well off. Purchasing a franchise costs anywhere from R1,5 million to over R10 million, depending on the location and facilities. For this reason, this section will centre on employees, who are far more vulnerable.
a. Financial resources
Incomes for petrol attendants are set by regulation under agreement between the Department of Energy and employers. In 2018/9, the minimum set for forecourt attendants was R1313 a week, or R29 an hour, compared to the national minimum wage of R20 an hour.
Women, who made up almost a third of all petrol attendants, had a median income of R4000 a month, while the median for men was R4120. For comparison, in the rest of the formal sector outside the transport value chain, the median income for women employees was R3600 a month, while it was R4500 for men. As noted below, the industry was characterised by long hours and weekend work, which would mean the median pay likely included substantial overtime.
Some 50% of petrol station attendants had a retirement fund, compared to 59% of formal workers outside of the value chain. They were more likely to be UIF contributors, however, with three quarters belonging to the UIF compared to just over two thirds of other formal workers.
98%93%
89%
61%
50%
26%
71%
4%5%
11%
8%
3%
4%
1% 4%
12%
12%
60% 15%
0% 16% 30% 11% 10%
0%
10%
20%
30%
40%
50%
60%
70%
80%
90%
100%
transp
ort e
qu
ip-
men
t mfg
petro
l retail
car sales
oth
er ro
adtran
spo
rt
auto
mech
anics
info
rmal
taxi drive
rs
oth
er (a)
informal business owner
informal worker
formal business owner
formal worker

84
b. Physical assets
Information on assets of workers by industry is not available. Information on assets owned by average households in the same income category as petrol attendants will be added in the final draft.
c. Human capital
Employers in petrol retail argue that their station attendants generally see the job as a stepping stone to other work or business ventures, often other retail positions. (Interviews conducted in August 2019; see also Business Tech:2018) The median age of a petrol attendant was 36 in 2017, or two years younger than the median for other formal workers, suggesting that there was some validity to this claim.
Like other retail workers, petrol station attendants generally had to have matric, but they lagged other formal workers in their access to post-matric education. Only 5% of petrol attendants had a post-secondary diploma or degree, compared to 25% of other formal workers. Still, half had matric, which generally assists in finding employment.
Graph 67. Education levels of petrol station attendants compared to other formal workers, 2017
Source: Calculated from Statistics South Africa. Labour Market Dynamics Survey 2017. Electronic database. Downloaded from Nesstar facility at www.statssa.gov.za in September 2019.
Occupational data aggregate all retail workers, including petrol station attendants, into a single category. It is therefore not possible to classify their jobs in more detail by skills level.
d. Social capital
Limited information is available on petrol attendants’ social context. In terms of work relationships, one in ten belongs to a union, compared to three out of ten formal workers in the rest of the economy. The industry is covered by a bargaining council, however, so 30% said their wages were set by collective bargaining. Still, most said their wages were set unilaterally by the employer.
45%
50%
3% 1%
39%35%
14%11%
0%
10%
20%
30%
40%
50%
60%
less than matric matric matric plusdiploma/FET
university degree
petrol retail other formal workers

85
Relatively low levels of organisation largely arise from the structure of employment. Only 4% of petrol stations have over 50 employees, and almost two thirds have fewer than 20. Unions generally find it difficult to organise workplaces that are this small.
By most indicators, petrol station attendants enjoyed worker rights on the same level as other formal workers. Seven out of ten petrol attendants said they had a permanent contract, around the norm for formal workers across the economy. Nine out of ten had a written contract, in line with the law. Access to paid vacation and sick leave were at the same level as other formal workers. A slightly smaller share had access to family leave, but petrol attendants were also less likely to be married than other formal workers, which would explain the discrepancy.
Petrol attendants worked a median of 48 hours a week. That was substantially more than other formal workers, who had a median 40-hour work week.
5.4.2 Auto mechanics
Auto mechanics’ resources varied substantially depending on whether they were employed in the formal or informal sector, and whether they worked for a wage or as a small businessman.
a. Financial resources
As shown in Graph 66 above, of the nearly 250 000 auto mechanics working in 2017, just half were formal employees. Almost 20 000 were employers in the formal sector, with very few self-employed. In the informal sector, almost 30 000 were wage workers, but 50 000 were self-employed and 25 000 were employers.
Pay aligned closely with these categories.
Formally employed mechanics had a median wage of R4400 a month in 2017, essentially equal to median pay for all formal men workers. Informally employed mechanics however only earned R3250 a month.
Mechanics who were employers or self-employed earned substantially more, especially in the formal sector. In the formal sector, their monthly pay came to R12 000 a month; in the informal sector, where most business owners worked alone, it was R5000.
Employers and self-employed people, as well as most informal employees, do not have access to an employer-managed pension or provident fund. The Labour Force Survey does not ask if they have any other retirement plans. In 2018, only half of all waged auto mechanics in the formal sector had a retirement fund, and virtually none of those in the informal sector. For other formal employees and agriculture, the figure was 60%.
Only wage workers are able to join the UIF, and most informal employees are not members. In 2017, 75% of formal but only 12% of informal waged mechanics belonged to the UIF. That compared to 68% for other formal workers outside of agriculture, and 19% of informal workers.
b. Physical assets
The relatively large share of auto mechanics who were employers or self-employed meant that they had some capital equipment. Even in the informal sector, they would have at least

86
some tools and often access to workspace. If demand for mechanics’ services decline overall, however, the value of these assets would also fall.
There is no data about the quality or value of mechanics’ assets. In the formal sector, enterprises are relatively large, which suggests they are likely worth substantial amounts. Virtually all formal enterprises in the industry had more than five employees, and almost two thirds had more than ten. In contrast, in the informal sector almost half of mechanics’ businesses report no waged employees at all, and almost all of the rest have fewer than four.
Graph 68. Size of mechanics’ businesses in the formal and informal sector, by number of employees, 2017
Source: Calculated from Statistics South Africa. Labour Market Dynamics Survey 2017. Electronic database. Downloaded from Nesstar facility at www.statssa.gov.za in September 2019.
c. Human capital
Mechanics are considered skilled production workers, but it appears that relatively few of them have completed formal artisanships. As a group, they have low levels of schooling, particularly in the informal sector. In theory, an artisanship would be recorded in the Labour Force Survey as a post-secondary diploma, but in practice very few auto mechanics report having one. Either artisanships are not fully recorded in the survey, or most auto mechanics have had only received uncertified training on the job. The relatively large share of mechanics who did not complete secondary school suggests that the latter is more likely. (See Graph 69)
48%
9%
7%
35%
28%
3%
24%
18%
6% 4%
0%
10%
20%
30%
40%
50%
60%
70%
80%
90%
100%
formal informal
don't know
50 or more
20 to 49
10 to 19
5 to 9
2 to 4
one
none

87
Graph 69. Mechanics and other workers by education level and formal or informal sector, 2017
Source: Calculated from Statistics South Africa. Labour Market Dynamics Survey 2017. Electronic database. Downloaded from Nesstar facility at www.statssa.gov.za in September 2019.
As with assets, the situation was different for formal employers in auto mechanics. In 2017, a third of them had a diploma after matric, presumably an artisanship, while 10% had a university degree. Another quarter had only matric, and almost a third had less.
Some interviewees noted that they did not have knowledge about electric vehicles or access to the cars to learn from them. They saw the lack of knowledge as a barrier to their capacity to adapt. That said, the shift to computerised ICE in the late 1990s and early 2000s was also expected to de-skill many informal mechanics, but most apparently managed to adapt. The core challenge from the introduction of electric vehicles, however, is a potential decline in demand rather than the change in technology.
d. Social capital
The main data available for waged mechanics, as with other employees, relate to the workplace relations. Information on self-employed mechanics is less extensive. It is clear, however, that both employers and workers in the informal sector usually have fewer systems to support collective action.
Virtually no self-employed mechanic in the informal sector belongs to a business association. That contrasts with 36% of employers and self-employed mechanics in the formal sector. For both categories, the figures are lower than for the rest of the formal sector, where in the 47% of business owners belong to an association. In the informal sector outside of mechanics, the figure is 3%.
Similarly, only 1% of waged mechanics in the informal sector said they were union members in 2017. For formal employees, the figure rose to 19% - still far lower than the 35% for formal employees in other industries. There is no bargaining council, so only union members saw their pay set through collective bargaining. In the formal sector, 5% of workers said they did not get any annual increase, as did 11% of informal waged mechanics.
50%
39%
66% 68%
36%
35%
27% 25%10%
14%
5% 5%11%
0%
10%
20%
30%
40%
50%
60%
70%
80%
90%
100%
automechanics
other workers automechanics
other workers
formal informal
other/don't know
university degree
matric plus diploma/FET
matric
less than matric

88
The extent to which waged mechanics enjoyed legal rights on the job also varied sharply between the formal and informal sector. In 2017, three quarters of formal waged mechanics said they had a permanent position, compared to only around one in seven in informal businesses. In the formal sector, four out of five waged mechanics had a written contract; the figure dropped to one in 20 in the informal sector. Two thirds of formally employed mechanics got paid sick leave, while around half got family and vacation leave. These numbers were lower than for other formal emloyees, but they were higher than for the informal sector. Only around one in 20 waged mechanics in informal enterprises got any kind of paid leave.
Auto mechanics’ median age is 48, more than a decade older than the median for other workers. Arguably that also makes it more difficult for them to find new opportunities, but means that they likely have stronger social networks and experience. For instance, only 35% of formally employed auto mechanics do not have a life partner, compared to 47% of other formal workers. In the informal sector, 50% of auto mechanics live without a partner, compared to 55% of other informal workers.
5.4.3 Small transport businesses
Overall, 270 000 people worked as employees or entrepreneurs in very small businesses providing transport services, whether for freight or people. Of these, 85 000 were self-employed and six out of seven were in the informal sector. The employment data do not distinguish between public transport and freight services, but the available data suggest that taxis made up most small transport businesses.9 The analysis here refers to businesses with four employees or fewer unless otherwise noted.
a. Financial resources
Incomes for small business owners and employees in formal road transport were generally lower than in other formal industries. In contrast, in informal road transport, earnings were typically higher than in the rest of the informal sector.
9 There are no reliable data for the number of taxis and the associated employment, but the available data provide a rough benchmark. As noted above, estimates for the number of taxis range from 135 000 registered officially in 2018 to 250 000 estimated by finance suppliers in 2019. The finance suppliers also estimated that there were 150 000 taxi owners in 2019, and cited Gauteng Department of Transport findings that each taxi employed 1,8 people (SA Taxi 2018). The number of taxi owners reported by the industry in itself exceeds the number of small businesses found in transport services by the labour force surveys. In addition, depending on the figure used for taxi numbers, they would have employed between 250 000 and 400 000 people in 2017, or between 50% and 85% of all workers in transport services. The labour force surveys found 125 000 waged minibus taxi drivers (defined as non-metered taxi drivers), but that did not reflect total employment in the taxi industry.

89
Graph 70. Median incomes in rand and employment in thousands (a) for employees and employers by size of enterprise (measured by number employed), road transport and other industries, 2017
Source: Calculated from Statistics South Africa. Labour Market Dynamics Survey 2017. Electronic database. Downloaded from Nesstar facility at www.statssa.gov.za in September 2019.
As with auto mechanics, there is no information on retirement savings for the self-employed or employers in road transport. For businesses with under five workers, only 2% of employees in road transport contributed to a retirement fund, compared to 9% of paid workers in other industries. In terms of unemployment insurance, the figures were 7% for road transport and 24% for other industries.
b. Physical assets
Estimates suggest that around 80% of taxi owners have one vehicle, while another 20% has two or more. (Estimated from SA Taxi 2018:48) The value of each vehicle varied substantially, however, since they ranged from new to well over 12 years old. In theory, owners would get a licence to operate on a given route only if they had a roadworthy certificate, which may explain the high estimates for unregistered vehicles (at least a third of the total).
As noted in Graph 63 above, the median earnings for small business owners in the transport industry appeared too small to cover a new vehicle, assuming they had not set aside savings to cover depreciation.
c. Human capital
The median age of a small business owner in the road transport business was 48 years, compared to 41 years in other industries. Their employees, in contrast, were relatively young, at 33 years old compared to 40 in other small businesses. Most small business owners in road transport had been in the business for over a decade, twice as long as those in other industries.
21 15
68
14 6
301
142
23050100150200250300350400450500
- 2 000 4 000 6 000 8 000
10 000 12 000 14 000 16 000 18 000 20 000
1 to
4
ove
r 4
self-em
plo
yed
1 to
4
1 to
4
ove
r 4
1 to
4
ove
r 4
formal owner informal owner formal employee informalemployee
em
plo
yed
in ro
ad
tran
spo
rt -0
00
sra
nd
pe
r m
on
th
median pay: road transport median pay: other industries
number employed in road transport (000s)

90
Education levels in small business for both employers and workers were generally lower than in larger enterprises. The figures for road transport largely aligned with very small businesses in other industries. Around a third of employers and two thirds of employees in very small road transport enterprises did not have matric, and almost none had proceeded beyond secondary school. Over a tenth of business owners in other industries had a university degree, but they were mostly professionals at the high end of the formal sector. Both employers and workers in larger enterprises were far more likely to have finished matric and to have a post-secondary education.
Graph 71. Education levels in road transport and other industries by size (reflected in number of employees) and ownership status, 2017
Source: Calculated from Statistics South Africa. Labour Market Dynamics Survey 2017. Electronic database. Downloaded from Nesstar facility at www.statssa.gov.za in September 2019.
Owners of very small businesses in the road transport industry split almost evenly between managers and semi-skilled work – the category applied to drivers. In contrast, in the rest of the economy a quarter were highly skilled production workers (usually artisans), with the rest divided between management, sales and unskilled occupations. Nine out of ten employees in very small road-transport businesses said they were semi-skilled, likely drivers.
d. Social capital
In 2017, 60% of small business owners in the road transport industry belonged to a business association, compared to 20% in the rest of the economy. The discrepancy arose from the central role of taxi associations in providing a licence to operate for taxi owners.
To get a legal operating licence for a route (and often to avoid physical attacks), taxi owners had to belong to a taxi association. There were around 1200 associations in 2018, so the average number of members would range between 100 and 200. Taxi associations were allocated routes by the province. In turn, members had to gain approval from the relevant association to get a route operating licence from the state. In addition, SA Taxi, a dedicated
50%45%
20%
67%72%
49%
41%
33%31%
35%
30%21%
38%
35%
11%
10%
20%
3%8%
14%
3%12%
24%
4% 10%
0%
10%
20%
30%
40%
50%
60%
70%
80%
90%
100%
road
tra
nsp
ort
oth
er
tota
l
road
tra
nsp
ort
oth
er
road
tra
nsp
ort
oth
er
under 5employees
over 5employees
under 5employees
over 5employees
owners employees
other/don't know
degree at least BA
matric plus diploma FET
matric
less than matric

91
private financial institution for the industry, requires membership in an association to provide a loan. (SA Taxi 2018:51)
Taxi associations played a central role in negotiating with the state to minimise regulation of the industry, which generally aims at improving safety and securing lower prices for consumers. Protests over the years have related amongst others to route allocation, the extension of public transport in competition with taxis (notably the BRT), police checks on roadworthiness and licencing, and the recapitalisation programme. Belonging to a taxi association may expose members to violence from rival associations, typically around control of routes.
In contrast to small business owners in road transport, few employees were organised. Moreover, only a tenth said they had permanent positions, compared to a quarter of workers in very small businesses in other industries.
In 2017, 3,6% of employees in very small road transport companies belonged to a union, around the same as for similar businesses in other industries. Although they were covered by a wage determination, virtually all said that their employer set their pay unilaterally. One in seven said they did not get a regular salary increase, compared to a tenth of workers in similarly small businesses in other industries.
Just one in ten workers in very small road transport companies had a written contract, compared to one in three in other industries. Around a tenth said they got any kind of paid leave, including sick leave, compared to over a quarter of workers in other very small businesses.
Working hours in the taxi industry were extraordinarily long, pointing to a degree of vulnerability for both owners and workers. In 2017, the median weekly hours of work for owners came to 50 hours and for employees, 60. The figure for employees was around 25% above the norm in other small businesses. These long hours in themselves would make it difficult for workers to develop networks off the job.
5.4.4 The auto industry
In contrast to road transport services, auto production was highly formalised and centred on relatively largely companies in a few metro areas. The analysis here therefore applies to formal employees in the industry.
a. Financial resources
The median employee engaged in the manufacture of transport equipment earned R7200 a month in 2017. That compared to around R4000 for formal workers in the rest of the economy. Four out of five belonged to a retirement fund, and over nine out of ten to the UIF.
b. Human capital
The transport equipment manufacturing industry had fewer employees without matric, but also fewer with post-secondary education, than the rest of the formal sector.
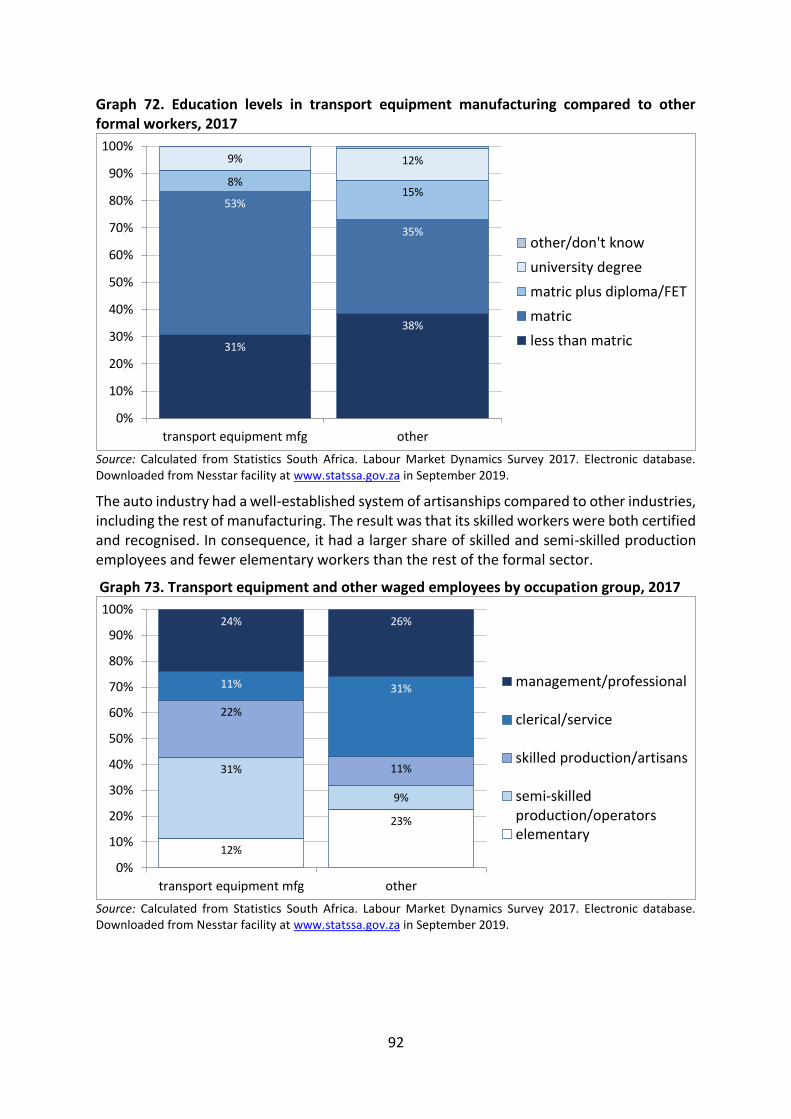
92
Graph 72. Education levels in transport equipment manufacturing compared to other formal workers, 2017
Source: Calculated from Statistics South Africa. Labour Market Dynamics Survey 2017. Electronic database. Downloaded from Nesstar facility at www.statssa.gov.za in September 2019.
The auto industry had a well-established system of artisanships compared to other industries, including the rest of manufacturing. The result was that its skilled workers were both certified and recognised. In consequence, it had a larger share of skilled and semi-skilled production employees and fewer elementary workers than the rest of the formal sector.
Graph 73. Transport equipment and other waged employees by occupation group, 2017
Source: Calculated from Statistics South Africa. Labour Market Dynamics Survey 2017. Electronic database. Downloaded from Nesstar facility at www.statssa.gov.za in September 2019.
31%
38%
53%
35%
8%15%
9% 12%
0%
10%
20%
30%
40%
50%
60%
70%
80%
90%
100%
transport equipment mfg other
other/don't know
university degree
matric plus diploma/FET
matric
less than matric
12%
23%
31%
9%
22%
11%
11% 31%
24% 26%
0%
10%
20%
30%
40%
50%
60%
70%
80%
90%
100%
transport equipment mfg other
management/professional
clerical/service
skilled production/artisans
semi-skilledproduction/operatorselementary

93
c. Social capital
Half of employees in auto manufacturing were union members and said their pay was set through collective bargaining, compared to a third of other formal workers. Virtually none said they did not get an annual increase. Four out of five had permanent employment.
Virtually all workers in the industry said they had a written contract. Some 95% said they got sick leave while 80% said they were entitled to family and paid vacation leave – well above the norm for formal employees in all case.

94
6 Agriculture
The agricultural value chain is, by definition, heavily affected by changes in the climate. It is also one of the most unequal areas of the economy, combining
A strong agro-industrial sector with some of the most productive farms and processing plants in the world,
A largely poorly paid labour force on the farms, with low levels of mobility and limited assets, and
In the historic labour-sending regions (that is, the former so-called “homelands”), reliance by close to two million households on gardening and livestock as a subordinate component in complex livelihood strategies.
The impact of the climate crisis and ability to adapt to it in the agricultural value chain differ substantially between
Workers, emerging farmers, other small businesses and their communities in the formal agro-industrial value chain, and
Households in the historic labour-sending regions.
In addition, the impacts of the climate crisis and the nature of vulnerability vary substantially between horticulture, field crops and livestock farming.
6.1 Trends in the agricultural value chain
This section provides a brief review of the state of the agricultural value chain, outlining key trends in production, exports and employment. These trends are shaped by differences between agro industry and household production, on the one hand, and the three main branches of horticulture, field crops and livestock. After outlining these underlying structures in the value chain, an analysis of economic developments is provided that takes these differences into account.
6.1.1 The structure of ownership and employment
The suppression of African agriculture before 1994 led to deep inequalities in ownership and control across the value chain. We can understand the resulting structure as a split between an internationally competitive agro-industrial sector, on the one hand, and impoverished and largely dysfunctional household production in the historic labour-sending regions. The emergence of formal smallholders has remained very limited. In the historic labour-sending regions, even before the impact of climate change, most households could not survive from farming alone due to lack of land, irrigation, infrastructure and supportive market and training institutions.
Over 90% of agricultural products sold in South Africa’s formal retail outlets in the 2010s came from around 50 000 agro-industrial farms that had around 800 000 employees in 2017. In the mid-2010s, ten agri-businesses with turnover in excess of R100 million a year accounted for between 70% and 80% of company income tax paid in agriculture, forestry and fishing. (Calculated from SARS 2018) In 2016, a third of formal employers in agriculture fell into the highest-earning decile of employed people and half into the highest-earning 30%. Of all formal farm owners, only a quarter were black, and the figure dropped to a fifth for those in the best-off 30% of income earners. (Calculated from Statistics South Africa 2016a)

95
The agro-industrial value chain was even more concentrated in storage, processing and retail. The five largest supermarket chains accounted for almost 60% of income in the industry in 2015. (Statistics South Africa 2017a:20) In food processing, the top five companies accounted for a quarter of total income in 2014, and the top 20 for half. (Statistics South Africa 2016b:33)
At the other end of the scale, most families that undertake any farming work less than half a hectare, and view it as a supplementary activity rather than a central source of income or food. The tendency to equate farming in the historic labour-sending regions with “subsistence” farming in the rest of the Continent is therefore misleading.
In 2018, 1,7 million households in the historic labour-sending regions, or around two out of five, said they did any farming. Of these, only a tenth said it was their main source of food or income. (Calculated from Statistics South Africa 2018) In 2017, of working aged people10 in the historic labour-sending regions, a seventh said they gardened or farmed on their own plots. Half of these, however, worked on them less than three hours a week, and 90% worked fewer than ten hours. (Calculated from Statistics South Africa 2017b)
As Graph 74 shows, Limpopo held almost a third of the 1,7 million households with farms in the historic labour-sending regions. The Eastern Cape and KwaZulu Natal accounted for almost a quarter each.
Graph 74. Households in the historic labour-sending regions that undertook farming activities by province, in thousands of households, 2018
Source: Calculated from Statistics South Africa. General Household Survey 2018. Interactive dataset. Downloaded from Nesstar facility in September 2019.
The agro-industrial value chain differed sharply from the gardening and farming activities in the historic labour-sending regions in terms of access to modern technologies, including irrigation, chemicals and crop varietals, as well as their scale and location. As a result, their ability to adapt to climate change also diverged widely. This chapter therefore distinguishes between the impacts of climate change on these groups of producers.
10 Aged over 18 and under 64 years old
LP530
EC410
KZN400
MP250
NW80
others60

96
6.1.2 Scope of the agricultural value chain
The agricultural value chain encompasses a wide variety of products, which will be affected differently by the impacts of climate change and measures to mitigate it. The three main branches – horticulture, livestock and field crops – are located in different parts of the country; require different kinds of inputs, amounts of water and logistics; will be affected differently by heat, droughts and heavy rain; and may face divergent changes in consumer decisionmaking.
In 2017/8, livestock accounted for around 50% of agricultural production by value, horticulture for just under 30%, and field crops, over 20%. In the past decade, the share of livestock has been fairly stable by value, but horticulture has increased its share from 25%. To date, however, assessments of the impacts of climate change have centred on maize and wheat, although they now account for under 15% of the value of all agro-industrial production by value.
Determining the location as well as the number of people engaged in producing different crops is difficult. Statistics South Africa does not collect as much data on agriculture as on manufacturing and mining. It provides almost exclusively aggregate figures, with little differentiation by product or province. For most data, it only distinguishes between livestock and all crops, combining horticulture and field crops. The national department responsible for agriculture publishes more detail, but only through an annual review and with limited provincial detail.
a. The livestock value chain
Livestock production accounts for over half of the value of all agro-industrial output. It also dominates farming by households in historic labour-sending regions in KwaZulu Natal, the Eastern Cape and the North West.
In agro industry, livestock and dairy products are split primarily between poultry, the largest sector, and beef. In addition, the industry depends heavily on a functional cold chain. South Africa does not export beef, poultry or dairy products on a significant scale; taken together, South African meat exports account for only 0,3% of all South African exports and 0,2% of the global trade in meat. South Africa is however a significant importer of frozen chicken.
The following figure diagrams the livestock value chain. The aggregation leaves out significant differences between types of animal, however. Most important for climate change impacts is that, in agro industry at least, pigs and poultry are raised in increasingly large pens, while other animals graze more extensively for at least part of their lives. Cattle produced for formal sale in South Africa mostly spend almost half their days in feedlots, where they are fattened on maize and soya based feeds. Ownership of feedlots, abattoirs, processing and retailers is far more concentrated than farming. In the poultry industry, most formal farmers are contracted to vertically integrated producers that provide them with inputs and extension support, and take their entire output.
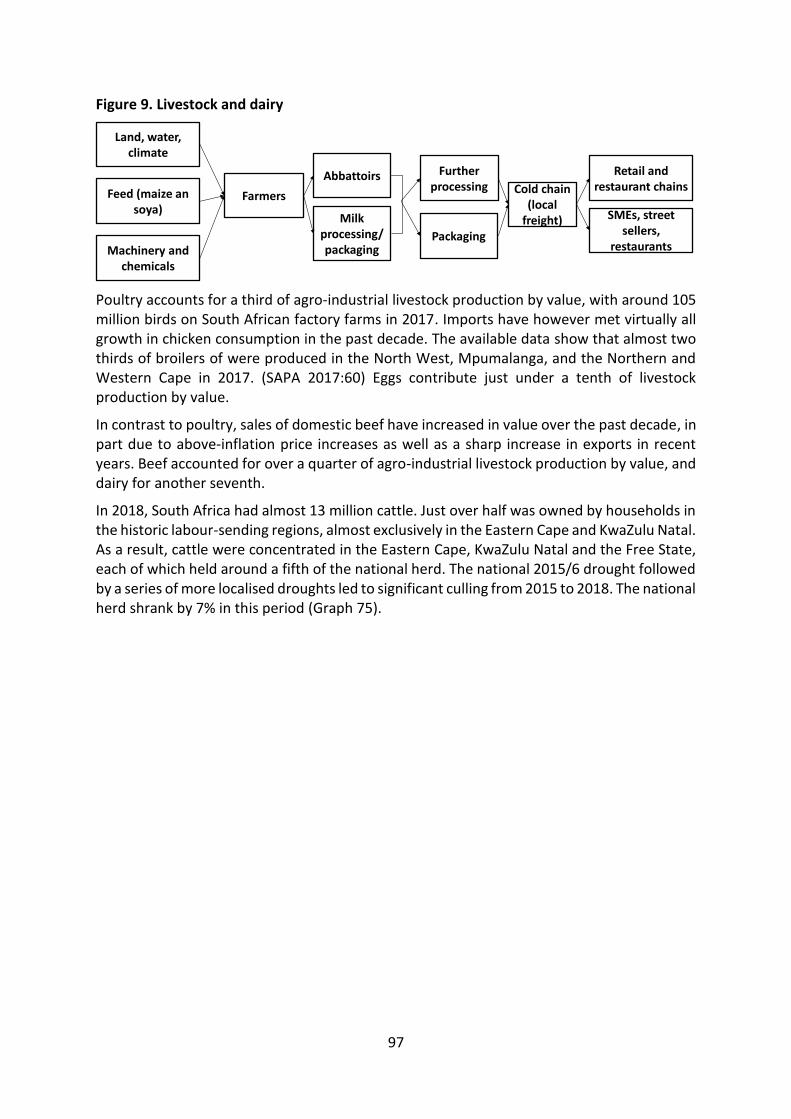
97
Figure 9. Livestock and dairy
Poultry accounts for a third of agro-industrial livestock production by value, with around 105 million birds on South African factory farms in 2017. Imports have however met virtually all growth in chicken consumption in the past decade. The available data show that almost two thirds of broilers of were produced in the North West, Mpumalanga, and the Northern and Western Cape in 2017. (SAPA 2017:60) Eggs contribute just under a tenth of livestock production by value.
In contrast to poultry, sales of domestic beef have increased in value over the past decade, in part due to above-inflation price increases as well as a sharp increase in exports in recent years. Beef accounted for over a quarter of agro-industrial livestock production by value, and dairy for another seventh.
In 2018, South Africa had almost 13 million cattle. Just over half was owned by households in the historic labour-sending regions, almost exclusively in the Eastern Cape and KwaZulu Natal. As a result, cattle were concentrated in the Eastern Cape, KwaZulu Natal and the Free State, each of which held around a fifth of the national herd. The national 2015/6 drought followed by a series of more localised droughts led to significant culling from 2015 to 2018. The national herd shrank by 7% in this period (Graph 75).
Farmers
Land, water, climate
Feed (maize an soya)
Machinery and chemicals
Abbattoirs Further processing
Retail and restaurant chains
SMEs, street sellers,
restaurants
Milk processing/packaging
Cold chain (local
freight)Packaging
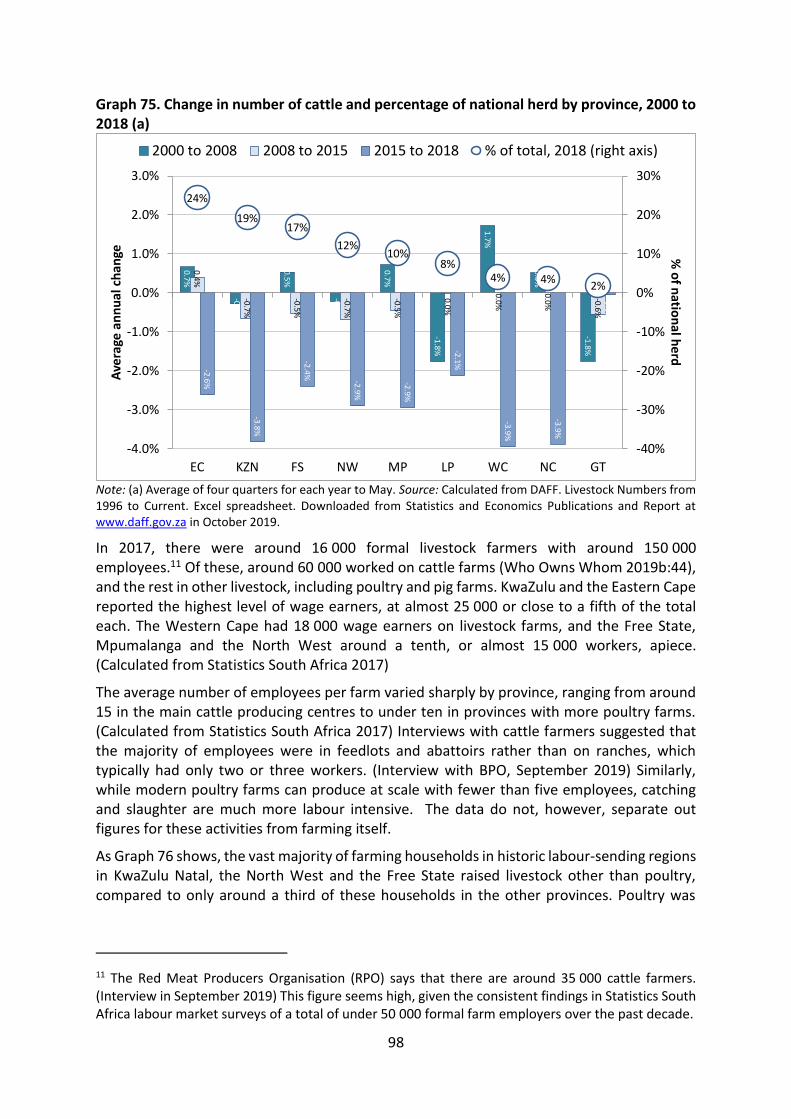
98
Graph 75. Change in number of cattle and percentage of national herd by province, 2000 to 2018 (a)
Note: (a) Average of four quarters for each year to May. Source: Calculated from DAFF. Livestock Numbers from 1996 to Current. Excel spreadsheet. Downloaded from Statistics and Economics Publications and Report at www.daff.gov.za in October 2019.
In 2017, there were around 16 000 formal livestock farmers with around 150 000 employees.11 Of these, around 60 000 worked on cattle farms (Who Owns Whom 2019b:44), and the rest in other livestock, including poultry and pig farms. KwaZulu and the Eastern Cape reported the highest level of wage earners, at almost 25 000 or close to a fifth of the total each. The Western Cape had 18 000 wage earners on livestock farms, and the Free State, Mpumalanga and the North West around a tenth, or almost 15 000 workers, apiece. (Calculated from Statistics South Africa 2017)
The average number of employees per farm varied sharply by province, ranging from around 15 in the main cattle producing centres to under ten in provinces with more poultry farms. (Calculated from Statistics South Africa 2017) Interviews with cattle farmers suggested that the majority of employees were in feedlots and abattoirs rather than on ranches, which typically had only two or three workers. (Interview with BPO, September 2019) Similarly, while modern poultry farms can produce at scale with fewer than five employees, catching and slaughter are much more labour intensive. The data do not, however, separate out figures for these activities from farming itself.
As Graph 76 shows, the vast majority of farming households in historic labour-sending regions in KwaZulu Natal, the North West and the Free State raised livestock other than poultry, compared to only around a third of these households in the other provinces. Poultry was
11 The Red Meat Producers Organisation (RPO) says that there are around 35 000 cattle farmers. (Interview in September 2019) This figure seems high, given the consistent findings in Statistics South Africa labour market surveys of a total of under 50 000 formal farm employers over the past decade.
0.7%
-0.3%
0.5%
-0.2%
0.7%
-1.8%
1.7%
0.5%
-1.8%
0.4%
-0.7%
-0.5%
-0.7%
-0.5%
0.0%
0.0%
0.0%
-0.6%
-2.6%
-3.8%
-2.4%
-2.9%
-2.9%
-2.1%
-3.9
%
-3.9%
-0.1%
24%
19%17%
12%10%
8%4% 4%
2%
-40%
-30%
-20%
-10%
0%
10%
20%
30%
-4.0%
-3.0%
-2.0%
-1.0%
0.0%
1.0%
2.0%
3.0%
EC KZN FS NW MP LP WC NC GT
% o
f natio
nal h
erdA
vera
ge a
nn
ual
ch
ange
2000 to 2008 2008 to 2015 2015 to 2018 % of total, 2018 (right axis)

99
predominant only in the Eastern Cape and the North West, and to a lesser extent KwaZulu Natal.
Graph 76. Share of farming households in historic labour-sending regions growing major products, by province, 2018
Source: Calculated from Statistics South Africa. General Household Survey 2018. Interactive dataset. Downloaded from Nesstar facility in September 2019.
Cattle-owning households in the historic labour-sending regions were located mostly in the Eastern Cape and KwaZulu Natal, where households typically held under six animals. A similar pattern held for goats, but sheep and pigs were almost only owned in the Eastern Cape. Chicken were more evenly distributed, with median holdings by province ranging between nine and 17 birds.
b. The horticultural value chain
The horticultural value chain is represented below in Figure 10. It is distinguished by relatively large exports, equal to almost half of its total production. It depends on temperate climates for major products such as wine and deciduous fruit like peaches and apples.
Figure 10. Horticultural value chain
Deciduous products that require a temperate climate – mostly apples, pears and grapes – constituted 32% of production, down from 36% ten years earlier. The decline resulted primarily from a decline in wine production, which shrank from 11% to 7% of the total. In
530
410 400
250
80
0
100
200
300
400
500
600
700
800
900
0%
10%
20%
30%
40%
50%
60%
70%
80%
90%
LP EC KZN MP NW
tho
usan
ds o
f farms
field crops other livestock
poultry horticulture
total farms in 000s (right axis)
Farmers
Land, water, climate
Chemicals
Machinery
Processing
Cold chain (freight
transport)
Foreign retail chains
Domestic retail chains,
restaurant chains
SMEs, street sellers,
restaurants
Inter-national transport
Packaging
Domestic freight
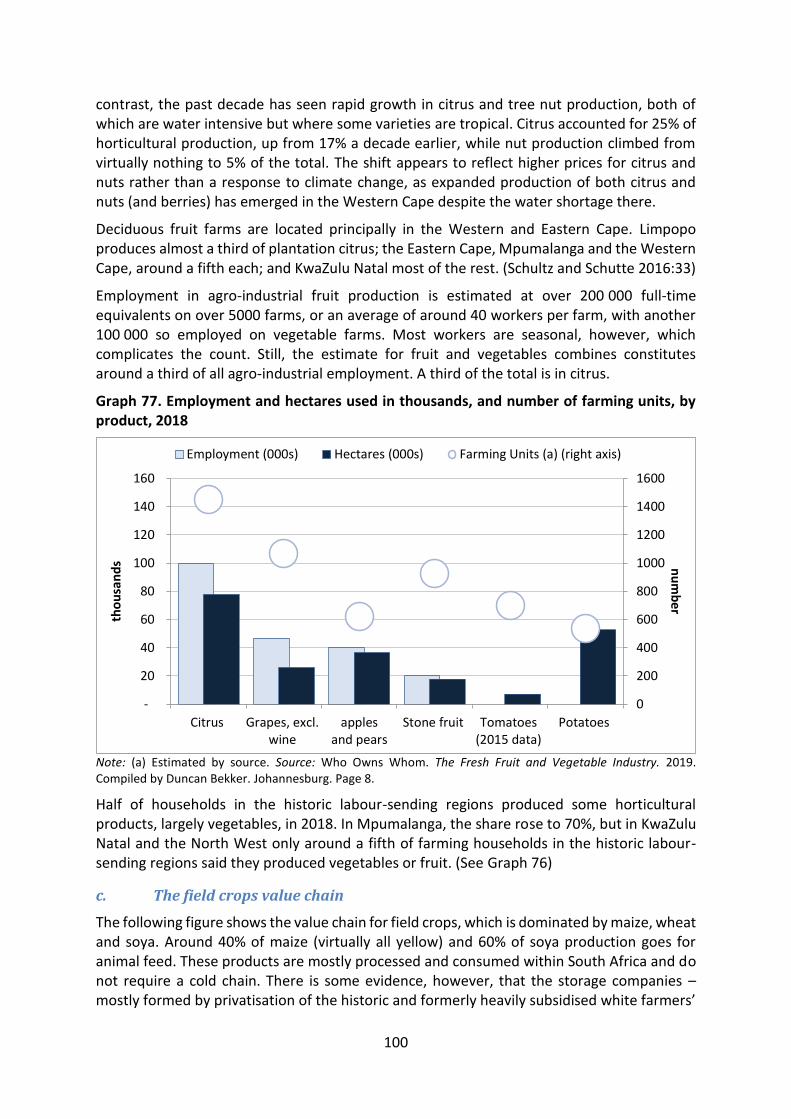
100
contrast, the past decade has seen rapid growth in citrus and tree nut production, both of which are water intensive but where some varieties are tropical. Citrus accounted for 25% of horticultural production, up from 17% a decade earlier, while nut production climbed from virtually nothing to 5% of the total. The shift appears to reflect higher prices for citrus and nuts rather than a response to climate change, as expanded production of both citrus and nuts (and berries) has emerged in the Western Cape despite the water shortage there.
Deciduous fruit farms are located principally in the Western and Eastern Cape. Limpopo produces almost a third of plantation citrus; the Eastern Cape, Mpumalanga and the Western Cape, around a fifth each; and KwaZulu Natal most of the rest. (Schultz and Schutte 2016:33)
Employment in agro-industrial fruit production is estimated at over 200 000 full-time equivalents on over 5000 farms, or an average of around 40 workers per farm, with another 100 000 so employed on vegetable farms. Most workers are seasonal, however, which complicates the count. Still, the estimate for fruit and vegetables combines constitutes around a third of all agro-industrial employment. A third of the total is in citrus.
Graph 77. Employment and hectares used in thousands, and number of farming units, by product, 2018
Note: (a) Estimated by source. Source: Who Owns Whom. The Fresh Fruit and Vegetable Industry. 2019. Compiled by Duncan Bekker. Johannesburg. Page 8.
Half of households in the historic labour-sending regions produced some horticultural products, largely vegetables, in 2018. In Mpumalanga, the share rose to 70%, but in KwaZulu Natal and the North West only around a fifth of farming households in the historic labour-sending regions said they produced vegetables or fruit. (See Graph 76)
c. The field crops value chain
The following figure shows the value chain for field crops, which is dominated by maize, wheat and soya. Around 40% of maize (virtually all yellow) and 60% of soya production goes for animal feed. These products are mostly processed and consumed within South Africa and do not require a cold chain. There is some evidence, however, that the storage companies – mostly formed by privatisation of the historic and formerly heavily subsidised white farmers’
0
200
400
600
800
1000
1200
1400
1600
-
20
40
60
80
100
120
140
160
Citrus Grapes, excl.wine
applesand pears
Stone fruit Tomatoes(2015 data)
Potatoes
nu
mb
erth
ou
san
ds
Employment (000s) Hectares (000s) Farming Units (a) (right axis)

101
co-ops – exercise significant market power, especially in terms of pushing up prices to buyers. (See Ncube et al. 2016)
Figure 11. Field crops (mostly maize, wheat and soya)
The largest single field crop is maize, followed by wheat and soya. Soya has been by far the fastest growing product in recent years, growing fivefold in the past decade, mostly for animal feed.
The Free State produced over 40% of maize from agro-industry in 2017/8, up from just under 30% in 1994. In contrast, the share of the North West has fallen steadily, from 36% in 1980 to almost 30% in 1994 and just 15% in 2017/8. Mpumalanga saw a small fall in its share from 1994, from 26% to 23%. The decline in maize production in the North West is linked in part to falling subsidies, but results at least in part from rising temperatures. (Calculated from DAFF 2018, Table 9)
The Western Cape dominates the (much smaller) wheat crop, accounting for around two fifths of production, with the Northern Cape and the Free State contributing a fifth each. Limpopo’s share has risen from almost nothing to close to a tenth since 1994. (Calculated from DAFF 2018, Table 12)
According to DAFF, Mpumalanga accounted for almost half of soybean production in the early 2010s; the Free State and KwaZulu Natal for just under a fifth each; and Limpopo, nearly a tenth. Around 15% of the total crop is irrigated, although the figure rises to 30% in Mpumalanga. (Schulze 2016a:34-35) Soya has tended to replace sunflower seeds over the past decade.
Data on employment in agro-industrial field crops by product are limited. The branch as a whole apparently employed around 200 000 workers. (Calculated from Statistics South Africa 2018 and Who Owns Whom 2019a:8)
Amongst gardening households in the historic labour-sending areas, maize is the most common crop. Outside of the North West, where it barely features, 60% of households in these regions that undertake farming grow field crops, mostly maize (see Graph 76 above).
6.1.3 Trends in production
The share of agriculture as a whole in the GDP fell from around 4% in the 1994 to just under 2,5% in 2005, then stabilised, as the following graph shows. Food processing has ranked amongst the fastest growing manufacturing industries in recent years, rising from a low of 1.7% of the GDP in 2007 to 2.6% in 2018. In contrast, the share of beverages in the value chain fell slowly but steadily over the past 24 years.
Farmers
Land, water, climate
Chemicals
Machinery
Storage/Milling
Freight transport
Further processing
Animal feed
Domestic retail chains,
restaurant chains
SMEs, street sellers,
restaurants
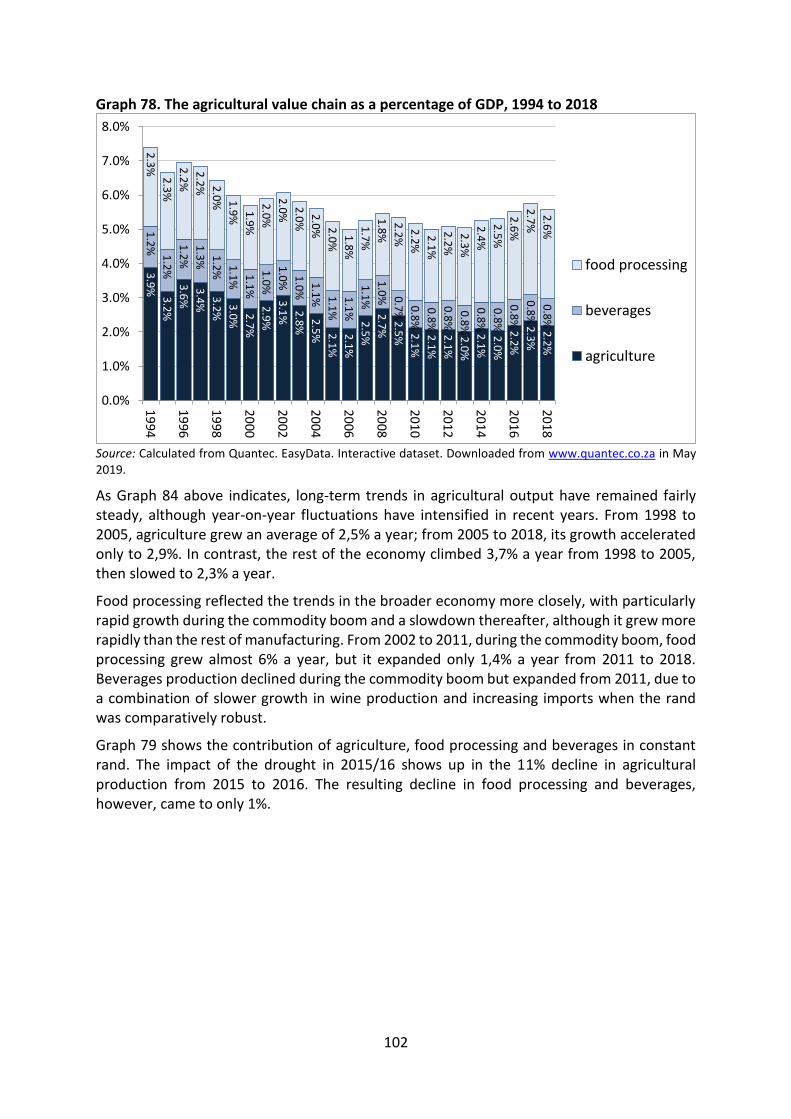
102
Graph 78. The agricultural value chain as a percentage of GDP, 1994 to 2018
Source: Calculated from Quantec. EasyData. Interactive dataset. Downloaded from www.quantec.co.za in May 2019.
As Graph 84 above indicates, long-term trends in agricultural output have remained fairly steady, although year-on-year fluctuations have intensified in recent years. From 1998 to 2005, agriculture grew an average of 2,5% a year; from 2005 to 2018, its growth accelerated only to 2,9%. In contrast, the rest of the economy climbed 3,7% a year from 1998 to 2005, then slowed to 2,3% a year.
Food processing reflected the trends in the broader economy more closely, with particularly rapid growth during the commodity boom and a slowdown thereafter, although it grew more rapidly than the rest of manufacturing. From 2002 to 2011, during the commodity boom, food processing grew almost 6% a year, but it expanded only 1,4% a year from 2011 to 2018. Beverages production declined during the commodity boom but expanded from 2011, due to a combination of slower growth in wine production and increasing imports when the rand was comparatively robust.
Graph 79 shows the contribution of agriculture, food processing and beverages in constant rand. The impact of the drought in 2015/16 shows up in the 11% decline in agricultural production from 2015 to 2016. The resulting decline in food processing and beverages, however, came to only 1%.
3.9%
3.2%
3.6
%
3.4%
3.2%
3.0% 2
.7%
2.9%
3.1
% 2.8%
2.5% 2
.1%
2.1%
2.5%
2.7%
2.5% 2
.1%
2.1%
2.1%
2.0%
2.1%
2.0%
2.2%
2.3
%
2.2%
1.2%
1.2%
1.2%
1.3% 1.2% 1
.1%
1.1
%
1.0%
1.0% 1
.0%
1.1% 1
.1%
1.1%
1.1%
1.0% 0.7% 0
.8%
0.8%
0.8
%
0.8%
0.8%
0.8%
0.8%
0.8
%
0.8%
2.3
%
2.3%
2.2%
2.2
% 2.0% 1.9% 1
.9%
2.0
%
2.0%
2.0%
2.0% 2
.0%
1.8
%
1.7%
1.8%
2.2%
2.2
%
2.1%
2.2%
2.3%
2.4%
2.5%
2.6
%
2.7%
2.6%
0.0%
1.0%
2.0%
3.0%
4.0%
5.0%
6.0%
7.0%
8.0%
19
94
1996
19
98
20
00
20
02
20
04
2006
20
08
2010
20
12
20
14
20
16
20
18
food processing
beverages
agriculture

103
Graph 79. Value added in agriculture, food processing and beverages in billions of constant (2018) rand (a), 1994 to 2018
Note: Rebased from 2010 to 2018 by calculating the GDP deflator for each industry and rebasing it to 2018. Source: Calculated from Quantec. EasyData. Interactive dataset. Downloaded from www.quantec.co.za in May 2019.
Within agriculture, production varied substantially between branches. From 2000 to 2017, horticulture and animal production each grew by around 150% in constant rand terms. In contrast, field crops expanded by only 15%, although with significant fluctuations.
Graph 80. Production by branch in agriculture in billions of constant (2018) rand (a), 2000 to 2017
Note: (a) Deflated with March CPI, rebased to 2018. Source: Calculated from Department of Agriculture, Forestry and Fisheries. Abstract of Agricultural Statistics 2019. Pretoria. Page 75.
The Western Cape and KwaZulu-Natal accounted for over 40% of agro-industrial production in 2018. Food processing and beverages were concentrated in Gauteng, KwaZulu-Natal and the Western Cape, in line with most other economic activities.
- 20 40 60 80
100 120 140 160 180 200 220 240 260
1994
1996
1998
2000
2002
2004
2006
2008
2010
2012
2014
2016
2018
bill
ion
s o
f co
nst
ant
(201
8) r
and
beverages
food processing
agriculture
-
20
40
60
80
100
120
140
16020
00/0
1
2001
/02
2002
/03
2003
/04
2004
/05
2005
/06
2006
/07
2007
/08
2008
/09
2009
/10
2010
/11
2011
/12
2012
/13
2013
/14
2014
/15
2015
/16
2016
/17
2017
/18
bill
ion
s o
f co
nst
ant
(201
8) r
and
Animal production
Horticulture
Field crops

104
Provinces in the west and central areas of South Africa contributed 45% of agricultural production in 2018, compared to 27% of output in other industries. Agriculture comprises a disproportionately large share of provincial value added in the western provinces, especially the Northern Cape, as well as in KwaZulu-Natal. Agriculture, but not processing, is important in the North West and Limpopo. In these provinces, many municipalities have few major activities outside of farming and in some cases a cluster of processing plants.
The agricultural value chain, especially horticulture, was more important for exports than for the GDP as a whole, accounting for over 10% of total foreign sales in the late 2010s. The share of agricultural products rose from 2009 initially because agriculture was less affected by the global financial crisis than heavy industry. Then, when metal prices dropped from 2011, total export revenues declined and the resulting depreciation improved the competitiveness of agricultural and processed food products.
Graph 81. Share of agro-processing in South African exports
Source: Calculated from Quantec. EasyData. Interactive dataset. Downloaded from www.quantec.co.za in May 2019.
Exports of horticulture, which mostly went overseas, outstripped the other agricultural branches. Maize exports vary significantly year on year depending on the size of the crop, typically emerging only when there is a national surplus. Most of the major exports outside of fresh produce and milk products have grown relatively slowly, although red meat expanded rapidly in the past few years.
In 2016, Europe and North America bought a third of South Africa’s exports of fresh and frozen food but only a quarter of processed food – largely in the form of juice and wine. In contrast, neighbouring countries accounted for half of South African exports of processed food compared to only a tenth of fresh and frozen products. China and Hong Kong purchased almost no manufactured agro-products, whether food or industrial goods, and under a tenth of fresh and frozen foods. But they absorbed a quarter of exports of wool, wood and hides.
Data are not available for the value of agricultural production in the historic labour-sending regions.
0.0%
2.0%
4.0%
6.0%
8.0%
10.0%
12.0%
1998
1999
2000
2001
2002
2003
2004
2005
2006
2007
2008
2009
2010
2011
2012
2013
2014
2015
2016
2017
2018
unprocessed
processed,including wine

105
6.1.4 Employment
In 2017, 785 000 people were employed in industrial agriculture, 300 000 in food processing, and 80 000 in the production of wine and other alcoholic beverages. Statistics South Africa found virtually no informal farm employees. Industrial agriculture contributed 5% of total employment and food processing 2% (but over a quarter of manufacturing jobs). As Graph 82 shows, employment in industrial agriculture and food processing climbed by around a quarter from 2010 to 2018. Before 2010, agriculture had shed jobs fairly steadily from the 1980s. The jump in 2015, however, apparently resulted partially from reweighting of Statistics South Africa’s Quarterly Labour Force Survey.
Graph 82. Employment in agriculture and food processing, 2002 to 2017
Source: Calculated from Statistics South Africa. Labour Market Dynamics, 2008 to 2017. Electronic databases. Databases downloaded from Nesstar facility at www.statssa.gov.za.
In the historic labour-sending regions, 1,7 million people were engaged in agricultural production, and 154 000 saw it as their primary source of income or food in 2018.
The share of people in the historic labour-sending regions who undertook any farming dropped from around half in 2010 to two fifths in 2018. The number of people engaged in gardening dropped from almost two million to around 1,7 million in this period. The decline was strongest in Limpopo and the Northwest, presumably at least in part because of the growth in opportunities around the mining towns.
7.2%6.9% 6.8% 6.8%
7.0% 7.2%
6.7%
7.6%7.4% 7.2%
0.0%
1.0%
2.0%
3.0%
4.0%
5.0%
6.0%
7.0%
8.0%
-
200
400
600
800
1 000
1 200
1 400
1 600
2008 2009 2010 2011 2012 2013 2014 2015 2016 2017
tho
usa
nd
s
beverages food agriculture % of total employment (right axis)

106
Graph 83. Number of households and share of total households engaged in farming or gardening in the historic labour-sending regions, 2010 to 2018
Source: Calculated from Statistics South Africa. General Household Surveys for relevant years. Downloaded from Nesstar facility at www.statssa.gov.za as they became available.
6.2 Dimensions of climate-change related impacts
In the agricultural value chain, climate change will have the most direct impact on agriculture, mostly through lower water availability and higher temperatures. For food processing and retail, the effects will emerge predominantly in the form of shortages and higher prices for inputs and ultimately for consumers. Across the value chain, efforts to limit emissions will likely affect the costs of bulk transport and the cold chain.
Significant differences emerge for three branches within the value chain - horticulture, field crops and livestock. They differ in terms of their spatial distribution in South Africa, main markets, inputs and production technologies. As a result, the effects of and responses to climate change will affect them differently.
We can distinguish between risks from climate change itself, which are particularly important for agriculture; policy responses, especially around water use, long-distance freight, packaging and emissions; and consumer responses, which may lead to a preference for local products, a move away from beef, and a tendency to refer less packaging.
6.2.1 Direct impacts
Various factors make it virtually impossible to forecast the impact of climate change on agriculture with much precision. First, South African weather is extremely variable even without climate change, as well as subject to long cycles that complicate mid-term projections. In addition, although climate change has been underway for a century, local trends in rainfall and drought may change as heating persists. Finally, forecasts for climate change typically do not provide estimates except on at least a 20-year time horizon. Moreover, they vary substantially depending on model assumptions and the available data.
1.9 2.1
1.8 2.0 1.9
1.8
1.6 1.8 1.7
52%54%
49%50% 49%
45%
39%42%
40%
0%
10%
20%
30%
40%
50%
60%
-
0.5
1.0
1.5
2.0
2.5
3.0
2010 2011 2012 2013 2014 2015 2016 2017 2018
mill
ion
s o
f h
ou
seh
old
s w
ith
gar
den
s
number (000s) % of households (right axis)

107
(See South African Weather Service 2017; DEA 2018; Schultze 2016) The SJRP will therefore have to build in mechanisms to incorporate changes in outcomes and expectations.
The current modelling (see DEA 2018) suggests that that:
South Africa as a whole has already seen temperatures increase at twice the rate of the globe as a whole, and this trend is likely to continue; and
Temperatures will rise more in the northern interior than along the coast.
Rainfall is likely to decline in the southern Cape by up to 30% by 2050 (GreenCape 2019:10); it might increase in most of the rest of the country except in the north east, while becoming more erratic.
The higher temperatures generally make droughts more likely even if rainfall increases in some areas. In addition, they generate stress for crops and animals, and for farmworkers, and may enable new diseases and pests.
Variable weather has brought sharp fluctuations in agricultural production over the past five years, largely due to an increase in the frequency and intensity of droughts. In Graph 84 below, the steep declines in production are typically followed by a rapid rebound in the following year, leading to considerable variation in the growth rate. As the graph indicates, the severity of the 2015/6 drought was unprecedented in the previous 20 years, while 2018 again saw a decline as a result of regional droughts. According to Green Cape, the 2017/8 drought in the Western Cape saw the loss of 30 000 agricultural jobs, although presumably the bulk were seasonal. (Green Cape 2019:10)
Graph 84. Annual percentage change in value added in agriculture and other industries, 1998 to 2018
Source: Calculated from Quantec. EasyData. Interactive dataset. Downloaded from www.quantec.co.za in May 2019.
The forecast climate change will have differentiated impacts on the different branches of agriculture.
Livestock production will be affected by heat stress for animals as well as veld degradation and fires, and possibly higher feed costs.
-15%
-10%
-5%
0%
5%
10%
15%
20%
25%1
998
199
9
200
0
200
1
200
2
200
3
200
4
200
5
200
6
200
7
200
8
200
9
201
0
201
1
201
2
201
3
201
4
201
5
201
6
201
7
201
8
other sectors agriculture
108
Most of the breeds of cattle and poultry grown commercially were developed in Europe and the U.S. When temperatures rise beyond around 30 degrees, they generally grow more slowly and, in the case of dairy, produce less. Heat stress has already been observed in feedlot cattle in the Northern Cape, the North West and the Free State. Broiler and pig producers also face higher mortality rates unless ventilation is improved and density reduced. (DEA 2014:25)
Even modest droughts aggravate degradation of grasslands, especially where – as in much of the historic labour-sending regions – they are already overstocked. Wild veld fires, which can devastate fodder growth for several years, may also increase with higher temperatures. More severe droughts may mean that cattle owners cannot get sufficient water to maintain their stock.
During droughts, large-scale farmers can usually afford to buy fodder and move their animals between grazing areas. Smallholders are usually harder hit. In severe droughts, both groups end up accelerating sales of cattle as well as higher mortality rates, but small farmers in the historic labour-ending regions lose a larger share of their herds. (See Maluleke and Mokwena 2017:35) The 2015/6 drought saw the early slaughter of around a seventh of South Africa’s cattle. These trends tend to lead to depressed prices during droughts followed by a price surge in the following years while farmers re-stock. In 2019, the spread of the drought to Botswana and Namibia led to a rapid increase in sales of cattle to South Africa, which further depressed the price for local producers.
Livestock are not eligible for insurance against drought or for significant credit from the banks, which increases the impact of drought even on large farmers. The reason is that, given relatively weak traceability systems, farmers can dispose of animals without accounting to creditors and insurers. (Interview with BPO, September 2019)
In horticulture, higher temperatures and the associated heat stress and droughts, as well as shifts in rainfall, will affect production, but the impacts will vary by product.
Even before climate change, South African producers of deciduous fruit faced high temperatures by international standards as well as limited water. Fruit that has been damaged by heat can be sold to processors, but only at a much lower price than fresh sales. (Hortgro Science 2018:30) As early as the 2020s, the area suitable for apples could fall by a quarter, with some farmers shifting to pears, which are more adaptable. (DEA 2014:17; Schulze et al. 2016:28)
The amount of land suitable for wine could fall by over a third in the next 20 years, with vineyards that not have access to irrigation particularly hard hit. Shifting the vineyards to higher ground might be possible in theory, but could prove expensive since new infrastructure and facilities would have to be built. Moreover, tourism constitutes a major source of income for many wine farms, and re-establishing a wine route takes time. Still, the effects of the climate crisis will likely be worse in Europe, Australia and California. As a result, unless international transport costs surge, export demand could improve in the medium term. (DEA 2014:18)
The effects of climate change in the Western Cape could be mitigated through development of more drought-resistant cultivars or shifting to different kinds of produce, for instance from apples to pears. In addition, water-saving and heat-shielding technologies, such as drip irrigation and netting, could be pursued more vigorously. In the vineyards, the share of drip irrigation has now reached around half. (GreenCape 2019:9) But new technologies may
109
require a significant up-front investment. In 2019, Hortgro estimated the cost of irrigation design and materials for new apple and pear plantations at over R35 000 a year, or 8,5% of the total establishment costs for new orchards. In contrast, water itself remained fairly cheap, at just over R2000 a year, making it financially difficult to justify investments. (Hortgro 2019:6)
Citrus requires substantial amounts of water, and some varieties need relatively cool temperatures. As a result, the effects of climate change will differ between Limpopo and southern regions.
In Limpopo, analysis of rainfall over the past century as well as models show lower rainfall but possibly more monsoon floods, which would constrain both citrus and vegetable production. The net impact on the Limpopo River seems important in this regard: if rains increase to the north west of South Africa, as projected, and monsoons move South, it could maintain its flow, allowing farms in the region to bolster. There do not appear to be published studies in this regard, however, and the capital costs of expanding irrigation could also be considerable.
Higher temperatures in the Eastern and Western Cape could necessitate a change in cultivars, increase the need for shad netting, and affect the colour of fruit (higher temperatures bring less bright colours). But some varieties do better at higher heat, and the could replace the current products. (Schultz and Schutte 2016:37ff)
Generally, increased heat leads to new kinds of pests and blights, especially if combined with more humidity. It would also require more consistent and greater cooling during transport after harvest.
For field crops, heat stress is also a factor, although it varies depending on the varietal and crop. Estimates suggest that maize would be more affected than wheat, although the area suitable for wheat would shift toward KwaZulu Natal. Access to irrigation will become increasingly important, but also possibly more difficult as competition for water increases. Soya production could however benefit from the temperature increase, which would make it possible to expand production into areas that were historically considered too cold.
One study projected a decline in maize yields on the order of 25% from the northern Free State through most of the North West and Mpumalanga, but limited impacts in the rest of the country. It also anticipated some improvements in more southerly regions in the Eastern Cape and the Free State that are currently too cold for maize. Still, the net effect would be a decline in maize production to the point where imports would become consistently necessary, resulting in higher food prices. (Johnston et al. 2014:199ff)
6.2.2 Policy impacts
The main policy impacts are likely to emerge around water use; freight and packaging; and emissions from cattle. Again, the implications vary significantly by branch.
a. Water use
Industrial agriculture currently uses between 50% and 60% of available water resources in South Africa. As pressure on water resources rises, households are likely to demand more water at the cost of agriculture. That could lead to higher prices to farmers or to lower allocations. Current estimates suggest that deciduous fruit farms pay only around R2000 a year for water. (Hortgro 2019:6ff) As noted above, water use could be reduced through more efficient irrigation methods, but only for some crops and at a financial cost.

110
b. Fossil fuels
Commercial agriculture and food processing may be affected if carbon taxes and other mitigation measures raise the cost of bulk transport, especially for overseas exports. South Africa’s only large-scale agricultural exports outside of the region are composed mostly of fresh fruit and juices, as discussed above, although beef saw rapid growth in the late 2010s. Transport comes to around 13% of the cost of these exports. (Hortgro 2019:6)
Higher freight costs could also affect imports of agricultural products and foodstuffs. The only bulk imported input for agriculture is soya for animal feed, which is an important cost driver for the livestock branch.
South Africa also imports considerable amounts of wheat, cooking oil and frozen chicken that are important for holding down the prices of staple foods. Local producers could become more competitive if the cost of transport goes up sufficiently.
Formal production in the agricultural value chain depends heavily on electricity for irrigation as well as for the cold chain for fresh fruit, vegetables and meat, and for processing. In addition, it depends on petrochemicals for diesel for farm machinery; products for packaging; and agro-chemicals. Increased costs for fossil fuels will affect costs and productivity through these channels.
c. Consumer demand
On the demand side, agriculture faces substantial shifts as consumers, particularly in the high-income group across the region and the global North, modify purchasing patterns in an effort to mitigate climate change.
Recent U.N. reports have stressed that limiting beef consumption is a central way that individuals can mitigate climate change. (See de Coninck and Revi 2018) As the following graph shows, per person consumption of beef has slowed in recent years, apparently due to a combination of health and environmental concerns. The decline has been sharpest in the E.U. and the U.S.
Graph 85. Per person consumption of beef in kilogrammes, 1980, 2000 and 2016
Source: Calculated from FAO. FAOSTAT. Interactive database. Downloaded from www.fao.org in August 2019.
-
5
10
15
20
25
30
35
40
45
50
World SA OtherAfrica
China Ukraine/Russia
(b)
Brazil Mid East(c)
EU US Other
1980 2000 2016

111
South African beef producers contend that the local industry is not emissions intensive, in part because of the use of feedlots using maize as opposed to open grazing. (Interview with RPO, September 2019; see also Scholtz 2013) Projections by BFAP suggest that, in contrast to the E.U., beef consumption in South Africa will continue to increase over the coming decade, largely because of rising incomes. The best-off 30% of households accounted for over half of demand for fresh meat other than poultry in the mid-2010s. Changes in demand for red meat by this group could therefore drag on sales even if it were offset by increased demand from poorer households as their incomes improve.
Consumers in the global North have also begun to favour local products, in part to limit emissions from bulk transport, under the “locavore” slogan. This trend has already affected South Africa’s wine sales, with a move toward packaging in the U.K. rather than in South Africa justified explicitly as a way to reduce bulk freight. The result was reduced local packaging sales and employment, as well as lower total revenue from wine sales. Unless emissions from long-distance freight are reduced, this trend could affect other South African exports increasingly in the future.
d. Food processing and retail
The main impacts on food processing and retail will derive from higher input costs as a result of changing agricultural conditions, as well as from changes in consumer demand.
Because food is a necessity with relatively inelastic demand, most but not all increases in the cost of agricultural inputs will likely be passed on to consumers. During the 2015/16 drought, the consumer price index (CPI) for food climbed by 12,3% in the year to June 2016, compared to 5,6% for all items. Processed food prices climbed 9,6% while for unprocessed foods they rose 14,9%. Producer prices for agriculture rose 19%, with a 40% increase for cereals.
Shifts in demand away from beef and sheep would have a substantial impact on the meat packaging and processing industry. The effects on retailers would be more limited, however, as consumers will substitute other products with lower emissions, such as chicken, eggs and vegetable proteins.
There could also be intensified pressure on retailers from both consumers to use electricity and packaging more sparingly. For instance, they could put doors on refrigerators and moving to embedded solar-based systems, and to eliminate unnecessary packaging, especially plastics.
As with agriculture, higher prices for fossil fuels would affect processing, transport, the cold chain and packaging for both food manufacturing and retail. In addition to the effects on domestic inputs, costs could rise substantially for producers using chocolate and coffee, which are entirely imported. Higher fuel prices could also affect overseas exports of processed foods, which are dominated by fruit juices and wine. Other processed exports mostly go to the region, and would be less affected.
Finally, efforts to reduce emissions from fossil fuels mean retailers could face higher prices for imports. Finished imported foods are dominated by liquor, cooking oil and frozen chicken. Local products are available but typically at a higher cost or different quality. The socio-economic effects of higher prices for cooking oil and poultry could be significant. Imported frozen chicken has had an important role in moderating the price for low-income households, for which it is the main source of protein.

112
The net impacts on jobs in food processing will likely be fairly small, although the growth in employment could slow down. The most affected groups seem likely to be in meat processing and confectionary.
Because food consumption as a whole is not likely to decline, food retail should not see any major impacts on employment from changes in its product range or cost structure. For this reason, no SJRP will be developed for food retail.
6.2.3 The impact on farmworkers
If droughts or higher temperatures lead to farm closures or consolidation, they would typically result in job losses for farmworkers. For seasonal workers, the decline in employment would appear as a loss of regular employment opportunities rather than dismissal. Droughts could also lead to shorter working time, with a consequent fall in incomes for hourly paid workers. That said, farmers could also maintain or even increase employment if they adapt to climate change, for instance to build and maintain shade netting and irrigation. If a move to precision agriculture requires higher skill levels, however, the existing farmworkers would be unlikely to benefit.
As discussed in section 6.1.4 above, four out of five farmworkers are in horticulture and field crops, which the official labour statistics combine, or on mixed farms. The Western Cape and Limpopo held over two fifths of farmworkers. Both provinces are expected to see increasing droughts as well as higher temperatures with climate change. In contrast, other provinces, and especially the Eastern Cape, could see higher rainfall and improved opportunities for crops.
Specific projections for farmworkers job losses are not possible because both the direct impacts of climate change and producers’ ability to adapt are complex and unpredictable. The multi-year, severe drought in the Western Cape over the past few years indicated the extent and nature of the risks, however. In particular, the drought led to substantial job losses rather than a decline in working time or incomes for employed workers.
From 2015 to 2017, farmworkers in horticulture, field crops and mixed farming, which accounts for 90% of farmworker employment in the Western Cape, saw a net loss of around 40 000 jobs, although there was a modest recovery in 2018. Employment on horticulture, field crops and mixed farms in the province fell by a fifth. As a result, the share of the Western Cape in farmworker employment nationally fell from 32% to 27%. KwaZulu Natal also saw a sharp fall in farmworker jobs in this period, while other provinces were essentially stable. Figures for farmworker employment before 2015 are unfortunately not comparable due to changes in the survey methodology.12
12 Data on farmworker employment over the past decade are marred by a jump of 70%, or 80 000 workers, in figures for the Western Cape from 2014 to 2015. This finding was not supported by a comparable increase in economic activity. Instead, it apparently resulted from changes in the labour force survey weighting frame.
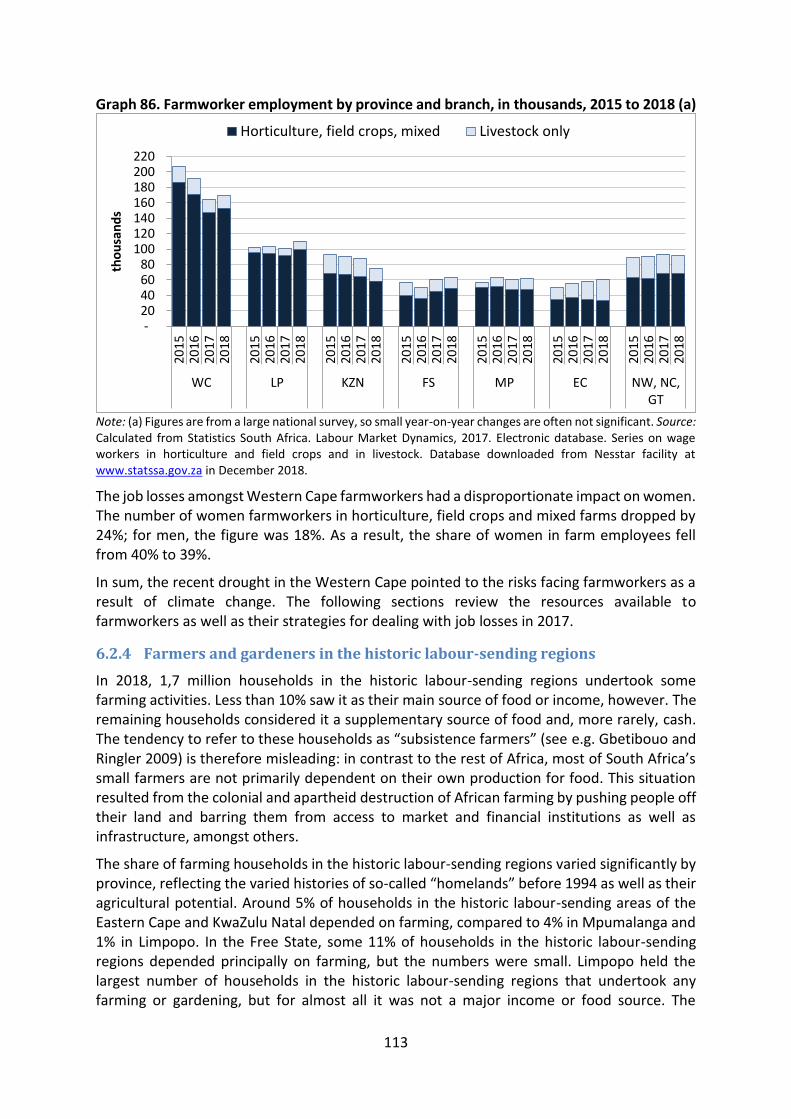
113
Graph 86. Farmworker employment by province and branch, in thousands, 2015 to 2018 (a)
Note: (a) Figures are from a large national survey, so small year-on-year changes are often not significant. Source: Calculated from Statistics South Africa. Labour Market Dynamics, 2017. Electronic database. Series on wage workers in horticulture and field crops and in livestock. Database downloaded from Nesstar facility at www.statssa.gov.za in December 2018.
The job losses amongst Western Cape farmworkers had a disproportionate impact on women. The number of women farmworkers in horticulture, field crops and mixed farms dropped by 24%; for men, the figure was 18%. As a result, the share of women in farm employees fell from 40% to 39%.
In sum, the recent drought in the Western Cape pointed to the risks facing farmworkers as a result of climate change. The following sections review the resources available to farmworkers as well as their strategies for dealing with job losses in 2017.
6.2.4 Farmers and gardeners in the historic labour-sending regions
In 2018, 1,7 million households in the historic labour-sending regions undertook some farming activities. Less than 10% saw it as their main source of food or income, however. The remaining households considered it a supplementary source of food and, more rarely, cash. The tendency to refer to these households as “subsistence farmers” (see e.g. Gbetibouo and Ringler 2009) is therefore misleading: in contrast to the rest of Africa, most of South Africa’s small farmers are not primarily dependent on their own production for food. This situation resulted from the colonial and apartheid destruction of African farming by pushing people off their land and barring them from access to market and financial institutions as well as infrastructure, amongst others.
The share of farming households in the historic labour-sending regions varied significantly by province, reflecting the varied histories of so-called “homelands” before 1994 as well as their agricultural potential. Around 5% of households in the historic labour-sending areas of the Eastern Cape and KwaZulu Natal depended on farming, compared to 4% in Mpumalanga and 1% in Limpopo. In the Free State, some 11% of households in the historic labour-sending regions depended principally on farming, but the numbers were small. Limpopo held the largest number of households in the historic labour-sending regions that undertook any farming or gardening, but for almost all it was not a major income or food source. The
- 20 40 60 80
100 120 140 160 180 200 220
2015
2016
2017
2018
2015
2016
2017
2018
2015
2016
2017
2018
2015
2016
2017
2018
2015
2016
2017
2018
2015
2016
2017
2018
2015
2016
2017
2018
WC LP KZN FS MP EC NW, NC,GT
tho
usa
nd
sHorticulture, field crops, mixed Livestock only

114
Western Cape, Gauteng and the Northern Cape contain very few households in historic labour-sending regions. (See Graph 87)
Graph 87. Households that farmed for their main livelihood or as a supplementary activity, in thousands and as a percentage of all households in the historic labour-sending regions, by province, 2018
Source: Calculated from Statistics South Africa. General Household Survey 2018. Electronic database. Downloaded from Nesstar facility at www.statssa.gov.za in September 2019.
Households in the historic labour-sending regions generally lived with very limited employment opportunities and low incomes. In these areas, only a quarter of working-aged adults said they had any paid employment, compared to half in the rest of the country. The median household income in these areas was just R3230 a month in 2018, compared to R9000 in the rest of the country. (See Graph 88)
1%5% 6%
4%1%
11%
1%
10%
45%49%
33%35%
13%
38%
17%
4%0%
10%
20%
30%
40%
50%
60%
0
100
200
300
400
500
600
LP EC KZN MP NW FS NC GT
tho
usa
nd
s
main livelihood (000s) supplemental activity (000s)
main livelihood - % of all households supplemental - % of all households

115
Graph 88. Number living in historic labour-sending regions by province and median income in historic labour-sending and other regions, 2018
Source: Calculated from Statistics South Africa. General Household Survey 2018. Electronic database. Downloaded from Nesstar facility at www.statssa.gov.za in September 2019.
In these circumstances, gardening typically formed one component of survival strategies that combined multiple activities. As Graph 89 shows, households in the historic labour-sending regions generally combined social grants – the main source of income for most – with limited income from employment and businesses and some gardening. Gardening households in the historic labour-sending regions were somewhat less likely to have wage income and more likely to depend on social grants and to have a (mostly informal) business than their peers without gardens. Generally, households in other parts of South Africa had more wage earners and relied less on social grants than those in the historic labour-sending regions.
5.5
3.2 2.4
3.0 3.5
4.0 3.9
4.1
10.0
7.1
12.8
5.4
7.6
9.9
7.0
4.8 5.8
-
2.0
4.0
6.0
8.0
10.0
12.0
14.0
-
1.0
2.0
3.0
4.0
5.0
6.0
7.0
GT KZN WC EC LP MP NW FS NC
tho
usan
ds
mil
lio
ns
of
ho
use
ho
lds
households in other areas (mns)
households in historic labour-sending regions (mns)
median income in historic labour sending areas (000 rand) (right axis)
median income in other regions (000 rand) (right axis)

116
Graph 89. Sources of income for households by whether or not they gardened and kind of region, 2018
Source: Calculated from Statistics South Africa. General Household Survey 2018. Electronic database. Downloaded from Nesstar facility at www.statssa.gov.za in September 2019.
While 11% of households in the former labour-sending regions with gardens said that farm sales contributed to their earnings, it was the main source of income for only 0,5% in 2018. Almost half of these households said they depended principally on social grants, compared to a quarter of households in the same kind of region who did not garden.
Graph 90. Main source of income for households by whether or not they gardened and kind of region, 2018
Source: Calculated from Statistics South Africa. General Household Survey 2018. Electronic database. Downloaded from Nesstar facility at www.statssa.gov.za in September 2019.
81%
41%
27%
16%11%
4%
54% 54%
24%
9% 2%
37%
72%
13% 14%0%
5%
0%
10%
20%
30%
40%
50%
60%
70%
80%
90%
grant
wages
remittan
ces
bu
siness
farm sales
pen
sion
grant
wages
remittan
ces
bu
siness
pen
sion
grant
wages
remittan
ces
bu
siness
farm sales
pen
sion
former labour sending with garden former labour sendingwithout garden
other areas
47%
27%
12%3%
25% 46%64%
13% 16%7%
8% 6% 9%
4% 5% 6%
0%
10%
20%
30%
40%
50%
60%
70%
80%
90%
100%
with garden without garden all households
labour sending regions Other regions
Other
Farm sales
Business
Remittances
Wages
Pensions
Grants

117
Few families in the historic labour-sending regions had substantial farming operations. Of gardening households in these areas, half spent less than three hours a week on their plots, while only one in ten worked more than seven hours a week. Less than 10% had farmland, and 70% worked backyard plots. The share with farmland ranged from a high of 20% in KwaZulu Natal to around 6% in the Eastern Cape, Mpumalanga and Limpopo, to virtually none in the other provinces. (Calculated from Statistics South Africa 2018)
The impact of climate change on small farmers and gardening households in the historic labour-sending areas will depend largely on where they are located and what they produce. Because of the lingering effects of apartheid residential laws, gardening households were spread unequally across the historic labour-sending regions. As the following graphs show, most of the 154 000 households in these regions that survived principally from farming were in KwaZulu Natal and the Eastern Cape, with 5% in the North West and 8% in Limpopo. For the 1,5 million households in historic labour-sending areas for which farming was a supplementary source of food or income, Limpopo housed a third and the Eastern Cape and KwaZulu Natal almost a quarter each.
Graph 91. Gardening households in the historic labour-sending regions by province and importance of farming for livelihood, 2018
Source: Calculated from Statistics South Africa. General Household Survey 2018. Downloaded from Nesstar facility at www.statssa.gov.za in September 2019.
The main products also varied significantly by region. A million small farmers said they produced field crops; slightly fewer kept cattle or other large animals; 800 000 produced fruit and vegetables; and 750 000 kept poultry. Two thirds of livestock producers in the historic labour-sending regions were in the Eastern Cape and KwaZulu Natal. Farmers in Limpopo and Mpumalanga were more likely to say they produced field or horticultural crops.
Most farms combined products, but the combination varied by province. For the 154 000 farmers who depended primarily on farming, most of those in KwaZulu Natal produced some combination of grain, livestock and poultry; in the Eastern Cape, production centred more on livestock.
Current projections suggest that households in the North West and Limpopo will be most affected by higher temperatures and droughts as the climate crisis intensifies. In contrast, at least in the short run, the Eastern Cape and parts of KwaZulu Natal and Mpumalanga could
NC 0.2% GT 3%NW 5%
FS 6%
LP 8%
MP 15%
EC 26%
KZN 37%
A. Farming is main livelihood (154 000 households)
LP 33%
EC 24%
KZN 22%
MP 15%
NW 5%
FS 2% NC 1%GT 0.1%
B. Farming is supplementary (1,5 million households)

118
get somewhat more rain. That said, virtually all areas will be subject to more extreme weather events, including droughts and floods.
For the historic labour-sending regions, this outlook means that:
Producers who depend principally on farming will face more uncertain weather conditions, with a higher chance of drought in the North West and Limpopo, and
Households that farm or garden as part of livelihood strategies will face somewhat greater food insecurity, again with the harshest effects likely in the North West and Limpopo.
The data do not permit an estimation of the importance of gardening for food security. Farming made no visible difference in the extent to which households said they went short of food for children or adults. As discussed in section Error! Reference source not found. below, households that did not garden generally had more members in paid employment, higher incomes, and a wider range of alternative income sources.
Studies of small farmers in historic labour-sending regions have found that droughts lead to an increase in out-migration to seek work in urban areas, often facilitated by relatives but ultimately unsuccessful; requests for assistance from public authorities, including for community projects and fodder; and cattle culling. One study found that almost two out of five cattle farmers in historic labour-sending regions would be heavily affected by a single year of drought, compared to just one in thirty for commercial farmers. (Quinn et al. 2009:10; Galvin nd:3)
Analysis of the 2012 drought in Giyani found that two villages lost a total of 150 cattle, which was two to three times the normal loss to stock theft. The drought also brought veld fires and degradation. In contrast, flooding and high winds generally affected housing rather than livestock. (Maluleke and Mokwena 2017:28)
A study in Sekhukhune in 2009 found that residents thought it had become dryer and hotter, but they did not have capacity to initiate new farming practices. Limited access to irrigation and long-standing overgrazing aggravated the effects of drought and rising temperatures. Droughts also affected food security by raising the price of maize bought for food. (Quinn et al. 2009:8)
6.3 Vulnerable groups
The most vulnerable groups in the agricultural value chain are
Farmworkers,
Producers in the historic labour-sending regions, and
Relatively remote communities that depend on industrial agriculture.
This section analyses the threats faced by the first two groups as a result of climate change, and the resources they have in meeting them. An analysis of the impacts on rural communities will be undertaken in the next phase.
6.3.1 Farmworkers
Farmworkers find it particularly difficult to adapt to job losses for a variety of reasons. Most have limited savings and assets, and often their housing is conditional on their jobs; education

119
levels are lower than for other formal employees; and most are not members of unions or civic groups. In addition, many live on farms that are far from urban centres, making it difficult to find new employment without moving.
This section first reviews the potential for job losses in agro industry and then the different types of resources farmworkers have to adapt to them.
6.3.2 Farmworkers’ resources
Farmworkers had remarkably limited resources to respond to job losses. Their financial position, education and organisational levels were all far worse than other formal employees. Moreover, most lived in housing that was tied to their work, which meant that losing their jobs also left them homeless. Finding alternative employment was particularly difficult because most farms are far from economic centres.
This section draws on information from labour force surveys and a Western Cape census of farmworkers to outline the resources available to farmworkers. In addition, it analyses findings from the General Household Survey. The survey does not distinguish farmworkers from others, so it utilises a set of households in the poorest 70% with at least one employed person in the commercial farming areas as an approximation for farmworker households. The discussion here will refer to this group as “farmworker households” but it should be borne in mind that it is only an approximation.
In 2017, 425 000 households in the commercial farming areas were in the “farmworker” group. That equalled 7% of all households in the group. In contrast, only 3% of richer households with wage income lived in the commercial farming areas. This discrepancy reflected the unusually stark inequalities in agriculture.
Women farmworkers generally had fewer resources than men. Women made up only 31% of formal farmworkers, compared to 42% of other formal employees. The low share resulted because only 15% of farmworkers in livestock farming were women, compared to 43% in field crops and horticulture.
a. Financial resources
Median earnings for farmworkers came to R2500 a month for women in 2017, and R2800 for men. For other formal employees, the median for women was R4000 a month, and R5000 for men. In other words, the median woman farmworker earned 56% as much as her counterpart in other formal industries, while the median man earned 63%. The gender pay gap in farming was lower than in the rest of the economy, in part because differentials are generally lower within industries than between them.
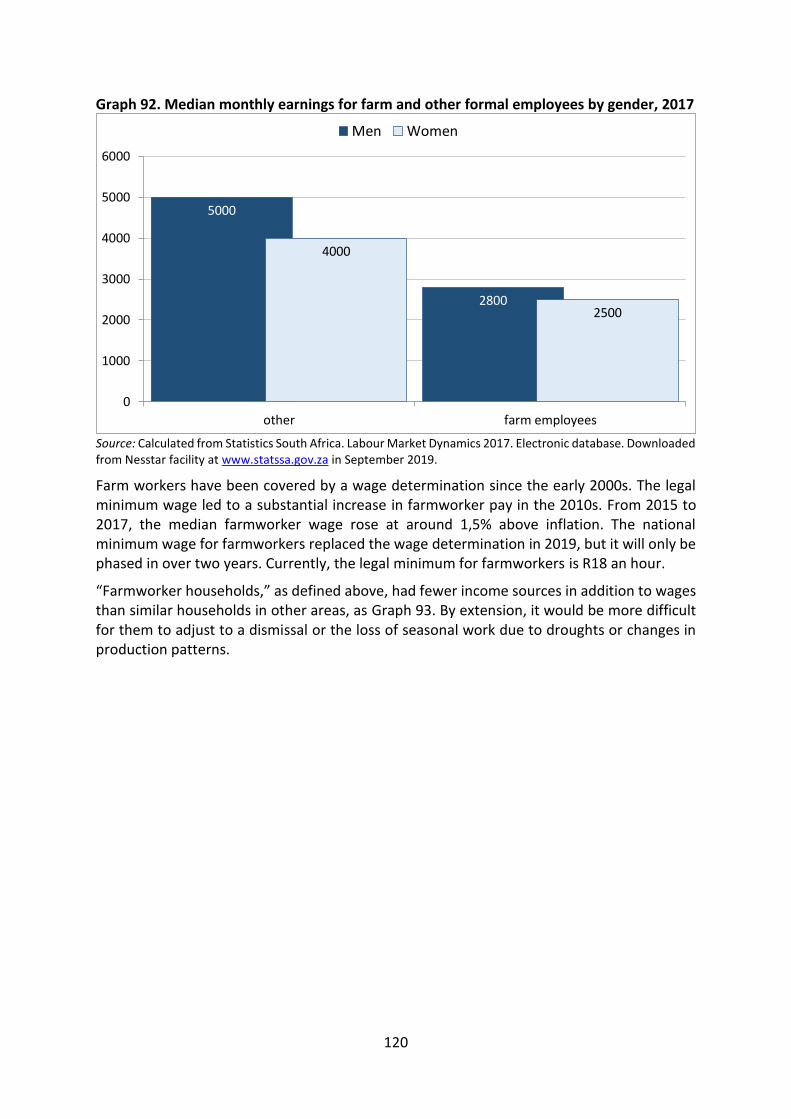
120
Graph 92. Median monthly earnings for farm and other formal employees by gender, 2017
Source: Calculated from Statistics South Africa. Labour Market Dynamics 2017. Electronic database. Downloaded from Nesstar facility at www.statssa.gov.za in September 2019.
Farm workers have been covered by a wage determination since the early 2000s. The legal minimum wage led to a substantial increase in farmworker pay in the 2010s. From 2015 to 2017, the median farmworker wage rose at around 1,5% above inflation. The national minimum wage for farmworkers replaced the wage determination in 2019, but it will only be phased in over two years. Currently, the legal minimum for farmworkers is R18 an hour.
“Farmworker households,” as defined above, had fewer income sources in addition to wages than similar households in other areas, as Graph 93. By extension, it would be more difficult for them to adjust to a dismissal or the loss of seasonal work due to droughts or changes in production patterns.
5000
2800
4000
2500
0
1000
2000
3000
4000
5000
6000
other farm employees
Men Women
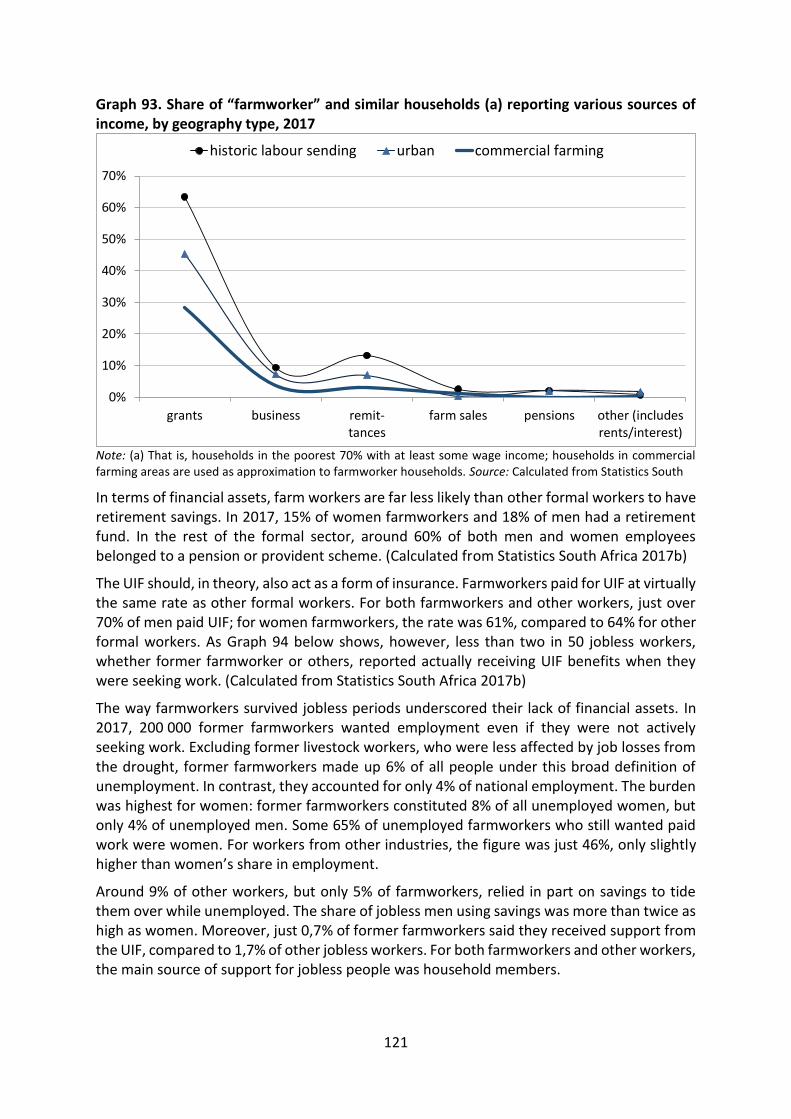
121
Graph 93. Share of “farmworker” and similar households (a) reporting various sources of income, by geography type, 2017
Note: (a) That is, households in the poorest 70% with at least some wage income; households in commercial farming areas are used as approximation to farmworker households. Source: Calculated from Statistics South
In terms of financial assets, farm workers are far less likely than other formal workers to have retirement savings. In 2017, 15% of women farmworkers and 18% of men had a retirement fund. In the rest of the formal sector, around 60% of both men and women employees belonged to a pension or provident scheme. (Calculated from Statistics South Africa 2017b)
The UIF should, in theory, also act as a form of insurance. Farmworkers paid for UIF at virtually the same rate as other formal workers. For both farmworkers and other workers, just over 70% of men paid UIF; for women farmworkers, the rate was 61%, compared to 64% for other formal workers. As Graph 94 below shows, however, less than two in 50 jobless workers, whether former farmworker or others, reported actually receiving UIF benefits when they were seeking work. (Calculated from Statistics South Africa 2017b)
The way farmworkers survived jobless periods underscored their lack of financial assets. In 2017, 200 000 former farmworkers wanted employment even if they were not actively seeking work. Excluding former livestock workers, who were less affected by job losses from the drought, former farmworkers made up 6% of all people under this broad definition of unemployment. In contrast, they accounted for only 4% of national employment. The burden was highest for women: former farmworkers constituted 8% of all unemployed women, but only 4% of unemployed men. Some 65% of unemployed farmworkers who still wanted paid work were women. For workers from other industries, the figure was just 46%, only slightly higher than women’s share in employment.
Around 9% of other workers, but only 5% of farmworkers, relied in part on savings to tide them over while unemployed. The share of jobless men using savings was more than twice as high as women. Moreover, just 0,7% of former farmworkers said they received support from the UIF, compared to 1,7% of other jobless workers. For both farmworkers and other workers, the main source of support for jobless people was household members.
0%
10%
20%
30%
40%
50%
60%
70%
grants business remit-tances
farm sales pensions other (includesrents/interest)
historic labour sending urban commercial farming

122
Graph 94. Sources of support mentioned by jobless farm and other workers, by gender, 2017 (a)
Note: (a) Respondents could give more than one answer. Source: Calculated from Statistics South Africa. Labour Market Dynamics 2017. Electronic database. Downloaded from Nesstar facility at www.statssa.gov.za in September 2019.
“Farmworker households” had a median income of R2900 a month in 2017. Some 44% had no bank account, around the same share as in historic labour-sending areas but substantially higher than the 33% figure for similar households in urban areas. Only one in ten had an investment account, or around half the ratio for similar urban households. (Calculated from Statistics South Africa 2017c)
b. Physical assets
The main physical asset for most low-income South African households is their homes, since very few own land or capital. Farmworkers, however, mostly lived in housing that was tied to their work. They could not buy their homes and, if they lost their jobs, could be evicted after 30 days’ notice.
As the following graph shows, half of “farmworker households” lived in rent-free housing and only a quarter owned their homes. In contrast, in the urban areas, two out of five similar households owned their homes and only one in five lived in rent-free housing. Over 50% of “farmworker households” lived in two rooms or less, compared to 40% of similar urban households and under 20% of those in historic labour-sending regions (where most houses were “traditional”). One in 20 “farmworker households” had a geyser, compared to over one in ten similar households in the urban areas and almost none in the historic labour-sending regions.
0%
10%
20%
30%
40%
50%
60%
70%
80%
familymembers
Child SupportGrant
otherpeople
savings welfaregrants
pension UIF
Other men Other women Farmworkers men Farmworkers women

123
Graph 95. Basis for home occupancy in “farmworker” and similar households (a), 2017
Note: That is, households in the poorest 70% with at least one employed person; households in commercial farming areas are used as approximation to farmworker households. Source: Calculated from Statistics South Africa. General Household Survey 2017. Electronic database. Downloaded from Nesstar facility at www.statssa.gov.za in September 2019.
Around a tenth of households said that they had their own farming activities to supplement their incomes, compared to one in 30 urban households but over a third of households in the historic labour-sending regions. For farmworker households, losing their homes also meant losing this source of food and recreation. Less than half a percent of the proxy households said they had received land as part of a land reform programme; for the richest 30% of households in commercial farming areas, the figure rose to 2,1% - far higher than for any other group or area.
Cars are the second most important asset for most low-income households. In 2017, 8% of the proxy households owned a car. In urban areas, 13% of similar households had a car, and in the historic labour-sending areas the figure was 9%.
c. Human capital
Farmworkers had far lower levels of formal education than other formal workers. As the following graph shows, less than one in seven had matric or more. Over a third had only primary, and half had some secondary. As a result, although farmworkers comprised just 6% of all formal workers, they made up over a third of those without primary.
51%
18%16%
24%
37%
10%
24%
43%
74%
0%
10%
20%
30%
40%
50%
60%
70%
80%
Commercial farming Urban Historic labour sending
occupied rent free rented owned

124
Graph 96. Levels of education for farmworkers and other formal workers, 2017
Source: Calculated from Statistics South Africa. Labour Market Dynamics 2017. Electronic database. Downloaded from Nesstar facility at www.statssa.gov.za in September 2019.
While farmworkers had lower education levels than other workers, that does not fully explain their lower pay. In 2016, a fifth of formal farmworkers had matric or further education, compared to two thirds of other formal workers. But median pay for farmworkers with matric or more was under R3000 a month, compared to over R6000 for workers with similar education levels in the rest of the formal economy.13
Amongst farm workers, 90% of women and 70% of men were in jobs that required no formal training – that is, jobs classed as “elementary”. While this kind of job may require considerable skills gained through experience and informal training, those competencies are not certified. This system makes it difficult for farmworkers to find alternative employment if they lose their jobs. In formal employment outside of farming as a whole, just 19% of women and 17% of men were in elementary occupations.
13 Calculated from Statistics South Africa. Labour Market Dynamics 2016. Electronic database. Series on education status, formal sector including agriculture, and main industry. Downloaded from Nesstar facility at www.statssa.gov.za in December 2017.
37%
50%
10% 1%6%
28%
38%
28%
34%
11%
2% 0%
7%
0%
10%
20%
30%
40%
50%
60%
primary or less some secondary matric post secondary other
% of farmworkers
% of other formal employees
farmworkers as % of all formal employees

125
Graph 97. Farm workers and other formal employees by occupation, 2017
Source: Calculated from Statistics South Africa. Labour Market Dynamics 2017. Electronic database. Downloaded from Nesstar facility at www.statssa.gov.za in September 2019.
d. Social capital
Farmworkers appear more weakly integrated into society than other formal workers as a result of both lower levels of education and because they live on farms. Their limited ties appear in unstable employment relations, low levels of organisation, and inadequate observance of labour rights. They also emerge in the unusually large share of farmworkers who live in one or two person households and their low levels of access to communications and social services. Farmworkers’ comparatively limited access to social grants and remittances also points to comparatively weak social support.
Farmworkers were far more likely than other formal workers to have a temporary or seasonal job. In 2017, 70% of other formal employees had permanent positions. For farmworkers, 57% of men and just 41% of women had permanent jobs.
Farmworkers’ position was further weakened by low levels of union membership. Only one in 20 farmworkers belonged to a union in 2017, compared to around a third of other formal workers.
Farmworkers’ dependence on seasonal work as well as low levels of organisation meant they were more likely than other workers to get no annual increase at all, especially if they were women. If they got an increase, it was mostly set unilaterally by the employer (Graph 98).
0%
10%
20%
30%
40%
50%
60%
70%
80%
90%
100%
Women Men Women Men
farm workers other formal employees
managers and professionals
clerical and service workers
skilled production workers
operators
elementary workers

126
Graph 98. Share of farmworkers and other formal employees involved in collective bargaining and other processes for setting annual increase, 2017
Source: Calculated from Statistics South Africa. Labour Market Dynamics 2017. Electronic database. Downloaded from Nesstar facility at www.statssa.gov.za in September 2019.
The combination of insecure and seasonal employment with low levels of unionisation also meant that a relatively large share of farmworkers did not enjoy the basic conditions of employment required by law. As Graph 99 shows, farmworkers were less likely than other formal workers to have a written contract or get paid leave – both of which are required by the law. Except for family leave, women farmworkers were less likely than men to get paid time off.
Graph 99. Share of farmworkers and other formal employees with written contracts and paid leave, 2017
Source: Calculated from Statistics South Africa. Labour Market Dynamics 2017. Electronic database. Downloaded from Nesstar facility at www.statssa.gov.za in September 2019.
0%
10%
20%
30%
40%
50%
60%
70%
80%
Women Men Women Men Women Men
no regular increment unilateral by employer collective bargaining
farmworkers other formal
0%
10%
20%
30%
40%
50%
60%
70%
80%
90%
100%
written contract sick leave annual leave family leave
other formalemployees - women
other formalemployees - men
farmworkers - women
farmworkers - men

127
The data also show that older farmworkers are more likely to be single than other workers, with a higher share that never married or lost their partner. Younger farmworkers are more likely to have partners, but less likely to be formally married. (See Graph 100) The failure to formalise relationships presumably resulted in part from poverty, which makes it difficult to pay for a wedding. It may also have reflected the difficulty of navigating legal requirements for people who live distant from urban centres, often with limited literacy.
Graph 100. Marital status of farmworkers and other formal employees, 2017
Source: Calculated from Statistics South Africa. Labour Market Dynamics 2017. Electronic database. Downloaded from Nesstar facility at www.statssa.gov.za in September 2019.
Comparing “farmworker households” with similar households in other areas underscores their relative isolation. Half of “farmworker households” only have a single member, while another sixth have two. In urban areas, less than a third of similar households have only one member, and in historic labour-sending regions the share is under a quarter. Furthermore, two thirds of “farmworker households” have no children, compared to just under half in the urban areas and a third in the historic labour-sending regions. (Calculated from Statistics South Africa 2017c)
Farmworkers’ relative isolation was aggravated by limited telecommunications and transportation. As Graph 101 shows, “farmworker households” were less likely to have access to cellphones, broadcast media, computers and the internet than similar households outside of the commercial farming areas.
88%
60%
33%
18%
11%
75%
53%
31%
24%
15%
4%
12%16%
7%
9%18%
5%
25% 50%63%
68%
6%
20% 36%
53%
61%
7%14% 13% 7% 5%
19%24% 26%
14%7%
0%
10%
20%
30%
40%
50%
60%
70%
80%
90%
100%
15 to24
25 to34
35 to44
45 to54
55 to64
15 to24
25 to34
35 to44
45 to54
55 to64
other farmworkers
living together
married
widowed/divorced
never married
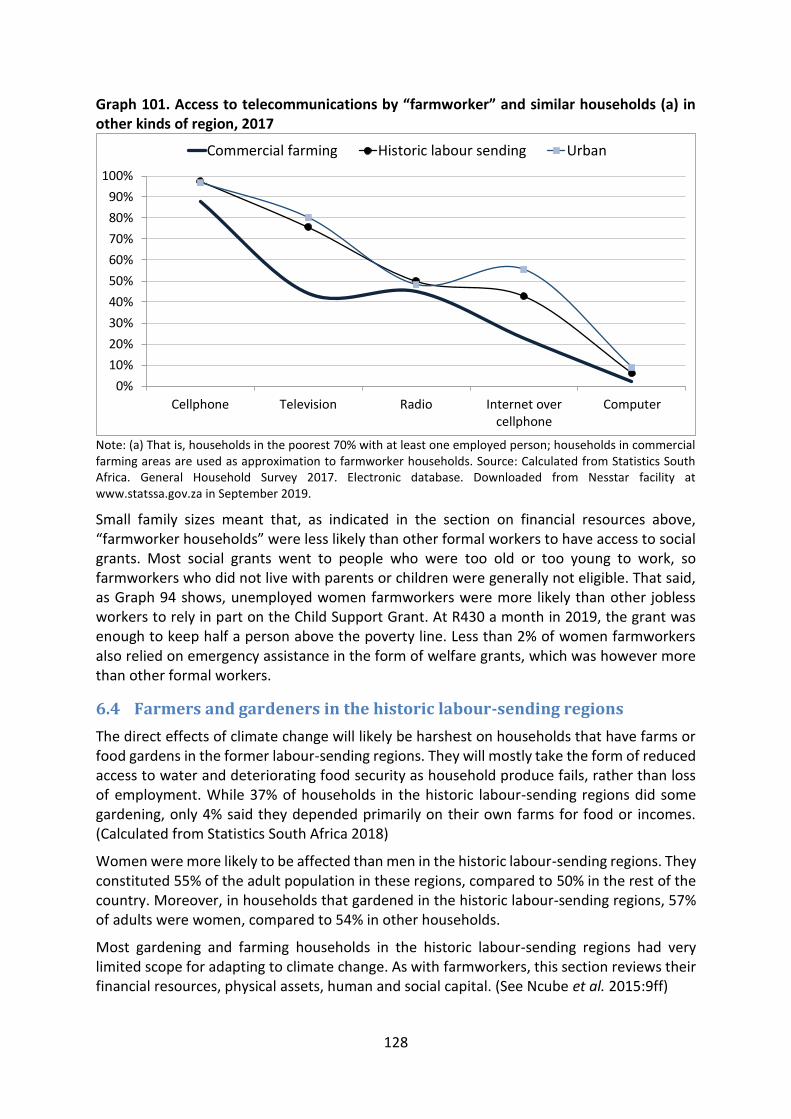
128
Graph 101. Access to telecommunications by “farmworker” and similar households (a) in other kinds of region, 2017
Note: (a) That is, households in the poorest 70% with at least one employed person; households in commercial farming areas are used as approximation to farmworker households. Source: Calculated from Statistics South Africa. General Household Survey 2017. Electronic database. Downloaded from Nesstar facility at www.statssa.gov.za in September 2019.
Small family sizes meant that, as indicated in the section on financial resources above, “farmworker households” were less likely than other formal workers to have access to social grants. Most social grants went to people who were too old or too young to work, so farmworkers who did not live with parents or children were generally not eligible. That said, as Graph 94 shows, unemployed women farmworkers were more likely than other jobless workers to rely in part on the Child Support Grant. At R430 a month in 2019, the grant was enough to keep half a person above the poverty line. Less than 2% of women farmworkers also relied on emergency assistance in the form of welfare grants, which was however more than other formal workers.
6.4 Farmers and gardeners in the historic labour-sending regions
The direct effects of climate change will likely be harshest on households that have farms or food gardens in the former labour-sending regions. They will mostly take the form of reduced access to water and deteriorating food security as household produce fails, rather than loss of employment. While 37% of households in the historic labour-sending regions did some gardening, only 4% said they depended primarily on their own farms for food or incomes. (Calculated from Statistics South Africa 2018)
Women were more likely to be affected than men in the historic labour-sending regions. They constituted 55% of the adult population in these regions, compared to 50% in the rest of the country. Moreover, in households that gardened in the historic labour-sending regions, 57% of adults were women, compared to 54% in other households.
Most gardening and farming households in the historic labour-sending regions had very limited scope for adapting to climate change. As with farmworkers, this section reviews their financial resources, physical assets, human and social capital. (See Ncube et al. 2015:9ff)
0%
10%
20%
30%
40%
50%
60%
70%
80%
90%
100%
Cellphone Television Radio Internet overcellphone
Computer
Commercial farming Historic labour sending Urban

129
Women in the historic labour-sending regions are systematically more vulnerable on all the dimensions studied than men. That said, data on relationships within households make it difficult to analyse the differences systematically. The main survey findings are linked to the differences associated with the gender of the household “head”. In theory, the household head is defined through a combination of the main income earner, the owners of the dwelling, and family perceptions of the “main decision maker”. This definition is problematic both conceptually and practically, however, in particular because:
It does not provide for equitable partnerships.
If there is an adult man in the household, it seems he is usually considered the “head” irrespective of income, property rights or actual decision-making processes within a family. As a result, “man-headed” households were more likely to have at least two working-aged adults, which in turn is associated with higher incomes. In the 2018 General Household Survey, “man-headed” households included an adult partner in two thirds of all cases, compared to just a fifth of “woman-headed” households.
Because women generally live longer than men, a disproportionate share of “woman-headed households are led by pensioners, which means they are less likely to have earned income and more likely to depend on old-age pensions.
The result is that while most “woman-headed” households are probably headed by women, at least some of the “man-headed” households are equitable partnerships or arguably “headed” by a woman.
It is noteworthy nonetheless that South Africa had an unusually high number of “woman-headed” households by international standards. This was particularly true for the historic labour-sending regions because of the way apartheid separated families. In South Africa, 42% of households counted as “woman-headed” in 2018, but the figure was 53% for the historic labour-sending regions and just 37% for the rest of the country. Of the 32 countries for which the World Bank provided data from 2008, all except Namibia reported a much smaller share. It ranged from 10% in Pakistan to 40% in the Dominican Republic. Namibia came in at 44%.
“Woman-headed” households in the historic labour-sending regions were more likely to undertake any agricultural activities than others. They were also more likely to be involved in farming as their main source of income or food, as the following graph shows. As a result, they constituted 58% of both gardeners and farmers in these regions in 2018.

130
Graph 102. Number of households (in thousands) and share engaging in farming and gardening by gender of “household head”, 2018
Source: Calculated from Statistics South Africa. General Household Survey 2018. Downloaded from Nesstar facility at www.statssa.gov.za in September 2019.
“Women-headed” households range between 57% and 62% of gardening households in the Eastern Cape, KwaZulu Natal, Mpumalanga and Limpopo. These provinces together hold more than nine out of ten gardening households in the historic labour-sending regions.
a. Financial resources
Studies of farming in communities in the historic labour-sending regions point to low incomes and savings as key factors in preventing adaptation of production technologies. (See Quinn et al. 2011) Overall, households in historic labour-sending regions had lower incomes and savings than those in the rest of the country, particularly if they were “woman headed”. Households with gardens tended to have fewer financial resources than other households in these regions, which was linked to higher levels of joblessness in these households.
For households in historic labour-sending regions, incomes of people who farmed or gardened were generally low by national standards. “Woman-headed” households, irrespective of their farming activities, had median cash incomes of under R2400 a month in 2018. The median incomes of “man-headed” households ranged from almost R5000 a month for those that did not farm at all, to R3700 for households that did some gardening, to R3400 a month for households that depended on farming as their main source of food or income. For comparison, in other parts of the country, the median income of “woman-headed” households was R5700 a month, and for “man-headed” households it was R10 000.
897
652
89 65 4% 3%
39%
33%
0%
5%
10%
15%
20%
25%
30%
35%
40%
45%
-
100
200
300
400
500
600
700
800
900
"Woman headed" "Man headed"
% o
f ho
useh
old
s by gen
der o
f "ho
useh
old
h
ead"
tho
usa
nd
s o
f fa
rmin
g o
r ga
rden
ing
ho
use
ho
lds
number with some gardening (000s) number depending on gardening (000s)
% depending on farming (right axis) % with some gardening (right axis)
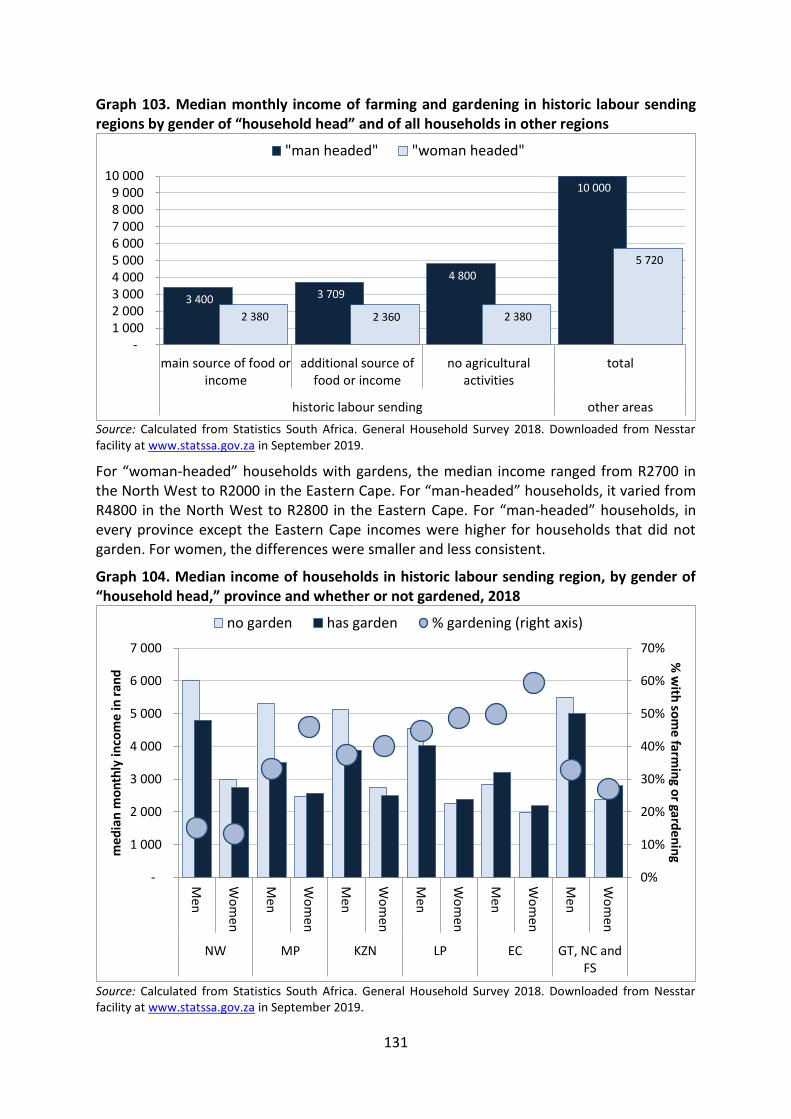
131
Graph 103. Median monthly income of farming and gardening in historic labour sending regions by gender of “household head” and of all households in other regions
Source: Calculated from Statistics South Africa. General Household Survey 2018. Downloaded from Nesstar facility at www.statssa.gov.za in September 2019.
For “woman-headed” households with gardens, the median income ranged from R2700 in the North West to R2000 in the Eastern Cape. For “man-headed” households, it varied from R4800 in the North West to R2800 in the Eastern Cape. For “man-headed” households, in every province except the Eastern Cape incomes were higher for households that did not garden. For women, the differences were smaller and less consistent.
Graph 104. Median income of households in historic labour sending region, by gender of “household head,” province and whether or not gardened, 2018
Source: Calculated from Statistics South Africa. General Household Survey 2018. Downloaded from Nesstar facility at www.statssa.gov.za in September 2019.
3 400 3 709
4 800
10 000
2 380 2 360 2 380
5 720
- 1 000 2 000 3 000 4 000 5 000 6 000 7 000 8 000 9 000
10 000
main source of food orincome
additional source offood or income
no agriculturalactivities
total
historic labour sending other areas
"man headed" "woman headed"
0%
10%
20%
30%
40%
50%
60%
70%
-
1 000
2 000
3 000
4 000
5 000
6 000
7 000
Me
n
Wo
men
Me
n
Wo
men
Me
n
Wo
men
Me
n
Wo
men
Me
n
Wo
men
Me
n
Wo
men
NW MP KZN LP EC GT, NC andFS
% w
ith so
me farm
ing o
r garden
ingm
edia
n m
on
thly
inco
me
in r
and
no garden has garden % gardening (right axis)

132
Farming and gardening households tended to be more dependent on social grants and less on earned income, and generally to have fewer income sources than other households. (See Graph 89 above) “Woman-headed” households in the historic labour sending regions were markedly more likely to get social grants and remittances and had less access to wage-earning jobs and business income compared to “man-headed” households especially in other regions, as Graph 105 shows.
Graph 105. Income sources for gardening and other households in the historic labour-sending regions, by reported gender of household “head”, 2018
Source: Calculated from Statistics South Africa. General Household Survey 2018. Downloaded from Nesstar facility at www.statssa.gov.za in September 2019.
Levels of paid employment in households with gardens were typically lower than for those in other households. In particular, households were less likely to maintain gardens when men had higher levels of paid employment. In households with gardens in the historic labour-sending regions, 29% of working-aged men had paid employment; in households without gardens, 45% did. In the rest of the country, 57% of working-aged men had waged work. Women’s access to paid employment had less impact: in historic labour-sending regions, 25% of women in households with gardens had paid work, compared to 29% in other households. This pattern held true both within and between provinces. As a consequence, provinces with lower employment levels, notably the Eastern Cape and KwaZulu Natal, tended to have more households with gardens in the historic labour-sending regions.
0%10%20%30%40%50%60%70%80%90%
social
grant
wages
remit-
tances
bu
siness
inco
me
farm sales
pen
sion
oth
er (a)
social
grant
wages
remit-
tances
bu
siness
inco
me
farm sales
pen
sion
oth
er (a)
"woman headed" "man headed"
other regions: total historic labour sending: with garden
historic labour sending: without garden

133
Graph 106. Share of households with and without gardens and employment ratio (a) in labour-sending regions, by province, 2018
Source: Calculated from Statistics South Africa. General Household Survey 2018. Downloaded from Nesstar facility at www.statssa.gov.za in September 2019.
In terms of savings, people living in the historic labour-saving areas were far less likely to have access to bank accounts or formal financial savings, including pensions, than those in the rest of the country. People in households with gardens in the historic labour-sending regions had lower levels of formal savings than households without gardens. Women were less likely than men to have pensions – although they were 60% of all people aged over 60 – as well as investment accounts. A higher share of women than men had informal savings, however.
0%
10%
20%
30%
40%
50%
60%
70%
Men
Wo
men
Men
Wo
men
Men
Wo
men
Men
Wo
men
Men
Wo
men
Men
Wo
men
Eastern Cape KwaZulu-Natal Limpopo Free State Mpumalanga North West
historic labour sending without garden
historic labour sending with garden
other regions total
% of working aged population living in historic labour-sending regions with gardens
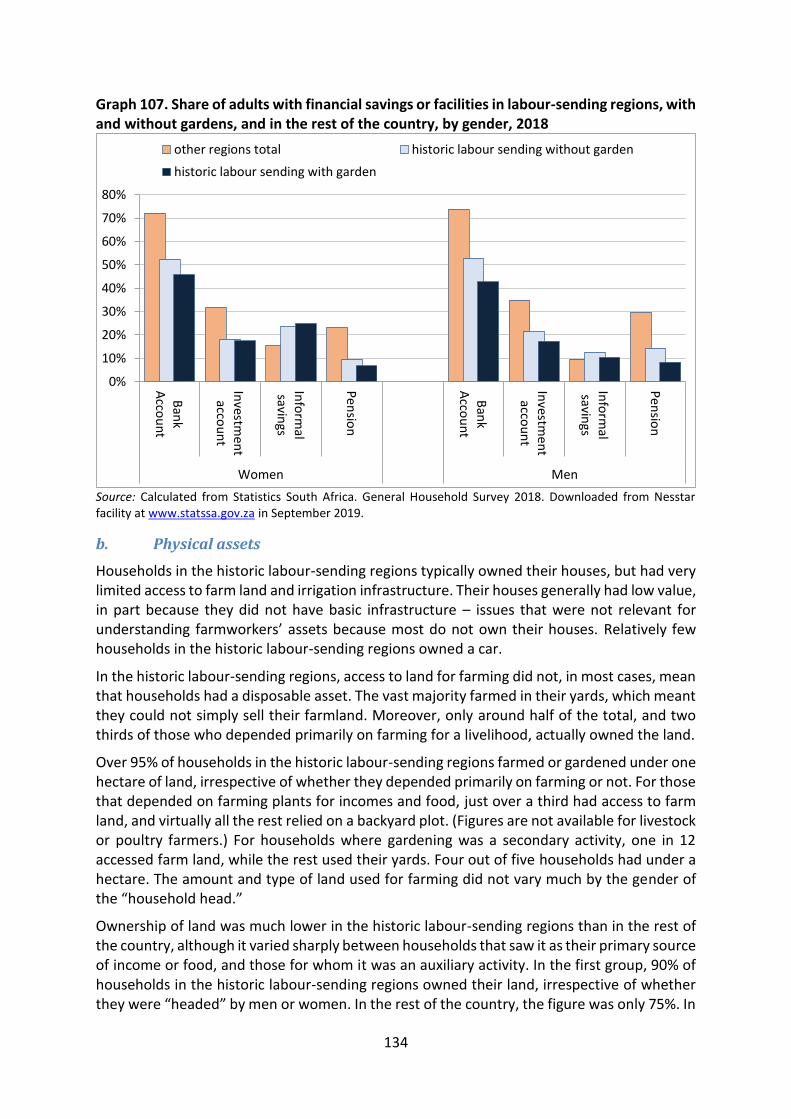
134
Graph 107. Share of adults with financial savings or facilities in labour-sending regions, with and without gardens, and in the rest of the country, by gender, 2018
Source: Calculated from Statistics South Africa. General Household Survey 2018. Downloaded from Nesstar facility at www.statssa.gov.za in September 2019.
b. Physical assets
Households in the historic labour-sending regions typically owned their houses, but had very limited access to farm land and irrigation infrastructure. Their houses generally had low value, in part because they did not have basic infrastructure – issues that were not relevant for understanding farmworkers’ assets because most do not own their houses. Relatively few households in the historic labour-sending regions owned a car.
In the historic labour-sending regions, access to land for farming did not, in most cases, mean that households had a disposable asset. The vast majority farmed in their yards, which meant they could not simply sell their farmland. Moreover, only around half of the total, and two thirds of those who depended primarily on farming for a livelihood, actually owned the land.
Over 95% of households in the historic labour-sending regions farmed or gardened under one hectare of land, irrespective of whether they depended primarily on farming or not. For those that depended on farming plants for incomes and food, just over a third had access to farm land, and virtually all the rest relied on a backyard plot. (Figures are not available for livestock or poultry farmers.) For households where gardening was a secondary activity, one in 12 accessed farm land, while the rest used their yards. Four out of five households had under a hectare. The amount and type of land used for farming did not vary much by the gender of the “household head.”
Ownership of land was much lower in the historic labour-sending regions than in the rest of the country, although it varied sharply between households that saw it as their primary source of income or food, and those for whom it was an auxiliary activity. In the first group, 90% of households in the historic labour-sending regions owned their land, irrespective of whether they were “headed” by men or women. In the rest of the country, the figure was only 75%. In
0%
10%
20%
30%
40%
50%
60%
70%
80%
Ban
kA
ccou
nt
Investm
ent
accou
nt
Info
rmal
savings
Pen
sion
Ban
kA
ccou
nt
Investm
ent
accou
nt
Info
rmal
savings
Pen
sion
Women Men
other regions total historic labour sending without garden
historic labour sending with garden

135
contrast, just over 55% of households in the historic labour-sending areas that undertook gardening as a secondary activity owned their land. In the rest of the country, 80% of households owned the land they gardened.
The discrepancy in ownership largely resulted from continued land ownership by nominally “traditional” authorities in historic labour-sending areas. For households that depended on farming in these regions, 7% held land granted by these authorities. For other households that gardened, however, the figure rose to a bit more than 40%. These households could not sell their land or be sure of access in the future, which deterred improvements.
By province, the importance of ownership by “traditional” authorities rather than households was far greater in the Eastern Cape than in other regions. In the Eastern Cape, “traditional” authorities controlled almost 80% of the land, compared to closer to 40% in KwaZulu Natal and Limpopo and virtually none in Mpumalanga. (Graph 108)
Graph 108. Land tenure of gardening households by province and share of gardening households in total, labour-sending regions only, by gender of “household head,” 2018
Source: Calculated from Statistics South Africa. General Household Survey 2018. Downloaded from Nesstar facility at www.statssa.gov.za in September 2019.
Irrigation represents a critical way to deal with drought at least in the short run. Dams effectively enable farmers to spread out the effects of dry periods, although higher temperatures bring increased evaporation that limits their effectiveness. Overall, 40% of farmers and gardeners in the historic labour-sending regions used irrigation for at least part of their crop, compared to 46% of those in other areas. There was no difference by gender of the “household head” at the national level, although minor differentials emerge in provinces. The differences in access between provinces were far larger, with under a quarter of households with gardens in Limpopo using irrigation at all, compared to three quarters in Mpumalanga. Current trends suggest that Limpopo may see decreasing rainfall.
0%
10%
20%
30%
40%
50%
60%
70%
80%
90%
100%
"man
hea
ded
"
"wo
man
hea
ded
"
"man
hea
ded
"
"wo
man
hea
ded
"
"man
hea
ded
"
"wo
man
hea
ded
"
"man
hea
ded
"
"wo
man
hea
ded
"
"man
hea
ded
"
"wo
man
hea
ded
"
LP EC KZN MP NW, GT, FS,NC
other
"traditional" authorities
owns
% of all households inhistoric labour-sendingregions

136
Graph 109. Share of gardening households using irrigation by province and gender of “household head,” 2018
Source: Calculated from Statistics South Africa. General Household Survey 2018. Downloaded from Nesstar facility at www.statssa.gov.za in September 2019.
In terms of housing, 80% of households in the historic labour-sending regions owned their homes, with very little difference linked to the gender of the “household head” or their farming activities. In contrast, in other areas the figure was just under 50%. But three quarters of families said their house was worth less than R100 000 in the historic flavour sending areas, compared to two fifths in other regions. Only just over one in ten houses in the historic labour sending regions was valued at over R2 million, compared to one in four in the rest of the country.
Figures on access to water help explain the difference in the value of housing by location. In the historic labour sending regions, only 43% of “woman-headed” households and 49% of “man-headed” households had piped water in their houses or yards, including from a borehole; the rest were split more or less evenly between using water from a public tap or neighbour, and unimproved water sources such as wells or springs. In the rest of the country, almost nine out of ten households got their water from a tap in their houses or their yards.
As noted above, cars were another major household asset. In the historic labour-sending regions, one in five “man-headed” households had a car, but only one in 15 “woman-headed” households. In the rest of the country, two out of five “man-headed” and a quarter of “woman-headed” households owned cars.
c. Human capital
Education levels were generally lower in the historic labour-sending regions than in the rest of the country, and they were slightly lower for households there with gardens than for others. Over two thirds of people aged 18 to 64 in the historic labour-sending regions had less than matric, and only between 1% and 2% had a university degree. (Graph 110)
0%
10%
20%
30%
40%
50%
60%
70%
80%
LP KZN EC MP NW, FS, GT, NC
"man headed" "woman headed"

137
Graph 110. Education of household members in the historic labour-sending regions compared to the rest of the country, by gender and whether or not their household gardened, 2018
Source: Calculated from Statistics South Africa. General Household Survey 2018. Downloaded from Nesstar facility at www.statssa.gov.za in September 2019.
Households in the historic labour-sending regions also skewed older, largely as a result of mass out-migration after 1994 when residential restrictions were eliminated. In the historic labour-sending regions, 25% of households held a pensioner in 2018. In the rest of the country, the figure was just 17%. Households with pensioners were almost twice as likely as other households to have a garden.
d. Social capital
As noted in Graph 105 above, around nine out of ten households with gardens in the historic labour-sending regions received social grants. That in itself would cushion them against some of the effects of climate change.
Social grants were the main source of income for half of “woman headed” gardening households in 2018, and for two out of five of those “headed” by a man. In contrast, for households without gardens, the share fell to two in five for “woman headed” and one in five for “man headed.”
Relatively few households, however, got an old age pension or disability grant, which was at a level to lift two people out of poverty. They were more likely to get the child support pension, which was enough to support half a person at the poverty line.
Moreover, according to the 2018 General Household Survey, men were far more likely to get an old age pension than women, although women made up a larger share of the elderly population. In families with gardens in the historic labour-sending regions, a quarter of men reportedly got an old-age pension in 2018, compared to one in seven in households that did not garden and one in ten in the rest of the country. In all households, around one in 30 women got an old-age pension according to the 2018 data. In contrast, almost half of women
73%
65%68%
62%
54%
47%54%
44%
20%26% 23% 29%
26% 33% 28% 35%
2%4% 5% 4%
8% 9% 8% 11%
8% 5% 8% 6%
0%
10%
20%
30%
40%
50%
60%
70%
80%
90%
100%
hasgarden
doesnot
garden
hasgarden
doesnot
garden
hasgarden
doesnot
garden
hasgarden
doesnot
garden
Men Women Men Women
historic labour sending other regions
don't know
other
university
matric plus diploma
matric
less than matric

138
in households with gardens in the historic labour-sending regions got a child support grant, and two out of five in other households in these regions, compared to around one in five in the rest of the country. Almost no men said they received a child support grant in any kind of household.
In terms of more targeted support from government, households in the historic labour-sending regions often went short. In some cases, communities proposed projects such as brickmaking and community gardens in response to droughts, but received little support from municipalities (Quinn et al 2011:14) Similarly, several studies pointed to general degradation of irrigation systems. Many dams were reportedly neglected, silted up or damaged. (Maluluke and Mokwena 2017:29) In some cases, decisionmakers appeared to favour schemes for industrial farming, tourism and mining over irrigation for small producers. (Quinn et al 2011:13)
A particular problem for historic labour-sending regions was the persistence of “traditional” leadership together with democratically elected municipal governments. According to Quinn et al. “The coexistence of these two different governance structures has given rise to tensions and conflict because of differences in effectiveness and fairness, differences in local support, and confusion over their respective roles and responsibilities.” (2011:13; see also Levin and Makgetla 2018)
6.5 Farming communities
Of all households engaged in agricultural activity in the former labour-sending regions, around a third had access to irrigation, and the figure rose to 75% in the Northern Cape and the North West, where droughts are particularly likely in the future. Virtually none of these households have access to crop insurance or assistance in adopting new technologies that require less water. (Calculated from Statistics South Africa 2018b)
Because productivity in farming and gardening in households in the historic labour-sending regions is very low, the figures on gross value added by municipality do not fully capture reliance on agriculture. They essentially show commercial-farming areas rather than regions where people engage in very low level small-scale production primarily for food security.
Graph 111 captures this discrepancy. It analyses municipalities where over 32% of households – twice the national average – engaged in some kind of farming or gardening, typically for their own use. Almost half of all households in the Eastern Cape and nearly a third of those in Limpopo were located in these farming-intensive municipalities; some 80% of these households were in historic labour-sending areas. In KwaZulu-Natal, the North West, the Free State and Limpopo, the share of households in farming-intensive municipalities ranged from just over 20% to around 15%. In contrast, in Mpumalanga, Gauteng and the Western Cape relatively few households did any farming and there were no municipalities where they constituted over 32% of all households

139
Graph 111. Share of all households that engage in farming by region, and households in farm-intensive municipalities (a) as a percentage of total in region, by type of location and in thousands
Notes: (a) Defined here as municipalities where 32% or more of households engage in some farming or gardening. (b) Historic labour-sending regions refers to the former so-called “homeland” areas. Source: Calculated from Statistics South Africa. Community Survey 2016. Electronic dataset. Downloaded from Nesstar facility at www.statssa.gov.za in December 2018.
Dependence on agriculture varies substantially within provinces. Some 3,3 million people, or 6% of the national population, live in municipalities where the agricultural value chain was estimated (by Quantec) to account for over 20% of total value added in 2018. (See Graph 112) In the Northern Cape and the Free State, the share climbs to a fifth of the provincial population. That said, in actual numbers KwaZulu-Natal and the Western Cape account for half of all people living communities with substantial production in the agricultural value chain.
-
200
400
600
800
1 000
1 200
1 400
1 600
1 800
2 000
0%
10%
20%
30%
40%
50%
60%
70%
80%
90%
100%
Total EC KZ LI FS NW NC MP GT WC
tho
usan
ds o
f ho
useh
old
s
share of households in farm-intensive municipalities that are located in historic labour-sending regions (b)
share of all households in region that engage in some farming or gardening
share of all households in region that are located in farm-intensive municipalities
number of households in farm-intensive municipalities (000s - right axis)
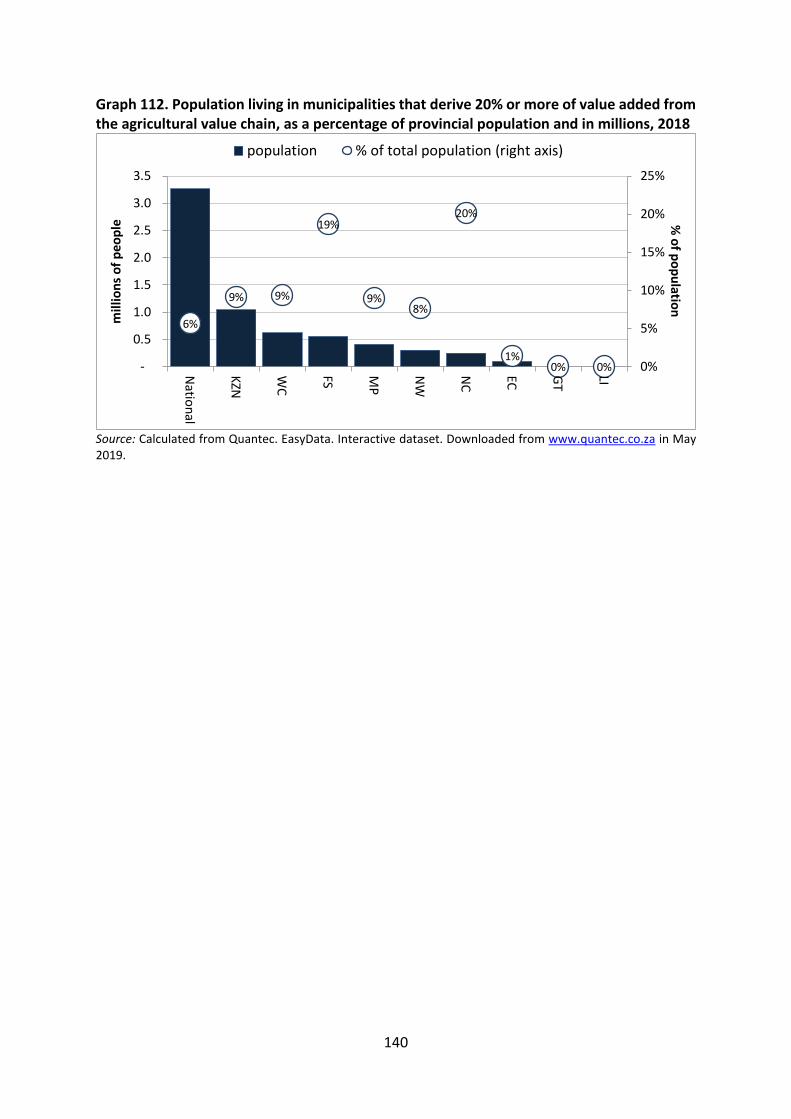
140
Graph 112. Population living in municipalities that derive 20% or more of value added from the agricultural value chain, as a percentage of provincial population and in millions, 2018
Source: Calculated from Quantec. EasyData. Interactive dataset. Downloaded from www.quantec.co.za in May 2019.
6%
9% 9%
19%
9%8%
20%
1%0% 0% 0%
5%
10%
15%
20%
25%
-
0.5
1.0
1.5
2.0
2.5
3.0
3.5
Natio
nal
KZN
WC
FS MP
NW
NC
EC GT
LI
% o
f po
pu
lation
mill
ion
s o
f p
eop
le
population % of total population (right axis)

141
7 Tourism value chain
7.1 Scope
Tourism is not a category in the standard industrial classification, which means that there is generally less data, and less reliable data, on the value chain than other industries. A principal difficulty is that it is often difficult to disentangle tourism as normally understood – that is, travel and visits for the sake of the experience itself – from other forms of travel, for instance for health, education or business, and from other kinds of cultural activities. In practice, the data usually include services associated with international and domestic long-distance travel for any reason other than trade.
The SJRP will focus on tourism as usually understood, that is as relating to recreational travel rather than business, health and education. The reason is that the factors motivating travel and the services utilised differ significantly between these categories. That said, the published data on tourism generally includes long-distance travel and consumption by non-residents for any purpose.
The following figure shows the scope of the tourism value chain. As with any service, skills are an essential input in themselves, particularly for accommodation and cultural activities. They are therefore noted specifically as inputs.
Figure 12. The tourism services value chain
7.2 Overview of the value chain
7.2.1 Production
It is not possible to separate out demand and supply of products and services for tourists from other consumers. To identify the implications of tourism for national economies, therefore, a methodology has emerged internationally that models the effects of demand by non-residents based on their total spending. In South Africa, this approach underpins the tourism satellite accounts that Statistics South Africa has published since 2015. (Statistics South Africa 2018a)
According to the satellite accounts, in the 2010s growth in tourism primarily reflected increased spending by South Africans. Expenditure by foreign (“in-bound”) tourists – two thirds of who come from SADC countries, with most of the rest from Europe – was hard hit by the 2008/9 downturn, and had barely recovered in the late 2010s. A further downturn emerged in 2017.
Accommodation and catering
services
High end tourists (overseas, domestic/
regional top 1%)
Other domestic and regional
tourists
Skills (services, business owners)
Facilities
Long-distance transport
Cultural venues
Natural venues
Cultural workers, guides, sites
Maintenance, guides
Local transport
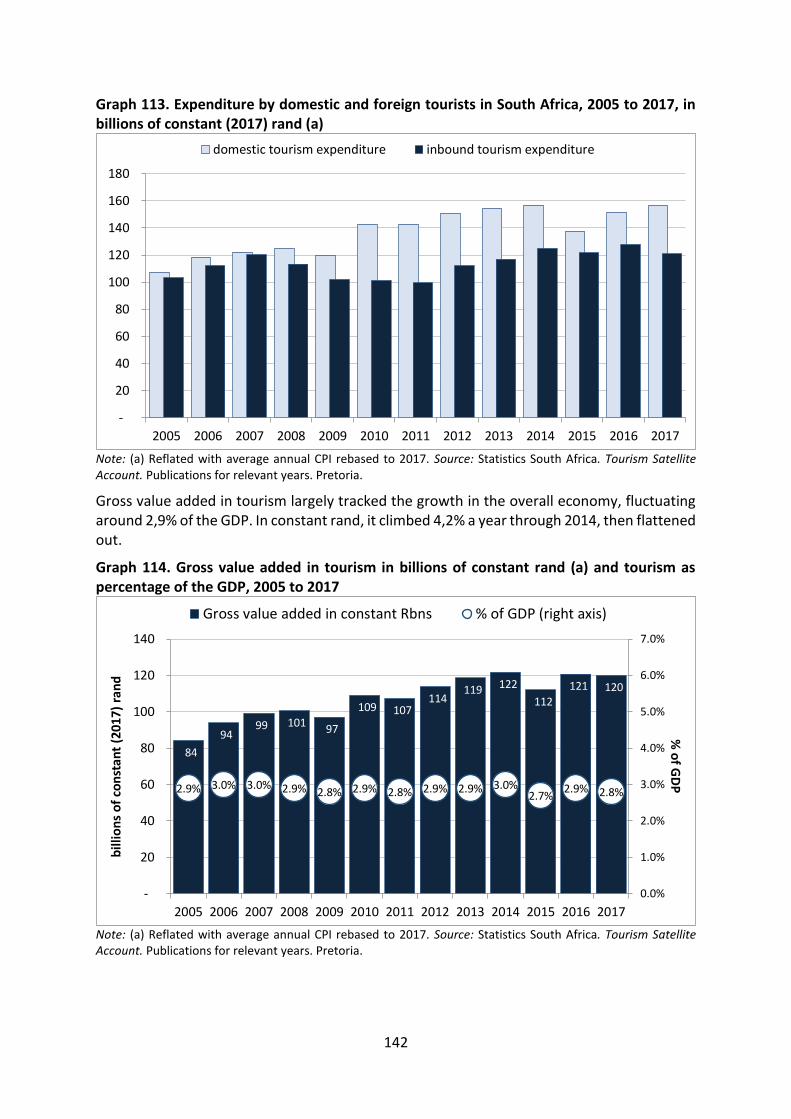
142
Graph 113. Expenditure by domestic and foreign tourists in South Africa, 2005 to 2017, in billions of constant (2017) rand (a)
Note: (a) Reflated with average annual CPI rebased to 2017. Source: Statistics South Africa. Tourism Satellite Account. Publications for relevant years. Pretoria.
Gross value added in tourism largely tracked the growth in the overall economy, fluctuating around 2,9% of the GDP. In constant rand, it climbed 4,2% a year through 2014, then flattened out.
Graph 114. Gross value added in tourism in billions of constant rand (a) and tourism as percentage of the GDP, 2005 to 2017
Note: (a) Reflated with average annual CPI rebased to 2017. Source: Statistics South Africa. Tourism Satellite Account. Publications for relevant years. Pretoria.
-
20
40
60
80
100
120
140
160
180
2005 2006 2007 2008 2009 2010 2011 2012 2013 2014 2015 2016 2017
domestic tourism expenditure inbound tourism expenditure
84
94 99 101
97
109 107 114
119 122
112
121 120
2.9% 3.0% 3.0% 2.9% 2.8% 2.9% 2.8% 2.9% 2.9% 3.0%2.7%
2.9% 2.8%
0.0%
1.0%
2.0%
3.0%
4.0%
5.0%
6.0%
7.0%
-
20
40
60
80
100
120
140
2005 2006 2007 2008 2009 2010 2011 2012 2013 2014 2015 2016 2017
% o
f GD
Pb
illio
ns
of
con
stan
t (2
017)
ran
d
Gross value added in constant Rbns % of GDP (right axis)

143
According to Statistics South Africa, the bulk of tourism spending in South Africa goes to road and air transport, followed by accommodation and food, as illustrated in Figure 13. The satellite accounts divide industries that provide goods and services to tourists into:
“characteristic products” on which tourists depend, and which typically in turn sell a considerable share of products to domestic and foreign tourists;
connected products, which are important for tourists but also for locals; and
non-specific products, where tourism spending is fairly small.
Figure 13. Major products consumed by foreign and domestic tourists, 2017
Source: Statistics South Africa. Tourism Satellite Account 2017. Pretoria.
As the following graph shows, the division between demand by domestic and foreign tourist, and the share of total production bought by tourists, varies substantially even within the group of characteristic products. According to Statistics South Africa’s estimates, accommodation, air transport and travel agencies are almost entirely dependent on tourists. Local travellers are the main source of tourism business for most of the industries, with the exceptions amongst others of accommodation; sports, culture and recreation; and restaurant sales.

144
Graph 115. Local and foreign tourist expenditure by industry in billions of rand and as a percentage of total domestic supply
Source: Statistics South Africa. Tourism Satellite Account 2017. Pretoria.
7.2.2 Employment
Statistics South Africa estimates total employment from tourism in South Africa at around 700 000, or 4,5% of all jobs in the country. The relatively high share in total employment reflects the importance of labour-intensive activities in industries used by foreign and domestic tourists. Tourism employment saw a boost around the 2010 World Cup, but since then has grown at the same rate as the rest of the economy.
36%
96% 96%
38%
98%
33%
68%
9% 10%16%
1% 0%
20%
40%
60%
80%
100%
120%
-
10
20
30
40
50
60R
oad
tra
nsp
ort
Acc
om
mo
dat
ion
Air
tra
nsp
ort
Res
tau
ran
ts e
tc.
trav
elag
enci
es
etc
.
spo
rts
and
cult
ura
l ser
vice
s
Car
ren
tal
Ret
ail f
oo
d &
bev
erag
e sa
les
Re
tail
clo
thin
gsa
les
Ret
ail f
uel
Tota
l no
n-s
pec
ific
Characteristic products Connected products
percen
tage of d
om
estic sup
ply
bill
ion
s o
f ra
nd
domestic tourism foreign tourism percentage of total demand (right axis)
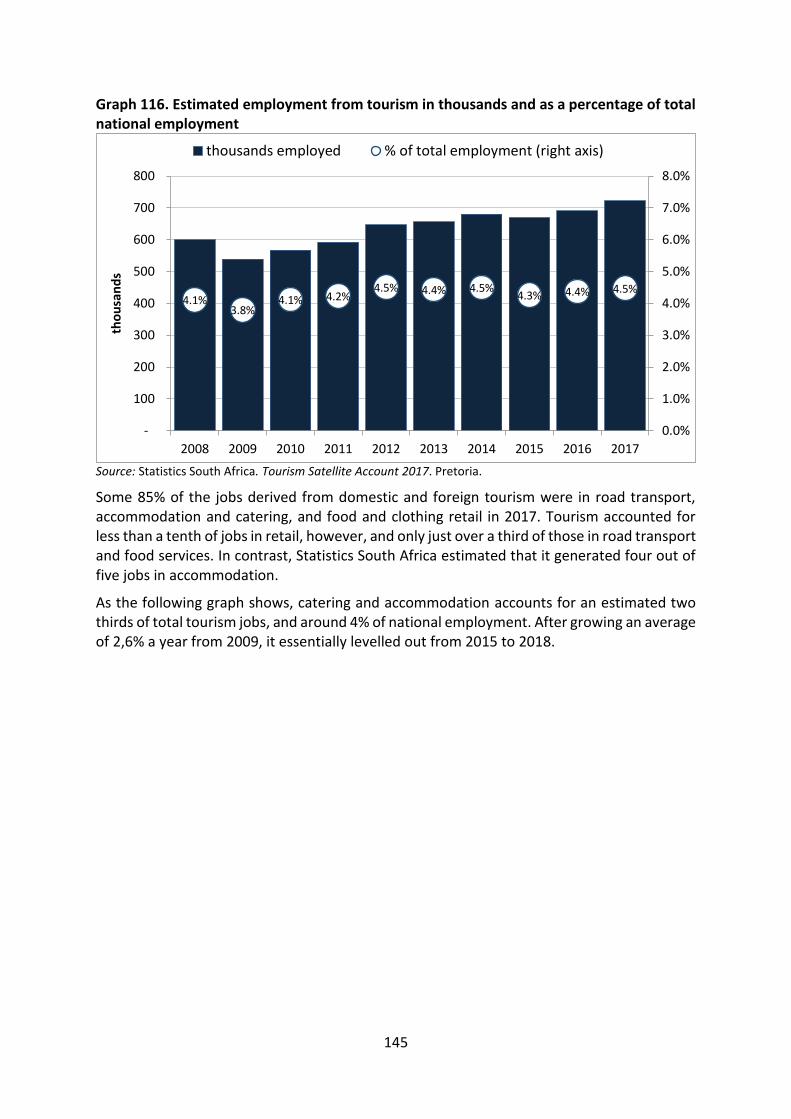
145
Graph 116. Estimated employment from tourism in thousands and as a percentage of total national employment
Source: Statistics South Africa. Tourism Satellite Account 2017. Pretoria.
Some 85% of the jobs derived from domestic and foreign tourism were in road transport, accommodation and catering, and food and clothing retail in 2017. Tourism accounted for less than a tenth of jobs in retail, however, and only just over a third of those in road transport and food services. In contrast, Statistics South Africa estimated that it generated four out of five jobs in accommodation.
As the following graph shows, catering and accommodation accounts for an estimated two thirds of total tourism jobs, and around 4% of national employment. After growing an average of 2,6% a year from 2009, it essentially levelled out from 2015 to 2018.
4.1%3.8%
4.1% 4.2%4.5% 4.4% 4.5%
4.3% 4.4% 4.5%
0.0%
1.0%
2.0%
3.0%
4.0%
5.0%
6.0%
7.0%
8.0%
-
100
200
300
400
500
600
700
800
2008 2009 2010 2011 2012 2013 2014 2015 2016 2017
tho
usa
nd
s
thousands employed % of total employment (right axis)

146
Graph 117. Employment in catering and accommodation in thousands and as a percentage of total employment and an estimated share of tourism employment (a), 2008 to 2018
Note: (a) Estimated as 80% of total employment in catering and accommodation, in line with the coefficient used in the satellite accounts for 2017. Source: For 2008 to 2017, calculated from Statistics South Africa, Labour Market Surveys for relevant years; for 2018, average of figures for Quarterly Labour Force Surveys for all four quarters.
7.2.3 Spatial distribution
Because of the importance of nature-based tourism in South Africa’s tourism profile, it was important in a number of rural areas with few other economic opportunities. Still, it was centred primarily in Cape Town, Durban and Johannesburg. Gauteng, KwaZulu-Natal and the Western Cape accounted for two thirds of employment in accommodation and food services.
Graph 118. Provincial shares in employment in food service and accommodation, 2017
Source: Calculated from Statistics South Africa. Labour Market Dynamics 2017. Electronic database. Downloaded from www.statssa.gov.za in December 2018.
530 508 526
559 538 521
571 594 594 596 598
3.6% 3.6% 3.8% 4.0% 3.7% 3.5% 3.8% 3.8% 3.8% 3.7% 3.6%
71%75% 74% 76%
67%64%
67%71%
69%66%
0.0%
10.0%
20.0%
30.0%
40.0%
50.0%
60.0%
70.0%
80.0%
-
100
200
300
400
500
600
700
800
2008 2009 2010 2011 2012 2013 2014 2015 2016 2017 2018
tho
usa
nd
s
thousands
% of total employment (right axis)
% of tourism employment - estimated (a) (right axis)
0%
5%
10%
15%
20%
25%
30%
35%
GT KZN WC EC LI MP NW FS NC
other industries accommodation food service

147
Food service and accommodation constituted a larger share of employment in the Western Cape, the Northern Cape, the Free State and the North West. These provinces all face the prospect of significantly reduced rainfall and, in the Karoo, desertification from climate change.
Graph 119. Employment in food service and accommodation as percentage of total employment by province, 2017
Source: Calculated from Statistics South Africa. Labour Market Dynamics 2017. Electronic database. Downloaded from www.statssa.gov.za in December 2018.
7.3 Dimensions of impact
The impact of climate change and efforts to mitigate it on tourism for South Africa relate to both supply and demand for tourism services. In particular, on the supply side the changing environment affects nature-based tourism sites and, in the Western Cape, accommodation capacity. In terms of demand, efforts to limit emissions from long-distance travel especially by air could affect both international and domestic travel.
Virtually all industry analysts list nature-based tourism as the main attraction for travellers in South Africa, ranging from game parks to beaches to Cape wine lands and Table Mountain and the Drakensburg mountains. The only attractions in the top ten cited by South African Tourism that do not depend on natural beauty are Johannesburg and Soweto. Natural attractions may be affected by drought or more violent rain, and in the case of the beaches by rising sea levels. Biodiversity is particularly threatened by climate change. In KwaZulu-Natal, many hotels and guesthouses are built directly on the water front, with very little elevation.
0.0%
1.0%
2.0%
3.0%
4.0%
5.0%
WC NC FS NW KZN EC LI GT MP Total
food service
accommodation

148
Graph 120. South Africa’s ecological footprint
Source: Calculated from Global Footprint Network. Open Data Platform. Downloaded from https://www.footprintnetwork.org in May 2019.
Cape Town has seen a marked reduction in tourism as a result of the drought in 2016/7. (Interviews with GPG and Cape Town Tourism officials, October 2019) International publicity about the water shortage fuelled a fall in visits even after the shortage ended. The slowdown emerged from figures for employment in catering and accommodation in the province. From 2008 to 2015, jobs in the industry climbed 2,9% a year, compared to 1,6% a year in the rest of the country. From 2015 to 2017, however, the industry lost 4000 jobs, for a decline of 1,7% a year, before recovering in 2018. In contrast, in the rest of the country, employment was stable in catering and accommodation from 2015 to 2018.14
In addition, several Cape Town attractions may be affected by climate change. In particular, rising seas could change the shape of Robben Island and the Victoria and Albert Waterfront, while droughts and rising temperatures threaten the wine estates.
On the demand side, long-distance travel is likely to become more expensive as efforts to mitigate climate change intensify. The air travel industry accounts for about 2% of global GHG emissions. Its emissions are however rapidly climbing and their effect on climate change are estimated to be much larger than the emissions themselves (about two to four times according to the IPCC). The International Civil Aviation Organization has designed a scheme for the industry to offset its emissions related to international travel only, which will inevitably add to the cost for passengers. The scheme will be voluntary from 2021 and mandatory from 2027. The industry targets carbon-neutral growth by 2020 and a halving of 2005-level emissions by 2050. In addition, consumers have begun to shun air travel in an effort to reduce emissions.
Issues around air travel will have the greatest effects on long-haul, overseas (mostly European, American and Asian) tourism to South Africa. Because tourists from these areas spend more per person, they have a disproportionate impact on employment. In addition,
14 For 2008 to 2017, calculated from Statistics South Africa, Labour Market Surveys for relevant years; for 2018, average of figures for Quarterly Labour Force Surveys for all four quarters.

149
domestic tourism from inland to the coast and to Kruger National could be affected by higher transport costs. The impact could be mitigated by shifting from road and air to rail, if that is possible without excessive additional costs.
7.4 Vulnerable groups in tourism
The diffusion of tourism employment across a range of industries defined in the standard statistical categories, as listed in section 7.2.2 above, makes it difficult to define all of the vulnerable groups in the value chain. This section provides a description of the resources available to workers in food service and accommodation – the largest group in tourism employment - as a proxy for all tourism workers. The final SJRP will also draw on information on small enterprise in this industry as well as communities that depend heavily on tourism.
Almost two thirds of workers in accommodation and food services are women, compared to two fifths of those in the rest of the formal sector.
7.4.1 Financial resources
Workers in catering and accommodation had relatively low pay. In 2017, the median income for formal women employees in the industry was R3200 a month; for men, it was R3800. In the informal sector, the median pay for women came to R2000 a month, compared to R2900 for men. For comparison, the median earnings for formal women employees in the rest of the economy was around R3800 a month, while for men it was R4500.
Catering and accommodation workers were less likely than other formal workers to have a retirement fund. In 2017, 40% of men and 35% of women in formal jobs in the industry had a pension or provident fund, compared to over 55% of other formal workers. Close to 80% of both men and women paid into the UIF, however, which was somewhat higher than in other formal industries.
7.4.2 Human capital
In accommodation, workers’ education level was somewhat lower than the national norm, as the following graph suggests. In food service, it was closer to the norm, as 45% of workers did not have matric, a similar number did, and the rest had some form of post-secondary education.

150
Graph 121. Employment by education level in accommodation and food service, 2017
Source: Calculated from Statistics South Africa. Labour Market Dynamics 2017. Electronic database. Downloaded from www.statssa.gov.za in December 2018.
Statistics on skills aggregate service workers without indicating their skill levels. As a result, they do not assist in understanding the skills of workers in catering and accommodation.
Workers in catering and accommodation were somewhat younger than in the rest of the economy. In 2017, the median age of women in formal catering and accommodation jobs was 34, while for men it was 32. In the rest of the formal sector, it was 38. In the informal sector, the median age was 38 for women and 35 for men, around two years younger than in other industries.
7.4.3 Social capital
As with other workers, the main information on social capital for accommodation and catering workers relates to their workplace.
One in seven formal workers in the industry, both women and men, belonged to a union – around half the rate for the rest of the formal sector. Seven in ten said the employer set their pay unilaterally, and around one in 20 said they did not get an annual increment. Just over 10% said their pay was set by collective bargaining.
The share of formal workers in catering and accommodation who said they were permanent was only slightly lower than 70%, which was the norm for the formal sector in 2017. In the informal sector, however, only between 20% and 30% of workers said they were had permanent positions.
Nine out of ten formal workers in catering and accommodation had a written contract, only slightly lower than the norm for formal workers as a whole. For informal workers in the industry, however, the rate was half as high. They were substantially less likely than other formal workers to have vacation and family leave, however. Only around half of workers in the industry said they could take paid leave time for these purposes, despite the legal requirements. They were almost as likely as other formal workers to get paid sick leave, however.
53%
45% 43%
34%44% 46%
9% 7% 8%
0%
10%
20%
30%
40%
50%
60%
70%
80%
90%
100%
Accommodation Food service other industries
other/don't know
university degree
matric plus diploma
matric
less than matric

151
References DEA. 2018. South Africa’s Third National Communication Under the United Nations Framework Convention on Climate Change. Department of Environmental Affairs. Pretoria.
JSE. 2004. JSE SRI Index. Background and Selection Criteria. Johannesburg.
Ncube, P. et al. 2016. “Competition, barriers to entry and inclusive growth: Agro-processing.” CCRED Working Paper 3/2016. September. University of Johannesburg. Johannesburg.
DEA. 2014. LTAS Programme Tech Report: Climate Change Implications for the Agriculture and Forestry Sectors in South Africa. Department of Environmental Affairs. Downloaded from www.sanbi.org in September 2019.
Addams, L., Boccaletti, G., Kerlin, M., Stuchtey, M., 2009. Charting Our Water Future: Economic frameworks to inform decision-making. 2030 Water Resources Group, Washington, D.C.
Archer, E.R.M. et al. 2008. “'Farming on the edge' in arid western South Africa: climate change and agriculture in marginal environments,” in Geography, XCIII.2. Summer.
BFAP, WCPG and SIQ. 2018. Mapping of Agricultural Commodities and Infrastructure in the Western Cape. Cape Town.
BFAP. 2007. Modelling the Economic Impact of Climate Change on the South African Maize Industry. Bureau for Food and Agricultural Policy. Pretoria.
Biggs, R.O. et al. 2015. “Strategies for managing complex social-ecological systems in the face of uncertainty examples from South Africa and beyond,” in Ecology and Society XX.1. March.
Bulbulia, T., 2019. Engineering News. [Online]
Business Tech, 2018. Business Tech. [Online]
Business Tech, 2019. Business Tech. [Online]
Calzadilla, A., et al. 2014. “Climate change and agriculture: Impacts and adaptation options in South Africa,” in Water Resources and Economics. V. Elsevier.
Chamber of Mines of South Africa, 2017. Facts and Figures 2016.
Chamber of Mines of South Africa, 2018. Mine SA 2017 Facts and Figures Pocketbook.
Coal Mining Matters, 2019. The coal industry as an employer.
Cockburn, J. et al. 2016. “How to build science-action partnerships for local land-use planning and management: lessons from Durban, South Africa,” in Ecology and Society XXI.1:28. March.
Cokayne, R., 2019. IOL. [Online]
Comin, D. A. & Mestieri, M., 2013. Technology diffusion: measurement, causes and consequences, Massachusetts: National Bureau of Economic Research.
Confronting Climate Change. 2019. “What is confronting climate change?” Downloaded from www.climatefruitandwine.co.za in September 2019.
Coren, M. J., 2018. Quartz. [Online]

152
Cosbey, A., Wooders, P., 2011. Vulnerability of South African Exports to Climate Change Related Trade Measures.
Dane, A., Wright, D., Montmasson-Clair, G., Snyman, C., 2018. The liquid fuel industry in South Africa. Trade & Industrial Policy Strategies, Pretoria.
Das Nair, R., Montmasson-Clair, G., Ryan, G., 2014. Regulatory Entities Capacity Building Project Review of Regulators Orientation and Performance: Review of Regulation in the Electricity Supply Industry. University of Johannesburg and Trade and Industrial Policy Strategies, Johannesburg and Pretoria.
De Coninck, H. and Aromar Revi. 2018. “Strengthening and Implementing the Global Response,” in, IPCC. Global Warming of 1.5°C. An IPCC Special Report on the impacts of global warming of 1.5°C above pre-industrial levels and related global greenhouse gas emission pathways, in the context of strengthening the global response to the threat of climate change, sustainable development, and efforts to eradicate poverty. World Meteorological Organization. Geneva.
DEA, 2017. GHG National Inventory Report for South Africa 2000-2012. Department of Environmental Affairs, Pretoria.
DEA. 2019. Draft National Climate Change Adaptation Strategy. Government Gazette. 6 May.
Department of Environmental Affairs. Pretoria.
Department of Environmental Affairs. 2013. Climate Change Implications for the Agriculture and Forestry Sectors in South Africa. DEA. Long-Term Adaptation Scenarios Flagship Research Programme (LTAS) for South Africa. Phase 1. Technical Report. Pretoria
Department of Environmental Affairs. 2018. South Africa’s Third National Communication Under the United Nations Framework Convention on Climate Change. DEA. Pretoria.
Department of Transport, 2004. Age of motor vehicle population, Pretoria: Department of Transport.
Department of Transport, 2018. Green Transport Strategy (2018-2050), Pretoria: Department of Transport.
DMR, 2017. Energy Price Report. Accessed at http://www.energy.gov.za/files/media/explained/Energy-Price-Report-2017.pdf (accessed 5.3.19).
DMR, 2019. South Africa’s mineral industry 2017/2018. Department of Mineral Resources, Pretoria.
DoE, 2018. Coal Resources - Overview. Department of Energy. Pretoria.
DoE, n.d. South African Coal Sector Report. Accessed at http://www.energy.gov.za/files/media/explained/South-African-Coal-Sector-Report.pdf on 5 January 2019.
DST, 2008. Innovation Towards a Knowledge-Based Economy: Ten-Year Plan for South Africa (2008 – 2018). Department of Science and Technology, Pretoria.
du Plooy, P. and Jooste, M., 2011. Trade and Climate Change: Policy and Economic Implications for South Africa. Trade and Industrial Policy Strategies, Pretoria.
153
DWA. 2013. National Water Resource Strategy. Second edition. Department of Water Affairs. Pretoria.
EIA. 2017. South Africa. Accessed at https://www.eia.gov/beta/international/analysis.php?iso=ZAF (accessed 5.1.19).
Energy Sage. 2019. Energy Sage. Available at: https://www.energysage.com/electric-vehicles/charging-your-ev/how-do-ev-charging-stations-work/. Accessed 26 April 2019.
Engel, H., Hensley, R., Knupfer, S. & Sahdev, S., 2018. Charging ahead: electric vehicle infrastructure demand. Mckinsey Centre for Future Mobility. New York city.
Engineering News. 2019. “Logistics a weak link in South Africa’s coal value chain”. Accessed at https://www.engineeringnews.co.za/article/logistics-a-weak-link-in-south-africas-coal-value-chain-2019-02-01 on 5 March 2019.
Eskom, 2018a. Integrated Annual Report 2018 [WWW Document]. URL http://www.eskom.co.za/IR2018/Documents/Eskom2018IntegratedReport.pdf (accessed 4.21.19).
Eskom, 2018b. MYPD 3: Regulatory Clearing Account Submission to NERSA. Accessed at http://www.nersa.org.za/Admin/Document/Editor/file/Consultations/Electricity/Notices/Eskom%20MYPD%203%20-%20Regulatory%20clearing%20Account%20financial%20year%205 on 21 April 2019.
Fine, B., Rustomjee, Z., 1996. The Political Economy of South Africa: From Minerals-Energy Complex to Industrialisation. C. Hurst & Co. Publishers, London.
Fossil Fuel Foundation, 2011. South African Coal Roadmap: Overview of the South African Coal Value Chain. Accessed at http://www.fossilfuel.co.za/initiatives/2013/SACRM-Roadmap.pdf on 1 May 2019.
Fossil Fuel Foundation, 2011. South African Coal Roadmap: Overview of the South African Coal Value Chain.
Fraser, E.D.G. et al. 2011. “Assessing Vulnerability to Climate Change in Dryland Livelihood Systems Conceptual Challenges and Interdisciplinary Solutions,” in, Ecology and Society XVI.3. September.
Frost, H. 2019. “Buses using natural gas to curb fuel costs,” in Engineering News. Johannesburg. 1 February.
Galvin, K.A. et al. nd. “Adaptation to Climate Variability and South African Livestock Systems: Lessons for Long-term Climate Change.” Downloaded from CSIR. South African Risk and Vulnerability Atlas. Available at http://sarva2.dirisa.org/.
Gbetibouo, G.A. and Ringler, C. 2009. Mapping South African Farming Sector Vulnerability to Climate Change and Variability: A Subnational Assessment. IFPRI Discussion Paper 00885. August. IFPRI. Washington, D.C.
Gbetibouo. G.A. 2009. Understanding Farmers’ Perceptions and Adaptations to Climate Change and Variability: The Case of the Limpopo Basin, South Africa. IFPRI Discussion Paper 00849. IFPRI. Washington, D.C.
GreenCape. 2019. Sustainable Agriculture 2019 Market Intelligence Report. Authored by Inge Kuschke and Adila Cassim. GreenCape. Cape Town.
154
Harvey, J., 2018. Reuters UK. Available at: https://uk.reuters.com/article/uk-platinum-fuelcells/platinums-days-as-fuel-cell-car-component-may-be-numbered-idUKKBN1GZ2KO. Accessed 28 April 2019.
Hodder, W., 2010. What Mineral Products & Metals Are Needed To Make Wind Turbines? (Factsheet). Minerals Education Coalition, Englewood, CO.
Hortgro Science. 2018. 2017/18 Annual Report. Hortgro Science. Downloaded www.hortgro-science.co.za in September 2019.
Hortgro. 2019. Deciduous Fruit Statistics. Downloaded from www.hortgro.co.za in September 2019.
ICMM, 2012a. Mining’s Contribution to Sustainable Development - An Overview (InBrief), Mining’s Contribution to Sustainable Development. International Council on Mining and Metals, London.
ICMM, 2012b. The Role of Minerals and Metals in a Low Carbon Economy (InBrief), Mining’s Contribution to Sustainable Development. International Council on Mining and Metals, London.
ICT. 2019. TradeMap. Electronic database. Downloaded from www.trademap.org in May 2019.
IEA, 2018. Coal 2018 - Analysis and Forecasts to 2023, Market Report Series. International Energy Agency.
IEA, 2019. “Global energy demand rose by 2.3% in 2018, its fastest pace in the last decade”. Accessed at https://www.iea.org/newsroom/news/2019/march/global-energy-demand-rose-by-23-in-2018-its-fastest-pace-in-the-last-decade.html on 22 April 2019.
IEA, 2019. Oil 2019. International Energy Agency, Paris.
Ihekwoaba, C., 2019. The Nerve Africa. [Online]
ILO, 2018. World Employment and Social Outlook 2018, Geneva: ILO.
Impala Platinum, 2018. Sustainable Development Report 2018. Impala Platinum, Johannesburg.
International Federation of Red Cross and Red Crescent Societies, 2019. International Federation of Red Cross and Red Crescent Societies. [Online]
IOL, 2017. “Eskom cancels six coal transport contracts.” Accessed at https://www.iol.co.za/business-report/energy/eskom-cancels-six-coal-transport-contracts-7633165 on 22 April 2019.
IPCC, 2007. Climate change 2007: Impacts, Adaptation and Vulnerability. Contribution of Working Group II to the Fourth Assessment Report of the Intergovernmental Panel on Climate Change, Cambridge: Cambridge University Press.
Johnston, P. et al. “South Africa,” in Sepo Hachigonta et al. 2013. Southern African Agriculture and Climate Change: A comprehensive analysis. IFPRI. Washington, D.C.
Jooste, M., Winkler, H., van Seventer, D., Truong, T.P., 2009. The Effect of Response Measures to Climate Change on South Africa’s Economy and Trade. Final Report to the Department of Environmental Affairs. Energy Research Centre at the University of Cape Town, Cape Town.

155
Khosa, M. M., 1995. Transport and popular struggle in South Africa. Antipode, 27(2), pp. 167-188.
Kings, S., 2017. Mail & Guardian. [Online]
KPMG, 2017. Economic Impact Assessment of five of Eskom’s coal power stations - Camden | Grootvlei | Hendrina | Komati | Kriel.
Kruger, A.C. and Nxumalo, M.P. 2017. “Historical rainfall trends in South Africa: 1921–2015, in Water SA XLIII.2 (April)
Lamprecht, N., 2019. Automotive industry export manual, Lynnwood Ridge: Automotive Industry Export Council.
Ledwaba, P.F., 2017. The status of artisanal and small-scale mining sector in South Africa: tracking progress. Journal of the Southern African Institute of Mining and Metallurgy, 117, 33–40.
Lonmin, 2018. Sustainable Development Report 2018. Lonmin, London.
Mabasa, M., 2019. Interview for the Sector Jobs Resilience Plans project [Interview] (6 August 2019).
Makgetla, N., Levin, S., 2016. A perfect storm: Migrancy and mining in the North West Province (Working Paper). Trade & Industrial Policy Strategies, Pretoria.
Makwitting, N., 2019. SABC News. [Online]
Maluleke, W., and Mokwena, R. 2017. “The effect of climate change on rural livestock farming: Case study of Giyani Policing Area, Republic of South Africa,” in South African J. Agricultural Extension XLV.1
MCSA, 2018. Facts and Figures 2017. Minerals Council. Johannesburg.
MCSA. 2018. Facts and Figures 2018. Minerals Council. Johannesburg.
Minerals Council South Africa, 2018. FACTS AND FIGURES 2017 [WWW Document]. URL https://www.mineralscouncil.org.za/downloads/send/18-current/634-facts-and-figures-2017
Minerals Council South Africa, n.d. Women in Mining in South Africa - Fact sheet [WWW Document]. URL https://www.mineralscouncil.org.za/industry-news/publications/fact-sheets/send/3-fact-sheets/424-women-in-mining (accessed 5.3.19).
Minerals Council South Africa. n.d. “Women in Mining in South Africa - Fact sheet.” Accessed at https://www.mineralscouncil.org.za/industry-news/publications/fact-sheets/send/3-fact-sheets/424-women-in-mining on 3 May 2019.
Montmasson-Clair, G., Ryan, G., 2014. The impact of electricity price increases on the competitiveness of selected mining sector and smelting value chains in South Africa: Has it incentivised mining-related companies to invest in renewable energy, cogeneration and energy efficiency? Trade & Industrial Policy Strategies and Global Green Growth Institute, Pretoria and Seoul.
Mqadi, L. 2005. Production function analysis of the sensitivity of maize production to climate change in South Africa. M.Sc. thesis. University of Pretoria.

156
Muhovich, T., 2010. Metals & Mineral Products used to Make a Solar Panel (Factsheet). Minerals Education Coalition, Englewood, CO.
NAACAM, 2018. NAACAM News, executive update. Pretoria.
OABS Development. 2018. Study on the Potential Product Development for the Commercialization and Value Add to Beef Products. Industrial Development Corporation. Johannesburg.
Oirere, S., 2017. Hydrocarbon Processing. [Online]
Pearce, K., 1999. Recapitalisation of taxi industry: briefing [Interview] (09 November 1999).
Pinto, I.S. 2015. Future changes in extreme rainfall events and circulation patterns over southern Africa. Ph.D. thesis. University of Cape Town.
Prinsloo, K.-A., 2016. The Logistics of Transporting Coal. Mining Africa Online.
Promethium Carbon, Urban-Econ Development Economists, 2018. Impact of the carbon tax on jobs. Business Unity South Africa, Johannesburg.
Quinn, C.H. et al. 2011. “Coping with Multiple Stresses in Rural South Africa,” in, Ecology and Society XVI.3. September.
SA Taxi. 2018. SA Taxi Business Overview: Financial Year 2018. Johannesburg.
SARS. 2018. “SARS 2017 Tax Statistics – CIT.” Excel spreadsheet. Downloaded from www.sars.gov.za in December 2018.
Sasol, 2018. Sasol Limited Form 20-F 30 June 2018.
SAWS. 2017. A Climate Change Reference Atlas 2017. South African Weather Service. Pretoria.
Scholtz, M.M. et al. 2013. “A South African perspective on livestock production in relation to greenhouse gases and water usage,” in SA J. Animal Science. XLIII.3
Schulze, R.E. 2016. “On Observations, Climate Challenges, the South African Agriculture Sector and Considerations for an Adaptation Handbook,” in R.E. Schulze (ed.), Handbook for Farmers, Officials and Other Stakeholders on Adaptation to Climate Change in the Agriculture Sector within South Africa. Department of Agriculture, Forestry and Fisheries. Pretoria.
Schulze, R.E. and Schütte, S. 2016. “Citrus Fruit Production in South Africa and Climate Change,” in R.E. Schulze Handbook for Farmers, Officials and Other Stakeholders on Adaptation to Climate Change in the Agriculture Sector within South Africa. Section E: Horticultural Crops in South Africa and Climate Change, Chapter E4. Department of Agriculture, Forestry and Fisheries. Pretoria.
Schulze, R.E. ed. 2016a. Crops and Climate Change in South Africa 2: Other Crops, Including Biofuels Feedstock Crops. Thematic Booklet 5. Department of Agriculture, Forestry and Fisheries. Pretoria.
ScienceStruck, 2018. The Actual Difference Between Surface and Underground Mining [WWW Document]. URL Available: https://sciencestruck.com/difference-between-surface-underground-mining (accessed 12.9.18).
Sibanye-Stillwater, 2018. Integrated Annual Report 2018. Sibanye-Stillwater, Roodepoort.

157
Statistics South Africa, 2018. General household survey: Selected development indicators, 2017, Pretoria: Statistics South Africa.
Statistics South Africa. 2016a. Labour Dynamics. Interactive database. Downloaded from Nesstar facility at www.statssa.gov.za in September 2019.
Statistics South Africa. 2016b. Manufacturing industry: Financial, 2014. Pretoria.
Statistics South Africa. 2017a. Retail trade industry, 2015. Pretoria.
Statistics South Africa. 2017b. Labour Dynamics 2017. Interactive database. Downloaded from Nesstar facility at www.statssa.gov.za in September 2019.
Statistics South Africa. 2017c. General Household Survey 2017. Interactive database. Downloaded from Nesstar facility at www.statssa.gov.za in September 2019.
Statistics South Africa. 2018. General Household Survey 2018. Interactive database. Downloaded from Nesstar facility at www.statssa.gov.za in September 2019.
Statistics South Africa. 2018a. Tourism Satellite Account for South Africa, final 2015 and provisional 2016 and 2017. Pretoria.
Trade Map, 2018. List of importing markets for a product exported by South Africa - Product: 3915 Waste, parings and scrap, of plastics.
Transnet, 2018. Integrated Report 2018. Transnet, Johannesburg.
U.S. Geological Survey, 2019. Mineral commodity summaries 2019. U.S. Geological Survey, Reston, VA.
University of Technology, n.d. Mining Methods [WWW Document]. URL University of Technology, Iraq. Available: http://uotechnology.edu.iq/dep-production/branch5_files/2%20class-INTRODUCTION%20TO%20%20%20%20MINING-.pdf (accessed 12.9.18).
van Delsen, A. 2018. Minibus Taxis. HSF Brief. Helen Suzman Foundation. 8 March.
Van Garderen, E. 2011. “(Re) Considering Cattle Farming in Southern Africa under a Changing Climate,” in American Meteorological Society. Weather, Climate and Society. 2011. 3.IV. USA.
WEF, Accenture, 2014. Scoping Paper: Mining and Metals in a Sustainable World. World Economic Forum, Geneva.
Western Cape Government. 2018. Western Cape Climate Change Response Strategy 2nd Biennial Monitoring & Evaluation Report 2017/18. Department of Environmental Affairs and Development Planning. March. Cape Town.
Whitefield, C., 2018. Moore South Africa. [Online]
Who Owns Whom. 2019a. The Fresh Fruit and Vegetable Industry. Compiled by Duncan Bekker. Johannesburg.
Wiechman, M., 2010. What’s in a Hybrid Car? (Factsheet). Minerals Education Coalition, Englewood, CO.
Wilson, A.M. et al. 2015. “Climatic controls on ecosystem resilience: Postfire regeneration in the Cape Floristic Region of South Africa,” in Proceedings of the National Academy of Sciences of the United States of America, CXII.29. 21 July.

158
World Bank, 2017. The Growing Role of Minerals and Metals for a Low Carbon Future. World Bank Group, Washington, D.C.
World Bank, 2018. Managing Coal Mining Closure - Achieving a Just Transition for All. World Bank.
WOW. 2018a. The Motor Vehicle Industry. Who Owns Whom. Johannesburg.
WOW. 2018b. Freight Transport by Road. Who Owns Whom. Johannesburg.
WOW. 2018c. The Petroleum Industry in South Africa. Who Owns Whom. Johannesburg.
Zwane, M. and Montmasson-Clair, G. 2016. A Policy Assessment: Climate Change Adaptation and Agriculture in South Africa. WWF Policy Brief. Pretoria.