economic impact assessment - retail council of canada · economic impact assessment ... retail...
TRANSCRIPT

www.pwc.com/ca
Rise in Canada’s de minimis threshold Economic Impact Assessment
December 2017

Contents
Executive Summary 1
Objective 1
Retail Sector 1
Canadian Retail Price Competitiveness 1
Net Economic Impact 1
1. Introduction 3
Authors of the Report 3
2. Background 4
De Minimis Threshold 4
Literature Review 5
3. Approach & Methodology 7
4. The Canadian Retail Sector 8
Overview 8
Retail and E-tail Sales 8
Sales by Retail Sub-sectors 11
Sales by Retail Product Categories 13
Economic Footprint 16
5. E-tail Trends 17
E-tail in Canada 17
E-tail by Product categories 19
6. Price Competitiveness 21
Price Gap for Canadian Consumer: US vs. Canada 21
Product Price Gap 23
7. Impact Analysis of DMT Rise 26
Impact on Retail Sales 27
Price Sensitivity of Retail Sales 30
Likely Loss of Canadian Retail Sales 31
8. Stakeholders: Impact Analysis 34

Consumers 34
Government 34
Foregone Revenues 34
Cost Savings 36
Canadian manufacturers 37
9. Economic Impact Analysis 39
Aggregate Economic Impact 40
Economic Impact of Retail Sales Loss 40
Economic Impact of Higher Consumer Income 41
Net Economic Impact 42
Employment 45
Feedback and Spillover Effects 51
Appendix 1: Estimation Methodology 52
Retail and E-tail Sales 52
Price Levels 52
Price Differences Due to Rise in DMT 53
Likely Loss in Retail Sales 54
Government Revenues Foregone 55
Appendix 2: Processing Costs Incurred by the Private Sector 57
References 59

1
Executive Summary
Objective At the outset of the current renegotiation of the North American Free Trade Agreement (NAFTA), the US has stated its position that the de minimis threshold (DMT) of Canada, which is presently at C$20 should be raised to levels comparable to the US DMT of US$800. The DMT is the threshold value of postal and courier shipments from foreign countries below which the shipped goods are exempt from taxes and duties. In this context, PwC has been retained by the Retail Council of Canada to provide an independent assessment of the impact on the Canadian economy of a change of such nature (“Assessment”).
The objective of this Assessment is to evaluate the likley impacts of such a change (should it be implemented) on the Canadian economy and key stakeholders, including: (i) Retailers; (ii) Government; (iii); Consumers; and (iv) Local Manufacturers.
Retail Sector The North American Industry Classification System (NAICS) defines the retail sector as “the sector comprising establishments primarily engaged in retailing merchandise, generally without transformation, and rendering services incidental to the sale of merchandise. The retailing process is the final step in the distribution of merchandise; retailers are therefore organized to sell merchandise in small quantities to the general public.”
Retail Sales and e-tail Sales: Canada’s retail sales increased from C$508.7 billion in 2012 to C$605.0 billion in 2016, equivalent to an annual average growth rate of 4.4% per annum, and assuming continuation of this trend it would increase to C$713.6 billion in 2020. The share of e-tail sales in total retail sales of the Canadian retail sector has gone up from 1.6% in 2012 to 2.2% in 2016 and is currently expected to reach 3.0% by 2020. In magnitude, the e-tail sales of Canada’s retail sector increased from C$8.3 billion in 2012 to C$13.0 billion in 2016 and are expected to reach a level of C$21.5 billion by 2020.
Economic Footprint: Through its direct, indirect and induced impacts, the retail trade sector generated and facilitated almost 3.4 million jobs, $198.7 billion of GDP and $339.9 billion of output to the Canadian economy in 2016. We further estimate a total labour income of $125.2 billion, or an average $36,900 per job facilitated by the retail sector.
Canadian Retail Price Competitiveness On a weighted average basis, across all product categories for items below US$800, the final price charged to a Canadian consumer for a shipment from the US is currently 11.6% lower than the equivalent Canadian price. Disaggregating this differential, the product price (before shipment, taxes and duties) gap is the most significant contributor at 36%, while the shipping cost reduces the price gap by 18 percentage points. Taxes and import costs including custom duties collectively reduce the price gap by about 7 percentage points. The said differentials are similar across all product categories below US$200. With a rise in DMT that eliminates taxes and duties, Canada US weighted average price gap will rise to 25%. With a rise in DMT that eliminates only duties, the Canada US price gap will rise to about 15%.
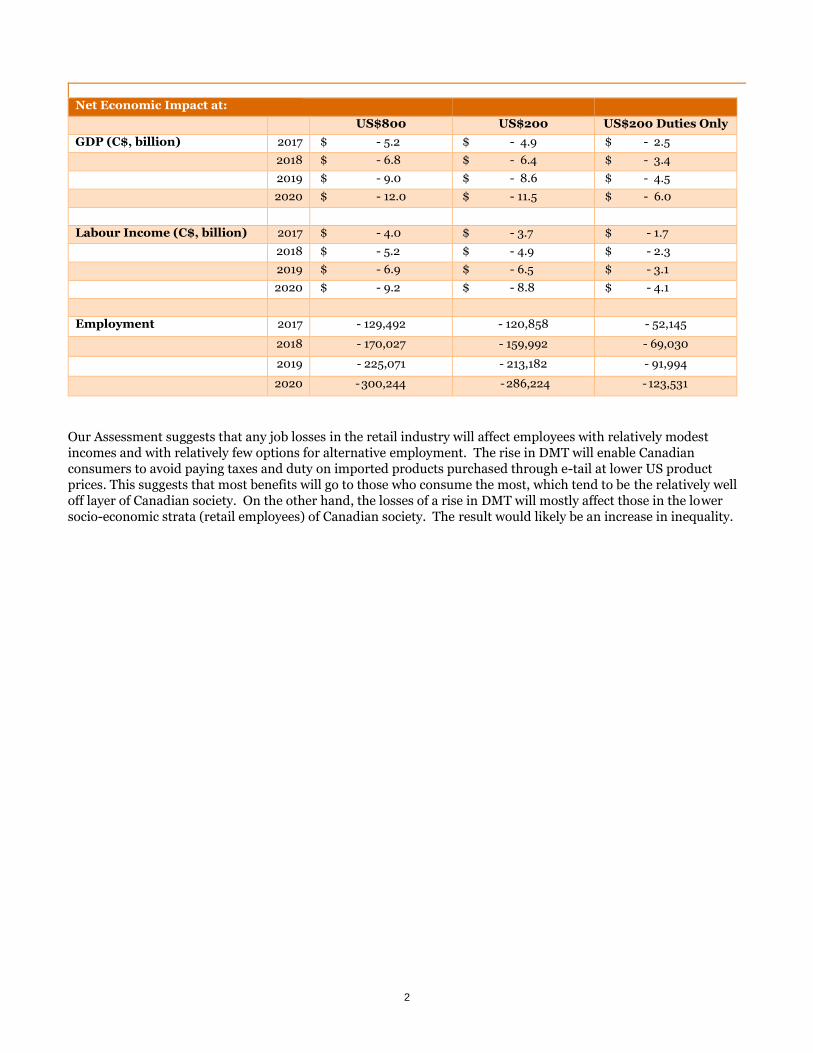
Net Economic Impact The net aggregate economic impact on the Canadian economy from a rise in the DMT to US$800 or US$200 has been estimated for three scenarios: (i) US$800 DMT with elimination of both taxes and duties (ii) US$200 DMT with elimination of both taxes and duties (iii) US$200 DMT with elimination of only duties. Our estimates are summarized below:
2
Net Economic Impact at:
US$800 US$200 US$200 Duties Only
GDP (C$, billion) 2017 $ - 5.2 $ - 4.9 $ - 2.5
2018 $ - 6.8 $ - 6.4 $ - 3.4
2019 $ - 9.0 $ - 8.6 $ - 4.5
2020 $ - 12.0 $ - 11.5 $ - 6.0
Labour Income (C$, billion) 2017 $ - 4.0 $ - 3.7 $ - 1.7
2018 $ - 5.2 $ - 4.9 $ - 2.3
2019 $ - 6.9 $ - 6.5 $ - 3.1
2020 $ - 9.2 $ - 8.8 $ - 4.1
Employment 2017 - 129,492 - 120,858 - 52,145
2018 - 170,027 - 159,992 - 69,030
2019 - 225,071 - 213,182 - 91,994
2020 - 300,244 - 286,224 - 123,531
Our Assessment suggests that any job losses in the retail industry will affect employees with relatively modest incomes and with relatively few options for alternative employment. The rise in DMT will enable Canadian consumers to avoid paying taxes and duty on imported products purchased through e-tail at lower US product prices. This suggests that most benefits will go to those who consume the most, which tend to be the relatively well off layer of Canadian society. On the other hand, the losses of a rise in DMT will mostly affect those in the lower socio-economic strata (retail employees) of Canadian society. The result would likely be an increase in inequality.

3
1. Introduction
At the outset of the current renegotiation of the North American Free Trade Agreement (NAFTA), the US has stated its position that the de minimis threshold (DMT) of Canada, which is presently at C$20 should be raised to levels comparable to the US DMT of US$800. The DMT is the threshold value of postal and courier shipments from foreign countries below which the shipped goods are exempt from taxes and duties. In this context, PwC has been retained by the Retail Council of Canada to provide an independent assessment of the impact on the Canadian economy of a change of such nature (“Assessment”).
The objective of this Assessment is to evaluate the likley impacts of such a change (should it be implemented) on the Canadian economy and key stakeholders, including: (i) Retailers; (ii) Government; (iii); Consumers; and (iv) Local Manufacturers.
A signficant rise in DMT will primarily benefit cross-border shipments made by individual consumers for personal consumption. Globally, e-tail (i.e. retail business conducted online) is growing exponentially with greater access and awareness on the demand side and enhanced capabilities on the supply side. In addition, cross-border shipment is becoming more affordable and reliable, which enables consumers to search for the lowest price across borders while making purchases. Our Assessment focuses on the question of how would an increase in DMT affect the inclination of Canadian consumers to switch their purchases from Canadian retailers, including “brick and mortar” and e-tail, to import e-tail (i.e. e-tail from non Canadian based retailers or websites), and how such shift would impact the Canadian economy and key stakeholders. We note that throughout this report, in converting US dollar amounts into Canadian dollars we used the Purchasing Power Parity (PPP) exchange rate of 1.269 CAD/USD1.
Authors of the Report This study has been prepared by the Economics Practice at PricewaterhouseCoopers (PwC), Canada. The following are the main contributors to this report: Michael Dobner, National Leader of Economics Practice Matthias Oschinski, PhD – Senior Economist Manpreet Kaur Juneja - Economist Michal Staszewski – Economist Elisa Swern – Retail Specialist
1 OECD Data: https://data.oecd.org/conversion/purchasing-power-parities-ppp.htm#indicator-chart

4
2. Background
De Minimis Threshold De minimis is a Latin term meaning too trivial or minor to merit consideration. De Minimis Threshold (DMT) is the minimum value of the goods below which no taxes and duties are being collected by customs of the country to which these goods are shipped to. As per the Transitional Standard 4.13 of World Customs Organization’s Revised Kyoto Convention: “National legislation shall specify a minimum value and/or a minimum amount of taxes and duties below which no duties and taxes will be collected”. For customs clearance, DMT is used in two ways: First, DMT is a threshold value below which taxes and duties are not collected and no customs declaration is required; Second, Low Value Threshold (LVS) is a reporting threshold value below which a simplified customs declaration is sufficient. The Global Express Association publishes the variations in DMT thresholds across the world. According to this source, DMT threshold values vary from US$0 in Australia, Costa Rica, Bahrain and Guatemala to US$1,000 in Azerbaijan. As of November 19, 2017, about 44 countries have DMT under US$30 for collection of sales taxes, duties or both.
Countries like Georgia, Korea and India apply DMT to certain commodities only. Korea and the European Union have different DMT for different countries. Argentina, Bolivia, Brazil, Chile, Morocco have DMT applicable only on postal shipments. Several countries have an informal entry threshold in addition to DMT, which is mostly applied to low-value imports for personal consumption. Some countries, particularly in the European Union, have set separate thresholds for collecting custom duties and taxes (e.g. value added tax -VAT- in Europe or GST in anada), including Austria, Belgium, Denmark, France, Finland, Germany, Greece, Hungary, Ireland, Italy, Netherlands, Poland, Portugal, Spain, Sweden and the United Kingdom. The rationale has been that the collection of customs duty is more burdensome than the collection of taxes. To assess taxes on an import shipment, customs only has to establish the value of the parcel. To assess customs duty, additionally the correct tariff classification has to be identified2. It should be noted that the relatively higher cost of collecting duty can be mitigated via a simplified tariff schedule. In addition, automation of customs through an e-customs system can furrther simplify the assessment.
Recognizing the rapid growth in online sales which in turn may fuel cross-border sales, some governments are concerned about the increase in losses to the economy emerging from a DMT that exempts taxes on imports. In a press release by European Commission on ‘Modernising VAT for e-commerce’ dated December 1, 2016, it proposes removal of VAT exemption on all imports regardless of value.3 On June 26, 2017, the Australian parliament passed the Treasury Laws Amendment (GST Low Value Goods) Act 2017, which reduces the DMT for collection of Australian GST from AU$1,000 to AU$0 (discussed in more detail below).4
The DMT regulatory framework in Canada is applied through the Postal Imports Remission Order and the Courier Imports Remission Order for both commercial and non-commercial imports. Under these Orders, imports of items worth C$20 or less are exempt from payment of taxes and duties. If the item is worth more than C$20, the applicable duty and sales tax (GST/HST/PST) must be paid on the item’s full value. Certain items do not qualify for the exemption including books, periodicals, magazines, tobacco, and alcoholic beverages. In addition, the Courier Low Value Shipment (LVS) program streamlines the processing of low-value shipments up to C$2,500 by providing the express courier industry with expedited release.
2 Place of origin is also required but that is already done for documentation purposes regardless of duty collection 3 European Commission Press Release Database – Factsheet, Modernising VAT for e-commerce: Questions and Answers, Brussels, 1 December 2016: http://europa.eu/rapid/press-release_MEMO-16-3746_en.htm 4 Australian Government, Federal Register of Legislations, Treasury Laws Amendment (GST Low Value Goods) Act 2017, No. 77 (C2017A00077), 2017, https://www.legislation.gov.au/Details/C2017A00077
5
In March 2016, the DMT threshold of the US was raised from US $200 to US $800. Under current NAFTA negotiations, the US administration has demanded a similar increase in Canada’s DMT threshold.
Literature Review We reviewed a number of studies that were undertaken on this issue. The following summarizes the key findings of these studies and, where applicable, our comments. The C.D. Howe Institute (2016) 5 reviewed an eBay-commissioned study on the impact of a rise in the DMT threshold on three stakeholders: (i) Government (ii) Consumers (iii) Businesses. It does not estimate the impact on Canadian retailers, which is the largest private sector employer in Canada. The study used import data of parcels into Canada and the distribution of parcels across consignment values in estimating the impact. The study concludes that a rise in DMT will benefit consumers and small businesses by lowering the cost of goods they are importing. The study claims that the government will see a neutral impact on its revenues, as the loss of duty and taxes collected will be roughly offset by lower collection costs. The above study has an underlying assumption that the flow of goods across the border will remain the same with a rise in DMT. At present DMT is at C$20, i.e. relatively few product items fall under this bracket. In addition, the price sensitivity of consumers is quite low for products priced below C$20. A signficant increase of DMT will bring the large majority of consumer products under the purview of the DMT bracket. In addition, the price sensitivity of consumers increases with the increase in the value of goods, which suggests that an increase in DMT may lead to a significant increase in the volume of cross border imports. In this regard, the study’s assumption (of no change in volume) appears unrealistic and may underestimate the revenue foregone by the government. The study may have also ignored the fact that most Canada Custom activities are unrelated to tax and duty collection and as such a rise of DMT will not eliminate the need for custom procedures such as border and documentary compliance checks, including those in relation to illicit drug and prescription drug interdiction, restricted and prohibited goods (e.g., firearms and ammunition, food, plants, animals and related products, and goods subject to specific Canadian safety requirements) and counterfeit goods. Moreover, unless all imported parcels were exempted from sales taxes and duties, much of the capacity for inspection and assessment would need to remain in place in order to address those items of a value higher than the DMT, The study also predicts a positive effect on small and medium businesses in terms of administrative costs, tax and duty. In this regard, we note that businesses usually order inputs in bulk, which is often higher than the proposed DMT threshold of USD800. Moreover, the study does not deal with the fact that most sales tax on input costs incurred by businesses is refundable to those businesses. The growth of e-commerce and its effect upon sales tax revenues is a globally recognized phenomenon (W.Steel, 2016). A study by the University of Tennessee in 2009 estimates that the inability of state and local governments to enforce state and local sales tax on e-commerce resulted in an estimated revenue loss in the range of US$11.4 billion to US$12.65 billion in 2012. In total, for the period 1999-2006, the total sales tax loss was estimated to be US$52.1 billion. During this period, e-commerce sales grew at a compound average annual growth rate of 13.3 percent. Marketline and Forrester predict similar growth rate for Canadian e-commerce between 2015 and 2021. The study estimates that if small vendors with sales upto US$1 million were exempt from tax collection, the sales tax collection decline would have amounted to US$3.4 billion in 2012. The Australian Government’s Productivity Commission prepared an Inquiry Report in 2011 to assess the structure and performance of the retail industry, online purchases, impacts of indirect tax arrangements and other regulatory or policy issues. The low value threshold for imports in Australia at that time was AU$1,000 that exempted most imports from GST, customs duty, fees, charges and the requirement to complete a full import declaration. Australian retailers argued this to be a subsidy to foreign online businesses that could drive them out of business. The Commission estimated that reducing the threshold to AU$100 would raise AU$500 million in revenue while customs processing charges would cost $750 million. Also, it estimated the total cost to society (customs, post, courier, businesses, consumers) to be over AU$1.2 billion. While the revenue loss was only estimated from GST and duties collection, the costs have been estimated for the entire society. In this regard, we note that revenue lossed would also result from a reduction in domestic economic activity. Moreover, the custom processing cost estimates
5 C.D. Howe (2016) , McDaniel C., Schropp S., Latipov O., Rights of Passage: The Economic Effects of Raising the de minimis Threshold in
Canada, Trade and International Policy, June 2016

6
in this study were not based on an incremental analysis but rather on a full cost allocation. In this context, Australian Customs stated that it is difficult to identify the incremental cost of collecting revenue due to the integrated nature of processing international mail. On the basis of the above observations, it appears that the indicated net government loss in this study was underestimated. In consequence of concerns raised by the Inquiry Report and more generally by Australian retailers, on June 26, 2017, the Australian parliament passed the Treasury Laws Amendment (GST Low Value Goods) Act 2017, which reduced the DMT for collection of Australian GST from AU$1,000 to AU$0.
In New Zealand, duties and taxes are payable if they exceed NZ$60, which means an effective DMT threshold value between NZ$226 and NZ$399. The DMT provides an implicit subsidy of 15% for offshore retailers. Einav et al’s (2012) study estimates that for a 1% increase in sales tax, sales of domestic online retailers decrease by 3-4% while sales of foreign online retailers rise by 1.8%, i.e. a response to avoid GST. If this threshold was abolished, the cross-border purchases would fall by 45-60% and domestic retail sales would rise by 27%. Besides revenue loss, DMT provides adverse incentives discouraging offshore retailers to invest in New Zealand. Hence, methods to reduce customs’ enforcement costs are recommended. (W. Steel Study, 2016) New Zealand has one of the most advanced customs and trade facilitation procedures. New Zealand Customs Service operates electronic import documentation services available to all importers and it imposes penalties for misclassification by importers. It has an agreement with the New Zealand government requiring electronic import applications to be processed within 30 minutes and this target is achieved in around 99.5% cases with an average turnaround of 7 minutes. Also, its tariff structure has been considerably simplified since 2008. It consists mainly of three ad valorem rates (zero, 5%, 12.5%) and six specific rates. (WTO website) In 2011, New Zealand Customs’ estimated the revenue collection from taxes and duties on foreign shipments at NZ$61 per shipment. The cost to society at NZ$54.2 per shipment comprising NZ$24.2 processing cost to government and NZ$30 cost to courier companies. (W. Steel Study, 2016). Similar to our previous comments, we note that the Steel cost estimates were not based on an incremental analysis but rather on a full cost allocation.
The UK enforces different thresholds for tax and duties collection. The threshold for tax collection is relatively low at GBP15 while for custom duties it is at GBP135 but duties are waived if the amount of duties is less than GBP9. In May 2010, the UK had reduced its DMT threshold for VAT from GBP18 to GBP15 in order to create a level playing field between internet and brick-and-mortar stores (W. Steel, 2016).
7
3. Approach & Methodology
Our approach in estimating the economic impact of a rise in the DMT threshold has been balanced, dynamic and forward-looking taking into account the costs and benefits as well as the ongoing structural trends in the retail space. The key structural trend influencing this space is the growth in retail e-commerce or e-tail.
The DMT rise makes cross-border import shipments cheaper as taxes and duties are not levied on packages with an overall cost below the new DMT level. In assessing cross-border imports, we find that 98 to 99 percent of these shipments come from the US.6 Hence, we focus our analysis on the price reductions of US imported goods into Canada, through e-tail, that would occur if the DMT would rise. We then assess the price sensitivity of consumers in order to estimate the likely displacement of Canadian retail and e-tail sales by in US imported e-tail.
On the cost side, we estimate the economic impact of sales losses by the Canadian retail sector and the loss of net government revenues (i.e. net of savings from a reduction in custom procedures). On the benefit side, we estimate the gain to consumers because of lower product prices.
Our conclusions therefore represent the culmination of an informed and holistic review. Our conclusions are not meant to serve as a recommendation to policy makers; rather they intend to serve as a framework for an informed decision-making. In other words, our conclusions intend to provide stakeholders a balanced view of the likely impacts of a regulatory change in Canada’s DMT level.
Based on the above we assess the overall impacts on key Canadian stakeholders including, retailers and their employees, consumers, government and manufacturers.
Given our approach, our methodology included the following steps:
1. Review of the Canadian retail sector, its overall sales trends and e-tail sales by key product categories, and its current economic footprint in Canada.
2. Analysis of e-tail trends in Canada and comparison to the US. As e-tail activity varies product type, we analysed e-tail trends by key product categories. As indicated previously, in the context of the proposed increase in Canada’s DMT threshold, e-tail trends are key to understanding how consumers would respond to such change.
3. Evaluation of the competitiveness of retail prices in the US compared to Canada and the underlying reasons for lower prices in US. Through a primary survey, we estimate the final price charged to a Canadian consumer by US e-tailer in comparison to the final price charged to a Canadian consumer by a Canadian retailer (the Canada-US price gap) for different key product categories. We then disaggregate The Canada-US price gap into four components: product price; shipment cost; taxes; and and import costs (e.g. duties) in order to analyze the driving factors of this price gap. On the basis of this analysis, we estimate the expected reduction in price for the Canadian consumer under three assumed scenarios of DMT increase.
4. Estimate of the likely impact on purchase patterns by Canadian consumers of various product categories from 2017 up till 2020, given a rise in the DMT and the expected growth in e-tail.
5. Examination of the impact on key stakeholders including: government, consumers and local manufacturers. For the government sector, we estimate the impact on net government revenue by assessing revenue foregone vis-à-vis cost savings from elimination of tax and duties collection efforts. For consumers, we estimate the potential savings from the reduction in prices arising from lower US product prices as well as avoidance of taxes and duties and its impact on the Canadian economy. For local manufacturers the loss in employment has been estimated.
6. Estimate of the impact on the economy at an aggregate level on key variables – GDP, employment, and labour income.
6 Canadian International Merchandise Trade Database, HS Code 999999 – Postal Services and Courier

8
4. The Canadian Retail Sector
Overview The North American Industry Classification System (NAICS) defines the retail sector as “the sector comprising establishments primarily engaged in retailing merchandise, generally without transformation, and rendering services incidental to the sale of merchandise. The retailing process is the final step in the distribution of merchandise; retailers are therefore organized to sell merchandise in small quantities to the general public.”
The retail sector comprises a relatively large proportion of small-sized businesses. Defining size by the number of employees, of the total number of retail businesses, 142,565 (97.9%) are small-sized with 1-99 employees, 2,894 (2.0%) are medium-sized with 100-499 employees and 107 (0.1%) are large-sized with 500+ employees. The top 100 largest retailers account for 44 percent of retail sales. In 2016, the retail sector’s contribution to GDP was C$98.7 billion.7 The share of small-sized businesses in GDP contribution was 49%, large-sized businesses contributed 41% and medium-sized businesses contributed 11%. The contribution of the retail sector to the Canadian economy is largest in terms of employment. According to Statistics Canada 2016 Labour Force Survey, Retail and wholesale trade provide employment to 2.7 million Canadians, which is greater than any other sector. Retail trade accounts for about 85% of this employment at 2.1 million Canadians. In 2016, 72%, of the retail labour force worked for small enterprises, 6% worked for medium-sized enterprises, and 22% worked for large-sized enterprises.
Of the total number of retail chains, 58% are Canadian-owned and 42% are foreign-owned. For retailers of home improvement and grocery, ownership is mostly Canadian. Of the top 100 largest retailers that operate across various sub-sectors, 55 have Canadian ownership, 37 have US ownership and 8 are owned by parent firms in other countries. Of the total sales made by the retail sector, 61% are made by Canada-owned retailers and 39% are made by foreign-owned retailers, of which the large majority is US owned.8 On average, over the period 2010-16, the total annual capital expenditure spent by the retail sector was C$6.6 billion. Average repair expenditure spent was about C$2.2 billion per year.9
Retail and E-tail Sales Figure 1 depicts historical and projected (to 2020) sales in Canada’s retail sector. As shown in this figure, overall retail sales increased from C$508.7 billion in 2012 to C$605 billion in 2016, equivalent to an annual average growth rate of 4.4% per annum. Based on a simple extrapolation of this trend, the aggregate Canadian retail sales are projected to increase to C$713.6 billion in 2020.
The share of e-tail sales in total retail sales of the Canadian retail sector has gone up from 1.6% in 2012 to 2.2% in 2016 and is expected to reach 3.0% by 2020.10 In contrast, in the US, the share of e-tail sales in total retail sales was 8.2% in 2016 and is expected to rise to 13.9% by 2020.11
7 CANSIM Table 379-0031, GDP at basic prices by NAICS (seasonally adjusted, chained (2007 prices) 8 Data from CSCA Retail 9 CANSIM Table 029-0046, Capital and repair expenditures, non-residential tangible assets, by NAICS 10 The base of retail trade as defined by Statistics Canada has more than 50 percent sales in the categories of food, beverages, automobiles, fuels, commissions and services. These goods are not easily amenable to e-tail, especially cross-border e-tail. 11 US Census Bureau, Retail Sales; Forrester US E-tail growth projections

9
Figure 1: Canadian Retail Sales 2012-202012
In magnitude, e-tail sales of Canada’s retail sector increased from C$8.3 billion in 2012 to C$13.0 billion in 2016 and are expected to reach a level of C$21.5 billion by 2020.
Total e-tail purchases by Canadian consumers is estimated as the sum of Canadian e-tail sales and Canadian e-tail imports.13 Applying this definition shows that total e-tail purchases increased from C$13.2 billion in 2012 to C$20.4 billion in 2016.
As the numbers in Figure 2 indicate, this increase has been largely driven by domestic e-tail sales rising from C$8.3 billion in 2012 to C$13.0 billion in 2016. During the same period, e-tail imports increased from C$4.9 billion to C$7.4 billion, with about 99% being imported from the U.S.1415 In 2012-13, growth in e-tail was driven by import growth of 31.1% while domestic e-tail went up by only 0.2%. From 2013-14, however, this trend reversed and domestic e-tail growth was consistently higher than e-tail imports. In 2016 e-tail imports showed no growth compared to close to 15% growth in Canadian e-tail. This is likely a reflection of the fact that Canadian retailers have been developing, in recent years, e-tail capabilities.
12 Source: For 2012-16: Statistics Canada, CANSIM Table 080-0032; For 2017-20: Trend extrapolation for retail sales projections, average forecasts from ‘Forrester Canadian Online Retail 2014-19’ and ‘MarketLine Outlook: Canada Online Retail Sector’ for e-tail sales projections 13 Although the proportion of Canadian e-tail sales to international market has not been deleted in this approximation due to lack of availability of data on the same, it represents a very small share given very limited presence of Canadian retailers in global e-tail retailing. 14 Canadian International Merchandise Trade Database, HS Code 999999 ‘Postal Services and Courier’ 15The imported shipments might be higher than the officially reported number, as it has been observed that postal shipments often cross the border without assessment.
1.0%
1.5%
2.0%
2.5%
3.0%
3.5%
450
500
550
600
650
700
750
2012 2013 2014 2015 2016 2017 2018 2019 2020
E-t
ail
Sh
are
in
to
tal
sale
s
Sa
les
( in
bil
lio
n,
C$
)
Canadian Retail Sales: Share of E-tail Sales
Retail Sales E-tail Sales: Domestic Share of e-tail sales

10
Figure 2: Canadian E-tail Trends, 2012-201616
Figure 3 below depicts total Canadian retail sales by province. As shown, Ontario and Quebec displayed the highest retail sales in 2016 at C$202.2 billion and C$118.5 billion, followed by British Columbia at C$76.9 billion and Alberta at C$75.1 billion. Combined, the four provinces account for 86% of total Canadian retail sales.
Figure 3: Share of Retail Sales by Province17
16 Source: Statistics Canada, CANSIM Table 080-0032 (Domestic E-tail); Canadian International Merchandise Trade HS 999999 Postal services and courier (E-tail Imports) 17 Source: Statistics Canada, CANSIM Table 080-0032.
13.2 14.7
17.2 18.9
20.45
4.96.4 7.0 7.4 7.4
0%
5%
10%
15%
20%
25%
30%
35%
-
5.0
10.0
15.0
20.0
25.0
2012 2013 2014 2015 2016
E-t
ail
Gro
wth
ra
te (
%)
E-t
ail
Pu
rch
ase
s (i
n b
illi
on
, C
$)
Canadian E-tail Purchases
Total Imports Growth: Domestic E-tail Growth: E-tail Imports
Ontario, 37%
Quebec, 22%
Alberta, 14%
British Columbia, 14%
Manitoba, 3%
Saskatchewan, 3%
Nova Scotia, 3%
Newfoundland and Labrador, 2%
New Brunswick, 2%Others, 1%
Share of Retail Sales: By Province

11
Sales by Retail Sub-sectors Based on the NAICS 2012 definition, Canada’s retail sector has 12 sub-sectors out of which 11 are categorized as store retailers and one as non-store retailers.
Store retailers refer to the “fixed point-of-sale” locations, located and designed to attract a high volume of walk-in customers. They typically sell merchandise to the public for personal or household consumption, but some also serve businesses and institutions. In addition to selling merchandise, some types of store retailers are also engaged in the provision of after-sales services, such as repair and installation.”
The 11 retail sub-sectors that operate as store retailers are:
1. Motor vehicle and parts dealers
2. Furniture and home furnishings stores
3. Electronics and appliance stores
4. Building material and garden equipment and supplies dealers
5. Food and beverage stores
6. Health and personal care stores
7. Gasoline stations
8. Clothing and clothing accessories stores
9. Sporting goods, hobby, book and music stores 10. General merchandise stores 11. Miscellaneous store retailers
In contrast to store retailers, the 12th retail sub-sector, i.e. non-store retailers, undertake retailing using non-store methods. This sub-sector comprises three sub-groups:
Electronic shopping and mail-order houses that typically undertake transactions using information
technology. Delivery is conducted via mail or courier.
Vending machine operators that own, stock and service vending machines.
Direct selling establishments that primarily conduct retailing through door-to-door solicitation, in-home
demonstration and home delivery.
Of total retail sales, the sub-sectors ‘Motor vehicles and parts dealers’ and ‘Food and beverage stores’ comprise the largest shares at 23.7% and 20.8%, respectively, followed by ‘Gasoline stations’ and ‘General merchandise stores’ at 11.0% each (see Table 1).
Of total e-tail sales, ‘Non-store retailers’ have the largest share at 61.2%. Across store retailers, ‘Motor vehicles and part dealers’ have the largest share at 9.5%, followed by ‘Clothing and clothing accessories stores’ at 7.2%, ‘Electronics and appliance stores’ at 5.2% and ‘Sporting goods, hobby, book and music stores’ at 4.8%.
In recent years, the growth of e-tail sales has been faster than the growth of total retail sales for all the retail sub-sectors except ‘Motor vehicles and parts dealers’ and ‘Gasoline stations’.

12
Table 1: Retail Sales by Sub-Sectors (Average Shares for 2012-2016)18
Retail Sub-Sectors Average Shares (2012-16) in Total Retail Sales
Average share (2013-15) in Total E-tail Sales
E-Tail Sales Growth Forecasts (CAGR 2015-21)
Motor vehicle and parts dealers 23.7% 9.5% 4.2%
Food and beverage stores 20.8% 1.8% 11.4%
Gasoline stations 11.0% 0.0% 0.0%
General merchandise stores 11.0% 1.9% 12.2%
Health and personal care stores 7.9% 1.8% 13.6%
Building material and garden equipment and supplies dealers
5.7% 2.3% 14.2%
Clothing and clothing accessories stores
5.5% 7.2% 15.0%
Non store retailers 3.7% 61.2% 13.3%
Furniture and home furnishings stores
3.1% 2.3% 12.7%
Electronics and appliance stores 2.9% 5.2% 11.7%
Miscellaneous store retailers 2.5% 3.0% 13.2%
Sporting goods, hobby, book and music stores
2.2% 4.8% 12.6%
Figure 4: Retail Sales by Industry in C$ billion, 2016 and 2020*19
*projected
18 Source: Statistics Canada, CANSIM Table 080-0032 Retail trade, total sales and e-tail sales, by North American Industry Classification System (NAICS) for average shares; Statista, ‘2017 U.S. Cross-Platform Future in Focus, comScore for calculations for e-tail sales growth 19 Source: Statistics Canada, CANSIM Table 080-0032 Retail trade, total sales and e-tail sales, by North American Industry Classification System (NAICS) for average shares; Statista, ‘2017 U.S. Cross-Platform Future in Focus, comScore for calculations for e-tail sales growth
0 50 100 150 200
Motor vehicle and parts dealers
Furniture and home…
Electronics and appliance stores
Building material and garden…
Food and beverage stores
Health and personal care stores
Gasoline stations
Clothing and clothing…
Sporting goods, hobby, book…
General merchandise stores
Miscellaneous store retailers
Non store retailers
Retail Sales (C$ billion)
2016 2020
0 5 10 15
E-tail Sales (C$ billion)
2016 2020

13
Sales by Retail Product Categories Applying the NAICS retail sub-sector categorization is useful to analyze trends and changes with regard to the structure of Canada’s retail industry. However, to assess the change in consumption behavior, the analysis needs to be extended to the product level.
In this context, the North American Product Classification System (NAPCS) provides a classification of products (goods and services). For the purpose of this analysis, the following broad product categories have been used:
Food
Soft drinks and alcoholic beverages
Clothing
Footwear
Jewelry, watches, luggage, briefcases
Home furniture, furnishings, housewares, appliances and electronics
Sporting and leisure products
Motor vehicle parts
Home health products primarily pharmaceuticals and eyewear
Infant care, personal and beauty products
Hardware, tools, renovation, lawn and garden products
Miscellaneous products that includes pet products, artworks, antiques, and home/farm equipment
Others that include:
o Motor vehicles
o Recreational vehicles
o Automotive and household fuels
o Retail trade commissions and miscellaneous services
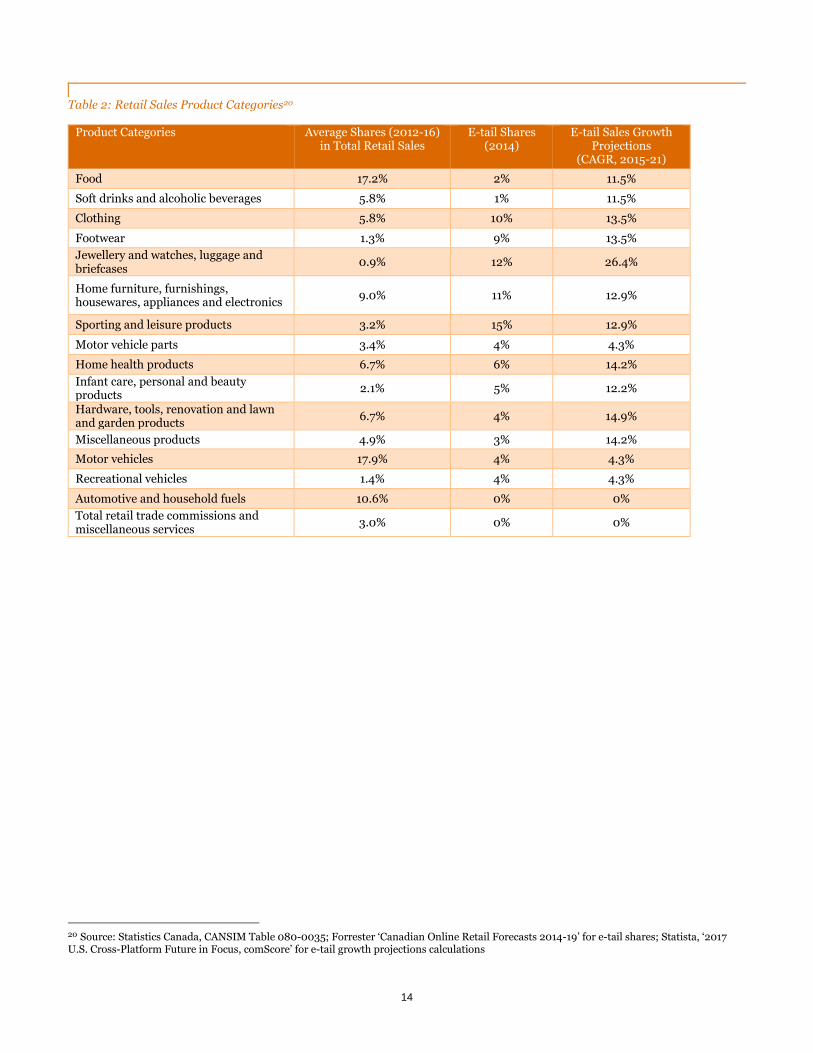
The product categories ‘Food’, ‘Motor Vehicles’, ‘Automotive and Household Fuels’ have relatively large shares in retail sales of 17.2%, 17.9% and 10.6%, respectively, while their e-tail sales shares are fairly low at 2%, 4% and 0% (see Table 2).
For food products, e-tail growth is projected to be relatively high at 11.5%. The next product category with a relatively large share in retail sales is ‘Home furniture, furnishing, housewares, appliances and electronics’, which also has the second largest share in e-tail sales at 27%. The highest share in e-tail sales is 32% for ‘Sporting and leisure products’, and the third highest is 13% for ‘Jewellery and watches, luggage and briefcases’, followed by clothing, miscellaneous products and footwear at 10%, 10% and 9%, respectively.
14
Table 2: Retail Sales Product Categories20
Product Categories Average Shares (2012-16) in Total Retail Sales
E-tail Shares (2014)
E-tail Sales Growth Projections
(CAGR, 2015-21)
Food 17.2% 2% 11.5%
Soft drinks and alcoholic beverages 5.8% 1% 11.5%
Clothing 5.8% 10% 13.5%
Footwear 1.3% 9% 13.5%
Jewellery and watches, luggage and briefcases
0.9% 12% 26.4%
Home furniture, furnishings, housewares, appliances and electronics
9.0% 11% 12.9%
Sporting and leisure products 3.2% 15% 12.9%
Motor vehicle parts 3.4% 4% 4.3%
Home health products 6.7% 6% 14.2%
Infant care, personal and beauty products
2.1% 5% 12.2%
Hardware, tools, renovation and lawn and garden products
6.7% 4% 14.9%
Miscellaneous products 4.9% 3% 14.2%
Motor vehicles 17.9% 4% 4.3%
Recreational vehicles 1.4% 4% 4.3%
Automotive and household fuels 10.6% 0% 0%
Total retail trade commissions and miscellaneous services
3.0% 0% 0%
20 Source: Statistics Canada, CANSIM Table 080-0035; Forrester ‘Canadian Online Retail Forecasts 2014-19’ for e-tail shares; Statista, ‘2017 U.S. Cross-Platform Future in Focus, comScore’ for e-tail growth projections calculations

15
Figure 5: Retail Sales by Product Category, in C$ billion21
21 Source: Calculations from Statistics Canada, CANSIM Table 080-0035; Forrester ‘Canadian Online Retail Forecasts 2014-19’; Statista, ‘2017 U.S. Cross-Platform Future in Focus, comScore’
0 50 100 150 200 250
Food
Soft drinks and alcoholic beverages
Clothing
Footwear
Jewellery, watches, luggage,…
Home furniture, furnishings,…
Sporting and leisure products
Motor Vehicle Parts
Home health products
Infant care, Personal and beauty…
Hardware, tools, renovation and…
Miscellaneous products
Others
Retail Sales (C$ billion)
2016 2020
By NAPCS:
0.0 2.0 4.0 6.0
E-Commerce Sales (C$ billion)
2016 2020

16
Economic Footprint Using the input-output model22, we estimate the total annual economic footprint (i.e. including direct, indirect and induced impacts) generated and facilitated by each of the ten retail trade subsectors between 2016 and 2020.
The economic footprint of the retail sector in 2016 is summarized in Table 3. Through its direct, indirect and induced impacts23, the retail trade sector generated and facilitated in 2016 almost 3.4 million jobs, $198.7 billion of GDP and $339.9 billion of output to the Canadian economy. We further estimate a total labour income of $125.2 billion, or $36,900 per job facilitated.
Table 3: Economic Footprint of Retail Sector in Canada, 2016. $ Millions except for jobs.
Economic Footprint Output GDP Labour Income Jobs
Direct $162,735 $98,695 $73,512 2,337,38724
Indirect $91,626 $51,027 $28,656 534,717
Induced $85,524 $48,993 $23,018 519,614
Total $339,885 $198,715 $125,187 3,391,718
Without an increase in DMT threshold, for the years from 2017 to 2020, the projected total economic footprint of the Canadian retail sector in terms of GDP, labour income and jobs is presented in Table 4.
Table 4: Economic Footprint of Retail Sector in Canada, 2017-20, without DMT threshold rise
Economic Footprint without DMT threshold rise
GDP (million, C$) Labour Income (million, C$) Jobs
2017 $ 205,916 $ 129,343 3,523,324
2018 $ 214,596 $ 134,795 3,671,838
2019 $ 223,641 $ 140,477 3,826,612
2020 $ 233,068 $ 146,398 3,987,910
22 A quantitative economic technique that represents the interdependencies between different branches of a national economy or different regional economies. Statistics Canada collects data and maintains the model for the Canadian economy. 23 See Section 9 for explanation of these types impacts. 24 Please note that this figure is higher than the employment figure provided by Statistics Canada Labour Force Survey from 2016, at 2.1 million (see Section 4 of this report). The difference is likely due to different methodologies used in the Statistics Canada Labour Force Survey and the input output model used by us to estimate the retail footprint.

17
5. E-tail Trends
Across the globe, e-commerce is growing at an exponential rate fuelled by technological advancement and increased digital literacy. As per the World Customs Organization, in 1999, 300 million people had access to internet and 75 million made a purchase online, while in 2014, 3 billion people had access to internet and 1.2 billion made a purchase online. With such exponential growth, the share of e-commerce is growing in every business line.
E-tail, i.e. the conduct of retail sales online has also been growing at an exponential rate and is changing the landscape of retail business. The internet provides local and regional players with easy access to global markets. The accessibility and usage of e-tail space is increasing with new applications, platforms and services. E-tail is considered more price competitive compared to traditional retailing because it uses less labour and employs microworkers25. Also, its trading system requires few intermediaries as individual purchasers can order goods directly from manufacturers and suppliers. With e-tail becoming the key trend in the retail space, most traditional brick-and-mortar retailers have developed e-tail capabilities. In the absence of a direct contact touchbase with e-tailer through a brick-and-mortar store, credibility of e-tailer is a key success factor. Amazon is currently considered the most preferred on-line retailer in North America.
Omnichannel retailing, i.e. combining brick-and-mortars, e-tailing and mobile retailing, is the strategy being followed by some retail businesses. The underlying objective of this strategy is to be available at any time anywhere, making it convenient for the customer. The IBIS Report (2017) states that “while brick-and-mortar titan Walmart Stores has taken steps to improve its online shopping capability and customer experience, e-commerce leader and rival retailer Amazon is moving in the opposite direction. Amazon is looking to expand its storefront footprint in cities and towns across the country.”
E-tail in Canada In Canada, the share of e-tail sales in total retail sales was 2.0% in 2015 compared to 7.2% in the US. By retail sub-sectors, ‘sporting goods, hobby, book and music stores’, ‘electronics and appliance stores’ and ‘clothing and clothing accessories stores’ comprise the largest proportion of e-tail in both the US and Canada. In Canada, the cumulative growth rate of e-tail sales over the period 2015-21 is forecasted to be 14% compared to 19% for US.26 There are differences in preferences for e-tail across product categories. In Canada, home furniture, furnishing, housewares, appliances and electronics products are one of the fastest growing segments of e-tail. In contrast, in the US, e-tail purchases of jewellery, watches, luggage, briefcases are growing the fastest.
Overall, e-tail is at a more advanced stage in US compared to Canada in terms of e-tail capabilities and consumer preference for e-tail. Investments in e-commerce capabilities in the US are signficantly larger than in Canada. Canadian online shoppers are acutely aware of the gap between online shopping experiences of domestic sites versus those in the US and complain about high shipping costs, lacklustre product assortments and lack of competitive pricing. US retailers are aggressively pursuing expansion into Canada and e-tail activity in Canada is expected accelerate in the future. In recent years, Canadian retailers have been investing heavily in e-tail capabilities.
A number of studies and surveys identify the preferences of Canadian consumers for online shopping and the trends in Canada’s e-tail space.
Lower Prices: The internet has reduced the search cost for price comparisons. Lower prices are a key driver for consumer purchase decision. The PwC Holiday Outlook Survey (2017) finds that price is the key consideration for
25 When companies need repetitive data entry tasks, content development or are interested in data mining, rather than hiring a full-time staff member they can turn to microwork outsourcing sites such as Amazon Mechanical Turk and others. This phenomenon is prevalent in e-tail. 26 2017 U.S. Cross-Platform Future in Focus, comScore’

18
62% of Canadian shoppers and 56% of Canadian online shoppers require the brick-and-mortar store to match online price. A GFK Report (2016) finds that 55% of consumers purchases are driven by better prices and deals that save money. Forrester (2013) reports that the price of a product is the number one factor consideration for 62% of Canadian online shoppers. Around 59% of Canadian online shoppers who have purchased from the US or international sites state that cheaper pricing inclusive of shipping, taxes and customs, drove their decision to do so. A PwC Total Retail Survey (2016) finds that even among the two highest-earning brackets, 61% of online shoppers in Canada said they would look for a deal out-of-country for better prices. A 2016 Canada Post survey found that eight out of ten Canadians made at least one online purchase with an average outlay of just over C$100. Over half of online shoppers made at least one cross-border purchase due to lower prices and/or greater selection and purchases from US online merchants were most common.27
Shipping Options: 75% of shoppers find it important to have the option of standard ground shipping while 49% find expedited shipping an important consideration. Canadian online shoppers are interested in expedited shipping options but only 30% would be prepared to pay more than $5 for this option. The PwC Holiday Outlook Survey (2017) finds that free shipping is important for 35% of consumers and easy return policy is important for 18% of consumers. 35% say prepaid postage for returns is critical to their purchase decision and others seek flexible return options like ability to drop off return items at a retail store or post office.
The surveys also find that greater product availability, convenience and time saving, drive Canadian consumers to shop online.
27 Scotiabank, NAFTA: Raising Canada’s Duty-Free Threshold on E-Commerce, Global Economics, Insights and views, August 25, 2017
Return Policies in e-tail
Amazon is the leader in e-commerce and e-tail business and drives trends of the industry. The return policy of Amazon is as follows:
“You may return any of the following items to Amazon.ca, for any reason, for a full refund (we'll also refund the return shipping cost, if the return is a result of our error or if the item qualifies for Free Returns) within 30 days of delivery of your shipment. Please note that we cannot accept the return of opened items, some health and personal care items, grocery items. If you use the mailing label (obtained from Amazon.ca online Returns Centre) and your return is not the result of our error, the shipping cost of that returned item will be deducted from your refund. The amount deducted will be the equivalent to our standard shipping costs for that item.
Shoes, clothing and accessories purchased from Amazon.ca, or a different vendor but fulfilled by Amazon, can be returned free of charge to Amazon.ca within 30 days of delivery of shipment via our online Returns Centre. We only offer one option to return eligible product(s): Canada Post drop off option: You can drop off your return at the authorized Canada Post location of your choice. There is no charge for this option.”
With Amazon setting the trend, other e-tail players follow suit. The return policies of Alibaba.com and Ebay.ca depend on the seller’s return policy.

19
E-tail by Product categories Through surveys and interviews with retailers, we identified current trends in Canadian e-tail by product category.
The PwC Total Retail Survey (2016) finds that preference for e-tail varies by product category and many consumers desire physical interaction with a product. Figure 6 shows the number of consumers that made a purchase online over the past 12 months for each product category.
Figure 6: By product categories: Purchases made online over the last 12 months
The most popular items purchased online were apparel and accessories, books, music, videos and consumer electronics. By product type, 51% of Canadian online shoppers will look for lower prices out-of country for clothing and footwear, 44% for consumer electronics and computers, 40% for books, music, movies and video games, and 31% for health and beauty products (PwC Total Retail Survey, 2016). The spending on groceries, home improvement, hobbies, games, toys has been rising (Canada Post Survey, 2016). Also, retailers across product categories report that many consumers, particularly younger consumers, do research online and then purchase from the store. Those types of purchasers are considered to be likely candidates for switching to online purchases. There is also significant anecdotal evidence of “showrooming” in which a product is examined, tested and in the case of apparel, tried on, in-store and then purchased online, a trend that could be expected to increase if online vendors were to have a signficant price advantage.
For grocery including food and beverages, the share of e-tail purchases is relatively low in Canada, as consumers like to purchase these in-store. Also, on the supply side, there are shipment problems due to the need for registration and also the return policy for these products is difficult to implement due to their perishable nature.
For clothing, e-tail sales have been growing, however, return policy is critical. The apparel products with no size, such as ties or known size are more susceptible to e-tail. Omnichanneling retailing is more useful for this category as returns can be easily made in physical stores. For apparel that need to be tried for fit, in-store experience matters and many consumers don’t feel comfortable purchasing these online unless return is easy.
For footwear, retailers report that it is a fast growing e-tail segment, as most often size is known. For jewellery, watches, luggage and briefcases, the products are often standardized and can be purchased without trial. Hence, this is a large and growing e-tail category. For home furniture, furnishing, housewares, appliances and elecronics, the concern for consumers during e-tail purchase is the return policy. The high-weight of home furniture makes
0%
10%
20%
30%
40%
50%
60%
70%
80%
90%
100%
Purchases made online over the last 12 months
Made a purchase online Don’t purchase online

20
shipping and return a concern for consumers. Sporting and leisure products are often standard and known by consumers, so e-tail is growing relatively fast.
For motor vehicle parts, the high-weight of products makes shipping relatively costly. Also, most automobile owners service their vehicles under a ‘Do-it-for-me’ scheme with automobile service agencies. Such agencies usually purchase parts in bulk so shipment value is typically high. There is another relatively small category of customers that have a ‘Do-it-yourself’ scheme to service their vehicle. These are the consumers that may purchase motor parts online to service the vehicle themselves.
For home health products, the large majority of e-tail involves over the counter drugs. Legal restrictions on e-tail involving prescription drugs as well as stricter (than the US) regulations for packaging and composition are substantially limiting e-tail in this category. For infant care, personal and beauty products, products are standard and known by consumers so e-tail growth is substantial. For hardware, tools, renovation lawn and garden products, products are generaly standard and hence susceptible to e-tail sales.

21
6. Price Competitiveness
Retailers typically set different prices for different jurisdictions. However, within a jurisdiction prices in brick-and-mortar stores and online e-tail website for a particular product in a particular country are generally similar. We confirmed this understanding through interviews with a number of national and international retailers.
As discussed previously, price is the most influential factor in the e-tail purchase decision process. As also noted previously, the overwhelming majority of e-tail imports by Canadians come from the US, although the countries of origin are for most part outside Norh America. Therefore, in this Assessment we use US e-tail prices as a proxy for cross-border shipment prices.
A number of surveys depict Amazon as dominating Canada’s online retail landscape.28 PwC’s Holiday Outlook survey (2017) shows that 77% of Canadians’ top choice online retailer is Amazon. A survey by Forrester (2013) finds that when comparing prices online, about 70% of Canadian online shoppers use Amazon (39% use amazon.ca and 29% amazon.com). Consequently, we used Amazon’s website in Canada and the US as a measure of price differentials between the two countries.29
Price Gap for Canadian Consumer: US vs. Canada Based on a survey using a representative sample of identical products for each product category, we estimated price differentials between the US and Canada for each major product category.30 The price gap has been calculated from the perspective of a Canadian consumer shopping online, i.e. what will be the price inclusive of shipment, taxes, and import costs (e.g. duties) that the Canadian customer would pay if purchasing the product from a US website compared to a Canadian website. The average price for all product categories falls under the proposed DMT threshold of US$800 (C$1,015) and most categories have an average price below the threshold of US$200 (C$254). The prices faced by a Canadian consumer for each product category is illustrated in Table 5: Table 5: Average Price Levels faced by Canadian Retail Customer for a purchase from the US and Canada
Price faced by a Canadian Consumer for a purchase from US vs. Canada
Product Category US Price (C$) Canadian Price (C$)
1. Food & Grocery Prohibitive/Non-existent shipping 61.2
2. Clothing 134.8 146.0
3. Footwear 170.6 211.7
4. Jewellery, watches, luggage, briefcases 295.2 305.8
5. Home furniture, furnishings, housewares, appliances and electronics 368.0 433.7
6. Sporting & leisure 377.3 379.3
7. Motor Parts 155.5 183.5
8. Home Health Care 282.1 372.2
9. Infant Care, Health & Beauty 234.3 294.4
10. Hardware, tools, renovation and lawn and garden 152.8 161.1
11. Miscellaneous 226.3 225.8
Weighted Average 245.4 282.4
28 Forrester North American Consumer Technographics Online Benchmark Survey (Part 1), 2014
29 Details on the survey are presented in the methodology section 30 For each of the 11 product categories, we took a random sample of 30 products. In total, we looked at 330 product pairings that compared Canadian and US prices.

22
As shown in Table 6, on a weighted average basis, across all product categories, the price charged to a Canadian consumer for a shipment from the US is 11.6% lower than the equivalent Canadian shipment price. This final price gap has been disaggregated by four factors driving the gap: (i) product price (ii) shipment cost (iii) taxes and import costs. Table 6 presents this disaggregation by product category:
Table 6: Product Price Differentials and Final Consumer Price Differences US vs. Canada
Components of Final Price Gap (Canada – US)
Product Category Final Price Gap
Product Price Gap
Shipping Cost Gap
Taxes & Import Cost Gap31
Clothing 11.3 39.0 -9.8 -17.9
Footwear 41.1 44.2 1.6 -4.6
Jewellery, watches, luggage, briefcases 10.6 52.6 -21.7 -20.3
Home furniture, furnishings, housewares, appliances and electronics
65.7 129.5 -49.2 -14.7
Sporting & leisure 2.0 60.4 -35.0 -23.4
Motor Parts 28.0 70.2 -39.2 -3.0
Home Health Care 90.1 114.3 -0.9 -23.8
Infant Care, Health & Beauty 60.2 102.9 -26.5 -16.2
Hardware, tools, renovation and lawn and garden
8.3 44.4 -32.5 -3.5
Miscellaneous -0.5 77.6 -74.7 -3.4
Weighted Average Gap (C$) 37.1 81.8 -31.7 -13.1
We note that we have confirmed the reasonability of our price difference findings through interviews with retailers within each product category.
31 Taxes and Import cost gap is based on Amazon’s estimate of taxes, custom duties and miscellaneous costs for shipments from U.S. to Canada
36%
18%
7%
11%
Product Price Gap Shipment Cost Gap Taxes & Import Cost Gap Final Price Gap
Composition of Price Gap

23
It should also be noted that, as discussed in more detail later in this report, at the present time Canada Border Services Agency does not fully collect all taxes and duty on relatively low priced cross border packages even when they are above the current DMT of C$20. This means that consumers who are aware of this issue consider the current Canada US price gap to be higher than calculated above (i.e. the price gap in their eyes includes also a probability of Canada Border Services Agency not assessing their package). In the context of our Assessment, we considered this as an insignificant issue. In our view, the low compliance level is a function of relatively low e-tail imports at the present time. It is reasonable to assume that if a significant increase in e-tail import levels occurred (not due to DMT increase), the Canada Border Services Agency would increase its compliance rates. In fact, Canada Border Services Agency is in the process of modernizing its collection system by aiming to move eventually to e-Customs (i.e. the ability to operate in a modern e-enabled environment through electronic services). e-Customs would allow cost-effective, efficient and easily accessible dealing with Customs authorities. It is also important to note that with the adoption of an e-Customs environment, costs of assessing taxes and duties will decline while revenue collection compliance will increase.
Product Price Gap As noted previously, the product price gap (on average 36%) is the most significant driver of the price gap between US and Canadian prices from the perspective of the Canadian e-tail consumer. In this sub-section we discuss the key reasons for this difference.
First, we test the hypothesis that Canadian retailers are taking advantage of the market structure in Canada to charge higher prices. As explained below, we find this hypothesis to be incorrect and as such we discuss other factors that our research suggests are the main causes for the product price gap.
Are Retailers in Canada producing ‘Super-profits’?32
Higher product prices can be a reflection of market power and possibly the existence of ‘super-profits’. To this end, we compare the gross retail margin between Canadian and US retailers and find that, on average, the margin is lower in Canada’s retail sector despite higher level of competition in the US retail market. In particular, for “Non-store retailers”, which comprise the largest proportion of e-tail, the gross margin in the US is higher by 14.2 percentage points.
Retail margins by sector for Canada and the US are summarized in Table 7 below.
32 Defined as excess over normal profits in a competitive market

24
Table 7: Gross Retail Margins: Retail Sector and sub-sectors
Gross Retail Margin (%)
Canada (average
2012-15) US (average
2012-15) Difference (Canada
- US) Retail trade 26.8 28.0 -1.2
Motor vehicle and parts dealers 16.9 19.0 -2.1
Furniture and home furnishings stores 43.9 46.7 -2.7
Electronics and appliance stores 31.2 30.5 0.8
Building material and garden equipment and supplies dealers
33.4 34.5 -1.1
Food and beverage stores 27.5 27.8 -0.3
Health and personal care stores 35.6 32.0 3.6
Gasoline stations 14.8 12.3 2.5
Clothing and clothing accessories stores 51.1 45.6 5.5
Sporting goods, hobby, book and music stores 37.8 41.5 -3.7
General merchandise stores 25.3 26.8 -1.5
Miscellaneous store retailers 44.9 47.2 -2.3
Non-store retailers 25.0 39.2 -14.2
Source: CANSIM 080-0030, Annual Retail Trade Survey, Statistics Canada; For US, Annual Retail Trade Survey, Economic Census, US
Table 7 suggests that the product price gap between Canada and the US in not driven by Canada’s less competitive retail market structure. To understand the key drivers of this price gap, we conducted further research, as well as interviews with Canadian retailers. Through our research and interviews, the following two key reasons for the price gap have been identified:
(i) Market Size
The World Economic Forum’s Global Competitiveness Report 2017-18 provides rankings on market size. It includes both domestic and foreign export market in determining the size of the market. It ranks Canada at 16th and the US at 2nd. Market size is considered important as it affects productivity and costs since large markets allow firms to exploit economies of scale. Canadian retailers are disadvantaged compared to US retailers due to their inability to benefit from large economies of scale and and economies of density (spatial proximity). The size and scale of US economy translates to lower cost structures for US retailers.
The disadvantage of Canadian retailers is best demonstrated by the lower bargaining power than they have with their vendors and suppliers. Since Canadian retailers purchase significantly smaller volumes than their US counterparts, they generally pay 10% to 50% more than US retailers for identical products.33.
The Australian Productivity Commission conducted a similar analysis and concluded that: “A minor difference in manufacturer prices charged for goods at the beginning of supply chain can have significant flow-on effects, which compounding with higher costs throughout the supply chain, leads to large differences in the end retail prices.”
(ii) Structural Barriers and cost of doing business
We find that the higher product prices in Canada are also an outcome of the higher cost of doing business compared to US. The World Bank’s Doing Business Report 2017 ranks the US at 6th and Canada at 18th for ease of doing business. In the World Economic Forum’s Global Competitiveness Report 2017-18 that looks at a comprehensive
33 The Canada-USA Price Gap, Report of the Standing Senate Committee on National Finance, Senate Canada, February 2013

25
set of factors that drives long-term growth and competitiveness, the US is ranked 2nd and Canada is ranked 14th. The higher cost of doing business is an outcome of structural factors like higher tax and tariff structures, real estate prices, minimum wage rates, operations, logistics and distribution costs. Thus, the cost of maintaining suppliers’ offices and operations in Canada results in higher prices.
The regulatory compliance requirements in Canada are generally more onerous than in the US, which leads to higher costs for Canadian business operations.34 The regulatory requirement in Canada for health and safety standards, labour standards, bilingual packaging etc. is generally larger in scope and more restrictive compared to the US.
Representatives from the Canadian apparel industry state that “small differences in apparel safety standards between Canada and the US increase the price for Canadian consumers while offering little or no additional benefit. Flammability — how quickly a garment burns — is subject to regulation. You do not want something that will burst into flame if you are near an open fire, for example. There is no disagreement that that is a bad thing, but, in reality, we have the same performance or the same specification. Yet, the testing for that is different in Canada than in the United States.”
Logistics refers to a series of services and activities, such as transportation, warehousing and brokerage that help move goods and establish supply chains across and within borders. Although it is carried out by private firms, its efficiency depends on publicly funded or regulated infrastructure, processes of border agencies and regulations pertaining to fiscal, environmental, safety, land use and competition. Logistics performance is central to competitiveness of countries and supply chain operations are particularly critical for the retail business. The World Bank’s logistics performance index score35 (2016) ranks the US at 10 with 92.8% of highest score and Canada is ranked at 14 with 90.8% of highest score. For timeliness of shipments reaching consignees within expected delivery time, US is ranked at 11 while Canada at 25. In logistics quality and competence, US is ranked 8th while Canada is ranked 15th. For ease of arranging competitively priced shipment, US is ranked 19 and Canada is ranked 29. Canada has better performance for customs and tracking and tracing while infrastructure ranking is comparable between the two countries.
(iii) Country Pricing Strategy Based on the discussions with market participants and our research, it appears that a significant contributor to price differentials between Canada and the US is the deployment of country pricing strategies, whereby some manufacturers and distributors use their market power to charge higher prices to retailers in Canada than are justified by incremental operational costs. This issue has been identified by both by the Senate of Canada and the Department of Finance36 and was presented in the American Economic Review37.
34 https://www.retailcouncil.org/advocacy/rcc-fights-for-all-retailers-to-cut-unnecessary-and-inconsistent-government-regulations 35 World Bank LPI analyzes countries in six components: (i) Efficiency of customs and border management clearance (ii) Quality of trade and transport infrastructure (iii) Ease of arranging competitively priced shipments (iv) Competence and quality of logistics services (v) Ability to track and trace consignments (vi) Frequency with which shipments reach consignees within scheduled/expected delivery times. 36 https://www.budget.gc.ca/2014/docs/plan/ch3-4-eng.html 37 Gopinath, Gita, Pierre-Oliver Gourinchas, Chang-Tai Hsieh and Nicholas Li. (2011). “International Prices, Costs, and Markup Differences,” American Economic Review, Vol. 101, No.6.

26
7. Impact Analysis of DMT Rise
At an existing price gap of 11.6% (for items priced under US$80038)and a relatively small share of e-tail, retailers operating in Canada are able to sustain their country pricing strategy, i.e. maintaining different e-tail websites for Canada and US with different prices. The Senate of Canada’s Report of the Standing Senate Committee on National Finance ‘The Canada-USA Price Gap” states:
“As more Canadian consumers become aware of smartphone applications and internet sites for price shopping and comparison, and become price-savvy consumers, competitive pressures in Canada will increase and price for products in Canada will converge to U.S. prices. (February, 2013)”
A rise in DMT will eliminate taxes and duties on cross border packages that are currently not exempt. We calculate that the elimination of taxes and duties on cross border packages will increase the weighted average price gap between Canada and the US from 11.6% to 25%. Our research suggests that this gap in prices will induce a much larger proportion of Canadian consumers to turn to e-tail from US websites. This in turn will create arbitrage opportunities for US e-tail websites to target Canadian consumers, which eventually will force US retailers that currently prohibit Canadian consumers from purchasing through their US websites (i.e. they are currently engaged in discriminatory pricing strategy) to revisit their business model and equate the prices for US and Canadian consumers. In this regard, we note that this process will be facilitated by the increasingly easy access to price comparisons between US and Canada through the internet. In fact, in recent years Canadian customer complaints about higher prices to Canadian consumers have intensified. For example, when J. Crew Group Inc. charged significantly higher prices to Canadians, customer complaints drove the price gap down to about 15% from 50%.
38 For items priced under US$200 the price gap is 11.4%.

27
In summary, a rise in the DMT level, would entice more Canadian consumers, who currently shop in brick-and-mortar stores, to switch to e-tail and would cause a shift by Canadian consumers from e-tail on Canadian websites to e-tail on US websites. The following section provides more detail on our analysis of the potential impact of a rise in DMT.
Impact on Retail Sales A rise in the DMT threshold from the present C$20 to US level of US$800 will increase significantly the price differential between US and Canadian prices. The impact of lower prices on retail sales will be a function of the product type. As discussed previously, different product categories have different susceptibility to e-tail and hence to cross-border shipments. To this end, we calculate the expected price differentials by product categories under an US$800 DMT. As shown in Table 8, the price differences will increase significantly for most product categories.

28
Table 8: By Product Categories: Retail Sales and Expected Price reduction with DMT increase to US$800
Product Categories Sales 2017 (C$ billion)
Forecasts
Existing Price Gap (%) (Canada – US)
Price Gap if taxes and duties are eliminated (%) (Canada-US)39
Food 108.5 Shipment prohibitive/non-existent
Final price difference in favor of Canada due to shipment costs
Soft drinks and alcoholic beverages
36.6 Shipment prohibitive/non-existent
Final price difference in favor of Canada due to shipment costs
Clothing 36.4 8% 26%
Footwear 8.3 19% 35%
Jewellery, watches, luggage, briefcases
5.4 3% 18%
Home furniture, furnishings, housewares, appliances and electronics
57.0 15% 28%
Sporting and leisure products
20.2 1% 15%
Motor Vehicle Parts 21.6 15% 28%
Home health products (Pharma, eyewear)
42.5 24% 35%
Infant care, Personal and beauty products
13.5 20% 32%
Hardware, tools, renovation and lawn and garden products
42.6 5% 19%
Miscellaneous products 30.6 0% 14%
Others 207.4 Not expected to be significantly affected
(i) Motor vehicles 113.1 Average price above proposed DMT threshold of US$800
(ii) Recreational vehicles
8.6 Average price above proposed DMT threshold of US$800
(iii) Automotive & household fuels
66.7 Restrictions to trade across borders
(iv) Retail trade commissions & services
18.9 Physical location specific services
Total Retail Sales 630.5 Total Sales of Products ‘At Risk’ – C$ 277.9 billion
Total retail sales for Canada across all product categories are estimated to be at C$630.5 billion in 2017. The products categorized under ‘Others’ (i.e. motor vehicles, recreational vehicles, automotive and household fuels and retail trade commissions & miscellaneous services) are not expected to be affected significantly by an increase in DMT. For cross-border purchases in Canada, shipment cost is the most significant barrier in the ‘Food and grocery’ category that includes food, soft drinks and alcoholic beverages. Although the product price for food and grocery is lower in the US, shipment facility is non-existent or prohibitively expensive for most goods under this category. Hence, we conclude that this category will not be affected by the change in the DMT threshold. Together, the sales for these categories are estimated to be C$352.5 or 56% of the total retail sales. Their limited vulnerability to a rise in DMT is reflected in their limited exposure to e-tail sales. In fact, these categories comprise only 27% of the total e-tail sales in Canada in 2016. The sales for the remaining ten product categories is estimated to be C$277.9 billion, equivalent to 44% of total sales. We refer to these categories as “At Risk”. Of the total e-tail sales in Canada at C$13 billion in 2016, the ‘At Risk’ categories comprise 73% or C$9.5 billion. The weighted average increase in the Canada US price gap from
39 Sales tax reduction has been estimated at 12.2% by using combined provincial sales tax rates weighted by retail sales in the respective provinces. We note that in our calculations, we have not considered sales tax exemptions. Custom duty rate reduction has been estimated at 5.1% using the average of trade-weighted MFN and AHS duty rate sourced from the World Integrated Trade Solution, World Bank (See details in Appendix 1).

29
elimination of taxes and duties is expected to be approximately 13.4 percentage points. On average, this would make the prices of US imports approximately 25% lower than the prices in Canada for the “At Risk” product categories. Table 9: By Product categories: Total Retail Sales at Risk
Total Sales At Risk (C$ billion)
Product Categories 2017 2018 2019 2020
Clothing 36.4 37.9 39.5 41.2
Footwear 8.3 8.6 9.0 9.4
Jewellery, watches, luggage, briefcases 5.4 5.6 5.8 6.1
Home furniture, furnishings, housewares, appliances and electronics 57.0 59.4 61.9 64.5
Sporting and leisure products 20.2 21.1 22.0 22.9
Motor Vehicle Parts 21.6 22.5 23.4 24.4
Home health products 42.5 44.3 46.1 48.1
Infant care, Personal and beauty products 13.5 14.0 14.6 15.2
Hardware, tools, renovation and lawn and garden products 42.6 44.3 46.2 48.2
Miscellaneous products 30.6 31.9 33.2 34.6
Total Sales at Risk 277.9 289.6 301.8 314.6
With the increase in DMT level, we estimate that the US Canada price gap will increase for the ten product categories “At risk”, to the following levels:

30
Table 10: By Product categories: CANADA US Price Gap
% by which US prices will be lower due to Rise in DMT
At US$ 800 At US$ 200
Product Categories Taxes & Duties Exemption
Duties Only Exemption
Taxes & Duties Exemption
Duties Only Exemption
Clothing 26% 15% 33% 24%
Footwear 35% 26% 39% 31%
Jewellery, watches, luggage 18% 8% 16% 5%
Home Furniture furnishings, housewares, appliances and electronics
28% 18% 22% 12%
Sporting & leisure 15% 4% 8% -4%
Motor Parts 28% 19% 28% 19%
Home Health Care 35% 27% 36% 28%
Infant Care, Health & Beauty 32% 23% 22% 12%
Hardware 19% 8% 19% 8%
Miscellaneous 14% 3% 20% 10%
Weighted Average Price Reduction
25% 15% 25% 15%
As noted previously, at a DMT of US $800, with exemption from taxes and duties, US imported goods prices will be approximately 25% lower than Canadian prices. With exemption of duties only, US prices will be approximately 15% lower than Canadian prices. Using the distribution of products in our sample with prices below US$200, we observe similar price differences, as observed at below US$800.
In addition to eliminating the need to collect taxes and duties, a DMT rise would further contribute to a decline in shipping costs. This may further reduce prices of US imported goods for Canadian consumers. We conducted interviews with courier company represenatives dealing with US-Canada cross-border shipments. Although they do not foresee a significant direct reduction in costs from the reduced need to collect taxes and duties, a significant import volume increase that will likely result from these price reductions will provide them economies of scale, which would ultimately reduce their shipping costs and some of these savings would likely be passed to consumers. At present, shipment costs increase the Canada US price gap by approximately 18 percentage points. Since an exact reduction in shipment costs and the resulting savings to consumers cannot be estimated due to lack of data, the estimated reductions in prices, shown above, should be seen as lower bounds (i.e. the Canada US price gap will likely be higher than 25% and 15% as shown in Table 10).
Based on our research and interviews regarding the price sensitivity of Canadian consumers, we are of the view that such price differences are sufficiently signficant to influence practically all Canadian online shoppers to purchase these products from the US. In addition, the magnitude of such price difference will also induce some Canadian brick-and-mortar consumers to switch to US e-tail websites. The price sensitivity of consumers in relation to their decision as to what retail channel they will use is discussed in the next sub-section.
Price Sensitivity of Retail Sales When assessing the potential impact of e-tail on bricks-and-mortar retail, the price sensitivities of consumers is an important aspect. The question is what changes to the price level incentivize consumers to switch from traditional retail stores to online shopping.

31
We can expect that consumers will likely differ with regard to the precise point at which they would consider changing their shopping behaviour. In addition, price sensitivities are likely to differ between product categories. For example, in general customers have a lower threshold to switch when buying books and music online compared to shopping for shoes and apparel. While it is difficult to determine a precise price difference at which customers might be inclined to switch from traditional retail to online shopping, studies on this issue provide some general guidelines. In a study on consumer behaviour, Brynjolfsson and Smith (2000) examine price differences for books and CDs between online stores and physical retailers.40 They find that, on average, online stores offered prices 16 percent below those in physical stores and 6 to 10 percent lower when taxes and shipping charges were included. Also, studying shopping behaviour of customers of books and CDs, Png et al. (2000) find that buyer search costs are lower in online shopping compared to traditional retail.41 Lower prices and search costs, coupled with more convenience, led to a surge in online book purchases. According to Bowker Market Research, a global leader in bibliographic information, in 2012 online retailers in the US started to sell more books than bricks-and-mortar retailers. However, thresholds will likely differ by product category and, as in the case of books, it can be as low as a 6 to 10 percent price difference. Comparing price differentials of goods across a broader range of commonly purchased categories (including personal care, books, electronics, entertainment, home improvement/household items and office supplies) Anthem Marketing Solutions found that in 2014, average online savings amounted to around 25 percent compared to traditional retail.42 Given that e-tail is on the rise across all product categories, it suggests that, on average, a 25 percent price difference would be sufficient to incentivize many customers to switch from in-store shopping to online shopping across all product categories. For some product categories, a smaller price difference would be sufficient to facilitate such switch. Our interviews with management of retailers in different product categories generally confirm the above findings.
Likely Loss of Canadian Retail Sales Given our analysis and research, we assume for the purpose of this Assessment that an average price differential of around 25% for ‘At Risk’ products will accelerate e-tail levels for these categories in Canada to US e-tail levels, where levels refer to the share of e-tail sales in total retail sales. As noted previously, likely reduction shipping costs will further increase the price gap.
It is important to note that if the DMT threshold is raised, the incentives for Canadian consumers to purchase products online will be higher than for consumers in the US. This is because US consumers will continue to pay taxes on purchases through US e-tail, while Canadian consumers would purchase the same products without paying taxes. This fact combined with the opportunities that will open to US e-tail websites to target Canadian consumers leads us to believe that our assumption of a similar e-tail share for Canadian and US consumers for ‘At Risk’ products is reasonable in the circumstances.
Using the above assumption, we calculate the likely loss in retail sales for two DMT levels: (i) US$800 (C$ 1015) DMT (ii) US$200 (C$ 254) DMT and three scenarios (i) At US$800 exemption of both taxes and duties (ii) At US $200 exemption of both taxes and duties (iii) At US$200 exemption of duties. In conducting our calculations, we consider the fact that the DMT is applied to the value of shipment exclusive of shipment cost, taxes and duties. Based on our research, we assume that practically all ‘At Risk’ products are below an US$800 price threshold. For the US$200 DMT, we consider the distribution of prices within each category to estimate proportion of products with value above US$200, as shown in Table 11.
40 (Brynjolfsson & Smith, 2000) 41 (Png, Lee, & Yan, 2000) 42 (Anthem Marketing Solutions, 2015)

32
Table 11: By Product Category: Average US Product prices and proportion of price above US$200
Product Category Average US Product Price (C$)
% sample prices above US$200
Clothing 81.8 3.3%
Footwear 126.5 3.3%
Jewellery, watches, luggage, briefcases 201.6 23.3%
Home Furniture, furnishings, housewares, appliances, electronics
197.1 23.3%
Sporting & leisure 259.8 40.0%
Motor Vehicle Parts 78.7 0.0%
Home Health Care 206.5 26.7%
Infant Care, Personal & Beauty Products 146.9 13.3%
Hardware, tools, renovation, lawn & garden products 74.8 3.3%
Miscellaneous 102.7 6.7%
Weighted-average Price 144.8 14.5%
Based on our assumptions regarding the response of Canadian consumers to the price differences resulting from a DMT increase, we calculate that if both taxes and duties are eliminated at the US$800 DMT threshold, the aggregate loss in retail sales will be C$32.0 billion in 2017, and is expected to increase to C$74.5 billion in 2020.
As noted previously, using our sample, we have estimated proportion of products with prices below US$200DMT within each of the product category43. On the basis of this estimation, if both taxes and duties are eliminated at the DMT level of US$200, the aggregate loss in retail sales is calculated to be C$ 29.8 billion in 2017, and is expected to rise to C$70.8 in 2020.
If only duties are eliminated at US$200, on an average, US imported product prices are calculated to be 15% lower than Canadian prices. This smaller difference will reduce the incentives of Canadian consumers to switch to e-tail at US websites. We have analyzed the resulting price differences by product category and used our professional judgement to conclude that with the exemption of duties only, the loss in retail sales will likely be between 25% and 50% of the loss anticipated when duty and taxes are eliminated under a US$200 DMT. For the purpose of this ‘Assessment’, in relation to the scenario of DMT US$200 with duties only exemption, we have selected the mid-point at 37.5%.44 It is important to note that custom duties are perceived to be a significant barrier to cross-border e-commerce of small consignments by both suppliers and consumers. Many e-traders state that custom procedures have contributed to their decisions not to enter foreign markets. Thus, elimination of duties is also removal of a perceived barrier for cross-border e-tail purchases of relatively small value items. This would further contribute to the acceleration of e-tail purchases but has not been quantified by us.45 Table 12 provides the calculated sales loss under these scenarios for retail sector:
43 Due to insufficient data on the distribution of sales across different price levels, we made a simplifying assumption that overall sales per item in each product category is equal for all items in that category. 44 We note that, on average, the share of duty rate of ‘At Risk’ products is 28.5% of the combined tax and duty rate. In addition, as indicated in this report, there are other costs and perception-related barriers arising from duties on cross-border shipments. 45 Kommerskollegium Sweden National Broad of Trade (2012), E-commerce – New Opportunities, New Barriers, A survey of e-commerce barriers in countries outside the EU
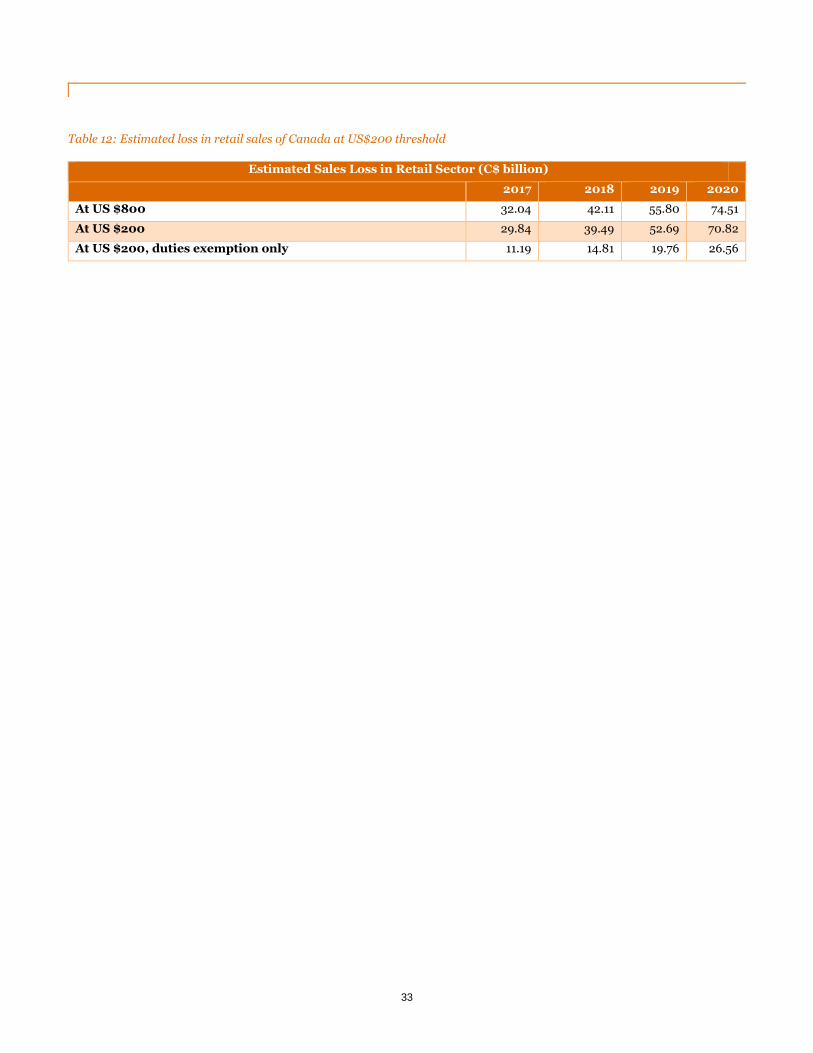
33
Table 12: Estimated loss in retail sales of Canada at US$200 threshold
Estimated Sales Loss in Retail Sector (C$ billion)
2017 2018 2019 2020
At US $800 32.04 42.11 55.80 74.51
At US $200 29.84 39.49 52.69 70.82
At US $200, duties exemption only 11.19 14.81 19.76 26.56
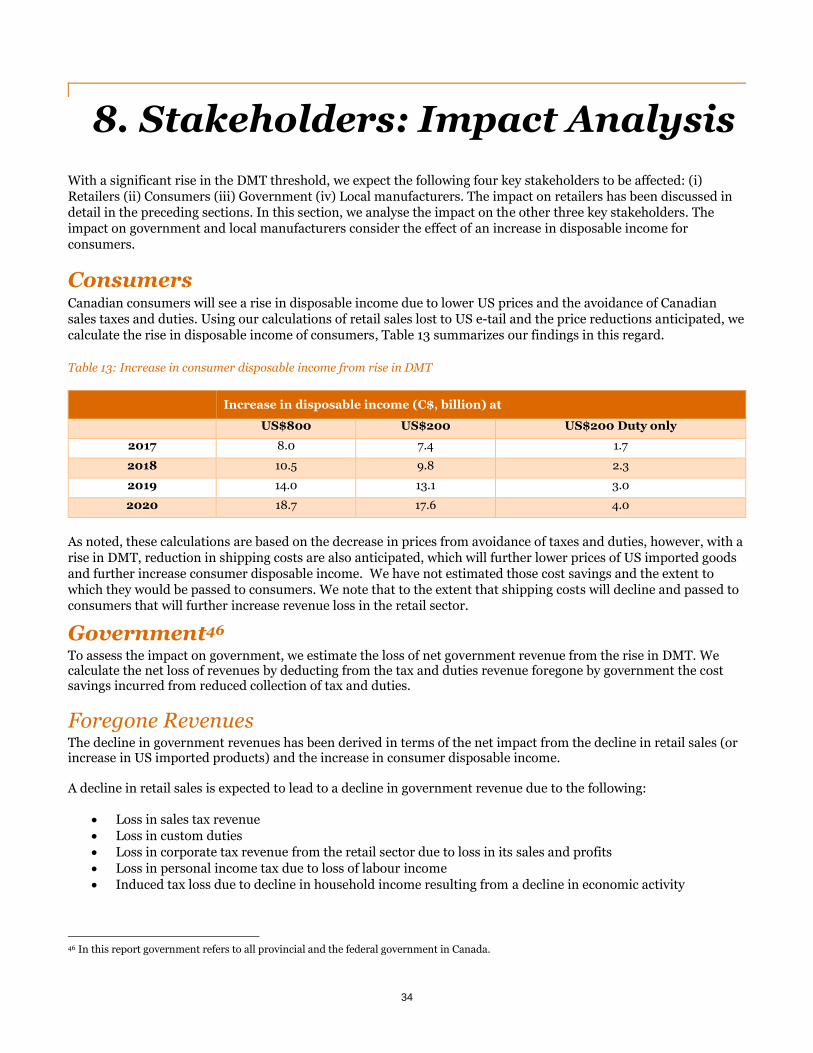
34
8. Stakeholders: Impact Analysis
With a significant rise in the DMT threshold, we expect the following four key stakeholders to be affected: (i) Retailers (ii) Consumers (iii) Government (iv) Local manufacturers. The impact on retailers has been discussed in detail in the preceding sections. In this section, we analyse the impact on the other three key stakeholders. The impact on government and local manufacturers consider the effect of an increase in disposable income for consumers.
Consumers Canadian consumers will see a rise in disposable income due to lower US prices and the avoidance of Canadian sales taxes and duties. Using our calculations of retail sales lost to US e-tail and the price reductions anticipated, we calculate the rise in disposable income of consumers, Table 13 summarizes our findings in this regard.
Table 13: Increase in consumer disposable income from rise in DMT
Table 14:
Increase in disposable income (C$, billion) at
US$800 US$200 US$200 Duty only
2017 8.0 7.4 1.7
2018 10.5 9.8 2.3
2019 14.0 13.1 3.0
2020 18.7 17.6 4.0
As noted, these calculations are based on the decrease in prices from avoidance of taxes and duties, however, with a rise in DMT, reduction in shipping costs are also anticipated, which will further lower prices of US imported goods and further increase consumer disposable income. We have not estimated those cost savings and the extent to which they would be passed to consumers. We note that to the extent that shipping costs will decline and passed to consumers that will further increase revenue loss in the retail sector.
Government46 To assess the impact on government, we estimate the loss of net government revenue from the rise in DMT. We calculate the net loss of revenues by deducting from the tax and duties revenue foregone by government the cost savings incurred from reduced collection of tax and duties.
Foregone Revenues The decline in government revenues has been derived in terms of the net impact from the decline in retail sales (or increase in US imported products) and the increase in consumer disposable income. A decline in retail sales is expected to lead to a decline in government revenue due to the following:
Loss in sales tax revenue
Loss in custom duties
Loss in corporate tax revenue from the retail sector due to loss in its sales and profits
Loss in personal income tax due to loss of labour income
Induced tax loss due to decline in household income resulting from a decline in economic activity
46 In this report government refers to all provincial and the federal government in Canada.

35
Due to an increase in consumer disposable income, there will be an increase in economic activity and government tax collection. This induced effect has been considered in our calculations of the net impact on government revenues. Our calculations of revenue foregone is presented in Table 14. See Appendix 1 for details on methodology used. Table 14: Estimates of Government Revenue Foregone from a rise in DMT
Foregone Revenue (C$, billion): At US$800 DMT
2017 2018 2019 2020
Sales Tax - 3.91 - 5.14 - 6.81 - 9.09
Custom Duties - 0.87 - 1.16 - 1.54 - 2.06
Corporate Tax - 0.31 - 0.41 - 0.55 - 0.73
Personal Income Tax - 0.55 - 0.72 - 0.95 - 1.27
Tax Revenue due to Induced Impact - 0.93 - 1.23 - 1.62 - 2.17
Net Revenue Foregone from Loss in Retail Sales - 6.58 - 8.65 - 11.47 - 15.33
Increase in Tax Revenue from increased consumer disposable income 1.92 2.53 3.35 4.47
Net Government Revenue Foregone* - 4.66 - 6.13 - 8.13 - 10.86
Foregone Revenue (C$, billion): At US$200 DMT
2017 2018 2019 2020
Sales Tax - 3.64 - 4.82 - 6.43 - 8.64
Custom Duties - 0.76 - 1.00 - 1.33 - 1.78
Corporate Tax - 0.29 - 0.39 - 0.52 - 0.69
Personal Income Tax - 0.51 - 0.68 - 0.90 - 1.21
Tax Revenue due to Induced Impact - 0.87 - 1.15 - 1.53 - 2.06
Net Revenue Foregone from Loss in Retail Sales - 6.07 - 8.03 - 10.71 - 14.39
Increase in Tax Revenue from increased consumer disposable income 1.77 2.35 3.13 4.21
Net Government Revenue Foregone* - 4.30 - 5.68 - 7.58 - 10.17
Foregone Revenue (C$, billion): At US$200 DMT Duties Only47
2017 2018 2019 2020
Sales Tax 0.00 0.00 0.00 0.00
Custom Duties - 0.28 - 0.38 - 0.50 - 0.67
Corporate Tax - 0.11 - 0.15 - 0.19 - 0.26
Personal Income Tax - 0.19 - 0.25 - 0.34 - 0.45
Tax Revenue due to Induced Impact - 0.33 - 0.43 - 0.57 - 0.77
Net Revenue Foregone from Loss in Retail Sales - 0.91 - 1.20 - 1.60 - 2.15
Increase in Tax Revenue from increased consumer disposable income 0.41 0.54 0.72 0.97
Net Government Revenue Foregone* - 0.50 - 0.67 - 0.89 - 1.19
47 We note that our calculation of no loss of sales tax is somewhat optimistic, as it does not consider the increase in cross border volume and the less than 100% compliance in
collecting taxes at the border on low priced items, In addition, as sales tax is charged on top of duty, that would mean that currently imported items through e-tail will see a
small reduction in the sales tax amount levied on them. In the context of our Assessment we do not see this as a significant issue.

36
Cost Savings With the rise in DMT, the Canadian authorities will not have to collect taxes and duties on imported items with value below the threshold. In order to estimate the cost savings to the government, it is crucial to understand the process of custom duties management.
There are three entities responsible to manage custom duties in Canada:48
(i) Department of Finance Canada – It is responsible for policy aspects, orders and regulations of custom tariffs. It develops and implements policies on trade and tariffs. It provides analysis, research and advice on the government’s international trade and finance policy agenda.
(ii) Global Affairs Canada – It controls imports of goods for which Canada requires an import permit. (iii) Canada Border Services Agency (CBSA) – It has the mandate to ensure security of the border while
facilitating the flow of goods and people. It administers over 90 acts, regulations, and international agreements of Canada. It assesses duties and taxes owed to the Government of Canada.
A review of the roles and responsibilities of these three government entities suggests that with the elimination of taxes and duties up to US$200 or US$800, the primary activity that would lead to cost saving is assessment and collection of duties and taxes by the CBSA. The CBSA is responsible for the following activities:
1. Administering legislation that governs the admissibility of people and goods into and out of Canada 2. Identifying, detaining and removing people who are inadmissible to Canada 3. Interdicting illegal goods at Canada's border 4. Protecting food safety, plant & animal health, Canada's resource base 5. Administering trade legislation and agreements including enforcement of trade remedies that protect
Canadian industry 6. Administering a fair and impartial redress mechanism 7. Collecting duties and taxes on imported goods
The government expenditure plan 2017-18 provides expenditure of each government entity. For the CBSA, the expenditure is summarized in Table 15. Table 15: Canada Border Service Agency: Expenditure by Program or Purpose
Expenditure Line Item (C$ million) 2015-16
Expenditures 2016-17
Main Estimates 2017-18
Main Estimates
Aggregate Expenditure 1,796.3 1,673.0 1,762.0
Admissibility Determination 899.8 901.1 923.9
Immigration Enforcement 162.0 128.7 192.8
Risk Assessment Program 196.2 162.5 173.6
Revenue and Trade Management 84.4 80.3 50.1
Secure and Trusted Partnerships 32.2 35.2 37.9
Criminal Investigations 31.2 33.3 29.6
Recourse 11.3 11.5 10.4
Internal Services (for the organization) 379.2 320.4 343.4
We confirmed through discussion with CBSA’s representatives that the expenditure for collection of taxes and duties is reflected in the expenditure line item ‘Revenue and Trade Management’. This expenditure includes collection of taxes and duties on high value shipments as well as some aspects of trade management. Only a proportion of it reflects the actual expenditure for collection of taxes and duties on items valued less than US$800
48 2017 Sprint Reports of the Auditor General of Canada, Report 2 – Custom Duties, Reports to Parliament, Reports and Petitions

37
or US$200. Even if the DMT rises, the value of every shipment will have to be assessed to segregate them between high-value shipments and low-value shipments. Thus, the effective cost savings will be insignificant in the context of our assessment. It is important to note that the cost of ‘Revenue and Trade Management’ declined from C$80.3 million in 2016-17 to C$50.1 million in 2017-18. This is a result of the modernization and automation project being carried out by the Government of Canada. In Vancouver, this automation system has been put in place and will be extended to other major cities of Canada. For postal shipments, CBSA does the assessment for taxes and duties. It presently has a manual labor-intensive process, which results in low compliance in revenue collection. For courier shipments, courier companies do the assessment for taxes and duties and pay CBSA on a monthly-consolidated basis. They assess using an e-processing facility with smart technology, which results in a compliance and revenue collection rate close to 100%. With CBSA’s automation project, the cost of assessing a postal shipment for tax and duties is expected to decline and the compliance rate for revenue collection is expected to increase closer to the level of compliance experienced for courier shipments. Based on the foregoing, it appears that in comparison to estimates for government revenue foregone, the savings in costs are negligible. With an increase in compliance rate from automation process and growth of e-commerce shipments, government revenues would increase (assuming no increase in DMT). Details on the CBSA system of processing shipments and collecting taxes and duties are summarized in Appendix 2.
Canadian manufacturers The retail sector is the final point in the value chain of sales of goods and services to customers. To the extent that Canadian retailers source some of their goods from Canadian manufacturers, a decline in activity of domestic retail sector will lead to a decline in sales by Canadian manufacturers.
Using an input-output model, we identify the following manufacturers as most likely to be significantly affected:
1. Printing and related support activities 2. Fabricated metal product manufacturing 3. Plastic product manufacturing 4. Furniture and related product manufacturing 5. Miscellaneous manufacturing 6. Machinery manufacturing 7. Clothing and leather and allied product manufacturing 8. Converted paper product manufacturing, pulp paper and paperboard mills 9. Miscellaneous chemical product manufacturing 10. Electronic product manufacturing
Table 16 illustrates the likely manufacturing job losses from a rise in DMT.

38
Table 16: Loss in Manufacturing jobs from decline in retail activity49
Manufacturing job losses
Year $US800 $US200 $US200 Duties Only
2017 1,361 990 427
2018 1,769 1,332 575
2019 2,318 1,798 776
2020 3,064 2,446 1,056
49 This calculation has not considered the possible gain in employment due to increase in consumer disposable income.

39
9. Economic Impact Analysis
The fundamental philosophy behind economic impact analysis is that spending on goods and services has attendant impacts throughout the economy. For instance, automobile repair will generate demand for the inputs to this process (such as tools and labour) that in turn generates additional demand that extends beyond the initial spending. Our analysis permits the estimation of this cascading effect by using the input-output multipliers of the Canadian economy based on inter-industry relationships calculated by Statistics Canada.
The input-output model used for the purpose of this report estimates the relationship between a particular economic activity for a given good or service and the resulting impacts throughout the economy (including demand for other goods and services and tax revenues). For the purpose of this report, economic impacts were estimated for the following measures of economic activity:
Output – the total gross value of goods and services produced, measured by the price paid to the producer.50 Output double counts the value of intermediate inputs and so GDP is usually a preferable measure of economic activity. 51
Value added or GDP – the value added to the economy, or the output valued at basic prices less intermediate consumption52 valued at purchasers’ prices. GDP includes only final goods to avoid double counting of products sold during a certain accounting period.
Employment – the number of jobs created or supported.
Labour income – the amount earned by the employment expected to be generated by existing operations.
Taxes on Products and Production – taxes payable on goods and services when they are produced, delivered, sold, transferred or otherwise disposed of by their producers plus taxes and duties on imports that become payable when goods enter the economic territory by crossing the frontier or when services are delivered to resident units by non-resident units.
Economic impacts are typically estimated at the direct, indirect and induced levels:
Direct impacts measure the initial requirements for an extra dollar's worth of output of a given industry.
The direct effect on the output of an industry is a one dollar change in output to meet the change of one
dollar in final demand. Associated with this change, there will also be direct effects on GDP, jobs, labour
income and taxes.
Indirect impacts measure the changes due to inter-industry purchases as they respond to the new
demands of the directly affected industries. This includes all the chain reaction of output up the production
stream since each of the products purchased will require, in turn, the production of various inputs.
Induced impacts measure the changes in the production of goods and services in response to consumer
expenditures induced by households' incomes (i.e., wages) generated by the production of the direct and
indirect requirements.
The total economic impact equals the sum of the direct, indirect, and induced economic impacts.
50 Note that for imported goods and services, only the margins realised above and beyond the initial payment to the foreign supplier have an effect on the Canadian economy. 51 For example, when a consumer purchases a car, the value of the car is added to GDP, but the measure “Output” would include the value of the car, as well as the value of items that were purchased by the car manufacturer from other suppliers such as tires, steering wheel, and engine (i.e. intermediate inputs), thus double-counting these values. 52 Defined as the value of goods and services used or transformed as inputs by a process of production.

40
To conduct the economic impact assessment, we have relied on Statistic’s Canada Input-Output National Multipliers (2013) along with sales data for each of the Retail Trade sector subsectors.
When performing an economic impact analysis of a retail operation, it is necessary to recognize the fact that only the gross margin (i.e. sales minus cost of sales) is reflected as revenues produced by that retail operation in the input-output model. Otherwise, we would be attributing revenues generated by the suppliers of that retail operation to the retail operation. Consequently, we have accounted for this by multiplying each of retail trade subsectors by its 2011 gross margin (expressed as a percentage of the total operating revenues) to calculate each subsectors’ gross margin. The gross margins were then used as an input into the input-output model.
Aggregate Economic Impact An increase in the DMT threshold to either US$200 or US$800 will result in a loss of sales in the retail sector, which will affect the Canadian economy in terms of decline in GDP, labour income and employment. It will also lead to a rise in consumer disposable income that will increase GDP, labour income and employment. We present the individual impacts of these two effects to arrive at the aggregate economic impact.
The economic footprint has been estimated for four scenarios: (i) Baseline i.e. with no change in DMT threshold (ii) US$800 DMT with elimination of both sales tax and custom duties (iii) US$ 200 DMT with elimination of both sales tax and custom duties (iv) US$200 DMT with elimination of custom duties.
Economic Impact of Retail Sales Loss The losses in sales of the retail sector will result in a loss of economic activity. Table 17 below summarizes the gross (before considering an increase in consumer disposable income) effects in terms of GDP, labour income and employment.
Table 17: Economic impact from loss in retail sales
Economic Loss at:
US$800 US$200 US$200 Duties Only
GDP (C$, billion) 2017 - 10.5 - 9.7 - 3.7
2018 - 13.8 - 12.9 - 4.9
2019 - 18.2 - 17.2 - 6.5
2020 - 24.3 - 23.1 - 8.7
Labour Income (C$, billion) 2017 - 6.6 - 6.1 - 2.3
2018 - 8.6 - 8.1 - 3.1
2019 - 11.4 - 10.8 - 4.1
2020 - 15.3 - 14.5 - 5.5
Employment (persons) 2017 - 179,067 - 166,737 - 62,912
2018 - 235,351 - 220,715 - 83,282
2019 - 311,802 - 294,457 - 111,007
2020 - 416,394 - 395,765 - 149,086

41
Economic Impact of Higher Consumer Income As discussed previously an increase in DMT will increase consumer disposable income. The increase in consumer disposable income has been estimated using input-output analysis.
Table 18: Economic Impact from increase in consumer disposable income
Economic Gain from rise in consumer disposable income:
$US800 $US200 $US200 Duties Only
GDP (C$, billion) 2017 $ 5.3 $ 4.9 $ 1.1
2018 $ 7.0 $ 6.5 $ 1.5
2019 $ 9.3 $ 8.7 $ 2.0
2020 $ 12.4 $ 11.7 $ 2.7
Labour Income (C$, billion) 2017 $ 2.7 $ 2.5 $ 0.6
2018 $ 3.5 $ 3.2 $ 0.7
2019 $ 4.6 $ 4.3 $ 1.0
2020 $ 6.2 $ 5.8 $ 1.3
Employment (persons) 2017 50,791 46,907 10,766
2018 66,755 62,092 14,252
2019 88,440 82,838 19,014
2020 118,107 111,338 25,555

42
Net Economic Impact The net aggregate economic impact from a loss in the retail sector and rise in consumer income is presented for the three scenarios in Figure 6 for GDP, Figure 7 for employment and Figure 8 for labour income. The “baseline” refers to a “business as usual” scenario where the DMT remains at its current level of C$20.
Figure 7: Total GDP footprint ($million)
Figure 8: Total Employment footprint
$190,000
$195,000
$200,000
$205,000
$210,000
$215,000
$220,000
$225,000
$230,000
$235,000
2017 2018 2019 2020
Total GDP footprint ($million)
Baseline $US800 $US200 $US200 Duties Only
3,200,000
3,300,000
3,400,000
3,500,000
3,600,000
3,700,000
3,800,000
3,900,000
4,000,000
2017 2018 2019 2020
Total Employment Impact
Baseline $US800 $US200 $US200 Duties Only

43
Figure 9: Total Labour Income footprint
The net impact on the Canadian economy from a rise in the DMT threshold to US$800 or US$200 has been estimated from the expected loss in GDP, labour income and jobs over the years 2017-20 (see Table 19)
$120,000
$125,000
$130,000
$135,000
$140,000
$145,000
$150,000
2017 2018 2019 2020
Total Labour Income footprint ($million)
Baseline $US800 $US200 $US200 Duties Only

44
Table 19: Net Economic Impact, 2017-20, from a rise in DMT threshold to US$800 and US$200
Net Economic Impact at:
US$800 US$200 US$200 Duties Only
GDP (C$, billion) 2017 $ - 5.2 $ - 4.9 $ - 2.5
2018 $ - 6.8 $ - 6.4 $ - 3.4
2019 $ - 9.0 $ - 8.6 $ - 4.5
2020 $ - 12.0 $ - 11.5 $ - 6.0
Labour Income (C$, billion) 2017 $ - 4.0 $ - 3.7 $ - 1.7
2018 $ - 5.2 $ - 4.9 $ - 2.3
2019 $ - 6.9 $ - 6.5 $ - 3.1
2020 $ - 9.2 $ - 8.8 $ - 4.1
Employment 2017 - 129,492 - 120,858 - 52,145
2018 - 170,027 - 159,992 - 69,030
2019 - 225,071 - 213,182 - 91,994
2020 - 300,244 - 286,224 - 123,531
The impact on jobs and labour income, as shown in Table 19, assumes implicitly no structural change in the retail industry. Given the trends described in this report, structural changes in retail sector are already taking place, especially as a result of the growth in e-tail. The next sub-section describes the possible impacts of those trends on our employment and labour income loss estimates, shown in Table 19.

45
Employment Canada’s retail sector is the largest employer after the country’s health care sector and hence it is the largest private employment sector. As figure 10 shows, in 2016, the retail sector accounted for 11.4% of total employment in Canada. In absolute numbers, this amounted to roughly 2.3 million employees and self-employed.
Figure 10: Canadian Employment by Industry, 201653
When considering employment growth in Canada’s retail sector, it is important to distinguish between e-tail and traditional retail. Table 20 shows the elasticities of employment to sales in Canada’s retail sector. It measures the change in employment due to an additional dollar in sales. As the numbers in Table 20 illustrate, Canada’s e-tail sector is likely to add more employment for any additional dollar in sales compared to the traditional retail sector. This is likely due to size effects. More specifically, the bricks-and-mortar retail sector is a mature industry that experiences relatively low growth rate, while e-tail is at an early stage and requires relatively large investments in infrastructure and qualified labour.
Table 20: Elasticities of Employment to Sales in Canada’s Retail Sector
Elasticity of employment to sales
Total Retail Sector 0.21
E-Tail Sector 1.83
General Retail Sector 0.19
Overall, employment growth in Canada’s retail sector was positive between 2010 and 2016 and above the average of all industries. However, as Figure 11 indicates, the increase in employment in the sector was mainly due to an expansion of employment in warehousing and storage as well as in the non-store retail segment. In contrast, employment in traditional retail actually declined slightly by 0.2% since 2010. This suggests that e-tail was the
53 Source: Statistics Canada, CANSIM Table 282-0008
0.8%1.6% 1.8%
3.8%4.2% 4.3% 4.3%
5.0% 5.1%
6.2%6.7% 7.0%
7.7% 7.7%
9.4%
11.4%
12.9%
0%
2%
4%
6%
8%
10%
12%
14%

46
main driver behind employment growth in the retail sector in recent years. Thus, the rise in DMT may lead, at least in the short term to a larger loss of employment than estimated by us (in Table 19).
Figure 11: Employment Growth in Canada’s Retail Sector, 2010-2016*
*Compound annual growth rate
Employment Characteristics
Around 54% of all employees in Canada’s retail sector are female and around 50% of all employees are full-time employees.54
Figure 12 shows employment in Canada’s retail sector by age cohort in 2016. As the figure illustrates, the majority of people employed in the retail sector are below 55 years of age. Around 52% of all employees are between the age of 25 and 54 and around 29% of all employees are in the age cohort of 15 to 24. Only 19% of total employees are 55 years of age or older. In comparison to the overall Canadian economy, employees in the retail sector are relatively young. At the national level, around 21% of total employees are 55 years of age or older, 66% are between the age of 25 and 54, and 20% are between the age of 15 to 24,
54 (Statistics Canada CANSIM Table 282-0007); (Statistics Canada CANSIM Table 282-0008)
3.6%
1.4%
0.7%
-0.2%-0.5%
0.0%
0.5%
1.0%
1.5%
2.0%
2.5%
3.0%
3.5%
4.0%
Warehousing and Storage Non-Store Retailers All Industries Retail (without Non-StoreRetail)
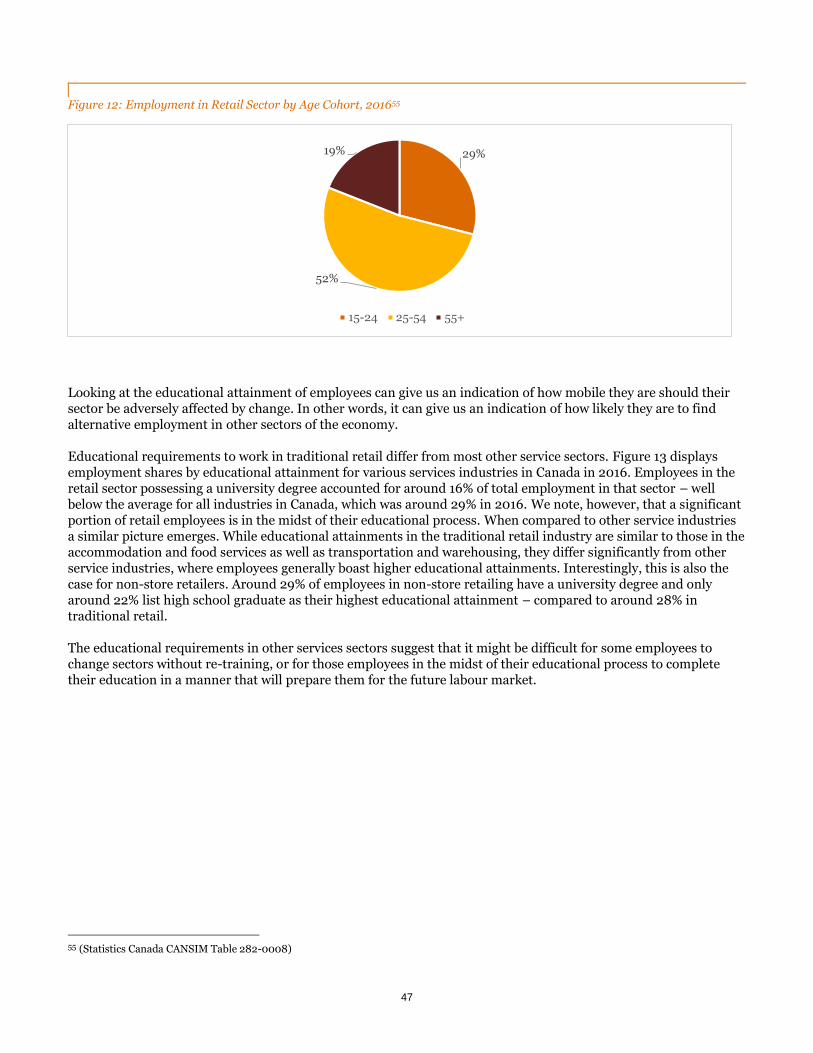
47
Figure 12: Employment in Retail Sector by Age Cohort, 201655
Looking at the educational attainment of employees can give us an indication of how mobile they are should their sector be adversely affected by change. In other words, it can give us an indication of how likely they are to find alternative employment in other sectors of the economy.
Educational requirements to work in traditional retail differ from most other service sectors. Figure 13 displays employment shares by educational attainment for various services industries in Canada in 2016. Employees in the retail sector possessing a university degree accounted for around 16% of total employment in that sector – well below the average for all industries in Canada, which was around 29% in 2016. We note, however, that a significant portion of retail employees is in the midst of their educational process. When compared to other service industries a similar picture emerges. While educational attainments in the traditional retail industry are similar to those in the accommodation and food services as well as transportation and warehousing, they differ significantly from other service industries, where employees generally boast higher educational attainments. Interestingly, this is also the case for non-store retailers. Around 29% of employees in non-store retailing have a university degree and only around 22% list high school graduate as their highest educational attainment – compared to around 28% in traditional retail.
The educational requirements in other services sectors suggest that it might be difficult for some employees to change sectors without re-training, or for those employees in the midst of their educational process to complete their education in a manner that will prepare them for the future labour market.
55 (Statistics Canada CANSIM Table 282-0008)
29%
52%
19%
15-24 25-54 55+

48
Figure 13: Employment Shares by Educational Attainment by Service Sector, 201656
The difference in educational requirements for employment in the services sector is also reflected in the respective hourly wage rates. As Figure 14 shows, average hourly wages in Canada’s retail sector were well below the average of the total service producing industries and, interestingly, even lower when compared to wholesale trade.
Figure 14: Average Hourly Wage Rates in Selected Services Sectors, 201657
56 (Forum of Labour Market Ministers, 2017) 57 (Statistics Canada CANSIM Table 281-0030)
0%
10%
20%
30%
40%
50%
60%
70%
80%
90%
100%University degree
Some post-secondary
Some high school
Post-sec/diploma
High school graduate
0 - 8 years
23.5
22.2
16.9
0 5 10 15 20 25
Wholesale trade
Service producing industries
Retail trade
Hourly Wage in $
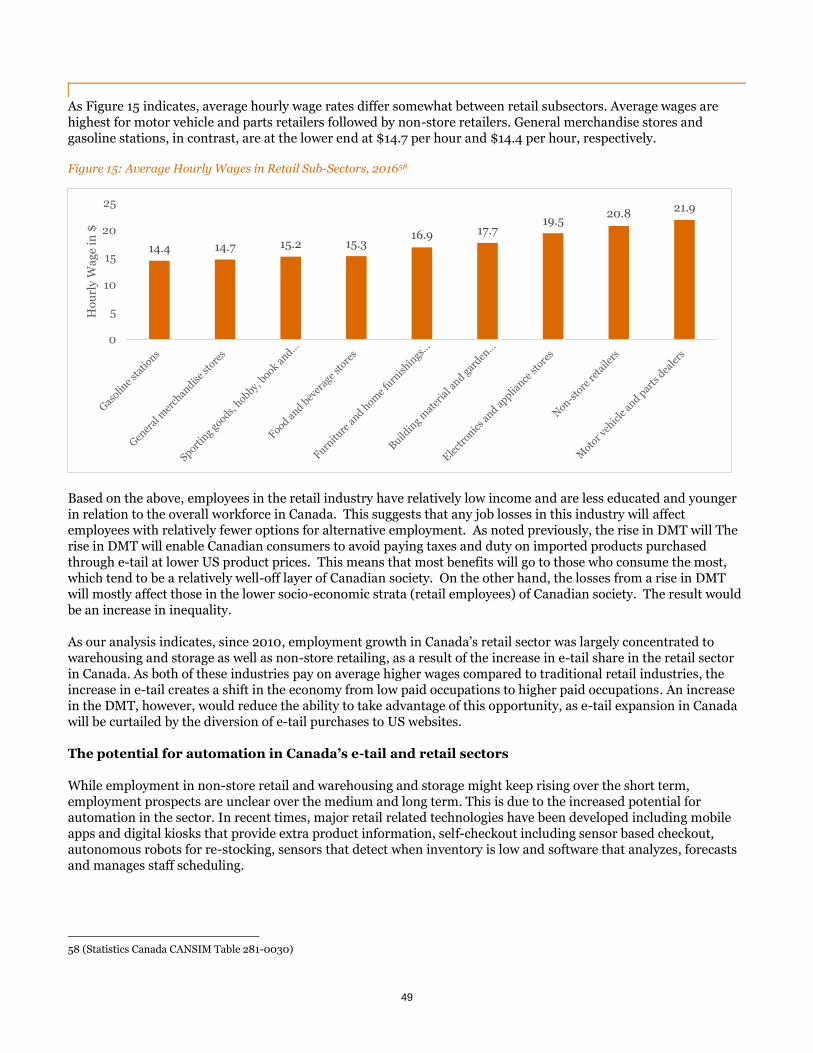
49
As Figure 15 indicates, average hourly wage rates differ somewhat between retail subsectors. Average wages are highest for motor vehicle and parts retailers followed by non-store retailers. General merchandise stores and gasoline stations, in contrast, are at the lower end at $14.7 per hour and $14.4 per hour, respectively.
Figure 15: Average Hourly Wages in Retail Sub-Sectors, 201658
Based on the above, employees in the retail industry have relatively low income and are less educated and younger in relation to the overall workforce in Canada. This suggests that any job losses in this industry will affect employees with relatively fewer options for alternative employment. As noted previously, the rise in DMT will The rise in DMT will enable Canadian consumers to avoid paying taxes and duty on imported products purchased through e-tail at lower US product prices. This means that most benefits will go to those who consume the most, which tend to be a relatively well-off layer of Canadian society. On the other hand, the losses from a rise in DMT will mostly affect those in the lower socio-economic strata (retail employees) of Canadian society. The result would be an increase in inequality.
As our analysis indicates, since 2010, employment growth in Canada’s retail sector was largely concentrated to warehousing and storage as well as non-store retailing, as a result of the increase in e-tail share in the retail sector in Canada. As both of these industries pay on average higher wages compared to traditional retail industries, the increase in e-tail creates a shift in the economy from low paid occupations to higher paid occupations. An increase in the DMT, however, would reduce the ability to take advantage of this opportunity, as e-tail expansion in Canada will be curtailed by the diversion of e-tail purchases to US websites.
The potential for automation in Canada’s e-tail and retail sectors
While employment in non-store retail and warehousing and storage might keep rising over the short term, employment prospects are unclear over the medium and long term. This is due to the increased potential for automation in the sector. In recent times, major retail related technologies have been developed including mobile apps and digital kiosks that provide extra product information, self-checkout including sensor based checkout, autonomous robots for re-stocking, sensors that detect when inventory is low and software that analyzes, forecasts and manages staff scheduling.
58 (Statistics Canada CANSIM Table 281-0030)
14.4 14.7 15.2 15.316.9 17.7
19.520.8
21.9
0
5
10
15
20
25
Ho
url
y W
ag
e in
$

50
In previous years, Canadian retailers have been delaying major investment in automation and robotics due to lack of access to technology, lack of investment as well as a lack of competition.59 This, however, appears to be changing – not least due to increased competition from Amazon and Walmart. Sobey’s for example, now operates four fully automated distribution centres in Canada – next to its 21 traditional warehouses across the country. The Hudson Bay Company also recently announced a $60 million investment in robotic upgrades to its distribution center in Toronto.60 If Canadian retail sales are increasingly lost to US due to price differences, this will affect the incentives of Canadian retailers to invest in automation.
59 (Nguyen, 2017) 60 Ibid.

51
Feedback and Spillover Effects A range of possible feedback effects, spillover effects and mitigation strategies can alter the economic impact, as estimated in this Assessment, in either direction.
1. To take advantage of price competitiveness, some retailers and manufacturers may consider moving operations to the US. When considering the option of moving e-tail operations to the US, retailers would weigh shipping costs vis-à-vis tax and duty advantage. If tax and duty was to be eliminated, the increasing affordability of shipping costs would make e-tail operations from the US a more lucrative business strategy. This may lead to further decline in economic activity within Canada.
2. The easy accessibility to US e-tail and favourable prices is likely to reduce investment in in-store retail and e-tail in Canada. This will lead to further losses in economic activity.
3. To capture e-tail sales to Canada, American retailers may invest in establishing some brick-and-mortar stores in Canada for omni-channel retailing strategy. This will act to reduce the negative economic impacts of a rise in DMT.
4. As indicated previously, the cost advantages of US retailers over Canadian retailers stem from structural differences and thus attempting to close this competitive gap would require major structural changes and substantial support from governments. Nevertheless, it is is possible that within some retail segments some Canadian retailers may be able to take steps to compete effectively with US retailers. This analysis was not part of the scope of this report.
5. Shipping costs are expected to decline with the rise in DMT as import shipments increase and create economies of scale. Through interviews, we learned that courier companies do not see significant direct cost reductions from not having to collect taxes and duties but they see indirect cost reductions from economies of scale. This decline in shipping costs will further reduce prices of US imported products for Canadian consumers, thus increasing the loss of Canadian retail activity and further increase consumer disposable income and economic activity.

52
Appendix 1: Estimation Methodology
Retail and E-tail Sales The projections for total retail sales is an extrapolation of past retail sales using the average growth during 2012-16. The average share of each NAICS sub-sector in total retail sales over the period 2012-16 was used to predict their shares in projected retail sales. Similarly, the average share of each NAPCS product category in total retail sales over the period 2012-16 was used to predict their shares in projected retail sales.
Marketline forecasts the Canadian online retail sector to grow at an anticipated average CAGR of 14.0% for the five-year period 2015-2020. Forrester predicts an average CAGR of 12.3% for online sales in Canada over 2014-19. These forecasts take into account a number of factors that affect online retail growth, including: (i) Increase in online spending driven by growth of Canadian household disposable income and internet users who buy online (ii) Reduction in shipping costs being driven in part by massive capital investment by the Canada Post in parcel sorting facilities, logistics facilities, outsourcing services (iii) Growth in the range of product categories online (iv) Proliferation of US and other international retailers opening online stores localized for Canadian buyers (v) Omnichannel and digital retailing. Using the average of these two forecasts on an annual basis, the aggregate growth of the Canadian e-tail sector was predicted.
For each NAPCS product categories in the US, we used e-tail growth forecasts per ‘2017 U.S. Cross-Platform Future in Focus, comScore’ (this was sourced from Statista). For Canada, no growth forecasts area available at a product category level. Therefore, we used the overall growth forecast (as discussed in the previous paragraph) and pro-rated it based on the US product forecasts and the shares of these NAPCS product categories in total e-tail in Canada. E-tail share sales were obtained from Forrester’s study ‘Canadian Online Retail Forecasts 2014-19’.
For each NAICS retail sub-sector, its total sales have been disaggregated into relative shares of NAPCS product categories sales. Using these relative shares as weights to the e-tail growth for NAPCS product categories, e-tail growth for each NAICS category was estimated. These growth rates were used to predict the future trajectory of e-tail sales for NAICS sub-sectors.
Price Levels In order to conduct a survey for price differentials between the US and Canada, the price comparison was made between Amazon.com (US Site) and Amazon.ca (Canadian Site) for 11 product categories. A random sample of 30 items was selected for each category. In total, we looked at 330 product pairings.
For both Amazon.com (US Website) and Amazon.ca (Canadian Website), the same shipping address was used in order to compare costs equally. The items were selected to be shipped to downtown Toronto.
Each item selected, was taken through the entire purchase process, to the purchase order screen to get the final price charged. A screenshot was taken for each product for price evidence. US prices were converted to Canadian dollars.
Samples were taken from each of the following eleven product categories:
1) Food and Grocery: Dry packaged food, fresh vegetables and frozen meat; non- alcoholic and alcoholic
beverages
2) Clothing: Men’s, Women’s, Children’s
3) Footwear: Men’s, Women’s, Children’s
4) Jewelry, Watches, Luggage, Briefcases

53
5) Home Furniture: Indoor home furniture, outdoor home furniture, houseware items, home appliances,
home electronics
6) Sporting & Leisure: Sporting equipment, toys & games, audio/video recording equipment
7) Motor Vehicle Parts & Accessories
8) Home Health Products: Pharmacy items, eyewear
9) Infant care, Personal care, Beauty products
10) Hardware, Tools, Renovation, Lawn & Garden
11) Miscellaneous: Pet food & supplies, home office equipment & supplies, farm equipment & tools, tobacco
products.
The survey collected data on prices for US and Canadian products for four components (i) Product price (ii) Shipping cost (iii) Taxes and Import costs. The contribution of each of these elements to the final price for Canadian consumer was determined on an average basis for each product category.
The reasonability of these price gaps were confirmed with senior executives specializing in retailing of these product categories.
Price Differences Due to Rise in DMT For each product category, we obtained final price levels from the survey discussed above. Based on this, we estimated the price difference between Canada and US products at the present time. In order to model the price differences that would result from elimination of sales tax and/or duties, we estimated the percentage decline in prices from two components:
(i) Sales Tax
As sales tax is charged at the same rate regardless of the product, we calculated weighted average sales tax rate for Canada at 12.2% by weighing the sales tax rate of each province by their respective retail sales share in Canada.
(ii) Custom Duties
As custom duties vary widely across products and by country of import and country of origin. We used a three-step methodology to arrive at the rates for our Assessment.
Step 1: Estimation of trade-weighted custom duty rate for consumer goods in Canada
From World Integrated Trade Solution database of World Bank, we obtained a database of Canada Consumer Goods Imports by Country and respective custom duties for 2016.61
We calculated the duty rate from average of trade-weighted custom duty for “Most Favoured Nations (MFN) and “Effectively Applied Average Harmonized Rate (AHS)”. The following explains these two concepts:
MFN Rate: MFN tariffs are what countries promise to impose on imports from other members of the WTO, unless the country is part of a preferential trade agreement (such as a free trade area or customs union). This means that, in practice, MFN rates are the highest (most restrictive) that WTO members charge one another. Some countries impose higher tariffs on countries that are not part of the WTO. AHS Rate: WITS uses the concept of effectively applied tariff (AHS rate), which is defined as the lowest available tariff. The importing country will apply the MFN tariff if the product fails to meet the country's rules that determine the product's country of origin.
61https://wits.worldbank.org/CountryProfile/en/Country/CAN/Year/2016/TradeFlow/Import/Partner/all/Produc/UNCTAD-SoP3

54
Formula for Trade Weighted Duty rate = (Sum of duties collected/Total imports)*100
Using this formula, we calculated this rate for both MFN (6.6%) and AHS (3.7%) and took the mid-point to arrive at our estimate of weighted average custom duty rate at 5.1% for all consumer products. This rate takes into consideration duty free items from certain countries. Step 2: Custom duty rates by product categories
We used the database of CBSA custom duties and rates from the cross-border duty calculator to get an estimate of average rates for each product category without any preferential treatment.62 In order to reflect the fact that some items from some countries enter Canada on a duty free basis, we pro-rated these rates to reconcile with the overall rate, as per Step 1, of 5.1%.
Step 3: Price Difference for each product category
Based on the above, we calculated the sales tax and duty for each product category. We removed the sales tax rate of 12.2% and/or the respective duty rates of product categories on the US product price. The price differences were, thus, calculated from the gap between Canadian price and these new prices without taxes and/or duties.
Likely Loss in Retail Sales We estimate the likely loss in retail sales by assuming that Canadian e-tail will move to US e-tail levels, where level refers to the share of e-tail in total retail sales. We make this assumption because the estimated price gaps are significant enough to induce Canadian in-store consumers to purchase US imported goods. On the supply side, US e-tail providers will aggressively pursue this market opportunity in Canada. Our assumption implies that retail losses in Canada will include (i) All existing e-tail sales in Canada (ii) Incremental e-tail sales in Canada as in-store consumers switch to purchasing US imported products via e-tail.
The aggregate e-tail forecasts for Canada were disaggregated into retail sub-sectors using the existing share of these retail sub-sectors in e-tail sales of Canada. These estimates comprise sales for ten product categories that are considered to ‘at-risk’ (i.e. vulnerable to e-tail import).
At US$800 threshold, practically all the product prices in the ten product categories considered of being at risk are deemed to be below this level. At the US$200 threshold, a proportion of product items in our samples are found to be above this level. We use a simple average proportion of product prices above US$200 to scale down sales loss at this threshold. Although we are estimating sales numbers, we use simple average proportions instead of weighted average proportion as at higher prices, quantity sold is lower so aggregate impact on sales of price variation is assumed to be constant. In effect, we make the implicit assumption that the average price elasticity of demand is unity across items within each product category.
The weighted average price differential for products at risk where sales tax and duty are exempt is 25%. With duties only exemption, the price difference declines to 15%, which suggests that the incentive to switch to online will be lower. Due to insufficient detailed data, we used professional judgment regarding the percentage of switch from Canadian e-tail level to US e-tail level (e.g. 0% means no switch while 100% means full switch). In doing so, we were guided by our analysis of e-tail trends for each product category. To this end, we reviewed each product category for its nature and price gap, supplemented by information gathered from our in-house retail subject matter specialists and interviews with retailers. Using the weighted-average share of this switch across the ten product categories identified at risk, we estimated that the loss in retail sales will likely be between 25% and 50% of the loss anticipated when duty and taxes are eliminated under a US$200 DMT. For the purpose of this ‘Assessment’, in relation to the scenario of DMT US$200 with duties only exemption, we have selected the mid-point at 37.5%.63
62 https://www.crossbordershopping.ca/calculators/canadian-duty-calculator 63 We note that, on average, the share of duty rate of ‘At Risk’ products is 28.5% of the combined tax and duty rate. In addition, as indicated in this report, there are other costs and perception-related barriers arising from duties on cross-border shipments.

55
It is important to note that custom duties are perceived to be a significant barrier to cross-border e-commerce of small consignments by both suppliers and consumers. E-traders are often sensitive to the costs incurred as a result of customs procedures and state that custom procedures have contributed to their decisions not to enter foreign markets. Thus, elimination of duties is also a removal of a barrier for cross-border e-tail purchases of small value items that would further contribute to the acceleration of e-tail purchases.64
Government Revenues Foregone
The net government revenue foregone has been estimated from the impact of likely losses in retail sales (likely increase in US imports) and likely increase in consumer disposable income.
Reduction in retail sales
We have considered five components to estimate government revenue foregone from a reduction in retail sales. The methodology used to estimate each of these components is described below. In conducting our estimate, we considered that the loss of sales, as estimated in our Assessment reflects a loss of sales that are currently taking place in Canada through Canadian e-tail and Canadian brick and mortar65. Thus, the loss of duty was based landed cost in Canada of those sales, while the loss of sales tax was based on retail level prices. It was further assumed that the compliance rate of sales tax and duty collection for sales through Canadian channels is 100%.
1. Sales Tax Loss (Direct and Indirect): The retail sales weighted average provincial sales tax rates (including the Federal GST) was applied to the estimates of retail sales loss. It is important to note that this calculation captures sales tax on value added across the value chain, as the weighted tax rate was applied on the value of final sales and not retail sector margins.
2. Custom Duties Loss (Direct): Custom duties were applied on the amount paid to the foreign vendor i.e. landed cost. In the supply chain, wholesalers procure goods from vendors and sell it to retailers at a margin. Retailers, in turn, sell it to final consumer at a margin. We calculated custom duties loss from retail sales loss through a three-step process:
(i) We disaggregated loss estimate of retail sales by retail sub-sectors. For each retail sub-sector, we used respective gross margins (obtained from Statistics Canada CANSIM 080-0030) to calculate cost of goods sold by retailers.
(ii) Using the cost of good sold by retailers, we arrived at the amount paid by wholesalers to vendors. To this end, we used as a proxy the margins of wholesalers in personal and household goods. We note from Statistics Canada that wholesalers in this subsector import a large share of the goods that they redistribute.66 Using this wholesale subsector’s margins, we derive landed cost of goods imported through vendors.
(iii) We used this landed cost to estimate custom duties loss. For each retail sub-sector, we had the composition of sales by product categories within that sub-sector. We applied the average custom duty rates for the ten product categories to the estimated landed cost for each product category to arrive at custom duties loss for each retail sub-sector. We then aggregated the sub-sectors custom duties losses to calculate retail sector custom duties loss.
64 Kommerskollegium Sweden National Broad of Trade (2012), E-commerce – New Opportunities, New Barriers, A survey of e-commerce barriers in countries outside the EU 65 We also assumed that all these sales are imported into Canada. This creates a slight overstatement in our estimation of duty loss, as a small portion of the at risk product categories is produced in Canada. 66 http://www.statcan.gc.ca/daily-quotidien/151127/dq151127c-eng.pdf

56
We did not capture in our calculations any indirect loss on custom duties (i.e. duties on upstream activities within Canada).
3. Corporate Tax Loss (Direct and Indirect): For direct corporate tax loss, the average share of profits in retail sales during 2012-16 was calculated. This rate was applied to the sales loss, resulting in an estimate of profit loss in the retail sector. The average of tax to profit for the retail sector during 2012-16 was calculated. This rate was used to estimate the loss in tax revenue from the loss in profits. For indirect corporate income tax loss, the estimated indirect GDP impact for each of the three scenarios and years considered was multiplied by the ratio of corporate income tax collected by federal and provincial governments in Canada in 2016 to the value of Canada’s gross domestic product in 2016. Data on corporate income tax collected was extracted from Statistics Canada’s CANSIM Table 384-0047 “Revenue, expenditure and budgetary balance” and includes “Taxes on incomes – From corporations and government business enterprises, liabilities” in 2016. The gross domestic product data in 2016 was collected from Statistics Canada’s CANSIM Table 384-0038. The estimated ratio of corporate income tax collected to GDP was 4.3%.
4. Personal Income Tax Loss (Direct and Indirect): The losses in retail sales leads to a loss in employment and labour income. This results in a loss of personal income tax for the government. The ratio of estimated annual loss in labour income and estimated annual loss of employment has been used to estimate average annual income per employee lost. The current personal income tax rate for the average annual labour income lost has been used to arrive at the estimate for personal income tax loss. The same methodology was used to estimate both direct and indirect loss.
5. Tax Loss due to induced impact: Induced impact is the loss of economic activity resulting from loss of
labour income. To calculate the loss of taxes resulting from this reduction in economic activity, we
multiplied the 2016 total tax to GDP ratio by the GDP lost due to the induced impact. Data on all taxes
collected was extracted from Statistics Canada’s CANSIM Table 384-0047 “Revenue, expenditure and
budgetary balance” and includes “Taxes on incomes”, “Taxes on production and imports” and “Other
current transfers from households” in 2016. The gross domestic product data in 2016 was collected from
Statistics Canada’s CANSIM Table 384-0038. The estimated ratio of all taxes collected to GDP was 35.9%.
Other taxes: We have not considered the loss of other taxes, for example municipal taxes that would be lost from the decline of bricks and mortar retail sales or the reorientation of e-tail and warehousing investments outside Canada. We note that these losses may be significant given municipal governments’ heavy reliance upon commercial property taxes and charges, which may result in higher taxes on residential properties, offsetting some of the above-estimated savings to consumers.
Increase in consumer disposable income
Due to lower prices of US imported goods and the avoidance of sales taxes and duties, consumer disposable income will increase economic activity and induce increases in tax collection. To this end, we used the same methodology described in point (5) above.
Our estimate of government revenue foregone from decline in retail sales was therefore adjusted upward to reflect this effect.

57
Appendix 2: Processing Costs Incurred by the Private Sector
In order to understand the costs to the private sector, we need to understand the foreign shipment process handled by private sector. With DMT rise, the process of foreign shipment will simplify as taxes and duties would not be collected on shipments up to the value of US$800 or US$200. The savings will emerge from the costs that were previously incurred to collect these taxes and duties. In general, the CBSA works with importers and custom brokers in order to process imports. In relation to consumer e-tail, the importer is the individual consumer who purchases a product from a foreign website. The import in this case is done through two channels: (i) Postal services managed by Canada Post (ii) Courier services managed by various courier companies. As discussed later, courier companies effectively took over all activities related to collecting tax and duties, while the CBSA is responsible for that when the e-tail is done through Canada Post. As per data from the CBSA, out of total shipments of 54.4 million in the first half of 2016, postal services comprised 35.5 million or 65.3%. In the first half of 2017, postal shipments increased to 39.4 million (a growth rate of 11%) while Courier shipments increased from 18.9 million to 20.0 million (a growth rate of 6%).
Couriers Couriers act as custom brokers and are approved by the CBSA to report, release and account for casual goods on behalf of the importer and pay duties and/or taxes. All the imports applicable for DMT are conducted through Courier Low Value Shipment (CLVS) Program. The CLVS provides express/expedited clearance of express shipments for goods values below C$2,500. It streamlines the reporting, release and accounting procedures for couriers authorized by the CBSA. The authorized courier companies need to demonstrate high-degree of control on foreign shipment process through security, logistics, tracking technology and integrated administrative control. Participating couriers present accounts on a monthly consolidated basis – by importer, courier, port of entry, country of origin, value, taxes and/or duties owed. Refund for personal use imports can be claimed through the Casual Refund Program if duties/taxes have been overpaid or paid in error. If the goods are delivered by courier, the following steps are reported at CBSA’s website:67
(i) The sender provides courier with value, country of origin and detailed description of goods. (ii) Eligible shipments are processed through the Courier Low Value Shipment (CLVS) Program. The import
operations department in courier companies uses electronic processing systems that has catalogs to determine taxes and duties payable and other details required by CBSA.
(iii) CBSA officers review each shipment. The goods are examined on a sample basis to confirm the declaration of the goods and their eligibility to enter Canada.
(iv) If the shipment complies with all import regulations, it is released to the courier for delivery. DHL reports that “under normal circumstances, the CLVS program has an informal clearance process. Shipments are released upon arrival unless customs requests additional information or physical inspection.”
(v) When the customer (importer) signs the courier delivery receipt and takes possession of the goods, they accept that the courier will account for the goods with the CBSA.
(vi) Couriers charge a service fee for: (i) Preparing the necessary customs report and accounting paperwork (ii) Collecting duties and/or taxes owed (iii) Remitting these amounts to CBSA.
(vii) Alternatively, for courier shipments, there is an option for customers/importers to pay taxes and/or duties themselves. In this case, the accounting service fees is not charged by the courier. In this option, importer need to visit the CBSA office accounting services for the public, provide details about the shipment, and pay duties and/or taxes. After which, the courier will deliver the shipment.
67 http://www.cbsa-asfc.gc.ca/import/courier/lvs-efv/prsn-eng.html

58
Cost Savings for Couriers if DMT Increases We conducted interviews with courier companies to understand the savings they expect from an increase in tax and duty exemption on cross-border shipment. From these interviews, we understand that to process any shipment, they need to determine its value to categorize it as ‘High-Value Shipment’ or ‘Low-Value Shipment’. They also need to record other details like type of imported good, country of origin, for other clearance and inspection processes. We further understand that courier shipments are processed through e-processing systems and smart technology that has catalogs to automatically determine duties payable based on value of the shipment and other details. Given the high level of process automation, we understand that courier companies do not foresee significant cost savings from not having to collect taxes and duties on products for which they currently collect tax and duties. On the basis of the above, our analysis does not incorporate any cost savings to e-tail consumers as a result of lower costs to courier companies. However, we do note that it is likely that as a result of the higher volume of shipments, resulting from a higher DMT, that courier companies may benefit from economies of scale. The data to make such estimate is not available to us and as such is not reflected in our calculations of the Canada US price gap.
Post Through postal services, the cost of handling foreign shipments is relatively low. Canada Post charges handling fees of $9.95 on all dutiable or taxable mail and has arrangements with postal services in other countries such as the United States Postal Service for clearing packages. For shipments valued below the DMT threshold, there is no cost. It follows the following process:
(i) The sender completes a customs declaration form when mailing shipment from abroad (ii) The CBSA inspects each piece of mail of Canada Post to determine its admissibility and taxes and/or
duties owed. (iii) Admissible mail is released to Canada Post for delivery and collection of taxes and/or duty. (iv) The owed tax and duty is indicated on ‘Form E14 CBSA Postal Import Form’ attached to the delivered
mail. Cost Savings for Postal Service if DMT Increases We understand that in the case of postal services, the cost of assessing applicable taxes and duties is borne by the CBSA and not by Canada Post. The handling fees of $9.95 charged by Canada Post does not reflect the cost of assessing taxes and duties. Thus, we are not expecting any material cost savings for Canada Post. The decision to not charge handling fee for shipments below DMT is a prerogative of Canada Post. If DMT is raised, the decision to waive off handling fee will be based on revenue and cost considerations. In this regard, it is our understanding that the handling costs charged by Canada Post would not be waived if the DMT rises.

59
References
Anthem Marketing Solutions. (2015). Deal Seeking: Online vs. In-Store. Chicago.
Australian Government, Federal Register of Legislations, Treasury Laws Amendment (GST Low Value Goods) Act 2017, No. 77 (C2017A00077), 2017, https://www.legislation.gov.au/Details/C2017A00077
Australian Government Productivity Commission (2011), ‘Economic Structure and Performance of the Australian Retail Industry’ Productivity Commission Inquiry Report, No. 56, 4 November 2011
Brynjolfsson, E., & Smith, M. (2000). Frictionless Commerce? A comparison of Internet and conventional retailers. Management Science, 46(4), 563-585. Bruce D., Fox W.F., Stokely W.B., Luna L. (2009), State and Local Government Sales Tax Revenue Losses from Electronic Commerce, University of Tennessee, April 13, 2009
C.D. Howe (2016) , McDaniel C., Schropp S., Latipov O., Rights of Passage: The Economic Effects of Raising the de minimis Threshold in Canada, Trade and International Policy, June 2016
CSCA Daniel C. & Hernandez T. (2016), CSCA Retail 100, Centre for the Study of Commercial Activity, Ted Rogers School of Management, Ryerson University
Copenhagen Economics (2017), E-Commerce Imports into Canada: Sales tax and customs treatment, March 2017
European Commission Press Release Database – Factsheet, Modernising VAT for e-commerce: Questions and Answers, Brussels, 1 December 2016: http://europa.eu/rapid/press-release_MEMO-16-3746_en.htm
Forrester (2016), Peter Sheldon, The State of Canadian Online Retail – 2013, April 24 2013
Forrester (2014), Peter Sheldon, Canadian Online Retail Forecase 2014 to 2019, October 14 2014
GfK (2016), Channel Collision: drivers of online and in-store shopping are not as sharply divided as you think, Press release, May 05 2016
Holloway S. & Rae J. (2012), De minimis thresholds in APEC, World Customs Journal, Volume 6, Number 1, World Customs Organization, March 2012
IBIS World (2017), Increased M&A will propel the Retail Sector Forward, Hurley M. and Hadad J., July 2017
Kommerskollegium Sweden National Broad of Trade (2012), E-commerce – New Opportunities, New Barriers, A survey of e-commerce barriers in countries outside the EU: https://www.wto.org/english/tratop_e/serv_e/wkshop_june13_e/ecom_national_board_e.pdf
Lapitov O., McDaniel C., Schropp S. (2017), Modeling the Economic Effects of Raising the De Minimis Threshold in Canada, Technical Paper E-Brief, Essential Policy Intelligence
MarketLine Industry Profile (2016), Online Retail in Canada, October 2016

60
New Zealand Customs Service 2011, Issues paper: review of de minimis, February, New Zealand Customs Service, Wellington, NZ.
Png, I., Lee, T. S., & Yan, C. (2000). The competitiveness of on-line vis-a-vis conventional retailing. National University of Singapore, Singapore. PwC Holiday Outlook Survey 2017 – Canada Consumer, Toronto, August 2017
PwC Strategy& (2017), 2017 Retail Industry Trends: Showrooms, consumer experience, and compelling economic
PwC Total Retail Global Survey (2016) ‘They say they want a revolution’, PwC Global Retail and Consumer Practice and PwC Research to Insight, February 2016
Scotiabank, NAFTA: Raising Canada’s Duty-Free Threshold on E-Commerce, Global Economics, Insights and views, August 25, 2017 Sprint Reports 2017 of the Auditor General of Canada, Report 2 – Custom Duties, Reports to Parliament, Reports and Petitions http://www.oag-bvg.gc.ca/internet/English/att__e_42257.html
The Canada-USA Price Gap, Report of the Standing Senate Committee on National Finance, Senate Canada, February 2013
Treasury Board Canada (2017), 2017-18 Estimates: Part I and II: The Government Expenditure Plan and Main Estimates, Publications Canada
Toshihiko Osawa, ‘WCO’s initiatives on E-Commerce”, World Customs Organization
World Bank (2017), Doing Business 2017 Equal Opportunity for All, 14th Edition
World Bank (2016), Connecting to Compete: Trade Logistics in the Global Economy: The Logistics Performance Index and Its Indicators, Washington D.C.
World Economic Forum (2017), The Global Competitiveness Report 2017-18 – Insight Report,
World Trade Organization, New Zealand Trade Policies and Practices by measure, WT/TPR/S/216
W. Steel (2016), A proposed pathway towards future reform of New Zealand’s de minimis threshold, New Zealand Institute for the Study of Competition and Regulation
W. Steel (2013), E-commerce and its effect upon the retail industry and government revenue, New Zealand Institute for the Study of Competition and Regulation